LUCID La nd- U se and C limate: ID entification of robust impacts
Upload
harold-sheltonCategory
view
214download
0
NORTHERN INSTITUTE OF APPLIED CLIMATE SCIENCE
FOREST RESPONSE
TO CLIMATE CHANGE

• Climate change overview– Observations– Mechanisms
• Uncertainty– Scenarios and models– Perspective– Uncertainty in predictions
• Climate change and forests– Benefits to forests– Increases in forest stress– Potential impacts
Outline

Global climate is changing Intergovernmental Panel on Climate Change (2007)
Evidence for climate change is “unequivocal” It is “extremely likely” that humans are major contributors Future changes depend partly on human actions
NASA Goddard Institute for Space Studies (2011) 2001-2010 warmest decade on record
World Meteorological Organization (2012) 2002-2011 decade tied for warmest on record
National Research Council, National Academy of Sciences (2011) Risks of continuing “business as usual” are greater than the
risks associated with strong efforts to limit and adapt to climate change.
Climate Change …overview

IPCC 2007
The average global surface temperature has risen 1.4 ºF over the past 100 years
Climate Change …warming trend

NASA GISS; NASA Earth Observatory, Robert Simmon
Recent years - La Niña, lower solar activity, and sulfate aerosols have reduced the rate of warming in surface air…
Climate Change …warming trend

Levitus et al. 2012
…but not in oceans – which account for ~93% of earth system warming since 1955.
Climate Change …warming trend

Figure 3.10 IPCC 2007
Climate Change …global temp
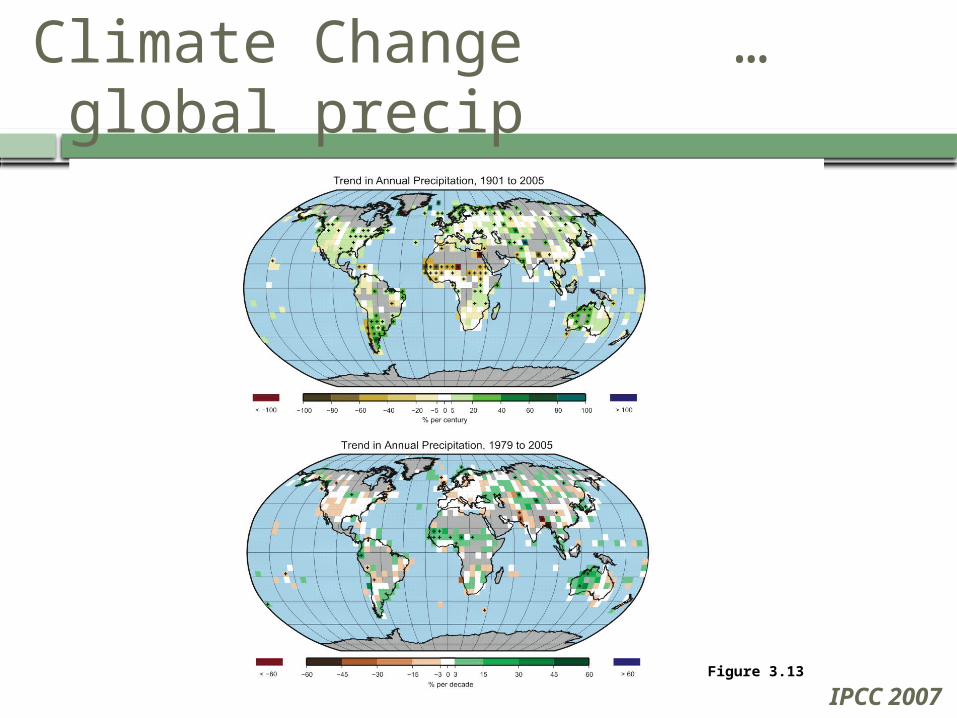
Figure 3.13
IPCC 2007
Climate Change …global precip

The most recent 12-month period in the USA was the warmest in the past 117 years.
Climate Change …warming trend

Climate Change …NE MN temp
Winter (Dec-Feb)
Fall (Sep-Nov)
Summer (Jun-Aug)
Spring (Mar-May)
Change in Average Temperature, 1901-2000 Change (F)
8
6
4
2
0
-2
-4
-6
-8
www.climatewizard.org

Climate Change …NE MN precip
Change in Average Precipitation, 1901-2000Change (in.)
4
3
2
1
0
-1
-2
-3
-4
www.climatewizard.org
Winter (Dec-Feb)
Fall (Sep-Nov)
Summer (Jun-Aug)
Spring (Mar-May)

FAQ 1.3, Figure 1
Climate Change …greenhouse effect
IPCC 2007

-0.4 °F
Average Surface
Temperature
Temperature without
greenhouse effect
+57 °FOthers ~15%
CO2 9-26%
H2O 36-66%
Kiehl and Trenberth 1997, realclimate.org (G. Schmidt, NASA)
Climate Change …greenhouse effect

http://www.brighton73.freeserve.co.uk/gw/paleo/400000yrfig.htm; see also: Hansen et al. 1990, Petit et al. 1999, Shackleton 2000, Ruddiman 2006, Shakun et al. 2012
Climate Change …greenhouse effect

Uncertainty
Public uncertainty
Scientific uncertainty
• “Not sure if I believe in climate change.”• “Scientists are a bunch of pinheads, anyway.”
• “The mean of all the 8 year trends is close to the long term trend (0.19ºC/decade), but the standard deviation is almost as large (0.17ºC/decade), implying that a trend would have to be either >0.5ºC/decade or much more negative (< -0.2ºC/decade) for it to obviously fall outside the distribution. Thus comparing short trends has very little power to distinguish between alternate expectations.”

Uncertainty
Public uncertainty
Scientific uncertainty
• “Not sure if I believe in climate change.”• “Scientists are a bunch of pinheads, anyway.”
• Current change: “unequivocal”• Future change:
Earthwide simulations include physics, chemistry, biology, randomness, feedbacks.
Unknown system inputs (scenarios).

Uncertainty …emissions
IPCC 2007

Uncertainty …feedbacks
IPCC 2007

Uncertainty in simulations of future climate:
Least Projected Change
Most Projected Change
CSIROLow emissions (B1)
Uncertainty …simulations
Model with less warming sensitivity to greenhouse gasesFewer emissions

www.ClimateWizard.org
Uncertainty …simulations
Change (F)
10
7.5
5.0
2.5
0
-2.5
-5
-7.5
-10
CSIRO Low Emissions (B1), 2070-2099 compared to 1961-1990 base
Change (in.)
4
3
2
1
0
-1
-2
-3
-4
Summer Temp Summer Precip
Winter Temp Winter Precip

Uncertainty in simulations of future climate:
Least Projected Change
Most Projected Change
MIROCHigh emissions (A2)
Model with more warming sensitivity to greenhouse gasesHigher emissions
Uncertainty …simulations
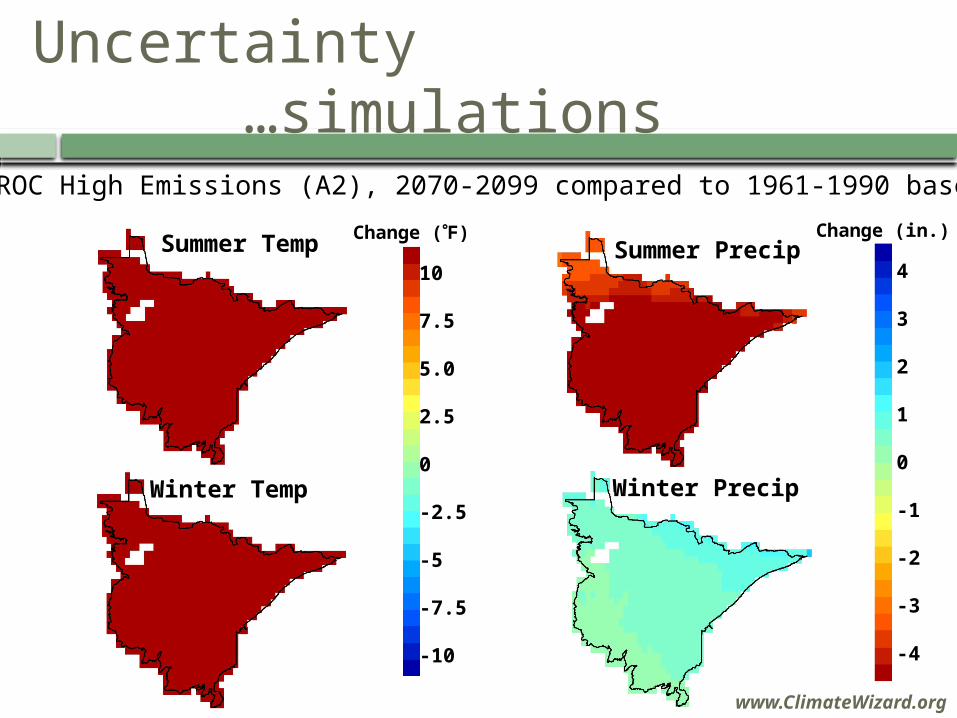
www.ClimateWizard.org
Uncertainty …simulations
Change (F)
MIROC High Emissions (A2), 2070-2099 compared to 1961-1990 base
Change (in.)
4
3
2
1
0
-1
-2
-3
-4
Summer Temp Summer Precip
Winter Temp Winter Precip
10
7.5
5.0
2.5
0
-2.5
-5
-7.5
-10

www.ClimateWizard.org
Uncertainty …simulations
Change (F)
Low Scenario
Summer Temp
Winter Temp
High Scenario
10
7.5
5.0
2.5
0
-2.5
-5
-7.5
-10
Change (F)Summer Temp
Winter Temp
10
7.5
5.0
2.5
0
-2.5
-5
-7.5
-10

It’s not all bad….
Benefits
Longer growing seasons
McCarty 2001
Benefits

Longer growing seasons Evidence of phenological shifts
Meta-analysis677 species (>400 plant spp.)87% shifted in direction expected by
climate change
Parmesan and Yohe 2003
Benefits

Longer growing seasons Increased precipitation in some
regions
IPCC 2007
Benefits
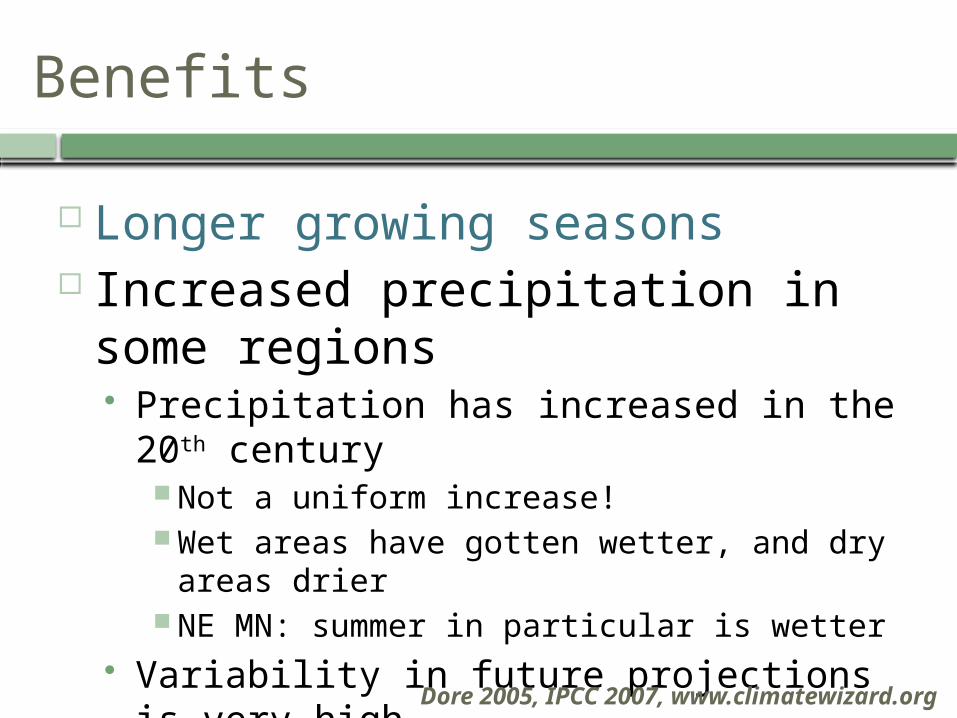
Longer growing seasons Increased precipitation in some
regions Precipitation has increased in the 20th
century Not a uniform increase! Wet areas have gotten wetter, and dry areas
drier NE MN: summer in particular is wetter
Variability in future projections is very high
Dore 2005, IPCC 2007, www.climatewizard.org
Benefits

Longer growing seasons Increased precipitation in some
regions CO2 fertilization
Benefits

Increased photosynthesis More CO2 in stomatal cavity Greater RuBisCO activity
Reduced stomatal conductance Increase in water use
efficiency Potential increases in NPP Greater biomass (trees:
28%) Potential increases in soil
inputs
CO2 fertilization:
Ainsworth and Long 2005, Jones et al. 2005, Norby et al. 2005, Ainsworth and Rogers 2007
Benefits

Longer growing seasons Increased precipitation in some
regions CO2 fertilization Increased foraging and voltinism
Benefits

Longer growing seasons Increased precipitation in some
regions CO2 fertilization Increased foraging and voltinism
Minimum temperatures increasing 2x rate of maximum
Affecting broad suite of organisms Positive affects on species such as Karner
Blue Butterfly
Benefits
Haack 1993, Swengel and Swengel 1998, Walther et al. 2002, Altermatt 2010

Longer growing seasons Increased precipitation in some
regions CO2 fertilization Increased foraging and voltinism
Benefits

Increased stresses
…but not all good.

Acclimation to CO2 fertilization
Increased stresses
Varies by species and site Nutrient deficiencies (especially N) Limited sink strength Sensitive to ozone pollution (+/-) Evidence increased NPP and biomass, but
limited evidence of long-term sequestration Old trees Wood growth and soil carbon - varies
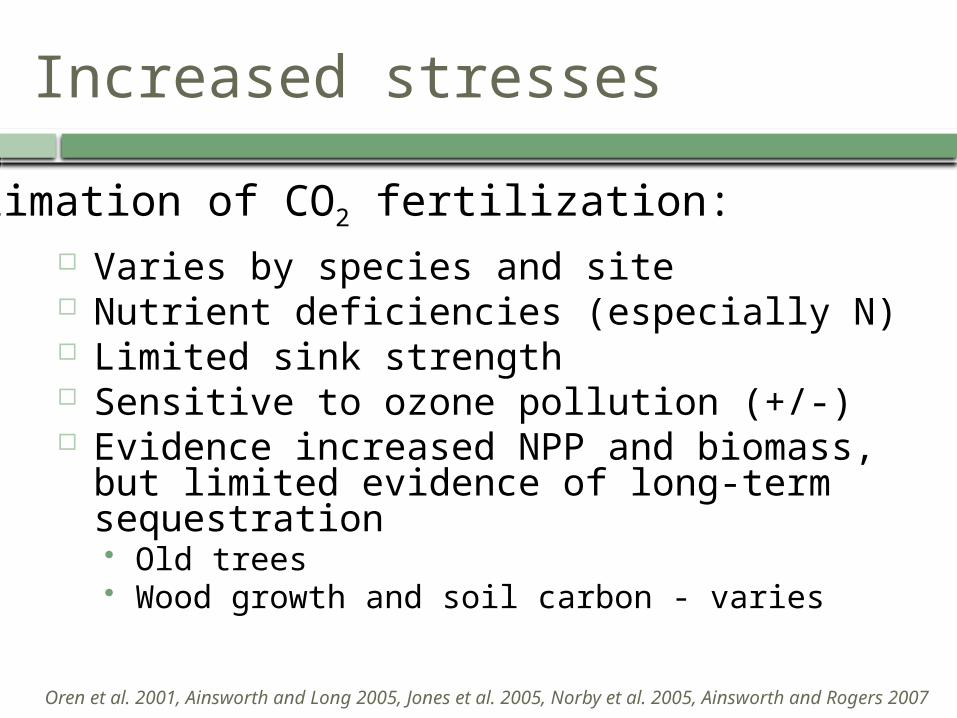
Acclimation of CO2 fertilization:
Oren et al. 2001, Ainsworth and Long 2005, Jones et al. 2005, Norby et al. 2005, Ainsworth and Rogers 2007
Increased stresses

Varies by species and site Nutrient deficiencies (especially N) Limited sink strength Sensitive to ozone pollution (+/-) Evidence increased NPP and biomass, but
limited evidence of long-term sequestration Old trees Wood growth and soil carbon - varies
Acclimation of CO2 fertilization:
The fertilization effect may be transitory – photosynthesis may not stay elevated, ecosystem carbon may not increase.Oren et al. 2001, Ainsworth and Long 2005, Jones et al. 2005, Norby et al. 2005, Ainsworth and Rogers 2007
Increased stresses
Acclimation to CO2 fertilization Extreme weather events
Increased stresses
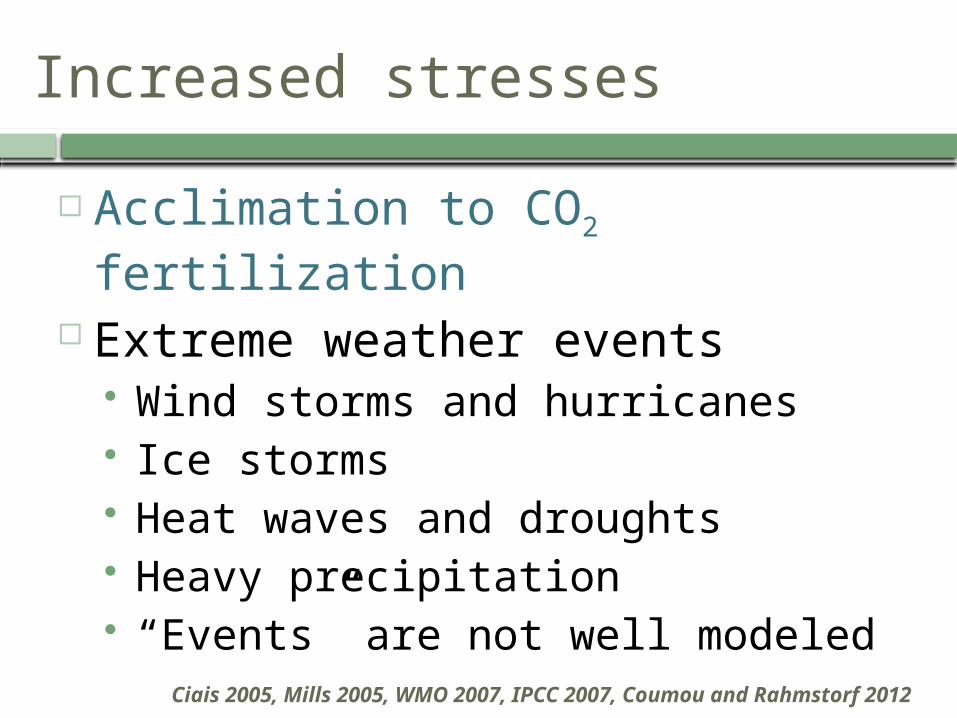
Acclimation to CO2 fertilization Extreme weather events
Wind storms and hurricanes Ice storms Heat waves and droughts Heavy precipitation “Events” are not well modeled
Ciais 2005, Mills 2005, WMO 2007, IPCC 2007, Coumou and Rahmstorf 2012
Increased stresses

Acclimation to CO2 fertilization Extreme weather events Longer growing seasons
IPCC 2007
Increased stresses

Acclimation to CO2 fertilization Extreme weather events Longer growing seasons
Altered timing of aquifer recharge Potential declines in summer seasonal stream
flow Potential increases in flashiness and episodic
high flows Increased water stress in late summer Phenological shifts and asynchrony
Increased stresses
Dale et al. 2001, Huntington 2004, Parmesan 2006, Cherkauer and Sinha 2010

Acclimation to CO2 fertilization Extreme weather events Longer growing seasons Expanded pest and disease
ranges
Increased stresses
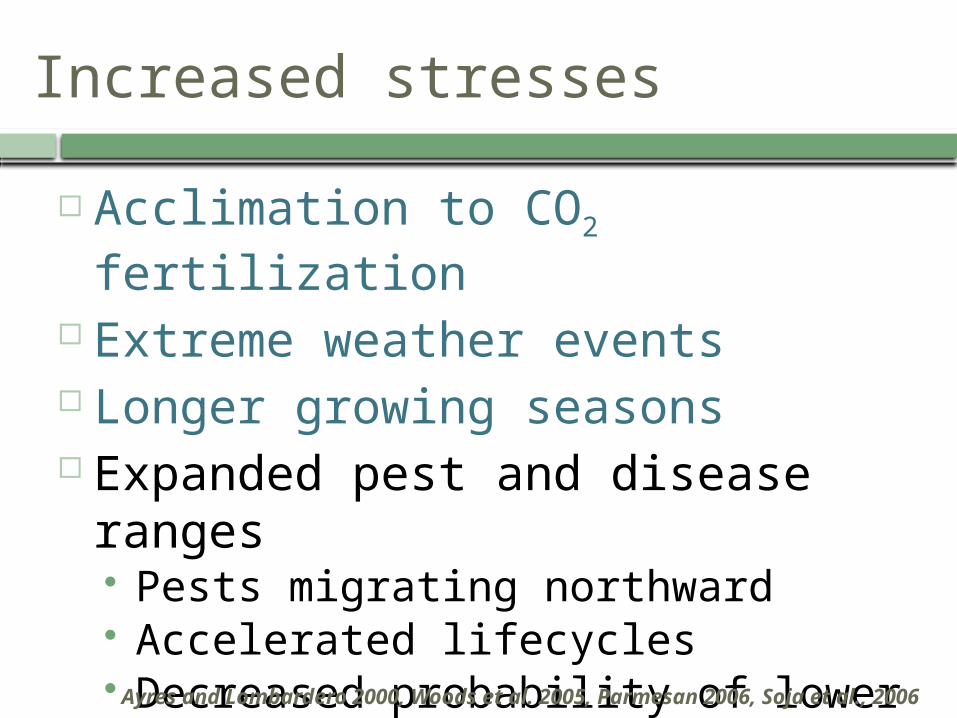
Acclimation to CO2 fertilization Extreme weather events Longer growing seasons Expanded pest and disease
ranges Pests migrating northward Accelerated lifecycles Decreased probability of lower
lethal temperaturesAyres and Lombardero 2000, Woods et al. 2005, Parmesan 2006, Soja et al., 2006
Increased stresses

Acclimation to CO2 fertilization Extreme weather events Longer growing seasons Expanded pest and disease ranges Decreased snow pack and early
thaw
Increased stresses

Acclimation to CO2 fertilization Extreme weather events Longer growing seasons Expanded pest and disease
ranges Decreased snow pack and early
thaw Early bud break and loss of cold
hardening Frost damage during spring freezing Less insulation to cold snaps
Ayres and Lombardero 2000, Hennon et al. 2006
Increased stresses

Acclimation to CO2 fertilization Extreme weather events Longer growing seasons Expanded pest and disease ranges Decreased snow pack and early thaw Increased frequency and intensity of
fire
Increased stresses

Less moisture – more fires (not a new idea or observation)
Increased stresses

Less moisture – more fires (not a new idea or observation)
Increased stresses

Acclimation to CO2 fertilization Extreme weather events Longer growing seasons Expanded pest and disease
ranges Decreased snow pack and early
thaw Increased frequency and intensity
of fire Species range shifts
Increased stresses
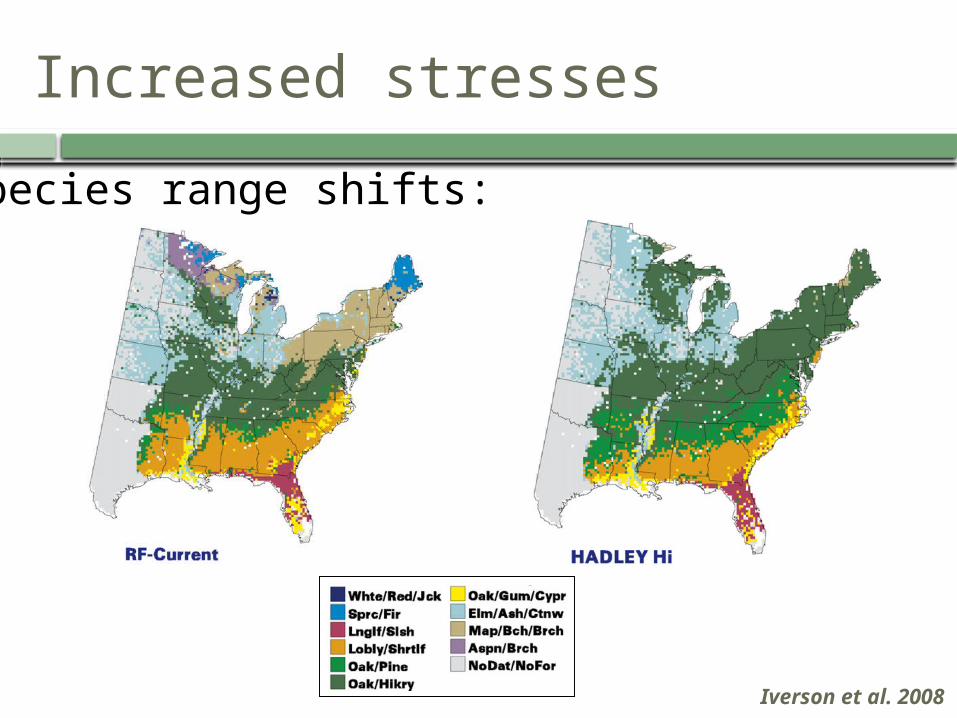
Increased stresses
Species range shifts:
Iverson et al. 2008

Range shifts ≠ instant catastrophic dieback Mature trees should fare better
Developed root systems Greater carbohydrate reserves
Stress factors will increase in severity Temperature Moisture Competition
Increased susceptibility to disturbance
Dale et al. 2001, Iverson et al. 2008
Species range shifts:
Increased stresses

Acclimation to CO2 fertilization Extreme weather events Longer growing seasons Expanded pest and disease
ranges Decreased snow pack and early
thaw Increased frequency and intensity
of fire Species range shifts
Interactions between these limits are highly likely.
Increased stresses

Summary
Climate change: overwhelming evidence, multiple sources, old news. Embrace uncertainty!
Climate change and forests: the same old stresses, but new patterns and agents. Same job – new challenges!
No shiny new tool. Your skills and experience are the best tools!
Thank you!


Discussion Question
What considerations does climate change add or alter for the forest sector in northeastern MN?

http://www.globalwarmingart.comMECHANISMS
Climate Change
…greenhouse effect
• More absorption and scattering for outgoing energy
• Water vapor is important
• CO2 absorbs only outgoing energy
• Impact of CO2 greatest in situations with less water vapor (dry, cold)

Source: Wikimedia Commons and Petit et al., 1999
Climate Change …greenhouse effect

Climate data courtesy of R. Neilson and MAPSS Vegetation Modeling Lab
Uncertainty …simulations

Climate data courtesy of R. Neilson and MAPSS Vegetation Modeling Lab
Uncertainty …simulations

Climate data courtesy of R. Neilson and MAPSS Vegetation Modeling Lab
Uncertainty …simulations

Climate Change …MN temp
Minnesota Average Annual Temperature (North vs. South)

Increased frequency and intensity of wildfire:
SAF 2008
Increased stresses

Suitable habitat projections
Iverson et al. - draft results
(Losers 15)
Extirpated Large Decrease. Small Decrease
Small Increase
(Gainers 29)
Large Increase
(New Migrants 31)New (Low & High)New (High Only)
(Same 3)No Change