N M DEPARTMENT OF TRANSPORTATION RESEARCH...
47
0 NEW MEXICO DEPARTMENT OF TRANSPORTATION R RESEARCH B BUREAU Innovation in Transportation Public Private Partnerships: Evaluating ESALs and Weigh-In-Motion Data for US 550 in Northern New Mexico Roadlife-Altris Vehicle Classification System Prepared by: Research Bureau New Mexico Department of Transportation 7500B Pan American Freeway NE Albuquerque, NM 87109 August 2007 Prepared for: New Mexico Department of Transportation In Cooperation with: The US Department of Transportation Project NM07SP-01 AUGUST, 2007
Transcript of N M DEPARTMENT OF TRANSPORTATION RESEARCH...

0
NEW MEXICO DEPARTMENT OF TRANSPORTATION
RREESSEEAARRCCHH BBUURREEAAUU
Innovation in Transportation Public Private Partnerships: Evaluating ESALs and Weigh-In-Motion Data for US 550 in Northern New Mexico Roadlife-Altris Vehicle Classification System Prepared by: Research Bureau New Mexico Department of Transportation 7500B Pan American Freeway NE Albuquerque, NM 87109 August 2007 Prepared for: New Mexico Department of Transportation In Cooperation with: The US Department of Transportation
Project NM07SP-01
AUGUST, 2007

1. Report No. NM07SP-01
2. Government Accession No.
3. Recipient’s Catalog No
5. Report Date August 2007
4. Title and Subtitle Public Private Partnerships: Evaluating ESALs and Weigh-In-Motion Data for US 550 in Northern New Mexico RoadLife – Altris Vehicle Classification System.
6. Performing Organization Code
7. Author(s) Scott McClure, P.E.
8. Performing Organization Report No. 10. Work Unit No. (TRAIS)
9. Performing Organization Name and Address Research Bureau New Mexico Department of Transportation 7500-B Pan American Freeway N.E. P.O. Box 94690 Albuquerque, NM 87199-4690
11. Contract or Grant No.
13. Type of Report and Period Covered Final
12. Sponsoring Agency Name and Address New Mexico Department of Transportation
14. Sponsoring Agency Code 15. Supplementary Notes 16. Abstract Public-private partnerships as an alternative means of delivering goods and services are receiving increased attention as state departments of transportation consider ways to maximize limited resources. In 1998 the New Mexico Department of Transportation (formerly New Mexico State Highway and Transportation Department) entered into an innovative partnership with a private consultant to design and manage the reconstruction of a major highway, and the numerous innovations of the agreement included a first-of-its-kind long term performance warranty. The innovations used on this project, primarily regarding features of the public-private partnership between the parties, make this project one of national interest and significance. This paper provides an examination into one aspect of the performance warranty: administration and management of the procedures used to ensure accurate monitoring of ESALs, which is one of three factors used in determining expiration of the warranty. Accurate, reliable collection and processing of weigh-in-motion data is of paramount importance, as early termination of the warranty due to accumulation of ESALs has significant financial implications for the NMDOT. The paper describes a custom computer application developed specifically to calculate ESALs according to unique contractual requirements, and discusses other uses of weigh-in-motion data for performing long-term research into the benefits of this public-private partnership. 17. Key Words
public-private partnerships, warranties, performance warranties, ESALs, weigh-in-motion, WIM, US550, NM44, software, Altris, vehicle classification
18. Distribution Statement Available from NMDOT Research Bureau
19. Security Classi. (of this report) None
20. Security Classif. (of this page) None
21. No. of Pages 40
22. Price

Public Private Partnerships: Evaluating ESALS and Weigh-in-Motion Data for
US 550 in Northern New Mexico
RoadLIFE – ALTRIS Vehicle Classification System
Prepared by
Scott McClure, P.E. Research Bureau Chief
NMDOT Research Bureau
Prepared for: NMDOT Maintenance Bureau Warranty Compliance Program
Project Number: NM07SP-01
A Report on Research Sponsored By
New Mexico Department of Transportation, Research Bureau
In Cooperation With The U.S. Department of Transportation, Federal Highway Administration
April 2007
NMDOT Research Bureau
7500-B Pan American Freeway Albuquerque, NM 87109
© 2007 New Mexico Department of Transportation
PREFACE
This report provides an overview of the innovative US550 reconstruction project, details of WIM data files, calculation of ESALs both through interpolation of chart values and the ESAL equation, and a description of the ALTRIS Vehicle Classification System, developed by NMDOT specifically for use in calculating ESALs and correction factors for the US550 warramties.
NOTICE
The United States Government and the State of New Mexico do not endorse products or manufacturers. Trade or manufacturers’ names appear herein solely because they are considered essential to the object of this report. This information is available in alternative accessible formats. To obtain an alternative format, contact the NMDOT Research Bureau, 7500B Pan American Freeway, Albuquerque, NM 87109 (PO Box 94690, Albuquerque, NM 87199-4690) or by telephone (505) 841-9145.
DISCLAIMER
Table of Contents This report presents the results of research conducted by the author(s) and does not necessarily reflect the views of the New Mexico Department of Transportation. This Report does not constitute a standard or specification.
i

ACKNOWLEGEMENTS
The authors wish to express their gratitude to Steve Von Stein and Robert Fijol of the Federal Highway Administration, Captain Ron Cordova of the New Mexico Motor Vehicle Division, Antonio Abeyta and Joe Stone of the NMDOT Data Collection Bureau, and Chuck Slocter of the NMDOT Highway Operations Support Bureau, for technical support and guidance during development of the ALTRIS Vehicle Classification System.
ii

iii
TABLE OF CONTENTS Introduction…………………………………………………………………. 3 Background…………………………………………………………………. 5 FHWA Vehicle Classification System………………………………............ 8 ESAL Calculation……………………………………………………. …….. 13 ALTRIS Vehicle Classification System…………………………………….. 19 Other Uses of Weigh-In-Motion Data……………………………….. …….. 25 US550 ESAL Growth Models……………………………………….. …….. 31
Summary…………………………………………………………...……….. 38

Introduction US Highway 550 (formerly NM 44) in northern New Mexico was reconstructed between 1998 and 2001, and incorporates a number of innovative features, including:
• Innovative GARVEE bonding to finance reconstruction • Contractor-provided design and construction management • Limited state oversight of design and construction • Abbreviated schedule of 3.5 years to complete 118 miles of major reconstruction • First-of-its-kind pavement and structures performance warranties
Two separate performance warranties were negotiated for this project. The first is a 20 year pavement warranty purchased for an upfront cost of $60 Million, and the second is a 10 year structures warranty purchased for $2 Million. These warranties will expire based on the following factors:
1. Time - 20 years for the Pavement Warranty; 10 years for the Structures Warranty 2. Money - Approximately $110 Million for pavement; $4 Million for structures 3. ESALs* - 4 Million for pavement; 2 Million for structures
Equivalent Single Axle Loads (ESALs) are defined by FHWA as: “The damage per pass to a pavement caused by a specific axle load relative to the damage per pass of a standard 18,000 pound axle load moving on the same pavement”. A single axle weighing 18 kips would therefore constitute one ESAL. The pavement and structures are warranted for specific performance measures including, for example, rutting, cracking, erosion, raveling, potholes, etc., as specified in the contract. A Lifecycle Cost Analysis performed by the contractor documents expected maintenance activities and costs over the life of the warranties, with significant expenditures expected in the latter years. Accurate computation and tracking of ESALs is therefore critical to effective management of these warranties. Accordingly, three Weigh-In-Motion (WIM) stations were placed at strategic locations along the corridor to collect detailed vehicle information on a continuous basis. Under the provisions of the contract, the New Mexico Department of Transportation (NMDOT) is responsible for maintaining WIM equipment and providing the data files to the warranty provider. The warranty provider is responsible for processing this data, computing ESALs, and producing an annual report documenting these results. These results become final thirty days after receipt by NMDOT. While the warranty provider bears responsibility for accurate calculation of ESALs based on data provided by NMDOT, the need for independent verification of these results was recognized by NMDOT early into the warranty phase of the project. NMDOT maintains a number of WIM sites throughout the state, and employs a computer application to process this data. The requirements for calculating ESALs along US550, however, are unique, including specific provisions for application of correction factors to more accurately reflect ESAL accumulation. These correction factors account for missing data to expected equipment outages, screening algorithms in the
1

WIM software which exclude certain vehicles that fail to pass various quality checks, and missing hours of data in a given day. In recognition of the need for independent verification of ESAL calculations performed by the warranty provider, NMDOT created the ALTRIS Vehicle Classification System (ALTRIS). This system is a custom application specifically designed to calculate ESALs from data collected through WIM stations located along the facility. The application processes WIM data, classifies vehicles, performs ESAL calculations based on axle weights and spacing, and produces formatted reports to document these results. The results produced by ALTRIS are then compared with output from NMDOT’s other ESAL calculation program, and with results obtained by the warranty provider. Because each platform is independent, this arrangement provides for cross validation of results between each system and, if the results agree within an acceptable tolerance, provides a very high degree of confidence in the accuracy of each system. ALTRIS performs its calculation in accordance with ESAL estimation methods as documented in the 1993 edition of the AASHTO Pavement Design Guide, as required by contract. The Pavement Design Guide provides a series of charts wherein ESALs are obtained by reading table values for given parameters of axle weight, number of axles in group, structural number SN and serviceability pt. Table values provide a convenient alternative to solving a complex ESAL equation. In development of ALTRIS, the engineers and programmers chose to derive ESALs through interpolation of table values rather than using the ESAL equation. This decision was made in recognition of the fact that the program must be available over the duration of the warranty, and used by future administrators of the warranty. To simplify and de-mystify the ESAL computation process, ESAL calculation is reduced to solution of simple algebraic expressions, and these expressions are displayed through the user interface for quick verification by the user. Table values are given for axle weights in increments of 2 kips, and linear interpolation is performed on these table values. The ESAL equation is one of geometric growth, and the characteristic equation is concave up. Linear interpolation between table values therefore yields results slightly higher than those computed from the equation. The difference, however, is typically well under 1%, and this is considered to be within a tolerable margin of error. This report provides an overview of the innovative US550 reconstruction project, details of WIM data files, calculation of ESALs both through interpolation of chart values and the ESAL equation, and a description of the ALTRIS Vehicle Classification System, developed by NMDOT specifically for use in calculating ESALs and correction factors for the US550 warramties. While the primary purpose of ALTRIS is to accurately compute ESALs along US550 as required for sound warranty management, the long term warranty and requirements for continuous WIM measurements over the life of the project provide a unique opportunity to study traffic patterns and trends over the facility for an extended duration of time. This report also provides an overview of efforts to expand the use of available WIM data into other areas of study, including various trend analyses, frequency of overweight truck traffic and projections of ESAL growth based on historical data.
2

Background
New Mexico Highway 44, re-designated as US550 in January, 2000, consistently ranked among the most dangerous roads in the country. According to the New Mexico Traffic Safety Bureau, from 1992 through 1996, 36 people died and 264 were seriously injured in traffic crashes on NM 44. The Four Corners area, which includes the City of Farmington and San Juan County, had the 4th highest population, while having the 9th highest unemployment rate in New Mexico. Driven by concerns about public safety and the desire to provide economic development opportunities to the area, then Governor Gary Johnson directed that reconstruction of the 118 mile, four lane road be a high priority during his administration. Traditional road design and construction methods used by the New Mexico Department of Transportation (NMDOT), formerly known as the New Mexico State Highway and Transportation Department, were to bid projects in roughly 4 to 5 mile increments. This approach would have taken as long as 27 years to upgrade the entire corridor. To satisfy the Governor’s directive, a new approach to road construction was required. Project Description In July 1998, the NMDOT entered into a lump sum performance based contract with Mesa Project Development Corporation (PDC), a limited liability company owned by Koch Materials of Wichita, Kansas to design, manage construction and warrant NM 44 from San Ysidro to Bloomfield. Total cost of the project was $323.83 million which included $46.82 million for project design and construction management, $215.0 million for construction, and $62.0 million for performance warranties. The project involved reconstructing and widening 118 miles of roadway, rehabilitation or replacement of seven bridges and replacement or extension of 393 culverts. PDC contracted with CH2M Hill (Denver, Colorado) as the primary design firm and with Flatiron Structures (Longmont, Colorado) for construction management and quality assurance (CM/QA) The project was divided into four bid segments with NMDOT awarding each construction segment in accordance with state procurement regulations. The initial construction phase of the project was substantially completed in November, 2001, less than 3.5 years after the PDC contract was executed. Professional Services and Performance Warranties The Design Professional Services portion of the contract obligated PDC to design the project in accordance with NMDOT and American Association of State Highway and Transportation Officials (AASHTO) guidelines as the minimum required design standards. It also required PDC to perform geotechnical subsurface testing to ensure the roadbed and structures foundations met acceptable design standards. Although NMDOT reviewed the design provided by PDC, contract terms provided that NMDOT review would not relieve PDC from full responsibility for the
3

performance of the professional services in accordance with the standards, terms and conditions of the agreement. Additionally, PDC warranted for three years from substantial completion, that if design or construction management failed to meet standards, it would perform any necessary corrective design and would be liable for the cost of repairs or replacement directly attributable to the failure. The contract specified that PDC’s liability on the professional services warranty would be limited to $25 million. NMDOT paid $60 million for the 20-year pavement warranty and $2 million for the 10-year structures (bridge, drainage and erosion) warranty. The duration of the warranty agreement is limited to time, number of Equivalent Single Axle Loads (ESALs), or total expenditures, whichever occurs first. The pavement warranty is limited to 20 years of service life, 4,000,000 ESALs, or $110 million of total PDC expenditures. Therefore, beyond the $60 million payments from the State, PDC is at risk for an additional $50 million in pavement expenditures, if necessary to meet the terms of the warranty. The structures warranty is limited to 10 years of service life, 2,000,000 ESALs, or $4 million of total PDC expenditures. PDC is at risk for an additional $2 million in structure expenditures, if necessary to meet the terms of the warranty. The pavement and structures warranties are therefore treated as two separate and distinct contracts and are secured by a $114 million surety bond. The warranties are divided into four segments (same as the construction segments), each of which is subject to expiration depending on the Equivalent Single Axle Loads (ESAL’s) count for that segment. PDC submits the Annual ESAL Calculation Report that summarizes the cumulative amount of ESALs calculated from data obtained from three weigh-in-motion (WIM) stations located at the beginning, middle and end of the project. NMDOT is responsible for the WIM station maintenance and data and PDC is responsible for calculating the number of ESALs. The pavement and structures warranty portions of the contract state that PDC will repair or replace any portions of the project that fail to meet specific objective performance measurement criteria. The pavement performance criteria establishes minimum acceptable criteria for various road conditions including smoothness, rutting, cracking, bleeding, raveling, delamination, pot holes and depressions. The structures performance criterion establishes minimum acceptable criteria for various bridge, drainage and erosion conditions. Pavement and structures are inspected annually by PDC sub-consultants to locate and identify areas that do not meet the performance criteria. An Annual Maintenance Plan is then prepared by PDC summarizing the findings of the inspections and outlining a plan for maintenance and repairs for the next construction season. Deficiencies identified during the annual inspections are then repaired, bringing the problem areas back into compliance with the performance criteria. The NMDOT is responsible for non-pavement maintenance along the roadway, such as mowing, metal barrier repairs, snow removal, striping and signage.
4

Warranty Maintenance and Repair Work Under the warranty, PDC is required to initiate, prepare and submit bid packages to NMDOT for price agreements. In addition, PDC serves as authorized agent for the NMDOT in construction management, quality assurance, payment certification, and oversight of the price agreements. Contract provisions require that repair and maintenance work under the warranty be performed by contractors in accordance with standard state procurement rules. Maintenance contracts are therefore executed directly between NMDOT and the contractors, with PDC serving as authorized agent of the state. Progress payments for warranty are made to the contractor by NMDOT, and these costs are reimbursed back to the state by PDC. Weigh-In-Motion Equipment Accurate traffic monitoring and ESAL calculation is central to effective management of the warranties. Accordingly, three Weigh-In-Motion stations were located along the facility at mileposts 24.8, 72.2 and 121.7. These WIM site locations are shown on the following satellite image of the facility.
SAT10 Image © DeLorme
5

FHWA Vehicle Classification System
Like all major highways throughout the United States, traffic along US550 in northwestern New Mexico is composed of a large variety of private vehicles and commercial trucks. Vehicle traffic ranges from motorcycles and small passenger cars to large commercial vehicles pulling multiple trailers and carrying heavy cargo. It is impractical, if not impossible, to individually identify, classify, monitor and measure the impact of the thousands of possible weight and axle configurations in this traffic distribution. Instead, the industry has developed a classification scheme comprised of thirteen vehicle categories as a means to organize this distribution. The Federal Highway Administration publication, the Traffic Monitoring Guide, presents these categories as follows:
1. Motorcycles 2. Passenger Cars 3. Other Two-Axle, Four-Tire Single Unit Vehicles 4. Buses 5. Two-Axle, Six-Tire, Single Unit Trucks 6. Three-Axle, Single Unit Trucks 7. Four or More Axle Single Unit Trucks 8. Four or Less Axle Single Trailer Trucks 9. Five-Axle, Single Trailer Trucks 10. Six or More Axle Single Trailer Trucks 11. Five or Less Axle Multi-Trailer Trucks 12. Six-Axle Multi-Trailer Trucks 13. Seven or More Axle Multi-Trailer Trucks
The Weigh-In-Motion equipment installed at three locations along the US550 project collects information on vehicles passing over this equipment in accordance with data collection requirements set forth in the Traffic Monitoring Guide. Data is collected in a matching pair of text-based data files for each day of operation, and this data is collected continuously, 24 hours per day, from each site. The Vehicle Classification Record, or “4-Card” file, collects summary information on the number of classified vehicles in classifications 1 – 13. The Truck Weight Record, or “7-Card” file, collects detailed information on each individual vehicle in classifications 4 – 13. Vehicle classes 1 – 3 are ignored, because these are lightweight, predominantly private vehicles which do not factor significantly into impact damage calculations. The record layout for these data files is as follows: VEHICLE CLASSIFICATION RECORD
1. Vehicle classification record code (4) 2. State code 3. Functional classification 4. State identification number
6
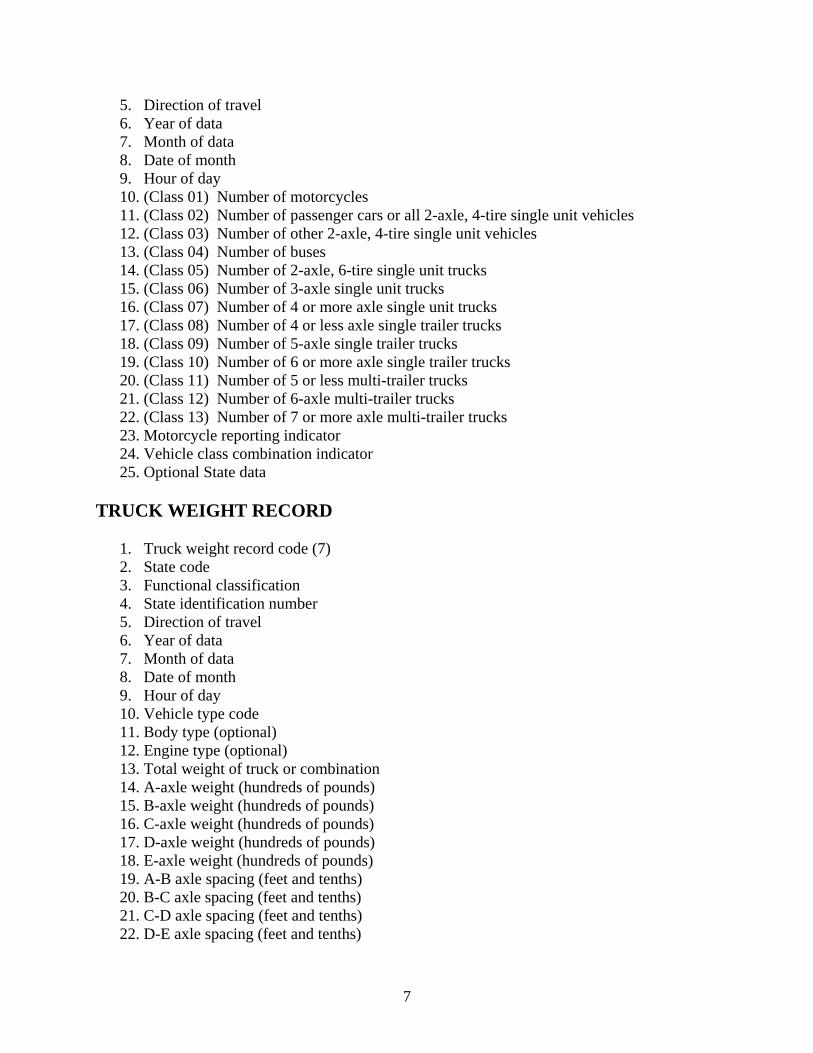
5. Direction of travel 6. Year of data 7. Month of data 8. Date of month 9. Hour of day 10. (Class 01) Number of motorcycles 11. (Class 02) Number of passenger cars or all 2-axle, 4-tire single unit vehicles 12. (Class 03) Number of other 2-axle, 4-tire single unit vehicles 13. (Class 04) Number of buses 14. (Class 05) Number of 2-axle, 6-tire single unit trucks 15. (Class 06) Number of 3-axle single unit trucks 16. (Class 07) Number of 4 or more axle single unit trucks 17. (Class 08) Number of 4 or less axle single trailer trucks 18. (Class 09) Number of 5-axle single trailer trucks 19. (Class 10) Number of 6 or more axle single trailer trucks 20. (Class 11) Number of 5 or less multi-trailer trucks 21. (Class 12) Number of 6-axle multi-trailer trucks 22. (Class 13) Number of 7 or more axle multi-trailer trucks 23. Motorcycle reporting indicator 24. Vehicle class combination indicator 25. Optional State data
TRUCK WEIGHT RECORD
1. Truck weight record code (7) 2. State code 3. Functional classification 4. State identification number 5. Direction of travel 6. Year of data 7. Month of data 8. Date of month 9. Hour of day 10. Vehicle type code 11. Body type (optional) 12. Engine type (optional) 13. Total weight of truck or combination 14. A-axle weight (hundreds of pounds) 15. B-axle weight (hundreds of pounds) 16. C-axle weight (hundreds of pounds) 17. D-axle weight (hundreds of pounds) 18. E-axle weight (hundreds of pounds) 19. A-B axle spacing (feet and tenths) 20. B-C axle spacing (feet and tenths) 21. C-D axle spacing (feet and tenths) 22. D-E axle spacing (feet and tenths)
7

23. Total wheelbase 24. Record serial number 25. Continuation indicator
Because each line of data is confined to 80 characters, only five axles are recorded on the “face record”. If more than five axles are present, the data is continued on the next line, referred to as the “continuation record”. The continuation indicator is recorded as “0” on the face record if five or less axles are present on the subject vehicle, and “1” if six or more axles are present. Data on additional axles, when necessary, are recorded in subsequent continuation records, which have the following layout. TRUCK WEIGHT CONTINUATION RECORD
1. Truck weight record code (7) 2. State code 3. Functional classification 4. State identification number 5. Direction of travel 6. Year of data 7. Month of data 8. Date of month 9. Hour of day 10. Vehicle type code 11. Body type (optional) 12. Engine type (optional) 13. F-axle weight (hundreds of pounds) 14. G-axle weight (hundreds of pounds) 15. H-axle weight (hundreds of pounds) 16. I-axle weight (hundreds of pounds) 17. J-axle weight (hundreds of pounds) 18. K-axle weight (hundreds of pounds) 19. L-axle weight (hundreds of pounds) 20. M-axle weight (hundreds of pounds) 21. E-F axle spacing (feet and tenths) 22. F-G axle spacing (feet and tenths) 23. G-H axle spacing (feet and tenths) 24. H-I axle spacing (feet and tenths) 25. I-J axle spacing (feet and tenths) 26. J-K axle spacing (feet and tenths) 27. K-L axle spacing (feet and tenths) 28. L-M axle spacing (feet and tenths) 29. Record serial number (same as face record) 30. Continuation indicator (2-8 = next continuation record for a vehicle with more than 13
axles; 9 = last continuation record)
8

Information on traffic distribution is polled every fifteen minutes and summarized in the Vehicle Classification Record file. A full day of summary data will therefore occupy 96 lines of text in the Vehicle Classification Record. The Truck Weight Record records data on each vehicle on a line of text (and subsequent lines if the vehicle has more than five axles). A typical full day of weight data may occupy hundreds or thousands of lines of text. The data contained in the Vehicle Classification Record includes summaries of the number of vehicles in classifications 1 – 13, while the Truck Weight Record includes detailed information on axle weights and spacing for individual vehicles, which is used in subsequent ESAL calculations. The Weigh-In-Motion equipment creates a matching pair of daily files, the Vehicle Classification Record, and the Truck Weight Record, for each day of polled data. While data from the Truck Weight Record is used to perform ESAL calculation based on axle weights and spacing, the summary of vehicle types is compared with data recorded in the Vehicle Classification Record in the following manner. The Weigh-In-Motion software uses an internal algorithm to determine vehicle classification, and summary statistics are recorded in the Vehicle Classification Record file. A large number of vehicle configurations, however, may fall into the same broad category, and to better identify individual vehicle types in the traffic stream, the Weigh-In-Motion software assigns a “vehicle type code” which is recorded in the Truck Weight Record. This data is encoded as a 6-digit number, and contains information on vehicle type and number of axles on the power unit and trailer(s). The vehicle classification is not recorded directly on the Truck Weight Record, rather the classification is derived from the vehicle type code. As an example, the greatest contributor of ESALs along US550 is from Class 9 vehicles. By definition, a Class 9 vehicle is characterized by five axles distributed over a two-unit configuration, typically a power unit and a single semitrailer. A typical vehicle type code for this arrangement is “332000”. Using charts provided in the FHWA Traffic Monitoring Guide, this series of numbers is decoded as follows: “3” – Basic vehicle type is a tractor and semitrailer “3” – Number of axles on the power unit “2” – Number of axles on the semitrailer Trailing zeroes are default for a basic vehicle type of “3”. Because this configuration represents a tractor-semitrailer combination with a total of five axles, the vehicle is defined as a Class 9. Similarly, a vehicle type code of 342000 represents a tractor-semitrailer with six axles, four on the power unit and two on the semitrailer, and is defined as a Class 10 vehicle. In this way, vehicle classifications are derived for all vehicles recorded on the Truck Weight Record file. These vehicles are classified and summed through ALTRIS according to classification, and this information is compared with the classification summaries recorded on the corresponding Vehicle Classification Record from the same day. Early into the Warranty phase of the US550 project, engineers observed that vehicle classes summarized on the Vehicle Classification Record were consistently higher than those derived
9

from the corresponding Truck Weight Record. After checking for computational and logical errors in data analysis, the engineers conferred with the WIM equipment manufacturer. The engineers learned that the WIM software employs a screening algorithm which evaluates the “reasonableness” of the data, and discards truck data from the Truck Weight Record file if the data fails to pass an internal quality check. Errors are recorded through the WIM software for vehicles that the software cannot properly detect. Depending on whether the software records the event as a warning, or as an error, the vehicle may or may not be recorded. This software detects such events as vehicles moving against the traffic flow, speeds too high or too low, maximum number of axles exceeded, only one axle detected, vehicle is off scale, etc. The system rejects those records which are deemed to be unreliable. No such quality check is performed when recording information on the Vehicle Classification Record, and summarized class counts are therefore higher than those reflected in the corresponding Truck Weight Record files. In recognition of the fact that total vehicle counts are higher than those reflected in the Truck Weight Record files, which are used to calculate total ESALs and thus materially impact the Warranty, the parties to the Warranty agreed to develop specific correction factors to compensate for this disparity. These correction factors are derived by calculating the average ESAL for a given vehicle classification from available axle weight and spacing data, multiplying this average by the difference in vehicle counts as reflected in the Vehicle Classification Record and Truck Weight Record files, and adding this factor to the total ESAL count. The correction factor is computed as follows: ET = [Eavg * ΔV] + E7 Where ET = Total ESALs for a given vehicle classification Eavg = Average ESAL computed for a given vehicle classification
ΔV = Difference in number of vehicles as reflected in daily WIM file pairs for a given vehicle classification
E7 = Total ESALs computed from the Truck Weight Record for a given vehicle
classification
10
ESAL Calculation Under the terms of the US550 Warranties, the state is required to provide the warranty provider with WIM data collected from three Weigh-In-Motion sites located along the corridor each year, and the warranty provider is required to process this data, determine ESALs, and produce an annual report documenting this information. Recognizing the possibility that the industry may adopt new and different means of evaluating truck damage factors, the contract specifies that over the duration of the warranty, ESALs will be calculated in accordance with conventions set forth in the 1993 edition of the AASHTO Pavement Design Guide. Equivalent Single Axle Loads (ESALs) are defined by FHWA as: “The damage per pass to a pavement caused by a specific axle load relative to the damage per pass of a standard 18,000 pound axle load moving on the same pavement”. A single axle weighing 18 kips would therefore constitute one ESAL. Combinations of axles with differing weights are converted to ESALs according to AASHTO conventions as presented in the Pavement Design Guide. This conversion establishes a unit of measure which simplifies the analysis and prediction of damage to pavements caused by a wide variety of vehicles traversing the nation’s highways. Calculation of ESALs involves a number of factors including the pavement serviceability index, the number and weight of axles in the axle group, and the structural number. For flexible pavements, this complex equation is given by
Wx
W18=
L18 L2s+( )Lx L2x+( )
⎡⎢⎣
⎤⎥⎦
4.7910
Gβx
10
Gβ18
⎛⎜⎜⎜⎜⎝
⎞⎟⎟⎟⎟⎠
⋅ L2x( )4.33
where W = axle applications inverse of equivalency factors (where W18 = number of
18,000 lb single axle loads)
Lx = axle load being evaluated (kips)
L18 = 18 (standard axle load in kips)
L2x = code for axle configuration 1 = single axle 2 = tandem axle 3 = triple axle x= axle load equivalency under consideration s = code for standard axle = 1 (single axle)
11

G = log4.2 pt−( )4.2 1.5−( )
⎡⎢⎣
⎤⎥⎦
(a function of the ratio of loss in serviceability at time t, to the potential loss taken at a point where pt = 1.5) pt = terminal serviceability index (the point at which the pavement is considered to be at the end of its useful life)
β = 0.4 0.081Lx L2x+( )3.23
SN 1+( )5.19 L2x( )3.23⋅⋅
⎡⎢⎢⎣
⎤⎥⎥⎦
+
(function which determines the relationship between serviceability and axle load applications. (SN = structural number)
This equation is complex, and somewhat impractical for field computation. To simplify matters, the Pavement Design Guide provides a number of charts which give ESAL equivalents at 2 kip intervals for a given axle number group (single, tandem, triple), serviceability index pt, and structural number SN.
Following is a sample of ESAL factors taken from the Pavement Design Guide for tandem axles on pavement of serviceability index pt = 2.5 and structural number SN = 5:
Axle Load (kips) ESAL
10 0.007
12 0.014
14 0.027
16 0.047
18 0.077
20 0.121
22 0.180
24 0.260
26 0.364
28 0.495
30 0.658
12

32 0.857
34 1.090
36 1.380
38 1.700
ESAL calculation is very sensitive to number of axles in the group (single, tandem or triple), and axle group weight. The following graphs plot the relationship between axle group weight and ESAL factors for tandem axles, and the effect of number of axles in a group as presented in Table D.5 of the Pavement Design Guide:
13

The preceding graphs demonstrate the sensitivity of ESAL calculation to both the axle group weight and the number of axles in the group. The US550 pavement warranty, by contract, will expire at the end of the calendar year in which cumulative ESALs reach 4,000,000. The difference of a few ESALs may therefore have a significant impact to the parties to the warranty: if 4 Million ESALs are accumulated on December 15 of a given year, for example, the warranty will expire at the end of December. If 4 Million ESALs are accumulated a few weeks later, on January 15 of the following year for example, the warranty will expire at the end of the calendar year. This has potentially significant financial implications, as maintenance costs will be borne by the warranty provider until expiration of the warranty, and significant maintenance costs are anticipated in the latter years of the warranty as documented in the pavement lifecycle cost analysis.
Accurate ESAL calculation is therefore a critical factor in the management of the US550 warranties. While the warranty provider is contractually obligated to perform ESAL calculations based on Weigh-In-Motion data provided by NMDOT, the state recognizes the value in performing independent calculations as a necessary quality control measure.
Accordingly, the ALTRIS Vehicle Classification System was independently created by the state as a project-specific means to calculate and track ESALs along the US550 corridor. The US550 Warranty Engineer of NMDOT uses ALTRIS to perform these calculations. While use of the ESAL equation is somewhat more accurate, the ALTRIS program developer decided to use a scheme of interpolating table values as presented in the Pavement Design Guide to perform these calculations. By doing so, the ESAL calculation process is reduced to solving simple algebraic expressions which can be displayed on the ALTRIS user interface and quickly verified by the Warranty Engineer. An example of this interpolation follows:
Given: A Class 9 vehicle consisting of 5 axles in 3 axle groups (a single and tandem group on the power unit, and a tandem group on the trailer).
Axle Weights: First group (single) 13.7 kips
Second group (tandem) 30.5 kips
Third group (tandem) 30.2 kips
14

This is an actual vehicle from the US550 WIM data. The schematic is as follows.
Solution:
The pavement is flexible, the pt is 2.5 and the SN is 5. From Tables D.4 and D.5 of the Pavement Design Guide,
Axle Load ESAL
12 0.189 (single) 14 0.360 (single) 30 0.658 (tandem) 31 0.857 (tandem)
For the single axle on Group 1, interpolating Table D.4 values gives
13.7 12−( )0.360 0.189−( )
14 12−( )⎤⎡⎢ ⎥⎦⎣
⋅ 0.189+ = 0.334(Group 1 ESAL Equivalent)
Similarly, for the tandem axles on Groups 2 and 3, interpolating Table D.5 values gives
30.5 30−( )0.857 0.658−( )
32 30−( )⎡⎢⎣
⎤⎥⎦
⋅ 0.658+ = 0.708(Group 2 ESAL Equivalent)
and
30.2 30−( )0.857 0.658−( )
32 30−( )⎡⎢⎣
⎤⎥⎦
⋅ 0.658+ = 0.678(Group 3 ESAL Equivalent)
15

Total vehicle ESAL is given by 0.334 + 0.708 + 0.678 = 1.720
Using the ESAL equation on Group 2 for comparison,
β 30.5 = .40.081 30.5 2+( )3.23⋅⎡⎣ ⎤⎦
5 1+( )5.19 23.23⋅⎡⎣ ⎤⎦
⎡⎢⎣
⎤⎥⎦
+ 0.46=
⎡⎢⎣
⎡ 0.081 18 1+( )3.23⋅ ⎤⎣ ⎦5 1+( )5.19 13.23⋅⎡⎣ ⎤⎦
⎤⎥⎦
+ 0.5=β 18 = .4
G = log4.2 2.5−( )4.2 1.5−( )
⎡⎢⎣
⎤⎥⎦
0.201−=
Gβ 30.5
= 0.201−0.46
0.437−=
Gβ 18
= 0.201−0.50
0.402−=
W30.5
W18= 18 1+( )
30.5 2+( )⎡⎢⎣
⎤⎥⎦
4.79 10 0.437−
10 0.402−
⎛⎜⎝
⎞⎟⎠
⋅ 24.33 1.418=
ESAL = 11.418
0.705=
This compares favorably with the ESAL factor of 0.708 computed by interpolating Pavement Design Guide chart values. Similarly, ESAL factors for axle groups 1 and 3 are
16

ESALGroup 1 = 0.329 ; and
ESALGroup 3 = 0.676
Using the ESAL equation, the total vehicle ESAL is:
Total vehicle ESAL is given by 0.329 + 0.705 + 0.676 = 1.710
(compared with 1.720 calculated through interpolation)
Interpolated values are slightly higher because the ESAL equation is concave up, and the interpolation between chart values is linear. The resulting difference, in this case less than 0.6%, is well within acceptable tolerance. Using ESAL values interpolated from chart values is expected to accelerate accumulation of ESALs by approximately one month.
ALTRIS Vehicle Classification System
Under the terms of the US550 performance warranties, annual ESAL calculations performed by the warranty provider become final thirty days following receipt of the ESAL report by NMDOT.
In recognition of the need for independent verification of ESAL calculation, NMDOT created custom software to process and analyze Weigh-In-Motion data collected from the three WIM stations situated along US550. This software performs the following tasks:
• Reads data from the text files generated by WIM equipment • Parses data and populates data arrays • Classifies vehicles according to truck type • Performs ESAL calculations • Applies correction factors • Creates formatted monthly reports
In addition to performing ESAL calculations, ALTRIS tracks various trends in the data, including time of day, day of week, annual and seasonal trends, and occurrence of overweight
17

vehicle traffic. This data is useful in evaluating the benefit of innovations used in the construction of US550 over the life of the facility. Following are screenshots taken from the program along with a description of program operation.
The user typically begins by selecting vehicle classification record and truck weight record files for the month in question. Matching pairs of weight and classification files for each day in the month are required for the classification. Data for the month of January, 2006 is used in the following example,.
18

Data from these files are parsed and placed in appropriate arrays. The user may select a given truck record by clicking on its entry in the list box as shown.
From this screen, the user may review any record in the file, typically composed of 20,000 to 30,000 individual vehicles. The screen is organized into the following regions.
The bottom part of the screen displays the text representing the truck weight record data. This line of text contains coded data for the vehicle including axle weights and spacing, date, time of day, direction and vehicle classification. The button on the left side of the screen opens a calendar from which the user may select a particular day of the month. The button on the right side opens a dialog box which provides information on which hours of a given day are missing data.
19

The list box displays each line of data contained in the data files. Each line of data represents an individual vehicle, and the user may select an entry by scrolling through these records.
Vehicle classification data is encoded in the truck weight record as a six digit number. In this example, the vehicle is a tractor trailer combination (3) with 3 axles on the power unit (3) and two on the trailer (2). This example is a two unit, five axle class 9 vehicle.
Vehicle ESALs are calculated by interpolating chart values from the Pavement Design Guide. The algebraic expressions are displayed along with axle group and total vehicle ESALs.
20
A schematic of the axle configuration is provided.

The user may selected a desired day of the month from a drop down calendar, and the list box will display available entries organized by vehicle record number for that day. ALTRIS displays the hours in the day for which no data was collected.
While the preceding functions of the program are useful for allowing the Warranty Engineer to review individual records and perform periodic quality checks of the data, it is impractical to analyze each of the tens of thousands of records in a given month. ALTRIS therefore automates this task and generates a monthly report which includes summaries of vehicles organized by class and direction, and application of correction factors for missing data. The user initiates this analysis by issuing the Process command from the menu.
21

The following graphic presents the results of this processing.
In this example, no days were missing from the data set, and no missing day correction factors were applied. However, as expected there are more vehicles recorded on the vehicle classification record than on the truck weight record, and ESAL correction factors are calculated as shown.
22

ALTRIS provides a quick summary of ESAL data for review by the Warranty Engineer, including date, day of week, hour of day, record number, ESAL factor, direction and class. This feature is useful for an overview of vehicle traffic during the month and for identifying anomalous records. In the preceding graphic, a record is selected which identifies a Class 9 vehicle with a total ESAL factor of 10.18. This record is interesting because the average ESAL factor for this class is 1.50. By selecting the date (01/31/06) and record number (820) from the data set, the Warranty Engineer may isolate this vehicle and study its characteristics. On review of this vehicle, for example, it is discovered that the ESAL factor was calculated correctly, and the vehicle is considered overweight under state weight limit laws. (Along with axle weights in excess of 20,000 lbs, all of the axles on this vehicle are single, contributing to an unusually high ESAL factor).
23

Other Uses of Weigh-In-Motion Data
As the top tier of traffic data collection, WIM files contain a wealth of information. The twenty year duration of the US550 warranty, and its requirement for continual collection of WIM data over this time period, provides a unique opportunity for a case study to evaluate traffic patterns following reconstruction of the facility.
In addition to calculating ESAL factors and producing formatted monthly reports to track ESAL accumulation for warranty management purposes, therefore, ALTRIS provides monthly reports on the following trends, sorted by direction:
• ESAL counts by day of week • ESAL counts by hour of day • ESAL counts by vehicle classification • Volume counts by vehicle classification • Overweight vehicles by hour of day • Annual ESAL counts by day and month
By tracking this information, NMDOT may gather information regarding seasonal variations in truck traffic (an important economic indicator), variations by time of day and day of week, distribution of truck classification types, annual growth factors, and occurrence of overweight vehicles. This information can be further be used to:
• Analyze the stresses imposed on US550 bridges by illegal loads. • Target motor vehicle division law enforcement for most likely days of the week, hours of
day and direction. • Predict ESAL growth and estimate time of terminal ESAL accumulation.
Following are plots generated through ALTRIS which present this information.
24

25
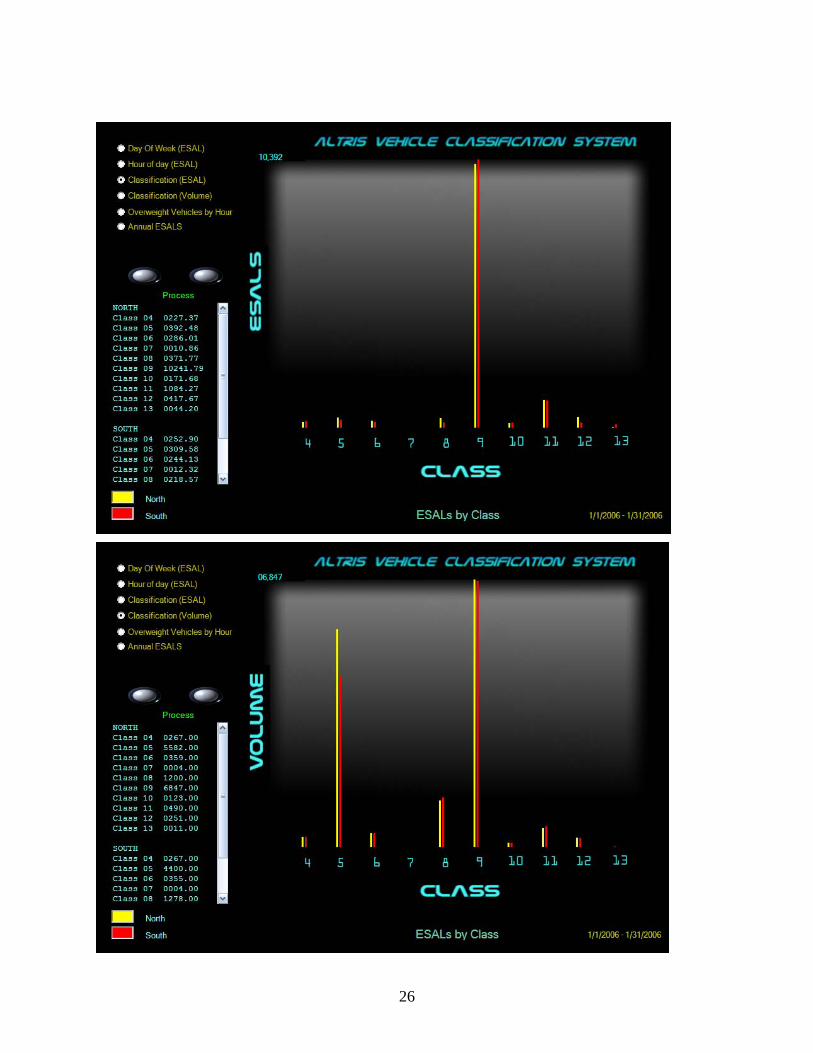
26

27

The following graphic presents a vehicle record representing a 10.18 ESAL Class 9 truck, extracted from the January 2006 WIM site near Cuba, NM. This is one of nearly 1000 overweight, and potentially illegal vehicles traversing US550 during the month.
Overweight vehicles cause enormous damage to roads and bridges throughout New Mexico, and Weigh-In-Motion data provides the means to track the frequency and trends of this traffic. Given statistics related to the frequency of potentially illegal loads, law enforcement may be maximized through targeted enforcement efforts.
If bridge characteristics are known, truck axle weights and spacing may be used to evaluate expected damage caused by these vehicles. In the following example, the stresses from the truck referenced above are analyzed for a typical bridge near Cuba, New Mexico. The subject structure is a single span prestressed girder bridge with an inventory load rating of HS20, and an operating load rating of HS33.
When analyzed for bending moment stresses imposed by this overweight vehicle, the analysis suggests that the bridge is not overstressed by this load, despite the unusually large ESAL factor.
28
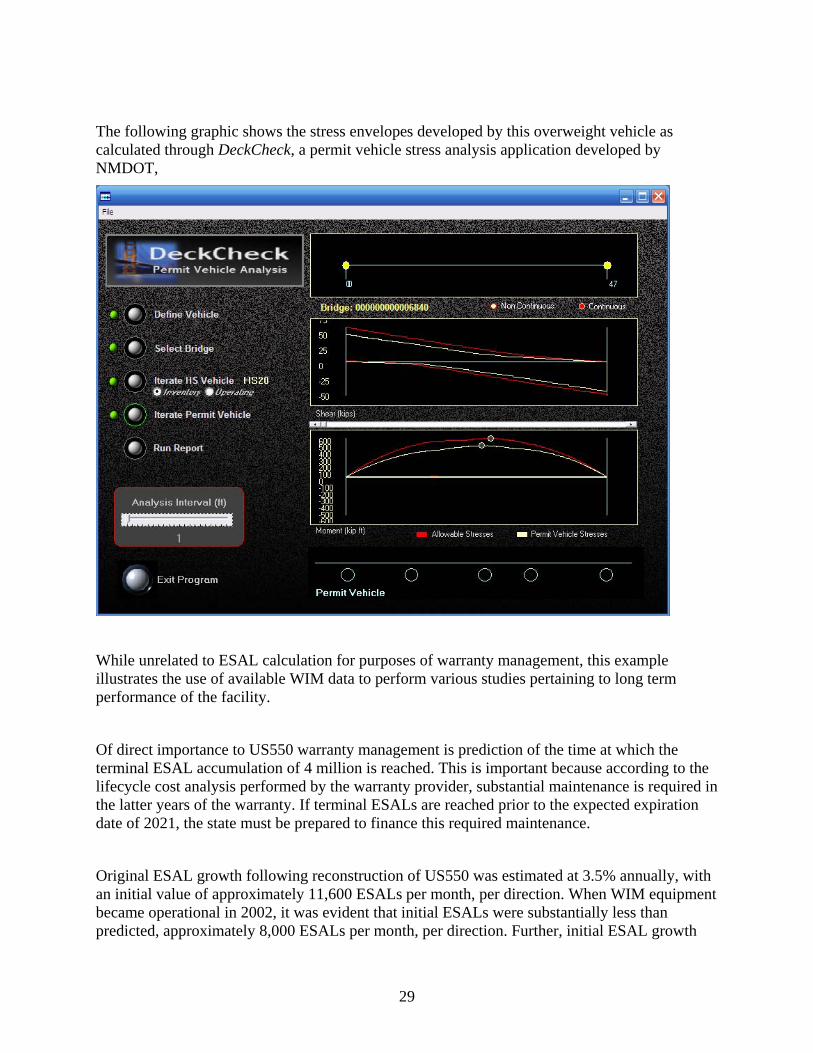
The following graphic shows the stress envelopes developed by this overweight vehicle as calculated through DeckCheck, a permit vehicle stress analysis application developed by NMDOT,
While unrelated to ESAL calculation for purposes of warranty management, this example illustrates the use of available WIM data to perform various studies pertaining to long term performance of the facility.
Of direct importance to US550 warranty management is prediction of the time at which the terminal ESAL accumulation of 4 million is reached. This is important because according to the lifecycle cost analysis performed by the warranty provider, substantial maintenance is required in the latter years of the warranty. If terminal ESALs are reached prior to the expected expiration date of 2021, the state must be prepared to finance this required maintenance.
Original ESAL growth following reconstruction of US550 was estimated at 3.5% annually, with an initial value of approximately 11,600 ESALs per month, per direction. When WIM equipment became operational in 2002, it was evident that initial ESALs were substantially less than predicted, approximately 8,000 ESALs per month, per direction. Further, initial ESAL growth
29

was significantly higher than predicted, with sustained growth rates above 20% per year over the first few years of the warranty period.
The following analysis uses Weigh-In-Motion data collected from WIM equipment near Cuba, New Mexico for the period of time between October 2002 and November 2005. The WIM equipment became operational in October 2002, and data from this site is selected because this equipment has delivered consistently valid data.
US550 ESAL GROWTH MODELS – 2002 THROUGH 2005
ESTIMATED ESAL US 500 ESAL GROWTH Initial traffic forecasting projected ESAL growth along US550 at 3.5% over the 20 year warranty period. At the beginning of the warranty, annual ESALs along US550 were estimated at 139,000, or 11,583 ESALs per month. The equation for the growth model in ESALs per month is given by: Y = E 1 r+( )⋅ n
Where E = initial ESALs per Month = 11,583; r = growth rate = 3.5/1200 = 0.0029167 monthly; and n = number of months With this model, ESALs per month at the end of the twenty year warranty period would be: Y = 11583 1.0029167( )⋅ = 23302240
The equation for cumulative ESALs is given by:
f(n) = E1 r+( )n 1−⎡⎣ ⎤⎦
r⋅
With this model, cumulative ESALs at the end of the twenty year warranty would be:
Y = 115831.0029167( )240 1−⎡⎣ ⎤⎦
0.0029167⋅ = 4,000,000 (appr)
Alternatively, cumulative ESALs may be modeled as the integral of the ESALs per month equation:
30

f(n) =0
n
n11583 1.0029167( ) n⋅
⌠⎮⌡
d = 4,000,000 (appr)
US550 is warranted for 4,000,000 ESALs, and the relationship between ESALs per month and cumulative ESALs as originally estimated are plotted on the following two graphs:
31

Actual US550 ESAL Growth During the first few years of the US550 Warranty, the facility sustained an annual cumulative ESAL growth of over 20%. For this analysis, only the NB lanes of the Weigh-In-Motion station near Cuba, New Mexico are considered. This station became operational in October, 2002. The
32

following data set represents actual ESALs calculated from October 2002 through November 2005. October 2002 08265 May 2004 11261
November 2002 07505 June 2004 11878
December 2002 07415 July 2004 11238
January 2003 09057 August 2004 11638
February 2003 07915 September 2004 11155
March 2003 10056 October 2004 13077
April 2003 10167 November 2004 11710
May 2003 09268 December 2004 11915
June 2003 09022 January 2005 11936
July 2003 07965 February 2005 11028
August 2003 10505 March 2005 13398
September 2003 09425 April 2005 14399
October 2003 09405 May 2005 14640
November 2003 09392 June 2005 15126
December 2003 08923 July 2005 13329
January 2004 08975 August 2005 14864
February 2004 08957 September 2005 15538
March 2004 11555 October 2005 17370
April 2004 11597 November 2005 17224
From linear regression, the slope of this data set is 217, and the y-intercept is 7037. The linear model for ESALs per month is therefore given by: f(k) = 217k + 7037
Substantial completion of US550 was November 21, 2001. Weigh-In-Motion equipment became operational on October 1, 2002, a period of 10.3 months. Assumed ESALs per month on October 1, 2002 is therefore given by:
Y = 11583 1.0029167( )10.3⋅ = 11936
and ESALs per month for the period from October 2002 through November 2005 is given by: f(n) = 11936(1.0029167)n, where n = number of months. Actual ESALs for this time period are plotted on the following graph, along with the linear model derived from the data:
33

The following graph plots the trend line of the actual ESALs per month modeled from linear regression along with the curve of projected ESALs anticipated at the beginning of the project, for the period of October 2002 through November 2005:
34

As can be seen from the preceding plot, actual ESALs per month for this period began with a value substantially smaller than originally estimated, and grew at an annual rate substantially higher. CUMULATIVE ESALS Cumulative ESALs may be derived from the actual ESALs per month data set by integrating the equation of the trend line. If f(n) is the trend line equation f(n) = 217n + 7037, cumulative ESALs are found from:
Cumulative ESALs =1
n
nf n( )⌠⎮⌡
d = 108.5 n2⋅ 7037 n⋅+ where n = number of month
The following chart plots actual cumulative ESALs summed from the data set along with the curve derived by integrating the trend line equation for the period from October 2002 through November 2005:
Prior to October 1, 2002 when Weigh-In-Motion equipment became operational, a default monthly ESAL value of 11583 was used to estimate monthly ESAL accumulation. Therefore, on October 1, 2002, the starting cumulative ESAL value for warranty purposes is computed as
0
10.3
n11583 1.0029167( )n⋅⌠⎮⌡
d = 120000 (appr)
Cumulative actual ESALs for warranty purposes is therefore given by:
35

f(n) = 1200000
n
n217 n⋅ 7037+⌠⎮⌡
d+ where n = number of months after October 20
The originally estimated cumulative ESALs may found from
f(n) = E1 r+( ) n 1−⎡⎣ ⎤⎦
r⋅ or
0
n
nE 1 r+( ) n⋅
⌠⎮⌡
d
Substituting values for the period through November, 2005 gives
Cumulative ESALs = 120000 119361.0029167( )n 1−⎡⎣ ⎤⎦
0.0029167⋅+
Actual and projected cumulative ESALs are plotted on the following chart.
The preceding chart shows that as of November 2005, actual cumulative ESALs are substantially less than projected values. However, the growth in ESALs per month is significantly greater than expected. If this growth were to continue at the present rate, the month in which terminal ESALs are accumulated is found using the following equation: 120000 + 108.5n2 + 7037n = 4,000,000 where n = number of months
36
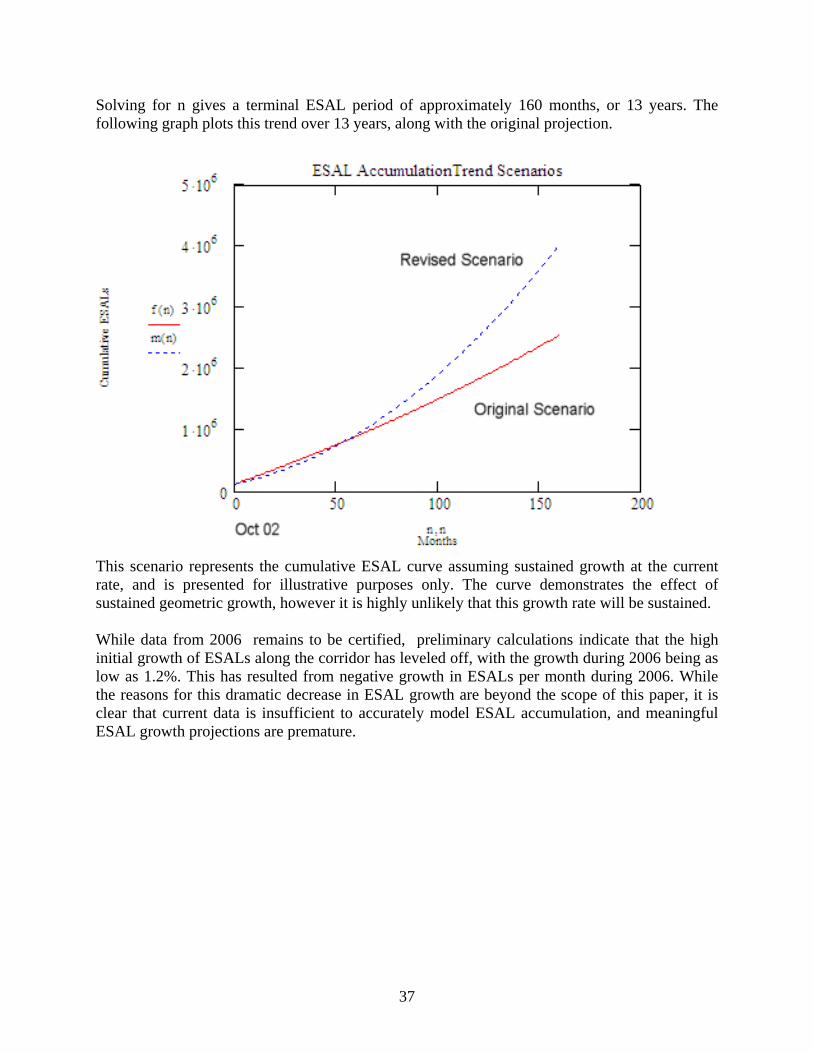
Solving for n gives a terminal ESAL period of approximately 160 months, or 13 years. The following graph plots this trend over 13 years, along with the original projection.
This scenario represents the cumulative ESAL curve assuming sustained growth at the current rate, and is presented for illustrative purposes only. The curve demonstrates the effect of sustained geometric growth, however it is highly unlikely that this growth rate will be sustained. While data from 2006 remains to be certified, preliminary calculations indicate that the high initial growth of ESALs along the corridor has leveled off, with the growth during 2006 being as low as 1.2%. This has resulted from negative growth in ESALs per month during 2006. While the reasons for this dramatic decrease in ESAL growth are beyond the scope of this paper, it is clear that current data is insufficient to accurately model ESAL accumulation, and meaningful ESAL growth projections are premature.
37

Summary The US550 reconstruction project in northwestern New Mexico incorporated a number of innovative features, including provision of first-of-its-kind long term performance warranties for structures and pavements. The innovations used on this project, primarily regarding features of the public-private partnership between NMDOT and Mesa PDC, make this project one of national interest and significance. The purpose of this report is to examine one important aspect of this unique partnership, specifically calculation of Equivalent Single Axle Loads (ESALs) which are a critical element in determining early expiration of the warranties. Because significant and costly maintenance activities are expected in the latter years of the warranty, early expiration of the warranty will have potentially dramatic financial implications for NMDOT. It is therefore crucial to sound warranty management that NMDOT have a viable means of independently calculating ESALs and verifying results as submitted by the warranty provider. The ALTRIS Vehicle Classification System was therefore produced by NMDOT as the means by which to calculate ESALs from Weigh-In-Motion data, and to track ESAL accumulation along US550. ALTRIS was developed to provide a quick, accurate and simple means by which to manage the ESAL calculation portion of the US550 warranties. In recognition of the need to have such a program available to current and future administrators of the warranty, the decision was made to use the most advanced and reliable software development tools in creation of the application. It was therefore decided to employ the .NET framework as provided by Microsoft Inc. to develop the program, as Microsoft has committed to supporting this framework for many years into the future. It is therefore expected that both current and future information technology support staff at NMDOT will be able to support, maintain and upgrade the application as necessary. Since the application was developed by NMDOT staff, software upgrades may be performed quickly and at substantially reduced costs. Because ESAL calculation methods as documented in the 1993 AASHTO Pavement Design Guide are required by contract to be used over the duration of the warranties, in-house software maintenance for this program will be critical if, as expected, the transportation industry moves away from ESALs as the primary impact damage factor. While the primary benefit of ALTRIS is in the accurate calculation and reporting of ESALs, the innovative US550 reconstruction project is one of national interest, and a wealth of information is provided through long term continuous collection of WIM data along this facility. This information, in aggregate and collected over time, presents a unique opportunity to study various trends and patterns in traffic. Some of the uses of this data are presented in this report, and include traffic distribution by class and direction, day of week and hour day, frequency, time, location and magnitude of overweight vehicles, and ESAL growth prediction. ESAL growth prediction is a crucial element in evaluating this facility, both because ESALs are an important economic indicator, and because early accumulation of ESALs will have potentially dramatic financial implications for NMDOT. The growth analysis provided herein shows that while initial ESALs at the start of the warranty period were substantially less than originally
38

estimated, the sustained growth rate of over 20% over the first few years was significantly higher than the 3.5% expected. If sustained over several years, this growth rate would dramatically accelerate the expected date of warranty expiration due to ESAL accumulation. More recent data suggests that the high initial growth rate in ESALs is leveling off, and ESAL growth may actually be negative at the time of this writing. In modeling ESAL growth, only data from the WIM site near Cuba, New Mexico were evaluated. This is because the other two WIM sites located along the facility have experienced fairly long periods of equipment and/or software deficiencies, and the Cuba WIM station, by contrast, has delivered consistently valid data. By evaluating ESAL reports generated through ALTRIS on a monthly basis, the Warranty Engineer is better prepared to quickly identify equipment failures and mobilize resources for repair. The ESAL growth model is therefore presented for illustrative purposes only, as sustained growth as shown in this model is unlikely. The model will need to be continually updated as new data is collected, and ALTRIS will be a very useful tool for this effort.
39

40
REFERENCES
[1] Federal Highway Administration, Traffic Monitoring Guide, Publication No. FHWA-PL-01-021
[2] American Association of State Highway Officials, Pavement Design Guide, 1993 Edition
[3] International Road Dynamics, Weigh-In-Motion Equipment Installation and Maintenance Manual.
[4] New Mexico Department of Transportation, et al, NM44 Corridor Agreement, 1998.
[5] New Mexico Department of Transportation and Mesa PDC, US550 Annual ESAL Reports, 2002 – 2006.

New Mexico Department of Transportation RESEARCH BUREAU 7500B Pan American Freeway NE PO Box 94690 Albuquerque, NM 87199-4690 Tel: (505) 841-9145


![[AGENCY] CONTRACTS AND PROCUREMENT POLICY AND PROCEDURES ...dot.state.nm.us/content/dam/nmdot/Transit_Rail/ProcurementManual... · [agency] contracts and procurement policy and procedures](https://static.fdocuments.net/doc/165x107/5ae0bbb27f8b9a6e5c8dd48a/agency-contracts-and-procurement-policy-and-procedures-dotstatenmuscontentdamnmdottransitrailprocurementmanualagency.jpg)