

N. Laskaris
44
N. Laskaris N. Laskaris
-
Upload
thane-garrison -
Category
Documents
-
view
20 -
download
1
description
N. Laskaris. N. Laskaris. ENTER-2001. [ IEEE SP Magazine, May 2004 ]. N. Laskaris, S. Fotopoulos, A. Ioannides. Analysing Event-Related Dynamics. new tools for Mining Information from - PowerPoint PPT Presentation
Transcript of N. Laskaris

N. LaskarisN. Laskaris

N. LaskarisN. Laskaris
[ IEEE SP Magazine, May 2004 ]
N. Laskaris,
S. Fotopoulos, A. Ioannides
ENTER-2001

new toolsnew tools
for Mining Information from for Mining Information from multichannel encephalographic recordingsmultichannel encephalographic recordings
& applications& applications

What is Data Mining ?Data Mining ?
How is it applied ?
Why is it useful ?
What is the difficulty with single trials ?
How can Data MiningData Mining help ?
Which are the algorithmic steps ?
Is there a simple example ?
Is there a more elaborate example ?
What has been the gain ?
Where one can learn more ?

What is Data MiningData Mining &
Knowledge DiscoveryKnowledge Discovery in databases ?

Data MiningData Mining is “the data-driven discovery and
modeling of hidden patterns in large volumes of data.”
It is a multidisciplinary field, borrowing and enhancing ideas from diverse areas such as statistics, image understanding, mathematical optimization, computer vision, and pattern recognition.
It is the process of nontrivialnontrivial extractionextraction of of implicitimplicit, previously unknown, and potentially useful information from voluminous datafrom voluminous data.

How is it applied in the context of
multichannel multichannel encephalographic recordingsencephalographic recordings ?

Studying Brain’s self-organization by monitoring the dynamic pattern
formation reflecting neural activity

Why is it a
potentially valuable methodology for analyzing
Event-RelatedEvent-Related recordings ?

The analysis of
Event-Related DynamicsEvent-Related Dynamics
aims at understanding the real-time processingreal-time processing of a stimulus
performed in the cortex
and demands tools able to deal with Multi-Trial dataMulti-Trial data
The traditional approach is based on identifying peaks in the averaged signal
-It blends everything
happened during the
recording

What is the difficulty in analyzing Single-TrialSingle-Trial responses ?

At the single-trial level, we are facing
ComplexComplex SpatiotemporalSpatiotemporal DynamicsDynamics
How can Data MiningData Mining help to circumvent this complexity and reveal
the underlying brain mechanisms ?

directed queries are formed in the Single-Trial data which are then summarized
using a very limited vocabulary of information granules
that are easily understood, accompanied by well-defined semantics and help express relationships existing in the data

The information abstractioninformation abstraction is usually accomplished via clusteringclustering techniques and followed by a proper visualization schemevisualization scheme that can readily spot interesting events and trends in the experimental data.
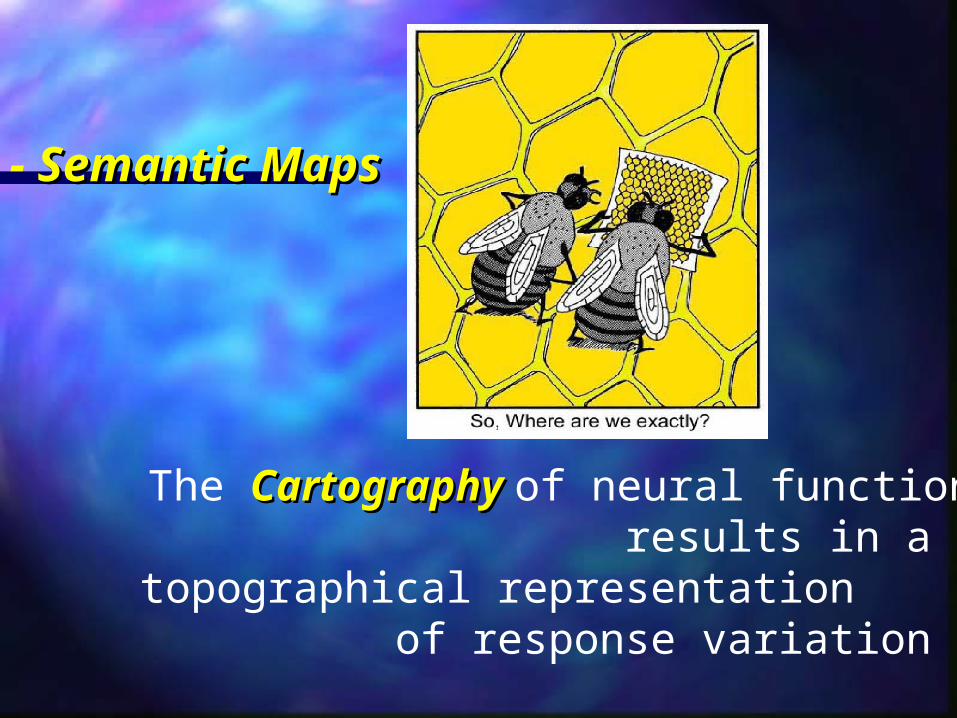
- Semantic Semantic MapsMaps
The CartographyCartography of neural function results in a topographical representation of response variation
and enables the virtual navigation in the encephalographic database

Which are the intermediate
algorithmic steps ?
A Hybrid approach A Hybrid approach
Pattern AnalysisPattern Analysis & Graph TheoryGraph Theory

Step_Step_ the spatiotemporal dynamics are decomposed
Design of the spatial filterspatial filter used to extract
the temporal patternstemporal patterns conveying the
regional response dynamics

Step_Step_ Pattern AnalysisPattern Analysis of the extracted ST-patterns
Interactive Interactive Study Study of of
pattern variabilitypattern variability
Feature Feature extractioextractio
nn
Embedding Embedding in Feature in Feature
SpaceSpace
Clustering & Clustering & Vector Vector
QuantizationQuantization
Minimal Spanning Minimal Spanning TreeTree of the of the
codebookcodebook
MST-ordering MST-ordering of the code of the code
vectors vectors
Orderly Orderly presentation presentation
of response of response variabilityvariability


Step_Step_ Within-group Analysis of regional response dynamics
-

Step_Step_ Within-group Analysis of multichannel single-trial signals

Step_Step_ Within-group Analysis of single-trial MFT-solutionsMFT-solutions

Is there a simple example?
[ Laskaris & Ioannides, Clin. Neurophys., 2001 ]

Repeated stimulationRepeated stimulation
120 trials, binaural-stimulation [ 1kHz tones, 0.2s, 45 dB ], ISI: 3sec, passive listening
Task : to ‘‘explain’’ the averaged M100-response

The M100-peak emerges from the stimulus-induced
phase-resetting
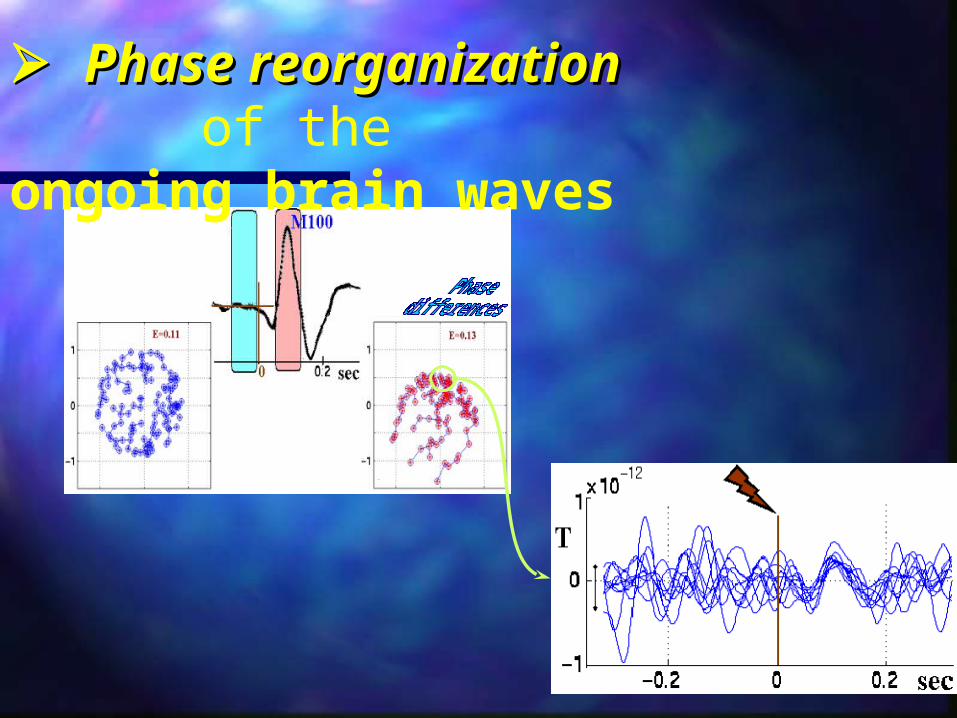
Phase reorganizationPhase reorganization of the ongoing brain waves

Is there a more elaborate example?
[ Laskaris et al., NeuroImage, 2003 ]

A study of A study of global firing global firing patternspatterns
Their relation Their relation with localized with localized sources sources

and ….and ….
initiating initiating eventsevents

240 trials, pattern reversal, 4.5 deg , ISI: 0.7 sec, passive viewing
Single-Trial data in unorganized format

Single-Trial data summarized via ordered prototypes reflecting the variability of regional response dynamics
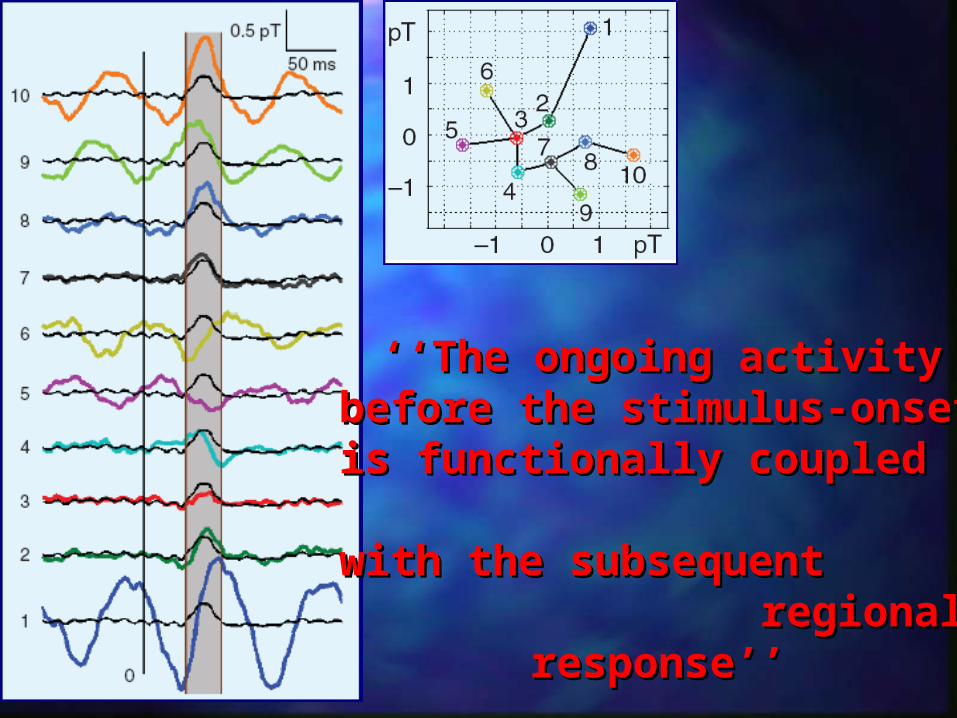
‘‘‘‘The ongoing activity The ongoing activity before the stimulus-onsetbefore the stimulus-onset
is functionally coupled is functionally coupled with the with the
subsequent subsequent regional response’’regional response’’
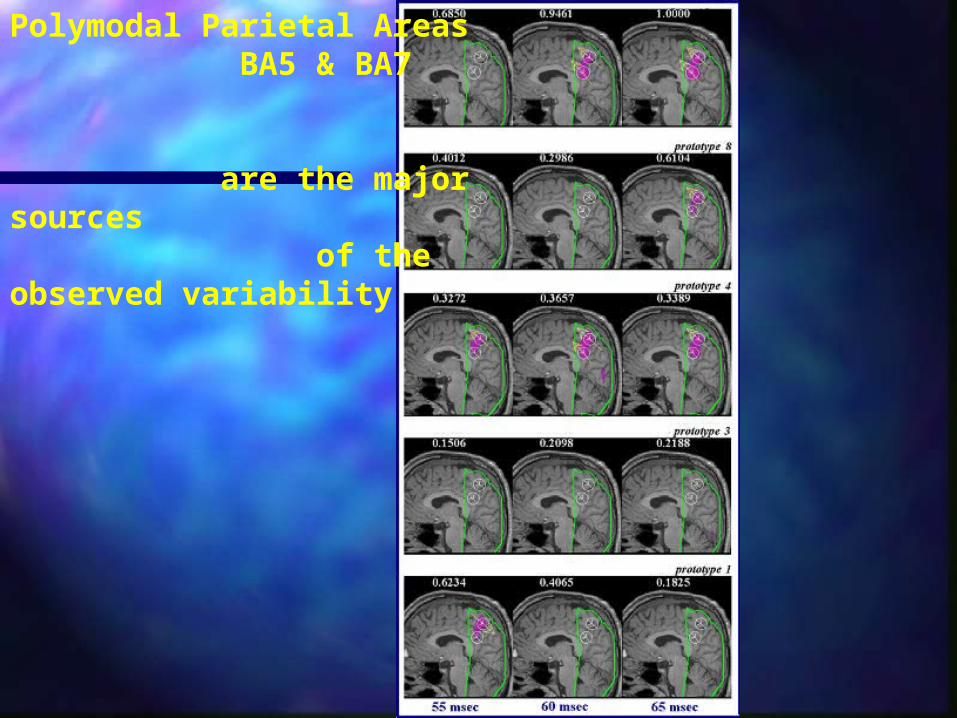
Polymodal Parietal Areas BA5 & BA7 are the major sources of the observed variability
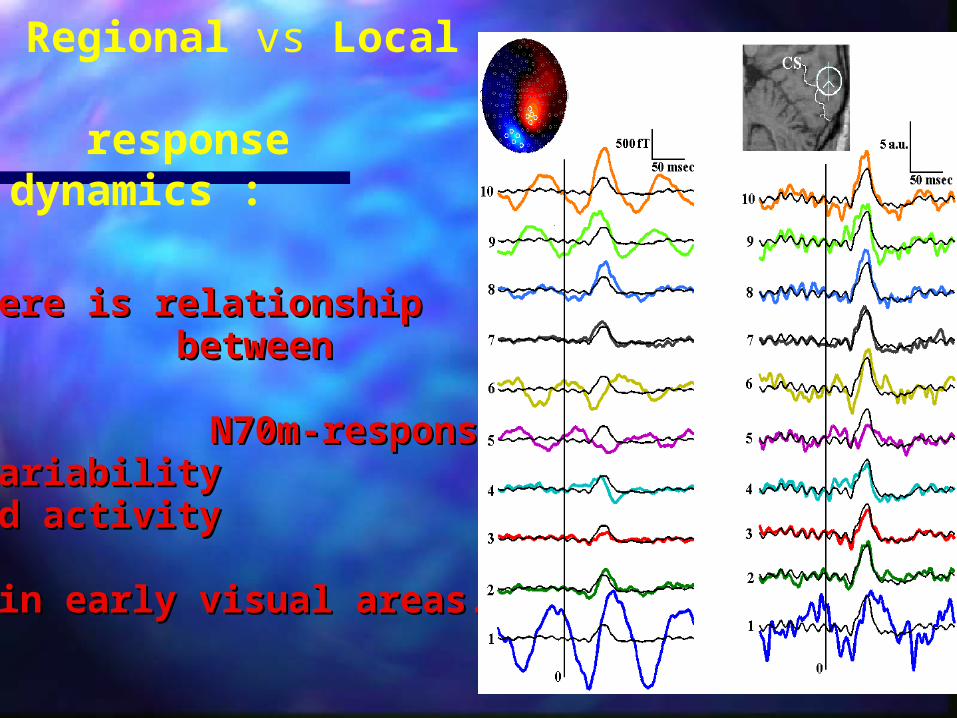
There is relationship There is relationship between between N70m-response variability N70m-response variability
and activity and activity in early visual areas.in early visual areas.
Regional vs Local response dynamics :

What has been the lesson, so far, from the analysis of Event-Related Dynamics ?
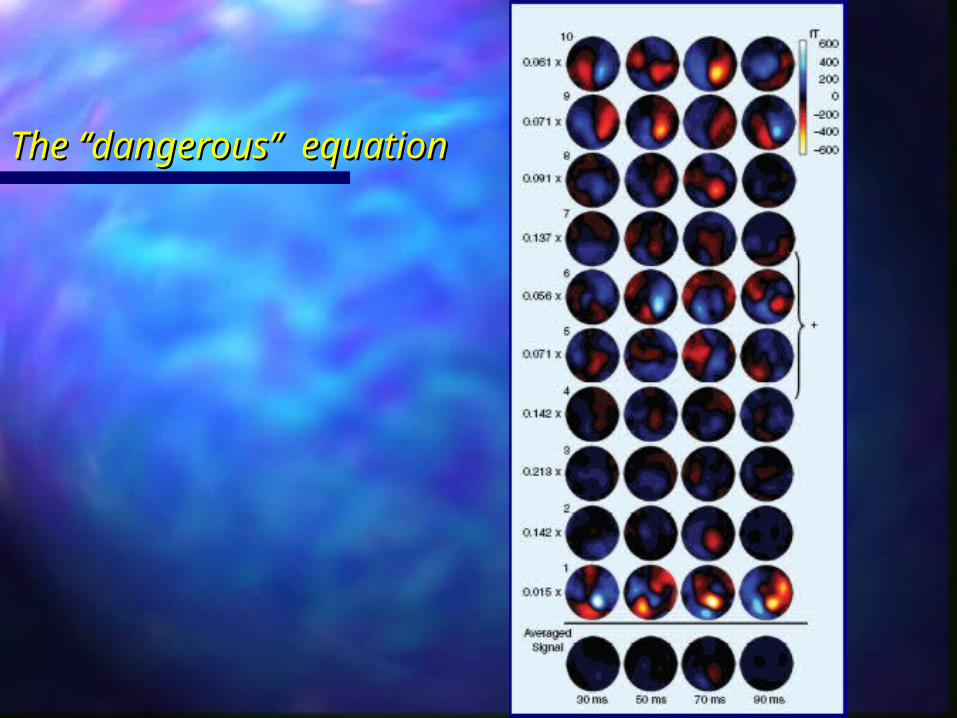
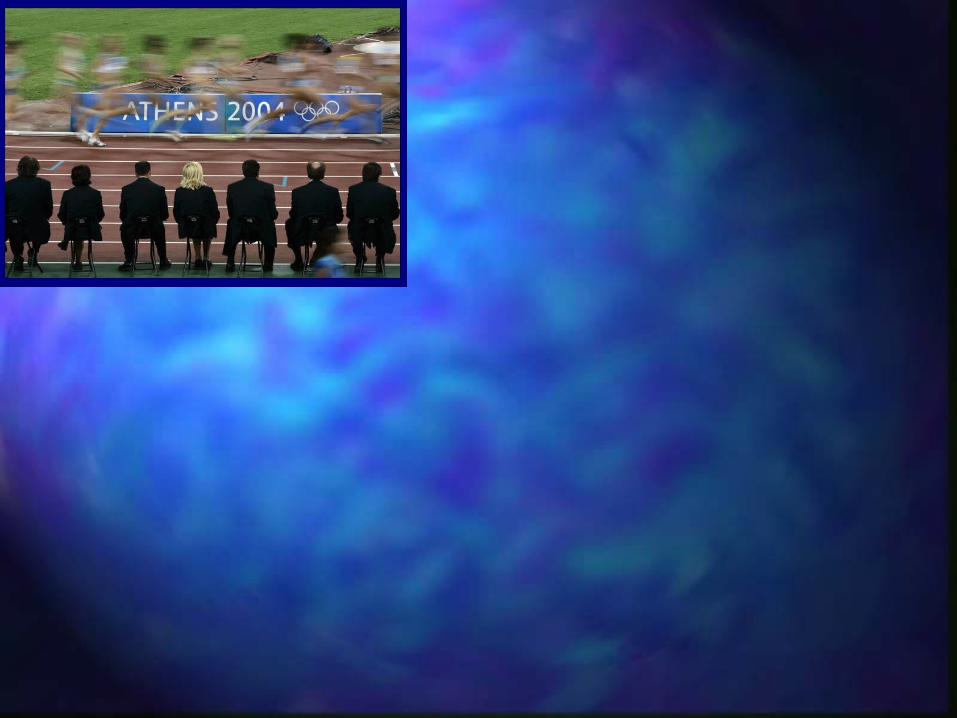
The ‘‘dangerous’’ equationThe ‘‘dangerous’’ equation

Where one can learn more
about Mining Mining InformationInformation from
encephalographic recordings ?
http://www.hbd.brain.riken.jp/
http://www.humanbraindynamics.com


![q]Ý0m*l4mxl4`ó[ S:WßVóÿ `ó[ gY' j!ÿ...N N N N N N N N N N N N N N N N N N N N N N N N N N N N N N N N N N N N N N N N N N N N N N N N N N N N N N N N N N N N N N N N N N N N](https://static.fdocuments.net/doc/165x107/61279995a965a5482e5f8607/q0ml4mxl4-swv-gy-j-n-n-n-n-n-n-n-n-n-n-n-n-n-n-n-n-n.jpg)


![N. Laskaris. [ IEEE SP Magazine, May 2004 ] N. Laskaris, S. Fotopoulos, A. Ioannides ENTER-2001.](https://static.fdocuments.net/doc/165x107/56649e495503460f94b3d272/n-laskaris-ieee-sp-magazine-may-2004-n-laskaris-s-fotopoulos-a.jpg)


