N IST SP 1230-3 Community Resilience-Focused Technical ...
134
N IST SP 1230-3 Community Resilience-Focused Technical Investigation of the 2016 LUMBERTON, NORTH CAROLINA FLOOD COMMUNITY IMPACT AND RECOVERY FOLLOWING SUCCESSIVE FLOOD EVENTS EDITORS Jennifer Helgeson Sara Hamideh Elaina J. Sutley This publication is available free of charge from: https://doi.org/10.6028/NIST.SP.1230-3
Transcript of N IST SP 1230-3 Community Resilience-Focused Technical ...

N I S T SP 1 2 3 0 - 3 Community Resilience-Focused Technical Investigation of the
2016 LUMBERTON, NORTH CAROLINA FLOOD C O M M U N ITY IM PA C T A N D R EC O VER Y
FO LLO W IN G SU C C ESSIVE FLO O D EVEN TS
E D I T O R S Jennifer Helgeson Sara Hamideh Elaina J. Sutley This publication is available free of charge from: https://doi.org/10.6028/NIST.SP.1230-3

NIST Special Publication 1230-3 The Lumberton, North Carolina Flood of 2016, Wave 3: A Community Impact and
Recovery-Focused Technical Investigation Following Successive Flood
Events
Editors
Jennifer Helgeson
National Institute of Standards and Technology
Sara Hamideh Stony Brook University
Elaina J. Sutley
University of Kansas
This publication is available free of charge from: https://doi.org/10.6028/NIST.SP.1230-3
October 2021
U.S. Department of Commerce Gina M. Raimondo, Secretary
National Institute of Standards and Technology
James K. Olthoff, Performing the Non-Exclusive Functions and Duties of the Under Secretary of Commerce for Standards and Technology & Director, National Institute of Standards and Technology

ii
Disclaimer No. 1
Certain commercial entities, equipment, or materials may be identified in this document in order to describe an experimental procedure or concept adequately. Such identification is not intended to imply recommendation or endorsement by the National Institute of Standards and Technology, nor is it intended to imply that the entities, materials, or equipment are necessarily the best available for the purpose.
Disclaimer No. 2
The information contained herein is provided as a public service with the understanding that Colorado State University makes no warranties, either expressed or implied, concerning the accuracy, completeness, reliability, or suitability of the information. Nor does Colorado State
University warrant that the use of this information is free of any claims of copyright infringement.
Disclaimer No. 3
In compliance with the Paperwork Reduction Act, NIST personnel did not participate in the collection or analysis of household survey data. NIST personnel did participate in the field inspections of damaged residential housing and collected data on the event and subsequent response by public officials and private sector entities.
Disclaimer No. 4 All maps in the report, except where noted, were created using ESRI ArcGIS.

iii
Author Credits and Acknowledgements Each section within each chapter of this report was prepared and edited by a number of different authors from the field study team and leadership. In addition, the entire study team is grateful to all those in and around Lumberton and within the State of North Carolina who shared their knowledge and perspective through interviews and meetings with our researchers. The field study team acknowledges the generous contributions to this study and associated reports.
Chapter 1: Elaina Sutley, Sara Hamideh, Jennifer Helgeson, Maria Dillard, John van de Lindt, Walter Gillis Peacock, and Judith Mitrani-Reiser
Chapter 2 and associated Appendices Authorship: Shane Crawford, Elaina Sutley, Trung Do, Omar Nofal, Tori Johnson, Maria Watson, Jonathan Weigand
Chapter 3 and associated Appendices Authorship: Sara Hamideh, Elaina Sutley, Jarrod Loerzel, Nathanael Rosenheim, Donghwan Gu
Chapter 4 and associated Appendices Authorship: Jennifer Helgeson, Maria Watson, Juan F. Fung
Chapter 5 Authorship: Elaina Sutley, Jennifer Helgeson, Sara Hamideh
Funding Acknowledgement
This research was conducted as part of the NIST Center of Excellence for Risk-Based Community Resilience Planning under Cooperative Agreement 70NANB15H044 (Wave 3 site visit) and 70NANB20H008 (Data processing/reporting) between the National Institute of Standards and Technology (NIST) and Colorado State University. The content expressed in this report are the views of the authors and do not necessarily represent the opinions or views of NIST or the U.S Department of Commerce.
Suggested Citation
Helgeson, J., Hamideh, S., and Sutley, E.J. (Eds.). (2021). Community Resilience-Focused Technical Investigation of the 2016 Lumberton, NC Flood: Community Impact and Recovery Following Successive Flood Events. NIST Special Publication 1230-3.
Field Study Team Members
The Lumberton Wave 3 Field Study Team consisted of 20 people. As described in this report, Wave 3 consisted of three trips to Lumberton. There were four major teams and many people participated on more than one team; these included the Damage Assessment Team, Housing Team, the Business Team, and the Public Sector Team. Team affiliations are listed as of the time of Wave 3 (April 2019).

iv
Field Study Leadership Elaina J. Sutley, University of Kansas Sara Hamideh, Stony Brook University Jennifer F. Helgeson, National Institute of Standards and Technology Field Study Team Members Wave 3a Crawford, Shane, National Institute of Standards and Technology Do, Trung, University of Louisiana Lafayette Graettinger, Andrew, University of Alabama Johnson, Victoria, U.S. Naval Academy Nofal, Omar, Colorado State University Sutley, Elaina, University of Kansas Watson, Maria, Texas A&M University Weigand, Jonathan, National Institute of Standards and Technology Wave 3b Hamideh, Sara, Stony Brook University Khajehei, Sayma, University of Utah Wave 3c Crawford, Shane, National Institute of Standards and Technology Dillard, Maria, National Institute of Standards and Technology Do, Trung, University of Louisiana Lafayette Fung, Juan, National Institute of Standards and Technology Greathouse, Allison, Iowa State University Gu, Donghwan, Texas A&M University Hamideh, Sara, Stony Brook University Harrison, Kenneth, National Institute of Standards and Technology Helgeson, Jennifer, National Institute of Standards and Technology Khajehei, Sayma, University of Utah Loerzel, Jarrod, National Institute of Standards and Technology Rosenheim, Nathanael, Texas A&M University Sabarethinam, Kameshwar, Louisiana State University Seoul, Kijin, Texas A&M University Sutley, Elaina, University of Kansas Tobin, Jennifer, University of Colorado Boulder van de Lindt, John, Colorado State University Watson, Maria, Texas A&M University Other Contributors Mitrani-Reiser, Judith, National Institute of Standards and Technology Peacock, Walter, Texas A&M University Van Zandt, Shannon, Texas A&M University Xiao, Yu, Portland State University
v
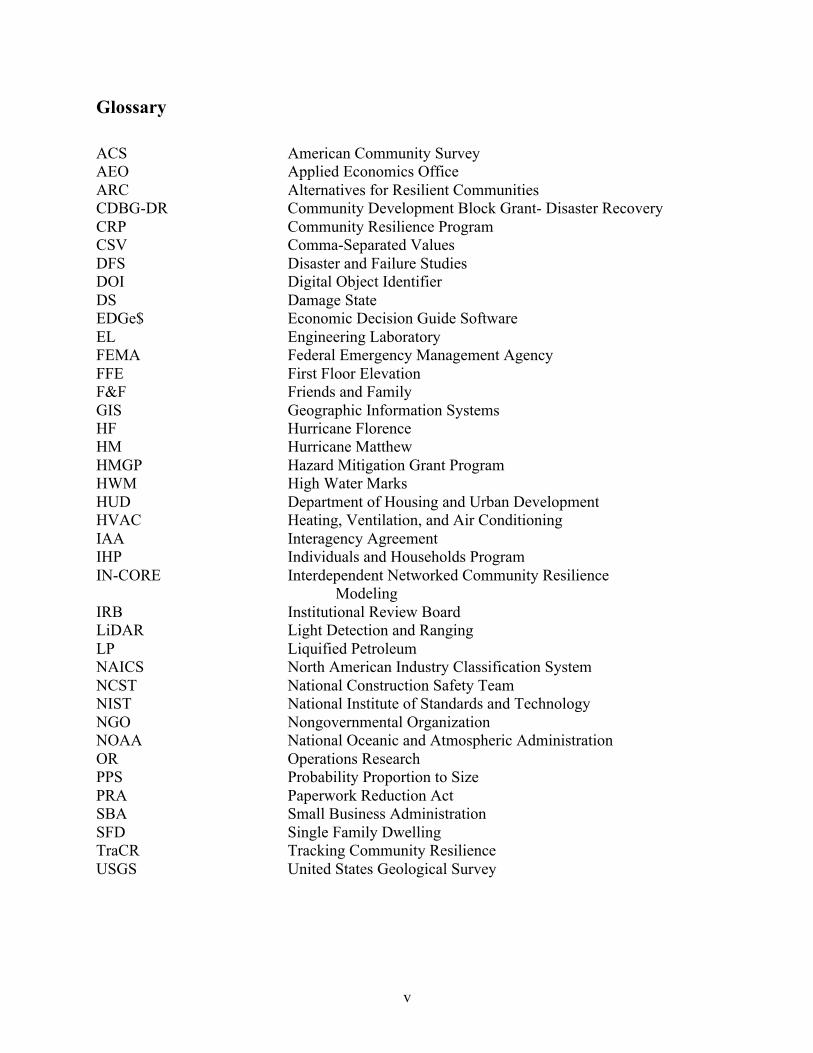
Glossary ACS American Community Survey AEO Applied Economics Office ARC Alternatives for Resilient Communities CDBG-DR Community Development Block Grant- Disaster Recovery CRP Community Resilience Program CSV Comma-Separated Values DFS Disaster and Failure Studies DOI Digital Object Identifier DS Damage State EDGe$ Economic Decision Guide Software EL Engineering Laboratory FEMA Federal Emergency Management Agency FFE First Floor Elevation F&F Friends and Family GIS Geographic Information Systems HF Hurricane Florence HM Hurricane Matthew HMGP Hazard Mitigation Grant Program HWM High Water Marks HUD Department of Housing and Urban Development HVAC Heating, Ventilation, and Air Conditioning IAA Interagency Agreement IHP Individuals and Households Program IN-CORE Interdependent Networked Community Resilience
Modeling IRB Institutional Review Board LiDAR Light Detection and Ranging LP Liquified Petroleum NAICS North American Industry Classification System NCST National Construction Safety Team NIST National Institute of Standards and Technology NGO Nongovernmental Organization NOAA National Oceanic and Atmospheric Administration OR Operations Research PPS Probability Proportion to Size PRA Paperwork Reduction Act SBA Small Business Administration SFD Single Family Dwelling TraCR Tracking Community Resilience USGS United States Geological Survey

vi
Executive Summary In early October 2016 Hurricane Matthew crossed North Carolina as a category 1 hurricane with some areas receiving 15 in. to 18 in. (38 cm to 46 cm) of rainfall on already saturated soil. The NIST-funded Center for Risk-Based Community Resilience Planning (Center) teamed with researchers from NIST’s Community Resilience Program, Disaster and Failure Studies Program, and the Applied Economics Office to conduct a quick response field study focused on the small city of Lumberton, NC and the flooding experienced from the Lumber River. Approximately one year later, the Center and NIST team returned to Lumberton to document and better understand Lumberton’s recovery progress with an emphasis on housing, businesses, schools, community and state-level decisions, and the intersection of these sectors in community recovery. The longitudinal study of Lumberton continued, with the inclusion of a damage investigation after Lumberton was affected again in September 2018 by Hurricane Florence. The Hurricane Florence impact and recovery investigation was completed approximately six months later. Longitudinal investigations are critical for the study of community resilience so that impact, decision, and recovery data are comparable across time and inferences may be made on the effects of decisions and impacts from one period on those in future periods. These data and analyses are reported here to support guidance and recommendations on what is needed to improve communities’ ability to recover quickly and equitably, and what attributes make communities more resilient to natural hazards in general. This third in a series of community resilience-focused field studies is presented herein as Wave 3 of the on-going Lumberton, North Carolina Flood of 2016 Report Series. Recall that Wave 1 documented the initial physical and socio-economic impacts of the flooding on the community, particularly for housing, households, schools, and other parts of the public sector. Wave 2 began the assessment of recovery from Hurricane Matthew with continued focus on housing, households, schools, parts of the public sector; a new focus area on business impacts and recovery was added. In the midst of recovering from Hurricane Matthew, the Lumberton community was flooded again by Hurricane Florence in 2018. Thus, the Wave 3 field study was conducted across three periods, taking place in September 2018, December 2018, and April 2019. There were three major objectives in Wave 3 data collection and analysis: first, to document the initial damage caused by Hurricane Florence to the longitudinal sample and community of Lumberton; second, to document the point in time progress of Lumberton’s recovery from both Hurricanes Matthew and Florence; third, to understand individual and collective capacity gained from the experience with Hurricane Matthew that helped many to be better prepared for Hurricane Florence. Wave 3 data collection dealt primarily with the impact and recovery process of the most heavily affected housing and businesses through an initial damage investigation and two systematic surveys, as well as interviews and meetings with selected public officials. Wave 3 additionally included a special trip to interview public housing residents and city-level decision-makers at a critical point when the City was making rebuilding decisions on the damaged public housing; this portion of Wave 3, termed Wave 3b, is not covered in this report. Analysis revealed that much of Lumberton had physically repaired structural damage from Hurricane Matthew at the time of Hurricane Florence, but housing recovery for some households and economic recovery was on-going and compounded by the second extreme flood event in two years. Recovery from both events is likely to be on-going for years to come. Also, the Wave 3 surveys revealed increased individual mitigation and

vii
preparedness measures employed, including but not limited to more evacuations, physical changes that reduced vulnerability of houses and businesses, more preparation and awareness measures, and faster cleanup immediately after Hurricane Florence. In Wave 3, the team returned to the same housing units surveyed in Waves 1 and 2, and businesses from Wave 2 to first assess physical damage caused by Hurricane Florence in September 2018, and then in April 2019 to continue to assess continued recovery from Hurricane Matthew, learn about disruption and recovery from Hurricane Florence, and document capacity-enhancing measures. The Wave 3a damage surveys revealed approximately two-thirds of the sampled housing units that were damaged after Hurricane Florence experienced more severe damage after Hurricane Matthew. In total, approximately 18% of sampled housing units and 15% of sampled businesses were damaged by Hurricane Florence. The fact that significant proportions of our sampled housing and businesses were not damaged was due to the nature of the sample design, where many buildings were outside of the Hurricane Florence inundation area, the differences in the two flood events, and noted differences in the city’s preparation for Hurricane Florence compared to Hurricane Matthew. The Wave 3a team observed different mitigation actions that had had been taken at the city-level, as well as by individuals. At the city-level, a system of three berms was built at the I-95/CSX underpass in the days leading up to Hurricane Florence. This represented a more concerted effort to mitigate flooding than what had been done leading up to Hurricane Matthew in 2016, and was likely due to lessons learned from the Hurricane Matthew experience. Additionally, the Lumberton Water Plant and an electrical power network substation were surrounded by temporary berms to keep flood waters out. Hydraulic pumps were placed over the I-95/CSX berm system, east and south of the levee. Collectively, these mitigation actions likely improved outcomes from the flooding experience after Hurricane Florence, they also influenced the measurement science approaches adopted by the field study team. Situational flags were incorporated into the data collection smartphone application to record whether it appeared housing units and businesses had been reoccupied since Hurricane Matthew, and whether the highwater mark was more likely a relic of Hurricane Matthew than caused by Hurricane Florence. The field study team also noticed households and businesses took individual-level preparedness actions, and responded differently, more resiliently, to Hurricane Florence as compared to Hurricane Matthew. These actions included elevating contents inside the buildings off of the floor and into upper stories or high shelves, elevating exterior air conditioning condenser units off of the ground onto pedestals, relocating duct systems from crawlspaces to attics, and evacuating. While individual-level mitigation measures were only captured anecdotally in Wave 3a, they informed survey design for Wave 3c. In the surveys conducted during Wave 3c there was systematic collection of data about mitigation to understand if and how widespread these actions were and to understand if and how they may have reduced property loss and collective damage. The Wave 3c housing surveys documented that 33 % of households who completed the survey reported still having unrepaired damage from Hurricane Matthew at the time of Hurricane Florence. Because of Hurricane Florence, nearly two-thirds of respondents were dislocated from their home for at least one day, where the majority of households who responded to the survey returned home within two weeks. Homeowners and occupants of single-family dwellings were dislocated for longer periods, on average, compared to renters and occupants of multi-family dwellings. Although recovery was still an active process, 85 % of respondents reported intentions of remaining in their home for the next year, and more than 80 % indicated having the same access

viii
to school and grocery stores after Hurricane Florence compared to before Hurricane Matthew. Similar to observations in Wave 2, which was conducted one year after Hurricane Matthew, in Wave 3c small proportions of respondents received insurance payouts and other recovery resources. The Wave 3c survey asked about positive impacts of the two events as well, where approximately one-third of respondents indicated increased community involvement and approximately 40 % indicated increased contact with neighbors and extended family since before Hurricane Matthew. Both changes have positive impacts towards human capacity and social capital, and thereby community-level resilience. Many households made a disaster plan with their household members before Hurricane Florence. After Hurricane Florence, 40 % more households elevated their hot water heater and/or HVAC, 20 % more households elevated interior contents to protect them from flood waters, 32 % had their home assessed by a structural engineer, and 60 % re-routed ductwork from below the home’s floor and into the attic space. Longitudinal comparisons are provided throughout Chapter 3. Across Waves 1, 2, 3a, and 3c, our data show an increasing number of abandoned homes in Lumberton since Hurricane Matthew. The Wave 3c business survey data documented that 17 % of businesses that completed the survey reported unrepaired damage from Hurricane Matthew at the time of Hurricane Florence. Due to Hurricane Florence impacts, 80 % of businesses reported losing electricity for at least one day, which was the most frequently reported utility loss. Furthermore, over 40 % of businesses experienced interrupted operations for at least one week. When asked to report their perception of their recovery, over half of businesses (58 %) reported being fully recovered relative to their state prior to Hurricane Florence. Additionally, the majority of businesses (78 %) reported no change in revenue as a result of Hurricane Florence. The Wave 3c survey asked business representatives to indicate mitigation and preparedness actions they have taken. Some of these are relevant only to those who own their business facility (i.e., floodproofing of building, secured a secondary storage location, structural assessment of building). Fewer businesses reported taking these actions compared to housing with the most frequent reported as flood proofing building (25 %), the majority of whom did so between before Hurricane Matthew (10 %) or Hurricane Matthew and Hurricane Florence (14 %). The business survey also asked about mitigation, adaptation, and preparedness measures relevant to all respondents (renters and owners of facilities). There had been much greater uptake of these actions since the Hurricanes, e.g., 48 % of businesses reported adopting strategies to stay informed of weather warnings and 47 % have an emergency plan. Longitudinal comparisons are provided throughout Chapter 4. Across Waves 2, 3a, and 3c our data show the fragility of recovery. After Hurricane Matthew (Wave 2), most respondents reported being mostly recovered. Immediately before Hurricane Florence, most respondents reported the status of their business as between mostly recovered and fully recovered; however, after Florence, this drops back down to mostly recovered (Wave 3c). Overall, the field team concludes that two years after Hurricane Matthew, and six months after Hurricane Florence flooded Lumberton, recovery was underway with a long road of continued recovery ahead for the community of Lumberton. This Wave 3 report summarizes the longitudinal study design and the results obtained through the damage investigation immediately after Hurricane Florence, and the housing and business surveys. Collectively, these findings quantitatively and qualitatively document the impacts and compounded recovery process for the community of Lumberton, NC. The report provides conclusions from all data collection efforts, and next steps for the longitudinal study.

ix
TABLE OF CONTENTS
CHAPTER 1 INTRODUCTION ............................................................................................. 1
1.1 The NIST Center of Excellence for Risk-Based Community Resilience Planning .............. 1 1.2 The Engineering Laboratory at NIST ................................................................................... 2
1.3 Overview of Hurricane Matthew and Wave 1 (2016) and Wave 2 (2018) Field Studies .... 4 1.4 Overview of the Wave 3 (2018-2019) Lumberton Field Study ............................................ 7 CHAPTER 2 PHYSICAL DAMAGE OBSERVATIONS FOLLOWING HURRICANE FLORENCE .............................................................................................................................. 9
2.1 Goals and Objectives ............................................................................................................ 9 2.2 Comparing the 2016 and 2018 Lumberton Floods ............................................................... 9
2.3 Sampling ............................................................................................................................. 13 2.4 Survey Instrument ............................................................................................................... 14
2.5 Data Collection Methodology ............................................................................................. 18 2.6 Survey Results .................................................................................................................... 19
2.7 Observations of the City’s Collective Preparation and Response ...................................... 22 2.7.1 Berm System Built at I-95/CSX Underpass ................................................................ 23
2.7.2 Flood Mitigation for Critical Infrastructure Systems .................................................. 27 2.7.3 Hydraulic Pumps ......................................................................................................... 28 2.8 Observations of Households and Businesses: Individual-Level Preparation and Response ................................................................................................................................... 29
CHAPTER 3 HOUSING DISRUPTION AND RECOVERY ............................................ 31 3.1 Goals and Objectives .......................................................................................................... 31
3.2 Sampling Procedure ............................................................................................................ 31 3.3 Survey Instrument ............................................................................................................... 32
3.3.1 Establishing Occupancy and Study Eligibility ............................................................ 33 3.3.2 State of Repair following Hurricane Matthew ............................................................. 33
3.3.3 Initial Damage, Utility Outage, and Repair Progress following Hurricane Florence .. 34 3.3.4 Household Dislocation after Hurricane Florence ........................................................ 34
3.3.5 Housing Recovery In-Place after Hurricanes Matthew and Florence ......................... 34 3.3.6 Educational Recovery .................................................................................................. 35
3.3.7 Preparedness, Mitigation, and Social Capital .............................................................. 35 3.3.8 Household Socio-Demographic Characteristics .......................................................... 36
3.4 Data Collection Methodology ............................................................................................. 36

x
3.4.1 Daily Operations .......................................................................................................... 36 3.4.2 Data Management ........................................................................................................ 37
3.4.3 Data Cleaning Process ................................................................................................. 38 3.5 Housing Survey Results ...................................................................................................... 40
3.5.1 Survey Response Rates ................................................................................................ 40 3.5.2 Findings: Hurricane Florence Flood Impacts and Recovery ....................................... 41
CHAPTER 4 BUSINESS INTERRUPTION AND RECOVERY ...................................... 60 4.1 Goals and Objectives .......................................................................................................... 60
4.2 Sampling Procedure ............................................................................................................ 60 4.3 Survey Instrument ............................................................................................................... 63
4.4 Data Collection Methodology ............................................................................................. 65 4.4.1. Field Procedures ........................................................................................................ 65
4.4.2. Data Entry and Cleaning ............................................................................................ 66 4.5 Results ................................................................................................................................. 67
4.5.1 Hurricane Matthew Recovery Follow-up ................................................................... 67 4.5.2 Hurricane Florence Damage and Interruption ............................................................ 70
4.5.3 Hurricane Florence Recovery ..................................................................................... 74 4.5.4 Business Information and Respondent Details ........................................................... 77
4.5.5 Longitudinal Trends .................................................................................................... 79 CHAPTER 5 CONCLUSIONS AND NEXT STEPS .......................................................... 86
5.1 Conclusions for Damage Measurement following Successive Flood Events .................... 86 5.2 Conclusions for Housing Disruption and Recovery ........................................................... 87
5.3 Conclusions for Business Interruption and Recovery ........................................................ 88 5.4 Next Steps for the Lumberton Longitudinal Field Study ................................................... 89
REFERENCES ....................................................................................................................... 91 APPENDIX 2A ..................................................................................................................... A-1
APPENDIX 2B ..................................................................................................................... A-4 APPENDIX 2C ..................................................................................................................... A-8
APPENDIX 2D ..................................................................................................................... A-9 APPENDIX 3A ................................................................................................................... A-10
APPENDIX 3B ................................................................................................................... A-15 APPENDIX 3C ................................................................................................................... A-16
APPENDIX 4A ................................................................................................................... A-17

xi
APPENDIX 4B ................................................................................................................... A-25 APPENDIX 4C ................................................................................................................... A-26

xii
LIST OF TABLES Table 2-1. Flood-based damage state descriptions for residential buildings (van de Lindt et al. 2018) .............................................................................................................. 16 Table 2-2. Flood-based damage state descriptions for commercial buildings (Xiao et al., 2020) .......................................................................................................................... 17 Table 3-1. Housing survey response rates ..................................................................................... 41
Table 3-2. Hurricane Matthew-induced damage to home ............................................................. 42 Table 3-3. Hurricane Florence-induced damage to home ............................................................. 42
Table 3-4. Hurricane Florence-induced utility outage and duration by tenancy ........................... 44 Table 3-5. Hurricane Florence-induced cellular and landline phone outage and duration by tenancy ........................................................................................................................................... 45 Table 3-6. Household dislocation and duration by housing type following Hurricane Florence ........................................................................................................................ 47 Table 3-7. External influences on decision to return home after Hurricane Florence ................... 48
Table 3-8. Change in household access to essential needs after Hurricane Matthew ................... 50 Table 3-9. Insurance coverage, insurance payment receipt, and timing after Hurricane Florence ........................................................................................................................ 51 Table 3-10. Household recovery resource inquiries ...................................................................... 52
Table 3-11. Resources received and timing of receipt after Hurricane Matthew .......................... 52 Table 3-12. Resources received and timing of receipt after Hurricane Florence .......................... 53
Table 3-13. Covering repair and replacement costs ...................................................................... 53 Table 3-14. Mitigation and preparedness strategies taken by households before Hurricane Florence and at the time of the wave 3c survey (after Hurricane Florence) ................................. 54 Table 3-15. Change in community involvement and contact with neighbors and extended family since Hurricane Matthew ............................................................................................................... 55 Table 3-16. Race and ethnicity of surveyed households ............................................................... 56
Table 3-17. Maximum household member education level of surveyed households ................... 56 Table 3-18. Annual household income of surveyed households ................................................... 57
Table 4-1. Sector distribution of sample ....................................................................................... 62 Table 4-2. Operating status of the business sample ...................................................................... 67
Table 4-3. Recovery status from Hurricane Matthew immediately before Hurricane Florence... 68 Table 4-4. Self-reported financing sources used for recovery from the impacts of Hurricane Matthew (n=49) ............................................................................................................................. 68 Table 4-5a. Businesses that still required repairs from Hurricane Matthew impacts immediately before Hurricane Florence ............................................................................................................. 69

xiii
Table 4-5b. Percent of remaining repairs still need to be completed for those that still require some sepairs from Hurricane Matthew pre-Hurricane Florence ................................................... 69 Table 4-6. Extent to which Hurricane Florence affected ongoing business recovery from Hurricane Matthew ........................................................................................................................ 70
Table 4-7. Damage states reported by the businesses resulting from Hurricane Florence ............ 70 Table 4-8. Percent of businesses reporting utilityl and the number of days of disruption resulting from Hurricane Florence ................................................................................................ 71 Table 4-9. Self-reported issues for employees trying to get to the business following Hurricane Florence ........................................................................................................................ 72 Table 4-10. Importance of decisions of surrounding businesses (those on the same block) to the decision for the business to remain open or to close ..................................................................... 74 Table 4-11. Business profitability change as a result of Hurricane Florence ................................ 74
Table 4-12. Business self-reported recovery status after Hurricane Florence ............................... 75 Table 4-13. Insurance coverage, claim receipt, and timing after Hurricane Florence .................. 76
Table 4-14. Assistance requested and received by businesses ...................................................... 77 Table 4-15. Businesses’ self-reported federal cassifications ......................................................... 78
Table 4-16. Businesses’ self-reported ownership structure ahead of Hurricane Florence ............ 78 Table 4-17. Race and ethnicity of surveyed business owners/managers ....................................... 79 Table 4-18. Mitigation, adaptation, and preparedness measures for respondents that own the business premises/storefront .......................................................................................................... 80
Table 4-19. Mitigation, adaptation, and preparedness measures for all respondents .................... 81

xiv
LIST OF FIGURES Figure 1-1. Path and intensity timeline of Hurricane Matthew ....................................................... 5
Figure 1-2. Path and intensity timeline of Hurricane Florence ....................................................... 7 Figure 1-3. Lumberton Field Study timeline ................................................................................... 8 Figure 2-1. Map of Lumberton showing digitized differences in flood extents using NOAA aerial imagery, where solid orange polygons indicate areas flooded by Hurricane Matthew (HM) but not Hurricane Florence (HF), and dashed green polygons indicate areas flooded by Hurricane Florence (HF) but not Hurricane Matthew (HM). Dashed black rectangles indicate regions in the study area where the most difference in flooding occurred. .......................................................... 10 Figure 2-1a. Residential neighborhood located North of the Lumber River and West of Interstate 95 indicated by (a) in Figure 2-1. Imagery collected following Hurricane Matthew (NOAA 2016) and Hurricane Florence (NOAA 2018) has been edited to show flooded areas more clearly ................................................................................................................................... 11 Figure 2-1b. Mixed commercial and residential area South of the Lumber River bound by the levee and railroad indicated by (b) in Figure 2-1. Imagery collected following Hurricane Matthew (NOAA 2016) and Hurricane Florence (NOAA 2018) has been edited to show flooded areas more clearly .......................................................................................................................... 12 Figure 2-1c. Residential area South of the Lumber River and railroad indicated by (c) in Figure 2-1. Imagery collected following Hurricane Matthew (NOAA 2016) and Hurricane Florence (NOAA 2018) has been edited to show flooded areas more clearly ............................................. 13 Figure 2-2. Figure 2-2. SFD in Wave 3a, total sample size includes 567 housing units in the longitudinal sample, 46 housing units added in Wave 3a, and 229 businesses in the longitudinal sample ............................................................................................................................................ 14 Figure 2-3. Distribution of overall damage to residential and commercial buildings due to Hurricane Florence ........................................................................................................................ 20 Figure 2-4. Distribution of damage to interior contents of residential and commercial buildings due to Hurricane Florence ............................................................................................................. 21 Figure 2-5. Spatial distribution of difference in damage states assessed for residential buildings after Hurricanes Matthew and Florence ........................................................................................ 22 Figure 2-6. I-95/CSX Underpass seen in 2016: (a) from above; (b) from underneath, with flood prevention set in place. (NOAA 2016). Photograph shown in (b) reproduced with permissions from van de Lindt et al., 2018 ....................................................................................................... 23 Figure 2-7. Berm system deployed before Hurricane Florence: (a) Aerial overview with three berm sections marked (NOAA 2018); (b) Aerial overview with image locations and orientations (NOAA 2018); (c) Primary berm section; (d) LiDAR scan of primary berm section; (e) Secondary berm section; (f) LiDAR scan of secondary berm section; (g) Tertiary berm section; (h) LiDAR scan of tertiary berm section ....................................................................................... 25 Figure 2-8. Digital elevation model (USGS 2017) showing elevations in area of Lumberton South of the levee, with CSX railroad and levee locations noted ................................................. 27

xv
Figure 2-9. Lumberton water plant and an Electrical power network ubstation in the leveed area of Lumberton that flooded in: (a) 2016 from Hurricane Matthew (NOAA 2016) with (b) Close-up of Lumberton Water Plant, and (c) 2018 from Hurricane Florence (NOAA 2018) with (d) Close-up of the electrical substation .............................................................................................. 28 Figure 2-10. Examples of visible individual-level mitigation efforts in Lumberton implemented before the 2018 Flood; (a) Temporary perimeter flood protection around international retailer building (NOAA 2018); (b) Elevated air conditioning condensers in a public housing complex ........................................................................................................................... 30
Figure 3-1. Number of days to repair home .................................................................................. 43 Figure 3-2. Utility service outage time .......................................................................................... 46
Figure 3-3. Dislocation time after Hurricane Florence .................................................................. 47 Figure 3-4. Number of days household member missed work since the beginning of 2018 due to housing issues caused by flooding ................................................................................................ 49 Fig. 3-5. Sankey diagram depicting perceived or confirmed occupancy and abandonment of housing sample across Waves 1, 2, 3a, and 3c .............................................................................. 59 Fig. 3-6. Venn diagram with four sets depicting the number of housing units consistently recorded as abandoned in one or more waves ............................................................................... 59 Figure 4-1. Number of days until businesses to resumed operations after Hurricane Florence (in seven-day increments) ................................................................................................................... 73 Figure 4-2. Return of business capacity after Hurricane Florence (in 10 % increments), reported at the time of Wave 3c data collection .......................................................................................... 73 Figure 4-3. Business operational capacity: after Matthew, before Florence, and after Florence ......................................................................................................................................... 82 Figure 4-4. Average number of employees reported: before Matthew, between Matthew and Florence, and after Florence .......................................................................................................... 83 Figure 4-5. Recovery status after Matthew, between Matthew and Florence, and after Florence ......................................................................................................................................... 84 Figure 4-6. Business profitability: before Matthew, between Matthew and Florence, and after Florence ......................................................................................................................................... 85

Chapter 1: Introduction The longitudinal study of Lumberton, North Carolina described in this report is a collaboration between researchers from the National Institute of Standards and Technology (NIST)-funded Center of Excellence for Risk-Based Community Resilience Planning (Center), and researchers in the Engineering Laboratory at NIST.
1.1 The NIST Center of Excellence for Risk-Based Community Resilience Planning Community resilience depends on the performance of the built environment and social, economic, and public institutions which, individually and collectively, are essential for immediate response and for long-term recovery of communities following a disaster. Collective community needs and objectives, including post-disaster recovery goals, are not reflected in codes, standards, and other regulatory documents applied to the design of individual facilities. This necessitates an approach which reflects the complex interdependencies among the physical, social, and economic systems on which a healthy community depends. Thus, modeling the resilience of communities against the disruption caused by natural hazards and disasters depends on many disciplines, including engineering, social sciences, and information sciences. In the wake of climate change, it is becoming more likely and more common for communities to be faced with a major disaster before being able to fully recover from the previous disaster. Providing detailed and community-specific guidance on how to better prepare for and recover from disasters is the impetus for the Center’s research. The Center, headquartered at Colorado State University in Fort Collins, Colorado and involving eleven additional universities at the time of Wave 3, was established by NIST in 2015. The Center’s overarching goal is to establish the measurement science for community resilience assessment and risk-informed decision-making. To accomplish this goal, the Center is engaged in three major research thrusts aimed at: (1) developing a community resilience modeling environment – the “Interdependent Networked Community Resilience Modeling Environment” or IN-CORE – to quantitatively assess alternative community resilience strategies, (2) developing a standardized data ontology, robust architecture, and management tools to support IN-CORE, and (3) performing a comprehensive set of disaster hindcasts to validate IN-CORE’s advanced modeling environment. A longitudinal field study is planned and executed approximately every 12 months in the same location with the same sample of housing units and businesses to support the following phases of resilience model development within IN-CORE: impact, disruption, dislocation, recovery, decision, and interdependency. The Lumberton, NC field study will provide comprehensive data sets to evaluate the information needed for validation of the full architecture. The Center works to accelerate the development of system-level models and databases that will provide the technology for enhancing community resilience. Team members, at the time of Wave 3, include noted resilience experts from the University of Colorado-Boulder, the University of Oklahoma, Oregon State University, Rice University, Texas A&M University, the University of Illinois, the University of Washington, the University of South Alabama, California Polytechnic University-Pomona, the University of Kansas, and Iowa State University. Ultimately, the decision framework created by the Center will provide decision-makers with a unique set of tools that can be tailored to the needs of individual communities. These tools will optimize the design and subsequent management of individual facilities and interdependent infrastructure systems to

2
achieve resilience goals while managing life-cycle costs. Its use will provide a basis for targeting public investments and incentives for private investments, thus making it possible to establish a “business case” for achieving community resilience.
1.2 The Engineering Laboratory at NIST The Engineering Laboratory (EL) at NIST promotes U.S. innovation and industrial competitiveness by advancing measurement science, standards, and technology for engineered systems in ways that enhance economic security and improve quality of life. Some of the ways the EL carries out its mission is by undertaking activities in community resilience, disasters and building failure investigations, economic analysis and life cycle assessment, wind and seismic hazard impact reduction, fire prevention and control, engineering, and manufacturing materials. Several researchers from the Applied Economics Office (AEO) and the Community Resilience Program(CRP) from the EL participated in the Lumberton field study to advance the disaster metrology research of the EL’s Disaster and Failure Studies Program as well as to advance the measurement and modeling work needed to support community resilience planning. Hazard events stress buildings and infrastructure in ways and on a scale that cannot be easily replicated in a laboratory – buildings and infrastructure are built without being tested at full scale. The study of disaster and failure events is essential to improving the performance of buildings and infrastructure, the safety of building occupants, and associated evacuation and emergency response procedures. NIST leads a multi-disciplinary Disaster and Failure Studies (DFS) Program within the EL intended to standardize disaster field deployment, assessment, and reporting protocols to ultimately improve building and infrastructure performance. This program implements these goals through the following means: (1) monitoring events using a screening tool to evaluate whether decision criteria merits the establishment and deployment of a study team, (2) coordinating the establishment, deployment, operations and reporting of study teams, (3) ensuring that the study team’s safety, health and environmental requirements are met including relevant hazard reviews, training, and personal protective equipment prior to deployment, (4) building and maintaining effective partnerships and communications with other federal agencies, state/local governments, stakeholders and the general public, (5) establishing and executing standard operating procedures and criteria for disaster and failure studies, (6) promoting the implementation of recommendations from all DFS investigations, (7) creating and maintaining an archival data repository for DFS, (8) carrying out the statutory requirements of the National Construction Safety Team (NCST) Act, which includes providing the Secretariat for the NCST Advisory Committee and annual reports to Congress, and (9) overseeing a disaster metrology research program that interacts with other groups in EL, to directly inform best practices for means (1) to (7). NIST manages a multi-faceted program, assisting communities and stakeholders on issues related to buildings, the interdependencies of physical infrastructure systems, and the social and economics functions they support. The Community Resilience Program, part of NIST's broader disaster resilience work, complements efforts by others in the public and private sectors. Community Resilience Program focuses on research, community planning and guidance, and stakeholder engagement. In addition to improvements to standardized field study protocols, the three following projects within the Community Resilience Program are directly supported by the field study in Lumberton, NC.

3
Development of a Community-Resilience Systems Model – The main challenge confronting design or planning for community resilience is the need to address the large scale of the resilience system in question and the need to address social, political, budgetary and other constraints. In the development of community plans (e.g., land use management, emergency response, economic development), the formidable challenges inherent in both the analysis and design of the resilience systems must be addressed. The analyses must account for or include: a) stochastic phenomena (e.g., timing and severity of hazards, component failure); b) dependencies between and among the resilience subsystems; c) time aspects of resilience (e.g., from preparedness through long-term recovery, aging infrastructure); d) connection of the built environment to the social and economic services it supports; e) significant uncertainties in knowledge; f) metrics to quantify community resilience, and; g) the large amount and diversity of data needed to characterize the resilience of a community’s systems. In this project, a model is being developed to support community resilience decision-making. This model will be accessible to planners and others with a need to examine alternative options for resilience. The NIST Alternatives for Resilient Communities (NIST ARC) model and its methods will first be tested in a research version of the model (NIST ARC-R). Data collected during field studies for past hazard events will be used to both inform and validate NIST ARC. The results of the NIST ARC model are being systematically compared with IN-CORE simulation models to ensure both models can provide accurate results for their intended users. To address these significant challenges, the research plan adopts an operations research (OR) approach to the problem of community resilience planning. Operations research is a quantitative approach that is uniquely suited to large scale problems. A main tool of operations research is mathematical programming. Formulations (or “math programs”) that describe community resilience problems are developed and then are solved using available optimization solvers. The interactive formulation and solution of these models effectively provides decision-makers the ability to identify cost-effective, resilience-improving alternatives that can be the basis of the solutions ultimately adopted. Development of a Community Resilience Assessment Methodology –NIST released the Community Resilience Planning Guide for Buildings and Infrastructure Systems to help communities plan and implement prioritized measures for the built environment to strengthen their resilience to hazard events. The next step of the project is to provide communities with the tools necessary to evaluate and measure their resilience over time. A more resilient community will have, among many other characteristics, improved functionality of buildings and infrastructure systems and a shorter recovery time of community functions following disruption. This project is developing the methodology required to build a community-scale resilience assessment tool. The methodology is based on a foundational understanding that community functions are linked to buildings and infrastructure systems. Examples of community functions are the following: housing/shelter, the economy, health, education, sustenance, public safety, communication, transportation, religion/culture, and recreation/entertainment. Each function is delivered through interconnected components of the social-economic system (e.g., the banking system, health care system, personnel/staff, consumers) and the physical system (e.g., building clusters, transportation networks, communication networks). Both social and physical systems

4
influence community resilience – or a community’s ability to function after a disruptive hazard event. The final methodology and accompanying Tracking Community Resilience (TraCR) tool will include the following: selected priority indicators, the analytical approach(es) for computing each indicator over time in a relevant manner for at least one spatial scale, best practices for how the approach can be replicated for different spatial scales, public data sources for all indicators, data visualization for the indicators, multivariate analyses to examine relationships between indicators, sensitivity and uncertainty analysis, and validation studies. Developing Cost-Effective Resource Allocation Strategies to Enhance Community Resilience - Advancements in measurement science are needed to estimate the economic impact associated with community resilience planning for natural and human-made hazards. Currently, disaster-related loss (damage) estimates are available, although they tend to focus on direct loss only and are at aggregate levels. These estimates often fail to consider down-stream, indirect, and sustained effects, such as business interruption, which can be large and have a significant effect on the short- and long-term stability of a local or regional economy. Also missing are estimates of the cost of prevention, protection, and mitigation of hazards and potential disaster events, as well as the expenditures required during the response and recovery phases. A methodology to value the economic impact and avoided costs is needed to evaluate the return-on-investment of community resource allocation decisions made to reduce future economic damages from disturbances and disasters, while recognizing the need to achieve balance with other community goals, and to account for uncertainty. This project includes five major activities: (1) the creation and formal acceptance of draft standard practices to formalize, publish, and make available an economic toolkit facilitating decision making for communities; (2) measurement of disturbance and disaster-related costs and potential linkages to achieve other community goals; (3) measurement of disaster losses, focusing on major indirect losses, such as business interruption, and distributional effects —through the use of both data gathered in the field through surveys and interviews as well as secondary data sources; (4) quantification of the uncertainty affecting economic decisions, and understanding how uncertainty should be communicated to decision makers; and (5) measure the ‘resilience dividend,’ the (non-disaster related) community co-benefits from investing in disaster resilience, and provide tractable guidance to communities on approaches to assessing the net co-benefits associated with resilience planning. To date, this project has produced the Community Resilience Economic Decision Guide for Buildings and Infrastructure Systems, which can be used as a standalone product or in combination with the Community Resilience Planning Guide for Buildings and Infrastructure Systems. The process has also been developed into an online application titled the Economic Decision Guide Software (EDGe$) Online Tool (Helgeson et al., 2020).
1.3 Overview of Hurricane Matthew and Wave 1 (2016) and Wave 2 (2018) Field Studies In early October 2016, after devastating parts of the Caribbean, Hurricane Matthew struck Florida, and continued up the eastern seaboard before turning east into the Atlantic Ocean off the coast of

5
North Carolina and Virginia (see Figure 1-1). More than 170 counties in Florida, Georgia, South Carolina, and North Carolina were included in Presidential Emergency Declarations and/or Presidential Disaster Declarations between October 6th and 11th, 2016. Economic loss estimates due to Hurricane Matthew exceed $10 billion (NOAA, 2018). More than a week after the storm turned out to ocean, parts of North Carolina had yet to experience flood crests, with many communities experiencing flood levels at or higher than those for Hurricane Floyd in 19991. The Lumber River reached flood stage in Lumberton, North Carolina on October 3rd due to local heavy rains. On October 11th, the Lumber River crested at almost 22 ft. (6.7 m) above the gage datum. The water level slowly fell, dropping below flood level on October 23, 2016. As indicated in van de Lindt, Peacock, Mitrani-Reiser et al. (2018), the Center Field Study team selected Lumberton for longitudinal study for many reasons, including the moderate population size of approximately 21 000 residents (US Census Bureau 2017), the diverse socio-demographic makeup of primarily three race and ethnicity groups (White, Black, and Lumbee Indian), and that flood waters entered the City through a gap in the levee system that was reported to not meet the current FEMA regulations 13 years prior. The NIST-funded Center for Risk-Based Community Resilience Planning teamed with researchers from NIST’s Engineering Laboratory, specifically the Community Resilience, Disaster Failure Studies, and Applied Economics programs, to conduct a quick response field study focused on the city of Lumberton, NC and the flooding Lumberton experienced from the Lumber River. The quick response field study was performed during the week of November 29, 2016. Denoted here as Wave 1, it was the first of a series of annual field studies to document and better understand Lumberton’s recovery. Data collection during Wave 1 focused on the residential housing sector with two primary objectives: to establish and document
1 At its peak, Hurricane Floyd was recorded as a Category 4 hurricane. It reduced to a Category 2 by early September 1999 when it impacted North Carolina with a storm surge height exceeding 9 feet causing 51 fatalities and billions in damages. Flooding damage was tremendous with as much as 20 feet of flood water staying for over a week in some areas and exacerbated due to Hurricane Dennis which hit North Carolina just a few weeks prior.
Figure 1-1. Path and intensity timeline of Hurricane Matthew.

6
initial conditions for the longitudinal field study of Lumberton’s recovery, with a focus on the most heavily affected area located within a particular school zone; and, to facilitate and document the development and first application of a combined engineering-social science field study protocol that provides a quantitative linkage between flood damage and socio-economics including race, ethnicity, income, tenure status, and education level. Population dislocation probabilities were found to be higher for Black and Native American households than for White households, despite the presence of the same residential housing damage states following the flood. See van de Lindt, Peacock, Mitrani-Reiser, et al. (2018) for the Wave 1 field investigation report. Approximately one year after Hurricane Matthew, during the dates of January 19th to 29th, 2018, the Center and NIST researchers returned to Lumberton for Wave 2 of the longitudinal study. As indicated in Sutley, Dillard, van de Lindt et al. (2021), the overall purpose of Wave 2 was to (1) support on-going research in the Center and NIST through the collection of the necessary data to build and/or validate community-resilience models for business, housing, social institutions, and building functionality; and (2) advance understanding on the factors that influence recovery for two specific community sectors, namely housing and business, as well as to gain information on the recovery status of schools, households, public works, and the community as a whole. In support of the overall purpose of the longitudinal study, the same housing sample from Wave 1 was adopted for Wave 2, and as a new feature, a sample of 453 businesses was added. For housing, the Wave 1 sample units deemed invalid were dropped, resulting in a sample of 567 housing units for structured surveys in Wave 2. Of these 567 housing units, the team was able to gain survey responses from more than 227 household during wave 3c. For businesses, a random stratified sampling approach resulted in a sample of 350 businesses drawn from the ReferenceUSA database (InfoGroup, 2016). While in the field, an additional sample of 103 businesses was drawn to address possible coding errors in ReferenceUSA, business closures, and response rates. The final sample included 453 businesses, where 164 business owners and managers responded to the surveys. Although Wave 1 data collection did not include damage assessments for this sample of businesses (as they were not a component of the study sample at that time), the business survey instrument used in Wave 2 assessed the damage from Hurricane Matthew through a series of questions built on analogous damage state descriptions designed for commercial buildings. Both the housing and business surveys included questions on physical repair and sector-specific recovery indicators to document recovery progress and asked about the availability and timing of a range of financial recovery resources. For the public sector data collection, meetings were held with four city representatives and four state representatives, including both government and the water utility, to understand the context for recovery of the community. Likewise, to understand the context for school recovery, interviews were conducted with nine school district representatives. At the time of Wave 2, recovery was still on-going for Lumberton households and businesses, with much of the allocated Federal relief and mitigation funds not yet arrived, and many rebuilding decisions yet to be made. See Sutley, Dillard, van de Lindt, et al. (2021) for the Wave 2 field investigation report.

7
1.4 Overview of the Wave 3 (2018-2019) Lumberton Field Study Hurricane Matthew was a 500-year rainfall event. Only two years later Hurricane Florence, a 1000-year rainfall event, inundated Lumberton along with many other areas in North Carolina. Though probabilistically such events may occur in succession, especially insight of climate change conditions that increase the frequency and intensity of such events (IPCC, 2021), this combination of hurricanes creates a challenge to Lumberton as it strives to recovery. After reaching peak intensity and Category 4 status on September 11, 2020, Hurricane Florence made landfall on the U.S. Eastern Coast on September 14, 2020 as a weakened Category 1 hurricane (see Figure 1-2), bringing six days of heavy rainfall to North and South Carolina. The storm eventually lost strength over West Virginia and was downgraded to a post-tropical cyclone on September 17, 2018. Hurricane Florence inundated the city of Lumberton with 6.5 inches (165 mm), 15 inches (380 mm), and 13.8 inches (350 mm) of rain on September 15, 16, and 17 of September 2018, respectively. Due to its slow forward motion and heavy rains, the storm caused significant coastal and inland flooding. In North Carolina, 22 stream gages measured record peak flood stages due to the storm, with many breaking records previously set by Hurricane Matthew (Stewart and Berg, 2019). Post-Hurricane Florence flooding significantly affected businesses, housing, and agriculture in many areas that were still recovering from the 2016 flooding. The Center and NIST team conducted a quick response field study from October 16 to 19, 2018 to document the initial physical damage to the longitudinal sample of housing units and businesses, denoted as Wave 3a. As critical decisions were being made by the City on whether and how to rebuild and repair damaged public housing units since Hurricane Matthew, a small team of Center researchers returned to Lumberton December 2 to 5, 2018, to conduct focused interviews with key decision makers and public housing stakeholders, denoted as Wave 3b. From April 11 to 21, 2019, the Center and NIST team returned to Lumberton to execute two systematic surveys – one on households and one on businesses – and conduct semi-structured interviews with school administrators and City officials to learn more about the impact and disruption caused by Hurricane Florence, the progress or hindrance on recovery still unfolding after Hurricane Matthew, and the cascading challenges created by these two subsequent disasters for the community. Figure 1-3 provides the timeline of Lumberton field studies executed by the Center and NIST team to date.
Figure 1-2. Path and intensity timeline of Hurricane Florence.

8
Figure 1-3. Lumberton Field Study timeline.
This report is organized as follows: Chapter 2 focuses on the damage investigation immediately following Hurricane Florence. Chapter 3 provides the housing disruption and recovery from the successive flood events, including specific study goals, team training and deployment, and results. In Chapter 4, the business survey results on disruption and recovery from successive flood events is provided in a similar fashion as Chapter 3. Finally, Chapter 5 provides conclusions on the previous chapters’ findings, and next steps for the longitudinal field study.

9
Chapter 2: Physical Damage Observations Following Hurricane Florence
2.1 Goals and Objectives This chapter presents Wave 3a, including goals, planning and coordination, data collection, and findings. Following the occurrence of Hurricane Florence, it was imperative to assess the initial physical damage caused to the longitudinal study’s housing and business samples to document and understand these impacts on the on-going recovery from Hurricane Matthew. The Wave 3a damage assessment provided a rare opportunity to observe the confluence of damage from two extreme flood events that occurred in close temporal proximity in a single community, and to contrast the community- and individual-scale impacts arising from each event. The details on the Wave 3a initial damage assessment measurement and findings to housing and business samples following Hurricane Florence are provided in this chapter. Damage assessment included documenting high-water marks (HWMs) using digital surveys and photographic imagery, assessing damage levels to the building exterior and, when possible, the building interior, including contents, inventory, machinery, and equipment. Although not systematically collected, community-level preparations and individual-level flood mitigation efforts appeared to have resulted in a measurable reduction in the impacts of the flood. Wave 3a aimed to understand the mitigation actions taken at the individual and city levels to be followed up on systematically in subsequent trips, starting with Wave 3c.
2.2 Comparing the 2016 and 2018 Lumberton Floods Hurricane Florence in 2018 resulted in the second major flood event (following Hurricane Mathew in 2016) experienced by Lumberton in less than a three-year period. Upon the formation and predicted trajectory of Hurricane Florence affecting North Carolina, virtual reconnaissance was immediately implemented by our team. Once impact occurred, virtual reconnaissance documented the flood extent and damage caused by Hurricane Florence in Lumberton through monitoring social media and online updates from local news sources, United States Geological Survey (USGS) stream gage data, and National Oceanographic and Atmospheric Administration (NOAA) aerial imagery and reporting updates. This initial information was used to compare the flood extent and damage differences between Hurricane Florence and Hurricane Matthew through Geographic Information System (GIS) data analysis. Additionally, the virtual reconnaissance findings provided direction for the Wave 3a data collection and field activities. Figure 2-1 provides digitized regions of flood coverage showing differences between the two events based on aerial imagery captured by NOAA (NOAA, 2016; 2018). In Figure 2-1, inset photographs provide aerial imagery in these regions for each event for comparison, where the inset map in Figure 2-1(a) depicts the area of flooding within the Lumberton city limits. USGS hydrograph data were used to verify that the aerial images were captured on the dates of peak flooding for the two events. Solid orange polygons designate regions that were flooded after Hurricane Matthew (HM) but not after Hurricane Florence (HF); dashed green polygons designate regions that were not flooded after Hurricane Matthew but were flooded after Hurricane Florence. From Figure 2-1, it is apparent that the area south of the Lumber River was more severely flooded by Hurricane Matthew than in Hurricane Florence, while areas north of the river, particularly a residential neighborhood west of I-95 (highlighted in top-right inset), were more severely flooded by Hurricane Florence than by Hurricane Matthew. Mitigation actions taken by the City of

10
Lumberton in preparation for the flooding from Hurricane Florence likely contributed to the changes in the flood extents. These mitigation actions included building a temporary berm at the gap in the levee system where flood water entered the region south of the river during Hurricane Matthew (for more information on the levee system and gap, refer to van de Lindt et al., 2018; 2020), and using hydraulic pumps to quickly move water from the leveed area into the downstream river channel. The measurement science approaches taken by our team in Wave 3a (discussed in the next sections) accounted for individual- and community-level mitigation efforts, as they likely reduced damages from the flooding experienced in 2018.
Figure 2-1. Map of Lumberton showing digitized differences in flood extents using NOAA aerial
imagery, where solid orange polygons indicate areas flooded by Hurricane Matthew (HM) but not Hurricane Florence (HF), and dashed green polygons indicate areas flooded by Hurricane
Florence (HF) but not Hurricane Matthew (HM). Dashed black rectangles indicate regions in the study area where the most difference in flooding occurred.

11
Figure 2-1a. Residential neighborhood located North of the Lumber River and west of Interstate 95 indicated by (a) in Figure 2-1. Imagery collected following Hurricane Matthew (NOAA 2016) and Hurricane Florence (NOAA 2018) has been edited to show flooded areas
more clearly.

12
Figure 2-1b. Mixed commercial and residential area South of the Lumber River bound by the
levee and railroad indicated by (b) in Figure 2-1. Imagery collected following Hurricane Matthew (NOAA 2016) and Hurricane Florence (NOAA 2018) has been edited to show flooded
areas more clearly.

13
Figure 2-1c. Residential area South of the Lumber River and railroad indicated by (c) in Figure
2-1. Imagery collected following Hurricane Matthew (NOAA 2016) and Hurricane Florence (NOAA 2018) has been edited to show flooded areas more clearly.
2.3 Sampling Wave 3a investigated physical damage to the same housing and business samples as Waves 1 and 2 with addition of a small number of housing units that were impacted by Hurricane Florence but not previously impacted by Hurricane Matthew. The virtual reconnaissance comparison of aerial imagery identified 46 single-family dwellings (SFD) that met this criterion; all 46 were investigated in Wave 3a. A map of the business and housing samples is provided in Figure 2-2, where blue markers indicate the longitudinal housing sample, red markers indicate the longitudinal business sample, and orange markers indicate the 46 additional SFDs investigated in Wave 3a.

14
Figure 2-2. SFD in Wave 3a, total sample size includes 567 housing units in the longitudinal sample, 46 housing units added in Wave 3a, and 229 businesses in the longitudinal sample.
2.4 Survey Instrument The Wave 3a damage survey, provided in Appendix 2A, was very similar to the damage survey developed and utilized in Wave 1 (Deniz et al., 2019). Changes made to the damage survey across waves (1) were intended to account for damage specific to commercial buildings, since commercial buildings were not part of Wave 1, (2) improved how the flood information was documented, including measuring the HWM and first floor elevation, based on lessons learned from Wave 1, and (3) included format changes that accommodated the use of a smart phone application, Survey123 for ArcGIS©, as opposed to using paper forms. Damage data and flood inundation measurements were collected using Survey123. This approach was advantageous compared to using paper surveys because it allowed researchers to (i) ensure that all required fields were populated before a survey was submitted, (ii) limit the amount of time required for data-transfer, (iii) link all collected photographs to the specific building for which they were taken, and (iv) enable near real-time analysis and visualization of the survey results for remote researchers to

15
allow quality assurance to take place while team members were in the field. Institutional Review Board (IRB) approval was not required for Wave 3a because data collection did not involve human subjects; however, as was true in past waves, instrument testing and team training were critical, particularly given the virtual format of the instrument. The survey and data collection methodology used in Wave 3a was similar to that in the Wave 1 deployment and followed guidance from the United States Geological Survey (Koenig et al., 2016). The Wave 3a deployment included measurements of HWM with respect to ground and FFE with respect to ground and retained ground and FFE datums for measurements of flood height. In addition to measurements, the survey form included documentation of building typology (single-family, multi-family, or mobile home for residential structures, and attached or detached building for commercial structures) as well as foundation type. Also similar to Wave 1, physical damage was classified into five discrete, sequential damage states differentiated for residential and commercial buildings (see Appendix 2B for the full damage state criteria used in Wave 3a). Damage scales were similar for both occupancy categories, but with the inspection criteria tailored to common structural building types, nonstructural finishes, and interior contents. Discrete damage states for residential buildings were classified by observed damage to the foundation, exterior walls, and interior contents, including the floors, electrical and plumbing systems, drywall, and kitchen cabinets (see Table 1-1). More details on how these damage states were formulated are available in van de Lindt et al. 2018; 2020.

16
Table 2-1. Flood-based damage state descriptions for residential buildings (van de Lindt et al., 2018).
Damage State Description
0 No damage: water may enter crawlspace or touch foundation (crawlspace or slab on grade) but water has no contact to electrical or plumbing, etc. in crawlspace, and no or limited contact with floor joists. No sewer backup into living area.
1
Minor water enters house; damage to carpets, pads, baseboards, flooring. Approximately 25.4 mm (1.00 in), but no drywall damage. Touches joists. Could have some mold on subfloor above crawlspace. Could have minor sewer backup and/or minor mold issues.
2
Drywall damage up to approximately 0.61 m (2.0 ft) and electrical damage, heater and furnace and other major equipment on floor damaged. Lower bathroom and kitchen cabinets damaged. Doors or windows need replacement. Could have major sewer backup and/or major mold issues.
3
Substantial drywall damage, electrical panel destroyed, bathroom/kitchen cabinets and appliances damaged; lighting fixtures on walls destroyed; ceiling lighting may be ok. Studs reusable; some may be damaged. Could have major sewer backup and/or major mold issues.
4 Significant structural damage present; all drywall, appliances, cabinets etc. destroyed. Could be floated off foundation. Building must be demolished or potentially replaced.
The discrete damage states for commercial buildings are provided in Table 2. These damage states were originally developed and used in Wave 2, albeit through a different mode of damage assessment (Sutley et al., 2021). Exterior damage to commercial buildings was minor to nonexistent given that these building exterior materials are not typically damaged by flood inundation. However, the interior of commercial buildings was assessed, including the flooring and baseboards, electrical and plumbing systems, drywall, equipment, and doors and windows. Minor or major sewer backup, and degree of mold growth were also assessed.

17
Table 2-2. Flood-based damage state descriptions for commercial buildings (Xiao et al., 2020).
Damage State Description
0 No damage: No contact to electrical or plumbing, etc. in crawlspace. No contact with floor joists. No sewer backup
1
Water touches floor joists up to minor water enters building; damage to carpets, pads, baseboards, flooring. Approximately 25.4 mm (1.00 in) in the building but no drywall damage. Could have some mold in crawlspace. Could have minor sewer backup and/or minor mold issues.
2 Water level approximately 0.61 m (2.0 ft) with associated drywall damage and electrical damage, water heater and other major equipment. Doors or windows may need replacement. Could have major sewer backup and /or major mold issues.
3
Water level 0.61 m to 2.44 m (2.0 ft to 8.0 ft); substantial drywall damage, electrical panel destroyed, office cabinets or storage racks; lighting fixtures on walls destroyed; ceiling lighting may be ok. Studs reusable; some may be damaged. Could have major sewer backup and/or major mold issues.
4 Significant structural damage present; all drywall, cabinets etc. destroyed. Could be floated off foundation. Building must be demolished or potentially replaced.
The Wave 3a survey also recorded whether interior contents had been removed from the residence or commercial building, where imagery comparisons from past data collection waves were required to determine whether interior content removal was done before or after Hurricane Florence. Proper evaluation of the degree of interior damage present in a previously flooded building was challenging and often required entry-access to the interior of the structure to differentiate new from unrepaired damage. Entering damaged structures was not always possible. Removal of interior contents was generally visible from the street, either by debris piled near the road or debris removal marks in lawns or on pavement. In selected instances, missing or replaced interior contents were directly observable through doors or windows. In addition to the quantitative evidence of physical damage, evidence of occupancy was recorded for each sample. Evidence of occupancy was determined based on the surveyor’s assessment using specific business- and residence-specific indicators, similar to what has been done in previous waves of data collection in Lumberton. Businesses were labeled occupied if they were at least partially open to the public. Alternatively, if the business was not open at the time of the survey, but had normal business hours posted for times outside of the times when the team was collecting data, it was accordingly marked as evidence of occupancy. For residences, if direct evidence of occupancy was observed including the household residents being present, verification from a neighbor that the household was occupied, or presence of an undamaged and well-maintained vehicle in the driveway, then the surveyor marked evidence of occupancy accordingly. In addition, if the surveyor was able to determine that the interior had not been damaged, then the household

18
was marked as occupied unless there were real-estate signs or other indicators that no one was living there at that time.
2.5 Data Collection Methodology All eight members of the Wave 3a team arrived in Lumberton on Tuesday, October 16, 2018. Upon arrival, the team conducted a cursory vehicle-based inspection of several of the neighborhoods where damage in Hurricane Florence was apparent in aerial imagery. The team then underwent preparations to begin data collection the following day, including reviewing the data collection methodology, and safety training. Before beginning damage surveys, the field inspection team convened a training session to (i) confirm team members were familiar with Survey123 and the survey instrument, (ii) answer any remaining questions about damage state interpretation, (iii) provide guidance on standard measurement strategies, such as measuring HWM and FFE elevations from the lowest ground elevation around each sample building, and (iv) recount best practices based on the experiences of field study members of the Wave 1 deployment. In addition to the training session, on the first field day the team collectively filled out a survey form for a residential structure in the sample. The structure was in an area that was not flooded from Hurricane Florence, but the drywall, flooring, and other finishes were removed from the building interior and a distinct HWM was visible. This led to the creation of ‘situational flags,’ which were recorded in a comment field in the Survey123 form. Compounding impacts from the two flooding events, which did not necessarily flood the same areas or at the same level of inundation, required this situational flagging in a comment field included in the damage survey to indicate damage that was still unrepaired or HWMs remaining from Hurricane Matthew. The team created one flag to indicate that a structure had not been reoccupied since Hurricane Matthew, and a second flag to designate that the HWM was more-likely a relic of Hurricane Matthew than caused by Hurricane Florence. The Wave 3a damage survey commenced on the morning of Wednesday, October 17, 2018, and lasted through midday on Friday, October 19, 2018. An individual electronic survey was initiated for each building in the sample, and then filled out and closed before leaving the property. The results of the Wave 3a damage survey found a confluence of flood damage resulting from both Hurricanes Matthew and Florence, and limited wind damage from Hurricanes Florence and as well as Hurricane Michael, which made landfall in Florida on October 10, 2018 and moved inland creating limited wind damage in Lumberton. Each day, the broader team of eight investigators was subdivided into teams of two. The team traveled by vehicle, with two teams per vehicle, to a selected area and proceeded on-foot to visit and survey sample buildings in the area before moving to a new area. A GoogleTM map was created and loaded with the sample locations to navigate while in the field. All eight investigators reconvened at midday and in the evening to upload any locally-stored (on the investigators’ smartphones) damage survey results via reliable network access or WIFI hotspot. The map was updated to exclude those properties already surveyed each time the team convened; this helped ensure efficiency in surveying. Daily meetings were held in the evenings between the investigators and a support team of remote researchers tracking the field activities to communicate preliminary observations, develop or revise planning for the subsequent day, and perform quality assurance checks of data collected that day.

19
In addition to building information, and documenting damage states, photographs were taken in Survey123 to document observed damage and HWM measurements. The use of Survey123 for photographs was particularly useful as each photograph was automatically associated with the damage survey for the building represented in the photograph. While the decision to refrain from conducting structured data collection that required institutional review board approval was made to expedite field deployment, this changed the approach to measurement of damage as compared to that of Wave 1. In Wave 1, residents often verified that the HWMs measured by the deployment team represented the maximum height of inundation or, in some cases, informed team members of higher water marks that were not visible from the front of the home. Additionally, residents often invited team members into their homes during Wave 1 which permitted team members to classify interior damage and, in some cases, photograph interior damage. This was not as common in Wave 3a. In situations where team members interacted directly with residents, information sheets describing the Lumberton Longitudinal Study, the Center, and NIST (see Appendix 2C) were provided, as well as information about mental health and financial resources (see Appendix 2D). In addition to the damage inspections performed for residential and commercial buildings in Lumberton, an assessment of the I-95/CSX underpass and berm system was conducted to understand the impact of the community-level preparation for the event on the damages observed by the field team. The assessment included collecting LiDAR laser scans of the remains of the berm system to provide measurements of berm height and preserve the perishable data.
2.6 Survey Results After returning from the field, data cleaning measures were conducted to ensure quality and consistency of the captured data. The findings of the data analysis are presented below. As previously discussed, at the time of Wave 3a, there remained buildings that had not been fully repaired from damage incurred by flooding following Hurricane Matthew. This was often evidenced by a gutted interior or determined by speaking with a neighbor, and when suspected, a flag was created in the data collection. While the detailed extent of damage or repair that existed immediately before Hurricane Florence is unknown, using a combination of information including Wave 2 repair state, visible high-water marks, sparse input from neighbors or occupants, and indicators of recently removed interior items, damage states were assessed for Hurricane Florence flood damage alone. Figure 2-3 shows the spatial distribution of damage caused by Hurricane Florence to our sample of residential and commercial buildings. A histogram of the damage distribution is included in the top-left corner of the figure. Of the housing units inspected, 409 were assessed as DS 0, 44 were assessed as DS 1, 41 were assessed as DS 2, 1 was assessed as DS 3, and 2 were assessed as DS 4. Of the businesses inspected, 117 were assessed as DS 0, 6 were assessed as DS 1, 9 were assessed as DS 2, 6 were assessed as DS 3, and 0 were assessed as DS 4.

20
Figure 2-3. Distribution of overall damage to residential and commercial buildings due to Hurricane Florence.
Figure 2-4 provides the overall interior damage states for commercial and residential buildings with a histogram provided in the top left corner. Interior damages were assessed for 124 commercial buildings and 362 housing units and interiors were not assessable for 149 buildings. Of the residential buildings in which interiors were assessed, 22 were assessed as DS 1, 23 were assessed as DS 3, and 3 were assessed as DS 4. Of the commercial buildings in which interiors were assessed, 3 were assessed DS 1, 10 were assessed DS 2, and 2 were assessed DS 3.

21
Figure 2-4. Distribution of damage to interior contents of residential and commercial buildings
due to Hurricane Florence. Finally, the difference in damage states recorded between Hurricanes Matthew and Florence is shown in Figure 2-5. Figure 2-5 includes only those 316 residential buildings that were assessed in both Wave 1 and Wave 3a and does not include commercial buildings because businesses were not part of the scope in Wave 1. In calculating the differences in Figure 2-5, Hurricane Florence damage states were subtracted from Hurricane Matthew damage states; therefore, a positive number in the histogram indicates a higher damage state in Hurricane Matthew than Hurricane Florence. Approximately two-thirds (66 %) of residential buildings (n=209) sustained more damage after Hurricane Matthew than after Hurricane Florence, while only 3 % of residential buildings (n=8) sustained more damage after Hurricane Florence compared to after Hurricane Matthew. Almost one-third (31 %) of the residential buildings (n=99) had the same degree of damage after both events; however, of those 99 buildings, 72 % were not flooded by either Hurricane. The high proportion of undamaged buildings is due in part to the nature of the sample created for the Wave 1 damage assessment, which deliberately included non-flooded buildings to better understand the socio-economic factors leading to flood vulnerability and the dependencies within a community. The spatial distribution of positive and negative values in Figure 2-5 can be

22
used to interpret factors influencing the observed differences in damage for individual residential buildings more closely.
Figure 2-5. Spatial distribution of difference in damage states assessed for residential buildings
after Hurricanes Matthew and Florence.
2.7 Observations of the City’s Collective Preparation and Response The City of Lumberton employed multiple mitigation strategies in the days before Hurricane Florence made landfall in North Carolina to reduce the severity and impact of flooding. These mitigation strategies included (i) building a system of temporary berms at the CSX/I-95 underpass, (ii) building a temporary berm around a water treatment plant and setting up flood barriers around an electrical substation, and (iii) deploying hydraulic pumps inside the leveed area to move accumulated flood water back into the stream system. Each of these are discussed in the following subsections.

23
2.7.1 Berm System Built at I-95/CSX Underpass To provide context for the flood mitigation taken at the I-95/CSX underpass leading up to the flood generated by Hurricane Florence, Figure 2-6 shows the actions taken by the city at the underpass leading up to the 2016 flood in an effort to mitigate its impacts. Figure 2-6(a) shows an aerial view of the underpass taken at the time of highest inundation during Hurricane Matthew, with the locations of the CSX Railroad and VFW Road labeled. Figure 2-6(b) shows the use of backfill and sandbags in the ditches between the overpass abutments, railroad and road to create a constant elevation across the gap in the levee. The flood water exceeded the elevation of the underpass and surged into the city, causing damage to VFW road and undercutting the CSX railroad at the location of the dotted circle in Figure 2-6(a). For more information on the mitigation, damage, and repairs to the underpass made in 2016, refer to van de Lindt et al. (2018; 2020).
Figure 2-6. I-95/CSX Underpass seen in 2016: (a) from above; (b) from underneath, with flood prevention set in place. (NOAA, 2016). Photograph shown in (b) reproduced with permissions
from van de Lindt et al., 2018.

24
A system of three temporary berms was built at the I-95/CSX underpass in the days leading up to Hurricane Florence, which represented a more concerted effort to mitigate flooding than that taken in the days leading up to Hurricane Matthew in 2016. The increased mitigation activity leading up to Hurricane Florence was likely due to the recent experience with flooding from Hurricane Matthew. The last flood event before Hurricane Matthew had occurred over ten years previously and did not include flood water entering the leveed area of the city through the I-95/CSX underpass. Figure 2-7 provides the locations of the berms, designated in Figure 2-7(a) by a dotted red, a dashed yellow, and a solid green line. Figure 2-7(b) shows the locations and orientations of the images shown in Figure 2-7(c)-(h). A berm section, considered here to be the primary line of defense protecting water from entering the city, was built between the underpass abutments and is denoted by a red dotted line in Figure 2-7(a). This berm was built by placing highway dividers, backfilling sand on the east side of the dividers, and adding sandbags on the west (river) side of the dividers, as shown in Figure 2-7(c). This berm breached on the southwest side, allowing flood waters to enter the city, similar to what occurred in 2016. Following the flood, the material from the temporary berm structure overlaying the railway was removed to allow train access; therefore, measurement of the berm height in that region and assessment of the extent of the breach were not possible. It is assumed that the height of the berm in the region, that was gone at the time of measurement, was level with the remaining portion of the berm. Figure 2-7(c) depicts the northeast section of the berm built atop VFW Road, which was remained during the Wave 3a deployment. Another berm was built along the southwest side of the railroad and is denoted by a yellow dashed line in Figure 2-7(a). This berm, considered here to be the secondary line of defense due to its protection of the railroad, was constructed by placing highway dividers along the railroad and adding sand, asphalt riprap, and sandbags on the southwest side of the dividers, as shown in Figure 2-7(e). Parts of the berm were destroyed and the constituent material was carried away by the flood. A third berm is denoted by a solid green line in Figure 2-7(a). This berm was built out from the east side of the bridge abutment toe slope, crossing VFW Road, running east along the south side of VFW road, crossing the railroad and connecting to the berm section running along the railroad. This third berm, considered a tertiary line of defense as it protected the area north of the railroad, was constructed by placing highway dividers and backfilling the eastern side of the dividers with sand and asphalt riprap, as shown in Figure 2-7(g). This berm was still intact while the Wave 3a team was in the field, and aerial imagery shows that the flood water was directed south of the railroad by the location of the breach of the primary berm and by the secondary berm.

25
Figure 2-7. Berm system deployed before Hurricane Florence: (a) Aerial overview with three
berm sections marked (NOAA 2018); (b) Aerial overview with image locations and orientations (NOAA 2018); (c) Primary berm section; (d) LiDAR scan of primary berm
section; (e) Secondary berm section; (f) LiDAR scan of secondary berm section; (g) Tertiary berm section; (h) LiDAR scan of tertiary berm section.

26
A series of six Light Detection and Ranging (LiDAR) scans were administered on 17 October 2018 at various locations around the underpass to collect survey-grade measurements of the remnants of the berms. LiDAR scans produce a dense, three-dimensional point cloud with an accuracy of ±1 cm. The scans were used to measure heights of the berms with respect to VFW Road and CSX Railroad elevations. Figure 2-7(d) shows the point cloud representing the primary berm built between I-95 overpass abutments, where the CSX railroad is visible in the left side of the figure. The height of the berm was measured to be 1.43 m (4.69 ft) above the crest of VFW Road. Figure 2-7(f) shows the point cloud representing the secondary berm built along the railroad. The height of the berm measured 1.11 m (3.64 ft) above the elevation of the railroad. The crest of VFW Road measured 0.16 m (0.52 ft) above the railroad. Figure 2-7(h) shows the point cloud representing the tertiary berm built from the east abutment toe slope (i.e., baseline section) and connecting to the secondary berm running along the railroad. The height of the berm measured 1.44 m (4.72 ft) above the crest of VFW Road. The primary berm stretching between abutments was breached at its edges. The southwestern edge suffered a major breach, allowing the flood water to surge through, which is apparent in Figure 2-7(a). The southeast edge of the berm was partially breached and allowed only a minor amount of water to pass through, which is visible in Figure 2-7(a), but that water was stopped by the tertiary berm. The water flowing through the berm not only flooded the city but, by concentrating the water flow velocity, caused scouring at the point of penetration and heaving as far as 150 m from the location of the failure, in the parking lot of an adjacent church building. Upon inspection of the berm during Wave 3a, it appeared that the sand used to construct the berms had not been compacted during construction, which is likely due to the quick construction of the berm was created – the city did not have permission to build a berm over the CSX railroad until the state governor signed an executive order days before the flood reached the city (Robesonian, 2018). While the primary berm (dotted red line) was breached by the Lumber River, flooding many residential areas of the city for a second time, the secondary berm (dashed yellow line) may have prevented the reach of the flood by keeping the railroad and VFW Road intact. As pointed out by the dashed white oval in Figure 2-6(a), a section of the railroad and VFW Road was washed out in the 2016 flood, allowing water to spill into the northeastern areas of the city, between the levee and railroad. Figure 2-8 shows a digital elevation model of Lumberton (USGS, 2017), with brown to blue shades representing lower elevations and blue shades representing higher elevations, and color intensity representing increasingly extreme elevation in the direction of the shade. The railroad, levee, and underpass locations are shown in Figure 2-8; the data indicates that the railway structure is a local high point running completely across the southern area of the city. The secondary berm built along VFW Road directed water south and west, providing protection to the railway infrastructure, and further preventing the region of the city north of the railroad and south of the levee from being flooded by the Lumber River.

27
Figure 2-8. Digital elevation model (USGS 2017) showing elevations in area of Lumberton
South of the levee, with CSX railroad and levee locations noted.
While some flooding did occur in this area in 2018, it was attributed to pluvial flooding alone as opposed to the flooding that occurred in 2016 which was mostly attributed to riverine flooding that entered through the I-95/CSX underpass and then through the undercutting of the railroad. Many of the homes and businesses in this region were completely protected from flooding in 2018. Of the homes from our sample that were flooded in this region, our team measured lower inundation levels in Wave 3a compared to those assessed in Wave 1.
2.7.2 Flood Mitigation for Critical Infrastructure Systems In addition to the berm system built at the I-95/CSX underpass, the City of Lumberton took mitigating actions to protect its infrastructure systems. Figure 2-9 shows the Lumberton Water Plant and an electrical power network substation in the leveed area of Lumberton. Both were severely flooded in 2016, which caused disruption to the water and power systems in Lumberton. The loss of these utility systems was a major stressor on many of the residents in the areas served by these systems and affected their recovery timelines (van de Lindt et al., 2018; 2020; Sutley et al., 2019). The Lumberton Water Plant, located south of the levee and north of West 5th Street, is marked with dashed red circles in Figures 2-9(a) and (c). Water service was disrupted following the 2016 flood (Armstrong, 2016) due to inundation of the water treatment plant as well as damage to an intake pump and failure of the treatment plant’s primary generator. As shown in Figure 2-9(b), which provides the image from Figure 2-9(a) zoomed in for details of the plant, a protective berm was built around the plant controls leading up to Hurricane Florence. This berm may not have been needed to protect against the flood water in 2018 due to the protection of the I-95/CSX underpass berm system, described earlier, which kept flood water out of the Lumber River from entering that portion of the city. While the plant itself was not inundated in 2018, a well located outside of the levee was inundated to a higher level in 2018 than in 2016, according to city officials, resulting in a boil water advisory for those households in the water treatment plant's distribution network.
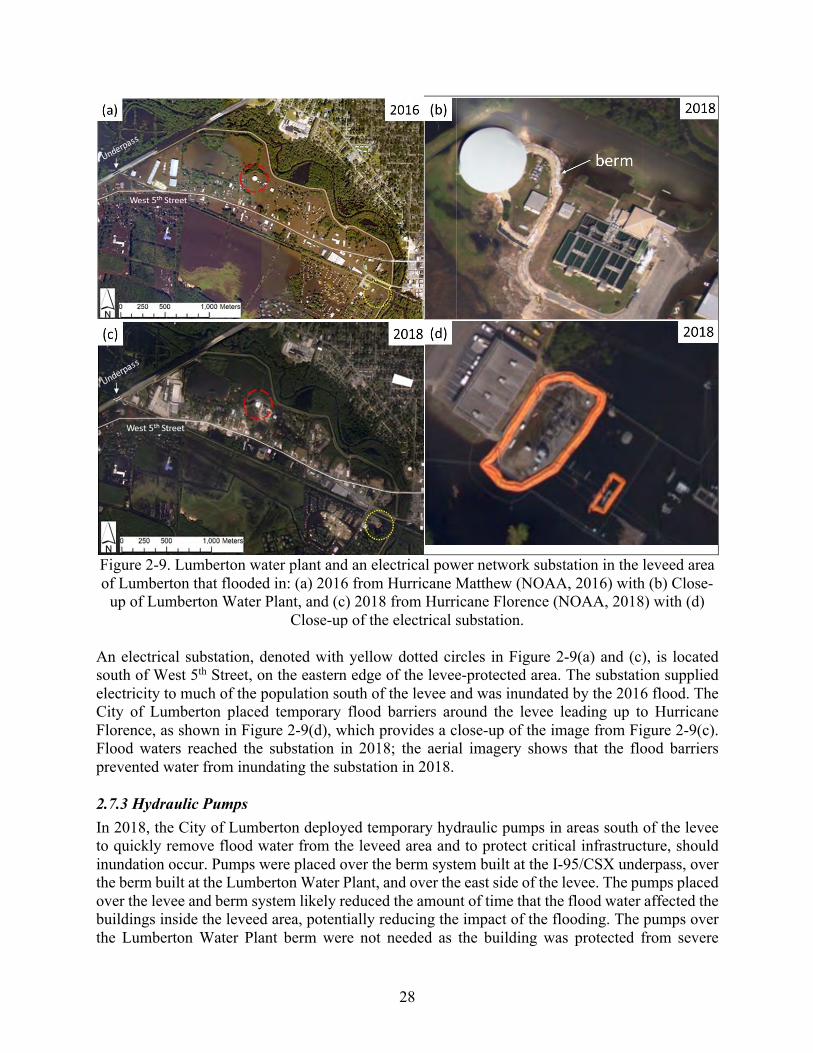
28
Figure 2-9. Lumberton water plant and an electrical power network substation in the leveed area of Lumberton that flooded in: (a) 2016 from Hurricane Matthew (NOAA, 2016) with (b) Close-
up of Lumberton Water Plant, and (c) 2018 from Hurricane Florence (NOAA, 2018) with (d) Close-up of the electrical substation.
An electrical substation, denoted with yellow dotted circles in Figure 2-9(a) and (c), is located south of West 5th Street, on the eastern edge of the levee-protected area. The substation supplied electricity to much of the population south of the levee and was inundated by the 2016 flood. The City of Lumberton placed temporary flood barriers around the levee leading up to Hurricane Florence, as shown in Figure 2-9(d), which provides a close-up of the image from Figure 2-9(c). Flood waters reached the substation in 2018; the aerial imagery shows that the flood barriers prevented water from inundating the substation in 2018.
2.7.3 Hydraulic Pumps In 2018, the City of Lumberton deployed temporary hydraulic pumps in areas south of the levee to quickly remove flood water from the leveed area and to protect critical infrastructure, should inundation occur. Pumps were placed over the berm system built at the I-95/CSX underpass, over the berm built at the Lumberton Water Plant, and over the east side of the levee. The pumps placed over the levee and berm system likely reduced the amount of time that the flood water affected the buildings inside the leveed area, potentially reducing the impact of the flooding. The pumps over the Lumberton Water Plant berm were not needed as the building was protected from severe

29
flooding, likely due to the I-95/CSX berm system protecting the railroad tracks from being undercut. High-water marks were more challenging to locate on structures in Wave 3a compared to those observed in Wave 1, likely attributable to the reduced duration of inundation.
2.8 Observations of Households and Businesses: Individual-Level Preparation and Response In addition to changes in the community-level response between the two floods experienced by Lumberton, individual-level responses also minimized risks to life and property. Most residents were in their homes during the 2016 flood, which led to emergency evacuations of residents during the flooding. Conversely, many of the residents and business owners, whom our team also interacted with in Wave 3a, acted before the flood, including evacuating during the days leading up to the hurricane’s landfall. Through virtual and in-person observations, combined with informal conversations with residents and business owners during Wave 3a, various short- and long-term mitigation measures implemented by Lumberton residents in preparation for Hurricane Florence (see Figure 2-10 for examples) were identified. Short-term mitigation measures included placing sandbags at building entrances, moving personal belongings, equipment and other items, such as important paperwork, to higher ground indoors or outdoors, elevating HVAC units outside the home or relocating ductwork from crawlspaces to attics, and deploying temporary flood barriers. Figure 2-10(a) shows a major international retailer that deployed temporary flood barriers (NOAA, 2018). Based on an assessment of aerial imagery, the business pictured was the only one in the community, other than the electrical substation mentioned earlier, that deployed temporary flood barriers. Many residential structures in Wave 1 were inundated into their crawlspaces, but did not flood up to their first-floor elevation (FFE). No structural damage was apparent in such homes, but financial losses were still substantial in comparison to the economic capacity of the households. Several residents shared with the data collection team during Wave 3a that their ductwork had been rerouted between Hurricanes Matthew and Florence, and corresponding differences in observed damage was recorded in the damage survey. Similarly, during the Wave 3a damage survey, residents and business owners shared that they had elevated their personal belongings, merchandise, paperwork, and/or equipment to higher levels inside (e.g., placing contents on beds, dressers, shelves, or upstairs). Lastly, the data collection team noticed that several air conditioning condenser units had been replaced and elevated on top of pedestals after the 2016 flood. Figure 2-10(b) provides an example of an air conditioning condenser unit placed atop a concrete pedestal at a public housing unit. These pedestals were typically constructed from wood, except outside a public housing building where concrete pedestals were used. The heights of various air conditioning condenser unit pedestals were measured between 0.91 m (3 ft) to 1.22 m (4 ft) above ground level. Collectively, these simple actions likely resulted in significant reductions of property losses for the residents who adopted them. They were also used to inform survey design for Wave 3c, as discussed in Chapters 3 and 4 of this report.

30
Figure 2-10. Examples of visible individual-level mitigation efforts in Lumberton implemented before the 2018 Flood; (a) Temporary perimeter flood protection around international retailer
building (NOAA 2018); (b) Elevated air conditioning condensers in a public housing complex.

31
Chapter 3: Housing Disruption and Recovery
3.1 Goals and Objectives The housing component of the Wave 3c field study is in support of on-going research in the Center, including modeling housing damage and functionality loss, household dislocation, household relocation, housing repair and recovery, and understanding mitigation and capacity-building actions taken by households in Lumberton. The goals of the housing data collection for Wave 3c include:
● Complete missing information on initial damage not captured during Wave 3a; ● Improve documentation on the duration of home repair experienced by households
considering different initial damage levels from Hurricane Florence, continued disrepair from Hurricane Matthew, income levels, available recovery resources, and socio-demographic characteristics;
● Develop a better understanding of what interdependent infrastructure systems and services were lost during Hurricane Florence, and how households considered the restoration of these services in their timing and decision to leave and return home;
● Obtain household-level data on a range of factors that are hypothesized to influence housing recovery, including financial resources, as well as measure housing recovery progress, including households’ housing stability and accessibility;
● Obtain household-level data on resilience measures, including social capital change, preparedness, and mitigation.
Wave 3c primarily utilized a structured questionnaire (survey) executed with residents considering the longitudinal sample of 567 housing units used in Waves 1 and 2. This chapter presents the housing sample design, data collection instrument, data collection processes, and findings from Wave 3c, as well as a glimpse of longitudinal recovery across Waves 1, 2, 3a, and 3c.
3.2 Sampling Procedure To continue the longitudinal study, Wave 3c utilized the same housing sample as Waves 1 and 2. The school attendance zone for Lumberton Junior High, which includes the attendance zones for the two elementary schools (W.H. Knuckles and Tanglewood Elementary Schools), defined the study area for Lumberton. A two-stage non-proportional cluster sample was designed to capture a representative random sample of the study area, which included areas inundated by flooding as well as areas that were not flooded. Within this sample design, the penultimate sampling units were census blocks and primary sampling units were housing units and households residing in those units. The penultimate sampling units (blocks) were selected utilizing a probability proportion to size (PPS) random sampling procedure with blocks in areas with a high probability of flooding selected 3 to 1 over areas with low flooding probability. Areas subject to high probability of flooding were identified as those inside the University of Alabama’s predicted flood inundation area or in FEMA designated 100- and 500-year floodplains (see Chapter 1 in van de Lindt, Peacock and Mitrani-Reiser et al. 2018). A 100-meter buffer was added to the floodplain to account for uncertainty. Housing units within the sampled blocks were then selected at a fixed rate of 10 random units per block, 8 units were identified as primary with 2 alternates. The combination

32
of selection PPS with a fixed number of housing units selected, after weighting, ensures a representative sample of the area. Among the 830 blocks with five or more occupied housing units in the school attendance zone, the sampling process drew a random sample of 80 blocks based on a probability of selection proportionate to size, oversampling for high probability flooding (56 census blocks in the high probability areas and 24 in the low probability areas). In the final sample, 75 of 80 census blocks were visited (54 census blocks in the high probability areas and 21 in the low probability areas), including 568 valid primary housing units, yielding an average of 7.6 housing units per block. For more detailed information about the sampling procedures for Wave 1, please refer to section 3.2.1 in the Wave 1 report (van de Lindt, Peacock, and Mitrani-Reiser et al., 2018).
The 568 housing units, and the households living in these units, were the primary sample units for Waves 1 and 2, and the target sample units for Wave 3c. During Wave 1, one household showed a very explicit rejection and accordingly, this housing unit was dropped entirely from the Wave 2 housing sample. Therefore, Wave 2 consisted of a selected sample of 567 housing units. Similarly, Wave 3c started with this initial sampling frame from Wave 1. Wave 3a deviated slightly from the longitudinal sample by adding new units suspected to be flooded by Hurricane Florence but not by Hurricane Matthew. More details about the expanded sample used in Wave 3a is provided in Chapter 2 of this report.
3.3 Survey Instrument Multiple researchers within the Center and NIST, each with unique expertise and interest in community resilience and disaster recovery, participated in developing the survey. Having a multidisciplinary team helped ensure inclusion of different dimensions of household and community recovery in conjunction with housing recovery and in the wake of successive catastrophic flooding events. During development, the survey instrument underwent several rounds of review both initially and through pre-testing and training by researchers within the Center and at NIST, specifically in the Community Resilience Group of NIST’s Engineering Laboratory (EL). Pretesting and training were two integral steps in the survey development process. They were particularly critical to make sure questions were presented in an easy-to-follow fashion and were very clear about which flooding event was being addressed. The final housing survey instrument also went through review for the Paperwork Reduction Act (PRA) (1995, Pub. L. Count 104-13, 109 Stat 163). The purpose of the PRA review is to: “ensure the greatest possible public benefit from and maximize the utility of information created, collected, maintained, used, shared, and disseminated by or for the Federal Government;” and to “improve the quality and use of Federal information to strengthen decision making, accountability, and openness in Government and society.” The instrument and data collection methodology for the household survey and the full Wave 3c Lumberton study were approved by the Institutional Review Board (IRB) at Colorado State University, which oversees the Center’s human subjects research. The Wave 3c survey built upon the surveys utilized in Waves 1, 2, 3a, and 3b. Several questions on household dislocation and socio-demographics were drawn from the Wave 1 survey, consistent with those developed for the Wave 2 survey. Some sections were repeated verbatim from those previous surveys (e.g. occupancy status) to increase the reliability of the longitudinal data on

33
dislocation. This also ensured reliability through using a similar procedure for verification of occupancy versus abandonment. New sections of the survey were developed drawing from team expertise, and findings from Wave 3a. Team expertise was used to separate impacts caused by Hurricane Matthew from impacts caused by Hurricane Florence. Findings from Wave 3a were incorporated by adding questions on household-level preparedness and mitigation. There are eight main sections in the survey. Those include (1) establishing occupancy and study eligibility, (2) state of repair and recovery following Hurricane Matthew, (3) initial damage, utility outage and repair progress caused by Hurricane Florence, (4) dislocation after Hurricane Florence, (5) recovery in-place after Hurricanes Matthew and Florence, (6) educational recovery, (7) household preparedness and mitigation, and (8) household socio-demographic characteristics. See Appendix 3A for the full Wave 3c housing survey.
3.3.1 Establishing Occupancy and Study Eligibility As in Waves 1 and 2, upon approaching a housing sample unit, surveyors observed the landscape for safety, accessibility, and occupancy. There were two places to record information based on these initial observations and based on the result of the survey if it was completed or not. The first of these was titled ‘Result / Completion Codes,’ and included options for survey completion: incomplete or partial completion; no answer or response but appears occupied; ineligibility because no eligible person was available; ineligible because the structure is not a residence; incorrect address; no access; or not occupied and appears abandoned or destroyed. Refusals were recorded as no response but appeared occupied and a note was written in the comments to document the refusal. The second box was titled ‘Housing Unit Occupancy Status’ and included options similar to the previous but wholly focused on occupancy, rather than survey completion. If the household was not present but their neighbor or landlord was outside, or their neighbor was also part of the sample, then the neighbor or manager was asked five questions related to occupancy and dislocation caused by the flooding. If an eligible household member was present and provided verbal consent to be surveyed, then the first question was to determine how many people lived in the household — both adults and children under 18 years old — and then determine when the household moved into the home. If the household moved in after Hurricane Florence (after Sept. 2018), then the surveyor skipped to the very end of the survey asking only socio-demographic questions. All households that moved in prior to Hurricane Florence were asked all survey questions. The scope of these questions is explained as follows.
3.3.2 State of Repair following Hurricane Matthew To understand the impacts of Hurricane Florence, it was first necessary to understand the state of the home and the household immediately preceding the event, and thus the status of their repair and recovery from Hurricane Matthew. These questions included asking whether the home was originally damaged from Hurricane Matthew, and to what extent it was repaired before Hurricane

34
Florence. Subsequent questions, to be discussed in Section 3.3.4, asked about recovery progress from both Hurricanes Matthew and Florence.
3.3.3 Initial Damage, Utility Outage, and Repair Progress following Hurricane Florence As discussed in Chapter 2, Wave 3a occurred just three weeks after Hurricane Florence with the intention to document the initial physical damage. In the Wave 3c follow up, it was imperative to understand impacts beyond initial damage. Similar to the procedure in Wave 2, in Wave 3c residents were asked if their home was damaged from Hurricane Florence, and the current state of repair. Similar to the procedure in Wave 1, Wave 3c respondents were asked about utility and other service outages, including electric power, water, wastewater, gas, cell phone service, landline service, and internet connectivity disruptions. These questions on outages also captured the length of time of the disruption immediately after Hurricane Florence and included the duration of any “boil water order” or how long they thought water was unsafe for consumption (i.e., the service may not have stopped, but was the water safe?).
3.3.4 Household Dislocation after Hurricane Florence This portion of the survey asked questions regarding household dislocation timing, and factors which may have contributed to their decision to return. Influencing factors considered in the survey were modeled after the Wave 2 survey, including the timing of insurance payouts or other financial assistance, closures in the resident’s place of work or children’s school or other businesses, such as grocery stores. Residents were then asked if anyone in their household missed work due to housing issues due to either Hurricane Matthew or Florence, the greatest number of workdays missed, and the place of employment for the household member who missed the most workdays.
3.3.5 Housing Recovery In-Place after Hurricanes Matthew and Florence The recovery in-place portion of the survey was designed to document how recovery was progressing after Hurricanes Matthew and Florence, and what financial resources households had available to them for that purpose. To start, households were first categorized as owners or renters, and then asked what type(s) of insurance they had prior to Hurricane Florence and whether they received payouts from any insurance after Hurricane Florence. If the household received a payout, they were asked when they received the payout, and if it was sufficient in covering their repairs. If the household reported they did not have insurance prior to Hurricane Florence, they were asked if they had insurance at the time of the Wave 3c survey. Insurance questions were asked strictly about Hurricane Florence, allowing responses from Wave 2 to provide information on insurance coverage after Hurricane Matthew. The decision to exclude Hurricane Matthew questions related to insurance payouts in Wave 3c were based on the timing to receive insurance payouts reported in Wave 2 where the average for all three types of insurance were received before 90 days, although six of the 75 reported payments were received after 90 days. As such, the field study team determined it was unlikely any new insurance payouts were administered to households between Wave 2 (14 months after Hurricane Matthew) and Wave 3c (two years after Hurricane Matthew). The next set of questions asked about external resources available after the floods. In this case, the respondents were asked whether the household applied for, whether they received funds, and when they received funds all since the beginning of 2018 for either Hurricane Matthew or Hurricane Florence. The structure of this set of questions was driven by the fact that some of the federal resources were delayed after Hurricane Matthew and only became available to households

35
following Hurricane Florence. Thus, households could have received financial support after Hurricane Florence for either flooding event. The types of resources considered in this series of questions included: FEMA home repair funds, Small Business Administration (SBA) loans; HUD Community Development Block Grant- Disaster Recovery (CDBG-DR) home repair grants; funding from FEMA’s Hazard Mitigation Grant Program for home elevation, buyout, demolition or rebuilding; financial assistance from Non-Government Organizations (NGOs); clean up or repair help from NGOs; financial assistance from friends or family; and cleanup help from friends or family. Once recovery resource information was captured, respondents were then asked to consider all of the assistance and insurance payouts they received and determine whether it was enough to repair and replace all damages to their home and contents from both flooding events. If the respondent answered no, they were asked what portion of the damages were covered (very little, some, or almost all/all), and whether they could pay for the rest from personal funds. Following the questions on financial resources, respondents were asked about their recovery in-place, including whether they had the same access to school, work, grocery stores, and other essential needs in their home now as they did before both flood events. Finally, respondents were asked about their stability in their current home, and whether they intended to move in the next year, and if so, where.
3.3.6 Educational Recovery The same two questions from Wave 2 were asked of respondents who indicated they had children, including whether their child was enrolled in school in Lumberton in the past 12 months, and if so, the status of their educational recovery.
3.3.7 Preparedness, Mitigation, and Social Capital This was the only new section of the survey. During Wave 3a, the field study team collected anecdotal evidence from conversations with resident about different preventative actions they had taken before Florence in comparison to before Matthew. Also, during Wave 3a, the field study team noticed differences in where the flooding occurred, and learned that the city deployed pumps, and noted cases where air conditioning condensers had been elevated. These anecdotal observations motivated systematic data collection on preparedness and mitigation actions taken by households and businesses. In Wave 3c, respondents were asked whether they had elevated their hot water heater and/or air conditioning condenser, elevated interior contents before the flood, had their home inspected by an engineer, rerouted ductwork from below the floor into the attic space, and/or developed a disaster plan with their household members. The respondents were asked whether these actions were performed before Hurricane Florence, and whether they had performed those actions/mitigations/changes at the time of the survey. There were also three lines on the survey marked as “other” allowing respondents to indicate any other type of preparedness and/or mitigation action they took outside of those listed on the survey. To understand capacity building beyond physical actions, respondents were also asked whether their household’s involvement with neighborhood and/or community groups, as well as with neighbors and extended family had increased since Hurricane Matthew. These questions were used as proxies to understand changes in social capital.

36
3.3.8 Household Socio-Demographic Characteristics Questions on household characteristics were duplicated from the Wave 2 survey, and included categorizing respondents as renters or owners, and obtaining information to categorize the highest education level of any member in the household, racial makeup, ethnicity, and combined household annual income. These types of questions serve to document whether our sample matched the distribution of socio-demographics indicated in 2019 ACS data (i.e., 5-year census estimates). This information was also used to examine disparities in. dislocation, relocation, repair, and recovery processes due to household socio-demographics, as is expected due to social vulnerability theory and what was observed in Waves 1 and 2.
3.4 Data Collection Methodology The household surveys were conducted face-to-face by interviewer teams of two. An information sheet about the field study and Center project were handed to households upon answering the door; a consent script was used to obtain verbal consent prior to surveying (see Appendix 3B for the information sheet and Appendix 3C for the consent script). The surveying took place April 11 to 21, 2019, across both weekends, as well as during the weekdays with a more limited team allowing the team to shift more personnel to business surveys during typical workday/week hours. In addition to required institutional ethical human subjects training, all surveyors received team training on ethics, survey use, planned field coordination, and best practices for in-field safety prior to being in the field, and additional guidance and training when in the field. This section provides the detailed description of pre-trip training, daily operations and in-field training, and data management.
3.4.1 Daily Operations Daily Process. Each morning, the team would convene to review logistics for the day, including arranging teams, vehicles, drivers, creating a check-in schedule, retrieving packets of data collection materials (e.g., surveys, photo release forms, supplemental information for respondents such as local mental health resources, interview guides, personal protective gear), and preparing for data collection. As needed, training sessions would be folded into this schedule to accommodate new team member arrivals or shifts in team composition. Survey preparation included review of the survey instrument, review of how the sample was clustered into smaller areas for team assignments, preparation of packets for each sample cluster, and discussion of issues with survey questions, answer options, data recording in the field, and data entry. Each evening, the full field study team would meet to enter and back-up data, update the sample based on housing units visited that day, and review any issues from the day. At the end of each day, the new data was entered into QualtricsXM software, licensed to the University of Kansas, by the survey team. Similarly, the sample database was updated each evening with information pertaining to which housing units were visited each day. This information was used to update the sample on Google Maps, and guide survey work for the following days, similar to what was done in Waves 1 and 2. Although resources (e.g., staff, time, and funds) were limiting factors in data collection, several actions were taken to improve the outcomes of the field study. To ensure a higher response rate to the housing survey, the team:

37
● Trained surveyors for maximum efficiency in the field; ● Concentrated surveying on evenings and weekends; ● Made repeat visits to housing units in the sample; ● Arranged scheduled follow up times for households not available for surveying during
initial visit (if willing to participate); ● Adjusted the field work plan and team composition based upon daily evaluation of results.
Driving Assessments. Prior to surveying in a new cluster and as time permitted, the teams would perform driving assessments of the sample clusters in order to identify all housing units that were clearly unoccupied or abandoned. This assessment allowed for increased surveying efficiency on the ground as time could be better concentrated on the housing units for which a response was likely. The process was as follows: a team of at least 2, ideally 3, individuals would travel in a single vehicle with one person driving, one navigating a route through the sample cluster, and a third (or the navigator) documenting the housing unit ID of each unoccupied or abandoned housing unit and capturing a photo of the housing unit. Times of Day. Emphasis was placed on concentrating survey or capacity on days and times when response rates were expected to be highest. Weekend days, afternoons, and early evenings were the focus of the effort, although there were teams that covered weekdays throughout the field study period. Early mornings (before 9am), and Sunday mornings (before noon) were avoided to respect cultural norms of the area. Teams completed their surveys before dusk for safety considerations. Team Composition. Representation of multiple disciplines was a primary focus of Wave 1 team composition. In Wave 2, the focus was on experience with surveying, knowledge of the area, and gender. A similar experience-based approach was used in Wave 3c. Other team composition factors were driven by an awareness of the importance of safety and matching best practices for field research in any location. Two teams of two would travel in a single vehicle and work through one cluster together. A vehicle would be moved when the team would complete a small geographic area (e.g., half of a block). The rule of thumb was to keep the vehicle where the surveyors could still see it. While gender was used as a team-composition criterion to maximize interviewer safety, the Wave 2 lesson that there was a higher success rate for teams of all female surveyors, particularly in higher-income and older-age neighborhoods was used to match teams to sampling clusters.
3.4.2 Data Management All physical data is stored in a locked file cabinet and all electronic media is saved in locked offices on the password protected computers of the principal investigators. A linked-list has been created where all identifiable information was replaced with code numbers. The same codes are used for field notes and photographs from each site. No names are attached to this documentation. Photographs produced through the fieldwork that contain identifiable information are only viewed by team members unless express written permission is provided by anyone identifiable in those images. Original data access is limited to project investigators who have completed the Institutional Review Board (IRB) training and whose universities have signed the Interagency

38
Agreement (IAA). The data will be maintained for the three-year archive period following the conclusion of the study and will be shared with NIST. Documenting survey responses. Data collection was completed using fillable paper-based survey forms. Data collectors carried all survey materials on clip boards including answer cards for select items (e.g., income, see Appendix 3A), project information sheets (see Appendix 3B), and resources for respondents (e.g., financial assistance information, see Appendix 3D), and. The survey forms included the housing unit ID as the primary identifier; surveyors were trained to record the ID on each page of the form in the event that pages were separated. Data was collected in accordance with the surveyor training. Any additional notes or cleaning of the survey form was completed before beginning the next survey. Surveyor guidance was included in the survey form to support the proper elicitation and recording of responses when in the field. Survey team members also discussed and verified answers with one another before moving to the next unit in the sample to verify that the data on the form was accurate. Photographs. While less damage and debris were visible during the Wave 2 data collection compared to Wave 1, Hurricane Florence in September 2018 caused new damage and debris to a portion of the housing sample. Although limited, pictures taken during Wave 3c captured some of the new damages from Hurricane Florence as well as the unoccupied housing units that had not experienced any repair or reconstruction since Hurricane Matthew and/or Hurricane Florence. Daily procedures of entry and back up. A number of steps were completed each day in order to ensure that all data were managed appropriately and in accordance with IRB protocol [15-6003H]. Each evening, upon return from the field, the team would complete the data entry of all survey forms recorded on that day, which included complete surveys as well as incomplete surveys with response code information filled in. The information would most often be entered by a member of the pair that directly recorded the data. All hardcopies of the survey collection forms were then stored by the field study leads.
3.4.3 Data Cleaning Process In-field data entry for Wave 3c housing survey was first tested with Wave 2. Having the team enter data at the end of the day proved to be extremely valuable as issues with the electronic survey form were quickly resolved and the electronic form could be fixed on the fly. In addition, if a team member had a question about what they wrote down on the form, they can directly discuss an issue with other team members and decide what they should enter on the electronic form. This enabled the team to increase the validity of the data and reduce human errors during the data entry process.
The data were entered using Qualtrics and stored on the cloud server provided through Texas A&M University. Data were also entered in Google Sheets in order to update the sample map.
In addition to doing data entry in the field, data cleaning was also initiated during the field study. This was done by merging the Google Sheet with the Qualtrics CSV file and checking for inconsistencies. After merging, five types of issues were checked, including:
1. Incorrectly typed housing unit IDs 2. Double entered survey forms 3. Missing entries – surveys not entered

39
4. Second visit surveys not entered 5. Issues with inconsistencies in the use of completion codes
These data cleaning issues were resolved at the end of the day with team members familiar with the data collection, fixing issues on the spot. All changes for Qualtrics were recorded in a Stata Do file. After the field trip, the data entry was double-checked with the original hardcopy of the survey to identify any typographical errors, and any logical inconsistency.
Labeling in Qualtrics. To make it easier to create the desired Stata Dataset, having the codes for variables in the labeling was efficient. For example, instead of “Yes,” substituting “1. Yes” made the conversion from Qualtrics to Stata easier. It also helped ensure consistency in the coding. It is possible to edit the labels in Qualtrics after the data entry without impacting the data. But editing survey questions in Qualtrics should only be done to add the numerical code and not change any of the ordering or content. In addition, in order for Stata to process all possible answers for each question, sample entries with preview mode were completed by selecting each possible answer.
Reformatting Temporal Data. The formatting of temporal data (length of time in days, weeks, and months, for example) has been found to be a consistent problem across survey waves. During Wave 3c some data were still collected by respondents with different formats, such as calendar date or verbal description. In addition, not every respondent remembered the exact date of dislocation or a number of days utilities were out of service, so respondents provided partial information of dates during the survey. In this case, several rules were applied to obtain consistent estimates. When converting string variables to numeric variables with days format, all descriptions from comments, verbal description, and other information collected from the survey in the field were used to estimate the date. Timing issues generally occurred in questions related to “the impacts of Hurricane Florence on utilities” and “the insurance payouts.” The same rules were applied to the data cleaning process for all time-related questions.
First, similar to the Wave 2 data cleaning process, when a range was recorded for the timing of events, the higher value was taken (e.g., 2 to 3 months was recoded as 3 months in the final dataset).
Second, when the exact date was not recorded and only the month was recorded on the survey or in Qualtrics, the midpoint day for MM/YY information was used. For example, if March/2017 was provided as the day of insurance payout after Hurricane Matthew, the team assumed it meant March 15, 2017, and calculated days from October 10, 2016 when Hurricane Matthew flooding occurred in Lumberton. In addition, if the year the household moved to the unit was roughly provided as 1970s in Qualtrics, the rough range (1970s) was converted to 1975 to calculate years lived in the unit.
Third, although most timing questions were intended to be answered as a number of days, some respondents answered with a specific date. Therefore, the date had to be converted to days by subtracting the answer date to the day of the hurricane events. For consistency, the team came to a consensus to fix October 10, 2016 for Hurricane Matthew to calculate temporal variables since the flood depth peaked on that day in Lumberton; this date has been consistently used by the field study team since Wave 1. For Hurricane Florence, September 17, 2018 was chosen because heavy rain caused widespread inland flooding on that day and mandatory evacuation was announced on September 16, 2018 in South and West Lumberton.

40
Fourth, if the month was the only information provided by households and it was the same month that Hurricane Florence occurred, the team assumed it lasted approximately 15 days. For example, if the household answered the insurance payout after Hurricane Florence was received in “9/2018”, it was converted to 15 days by subtracting the peak date of Hurricane Florence from the end of September 2018.
Lastly, if the household answered the utilities are “still not repaired” or the insurance payouts are “still not received” it was recorded as missing to differentiate from either the most recently repaired or received date, which would be the longest days in the variable. In addition, flag variables were created and used to differentiate them from “not-responded” missing values.
3.5 Housing Survey Results The data for housing recovery were analyzed independently, though it will contribute later to a broader suite of analyses as part of the longitudinal study for Lumberton, NC. This section presents the housing survey summary statistics resulting from Wave 3c. Analyses include basic descriptive statistics and visual presentation of the data. Detailed and comprehensive analyses including empirical modeling will be presented outside of this report in peer-reviewed articles. Resulting publications will be made available on the Center website (http://resilience.colostate.edu/publications.shtml).
3.5.1 Survey Response Rates Data was collected from three types of interviewees: continuous residents, new residents, and when the resident was not available, a neighbor or manager was sought for limited information. New residents are those who moved into the housing unit after Hurricane Florence and the subsequent flooding. Continuous residents are those who lived in the housing unit before Hurricane Florence, and were asked the longest set of questions on the survey. Survey completion rates are reported in Table 3-1 as ineligible, abandoned, no answer, refusal, and completed surveys. Ineligibility could have occurred due to having no access to the property (e.g., gated fence, dangerous crossing), or when a non-residential property appeared in the sample due to original miscoding or property changes since the last field study. Abandoned sample units were marked when there was an existing residential unit on the property with evidence of abandonment. This evidence was based on either the surveyor’s observation or consultation with a neighbor. No answer was marked when the unit was visited, and (1) it did not appear to be abandoned, but there was no answer at the door by the resident and no consultation with a neighbor or manager, or (2) a child answered the door and there was no adult available. Refusals include those households who answered the door but declined to speak with the survey team. Completed surveys are reported for those sample units where surveyors were able to complete at least a portion of the survey with them. The rate of completed surveys is provided for the three types of interviewees in Table 3-1. Response rates by housing type are provided in Table 3-1. When subtracting the ineligible sample units from the original housing sample (n = 549), and counting abandoned sample units as responses, the overall response rate was 71 %. Without considering abandoned sample units as responses, the response rate is 38 %. When only considering completions by new and continuous

41
residents, the response rate was 34 %. These latter two figures are not incorporated into Table 3-1 but provide reassurance of a successful data collection.
Table 3-1. Housing survey response rates. Housing Type
Sample Ineligible Abandoned No Answer
Refusal Completion by
Neighbor
Completion by New Resident
Completion by
Continuous Resident
Response Rate
% (Count)
% (Count)
% (Count)
% (Count)
% (Count)
% (Count).
% (Count)
% (Count)
Single-Family
76 % (431)
94 % (17)
76 % (134)
79 % (110)
85 % (17)
11 % (3)
62 % (15)
83 % (135)
69 %
Multi-Family
19 % (107) - 14 %
(25) 19 % (26)
10 % (2)
81 % (21)
38 % (9)
15 % (24)
74 %
Manuf. Home
2 % (14) - 4 %
(8) - - 8 % (2) - 2 %
(4) 100 %
Other / Not Specified
3 % (15)
6 % (1)
6 % (10)
2 % (3)
5 % (1) - - -
66 %
Total 100 % (567)
100 % (18)
100 % (177)
100 % (139)
100 % (20)
100 % (26)
100 % (24)
100 % (163)
71 %
3.5.2 Findings: Hurricane Florence Flood Impacts and Recovery This section presents descriptive statistics on housing disruption caused by Hurricane Florence, and continued housing recovery from both Hurricane Matthew and Hurricane Florence. The statistics provided are based on the proportioned sample of 861 housing units and will focus on: the damage to the residential buildings; dislocation and duration of the dislocation for each impacted household; causes of delay in households returning home; access to public services post-hurricane; reported possibility of re-location; perceived educational recovery status for those residents with children; duration of missed work; and, mitigation efforts pre- and post-hurricanes. Different numbers of households responded to individual questions, hence all reported numbers and percentages are out of the re-proportioned sample of 861, unless otherwise stated.
Damage and Functionality Loss Table 3-2 provides the resident-reported damage caused by Hurricane Matthew. This factor was necessary to understand and control for in order to investigate disruption and recovery from Hurricane Florence. Of the 299 households providing information about home damage caused by Hurricane Matthew, 107 (36 %) are located within the inundation area. A total of 137 (46 %) households reported damage from Hurricane Matthew, 138 (46 %) reported no damage from Hurricane Matthew, and 24 (8 %) households did not know if any damage occurred. Table 3-2 also breaks responses to this question by housing type, where a fairly equal proportion of single- and multi-family units were damaged (45 % and 47 %, respectively) and undamaged (49 % and 36 %, respectively), albeit substantially fewer multi-family home residents were surveyed. Five manufactured home residents completed surveys, where 4 of them indicated that their home was damaged by Hurricane Matthew. When asked to approximate the amount of damage that was repaired prior to Hurricane Florence, 131 households responded, where 88 (67 %) replied that “All” damage was repaired, 12 (9 %) said “Most” of the damage was repaired, 19 (15 %) said

42
“Some” damage was repaired, and 12 (9 %) said “None” of the damage to the housing unit was repaired.
Table 3-2. Hurricane Matthew-induced damage to home.
Home damaged from Hurricane Matthew? Count
(%)
By housing type: Single Family
Multi- Family
Manufactured Homes Other
Yes 137 (46 %)
111 (45 %)
22 (47 %)
4 (80 %) -
No 138 (46 %)
119 (49 %)
17 (36 %) - 2
(100 %)
Don’t know 24 (8 %)
15 (6 %)
8 (17 %)
1 (20 %) -
n = 299 245 47 5 2
As shown in Table 3-3, when asked if the housing unit was damaged by Hurricane Florence, 132 (44 %) of the 299 respondents claimed to have suffered damage, while 7 (2 %) did not know. The remaining 160 (54 %) of the responding households claimed no damage from Hurricane Florence. When separated by housing type, a lower proportion of multi-family housing units reported damage compared to single-family and manufactured homes. Looking across Tables 3-2 and 3-3, we can see that 6 more single-family homes, 12 fewer multi-family homes, and the same number of manufactured homes were damaged in Hurricane Florence compared to Hurricane Matthew. Figure 3-1 provides the distribution of the number of days it took to repair the home reported by the residents. For the 132 households reporting damage, the unit was repaired an average of 60.3 days after Hurricane Florence, while 51 (39 %) reported that the unit still had not been completely repaired. Seven (5 %) provided no answer and 3 (2 %) did not know the timeframe of repairs to their housing unit. Looking at Figure 3-1, 11 (8 %) damaged housing units required one and two weeks to complete repairs, whereas 19 (14 %) took between one and two months, and 12 (9 %) took 60 to 120 days and another 12 homes took 121 to 240 days to complete repairs.
Table 3-3. Hurricane Florence-induced damage to home.
Home damaged from Hurricane Florence? Count
(%)
By housing type:
Single Family
Multi- Family
Manufactured Homes Other
Yes 132 (44 %)
117 (48 %)
10 (21 %)
4 (80 %)
1 (50 %)
No 160 (54 %)
125 (51 %)
34 (72 %)
1 (20 %) -
Don’t know 7 (2 %)
3 (1 %)
3 (6 %) - 1
(50 %) n = 299 245 47 5 2

43
Figure 3-1. Number of days to repair home.
When asked if the respondent’s housing unit lost electrical power, water, potable water, sewer, and liquified petroleum (LP) gas, researchers received 288 responses shown in Table 3-4 separated by tenancy, where the category “Other” includes six respondents who did not declare whether they owned or rented their housing unit. Of the 227 (79 %) respondents who lost electrical power after Hurricane Florence, 163 were homeowners and 61 were renters. Proportionately more homeowners lost power (859 %) compared to renters (68 %). Of the 113 (39 %) who lost water after Hurricane Florence, 86 were homeowners and 27 were renters. Approximately half as many households lost water as compared to power, including 45 % of homeowners and 30.0 % of renters. While water supply is important, so is its quality. Respondents were also asked whether their water was safe to drink once it was flowing again; 161 (56 %) reported their water was safe to drink, including 60 % of homeowners and 50 % of renters. Wastewater service interruption was not as widespread as water service disruption. When asked whether their sewer stopped working, 86 (30 %) reported that it did go out, including 33 % of homeowners and 26 % of renters. The loss of propane or LP gas to a housing unit can have impacts for residents ranging from losing the ability to cook or bathe to having no heat in the home. Thus, finally, residents were asked if their LP gas service stopped and 33 (11 %) reported that it did go out, where 116 (40 %) of the respondents reported not having this service to begin with. Homeowners were nearly twice as likely to lose LP gas as compared to renters (14 % compared to 8 %). Overall, a higher proportion of homeowners lost all utility services reported in Table 3-4 after Hurricane Florence.
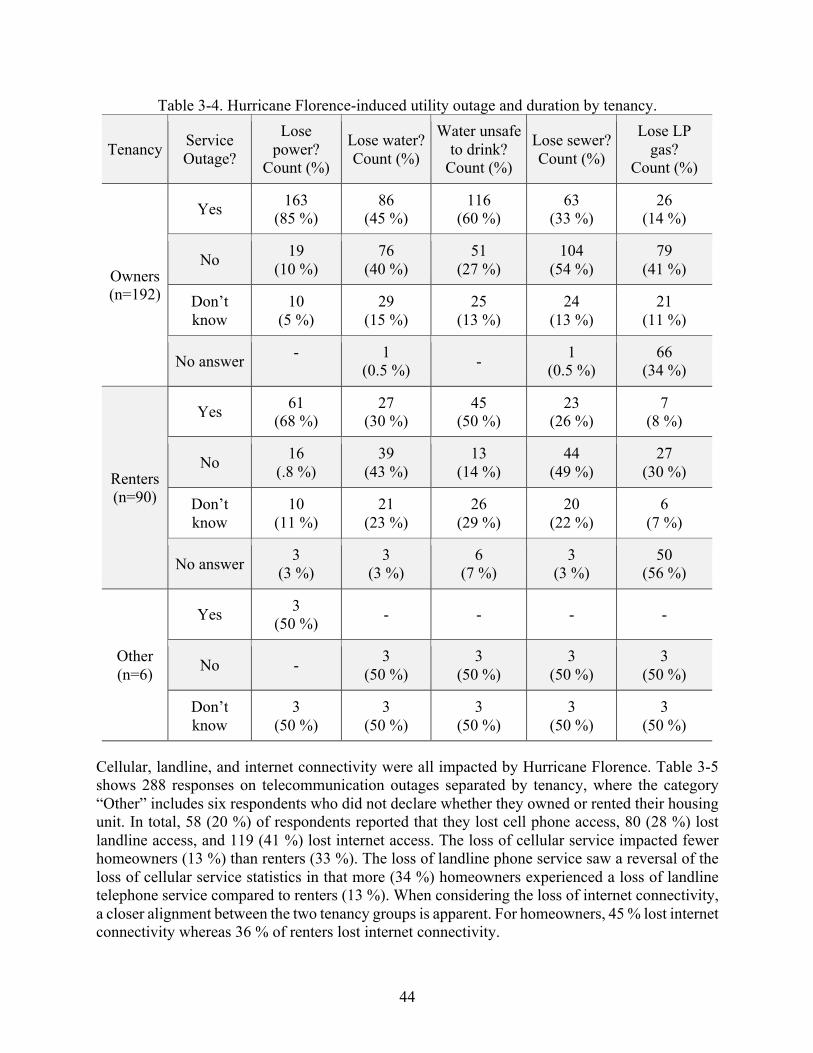
44
Table 3-4. Hurricane Florence-induced utility outage and duration by tenancy.
Tenancy Service Outage?
Lose power?
Count (%)
Lose water? Count (%)
Water unsafe to drink?
Count (%)
Lose sewer? Count (%)
Lose LP gas?
Count (%)
Owners (n=192)
Yes 163 (85 %)
86 (45 %)
116 (60 %)
63 (33 %)
26 (14 %)
No 19 (10 %)
76 (40 %)
51 (27 %)
104 (54 %)
79 (41 %)
Don’t know
10 (5 %)
29 (15 %)
25 (13 %)
24 (13 %)
21 (11 %)
No answer -
1 (0.5 %) - 1
(0.5 %) 66
(34 %)
Renters (n=90)
Yes 61 (68 %)
27 (30 %)
45 (50 %)
23 (26 %)
7 (8 %)
No 16 (.8 %)
39 (43 %)
13 (14 %)
44 (49 %)
27 (30 %)
Don’t know
10 (11 %)
21 (23 %)
26 (29 %)
20 (22 %)
6 (7 %)
No answer 3 (3 %)
3 (3 %)
6 (7 %)
3 (3 %)
50 (56 %)
Other (n=6)
Yes 3 (50 %) - - - -
No - 3 (50 %)
3 (50 %)
3 (50 %)
3 (50 %)
Don’t know
3 (50 %)
3 (50 %)
3 (50 %)
3 (50 %)
3 (50 %)
Cellular, landline, and internet connectivity were all impacted by Hurricane Florence. Table 3-5 shows 288 responses on telecommunication outages separated by tenancy, where the category “Other” includes six respondents who did not declare whether they owned or rented their housing unit. In total, 58 (20 %) of respondents reported that they lost cell phone access, 80 (28 %) lost landline access, and 119 (41 %) lost internet access. The loss of cellular service impacted fewer homeowners (13 %) than renters (33 %). The loss of landline phone service saw a reversal of the loss of cellular service statistics in that more (34 %) homeowners experienced a loss of landline telephone service compared to renters (13 %). When considering the loss of internet connectivity, a closer alignment between the two tenancy groups is apparent. For homeowners, 45 % lost internet connectivity whereas 36 % of renters lost internet connectivity.
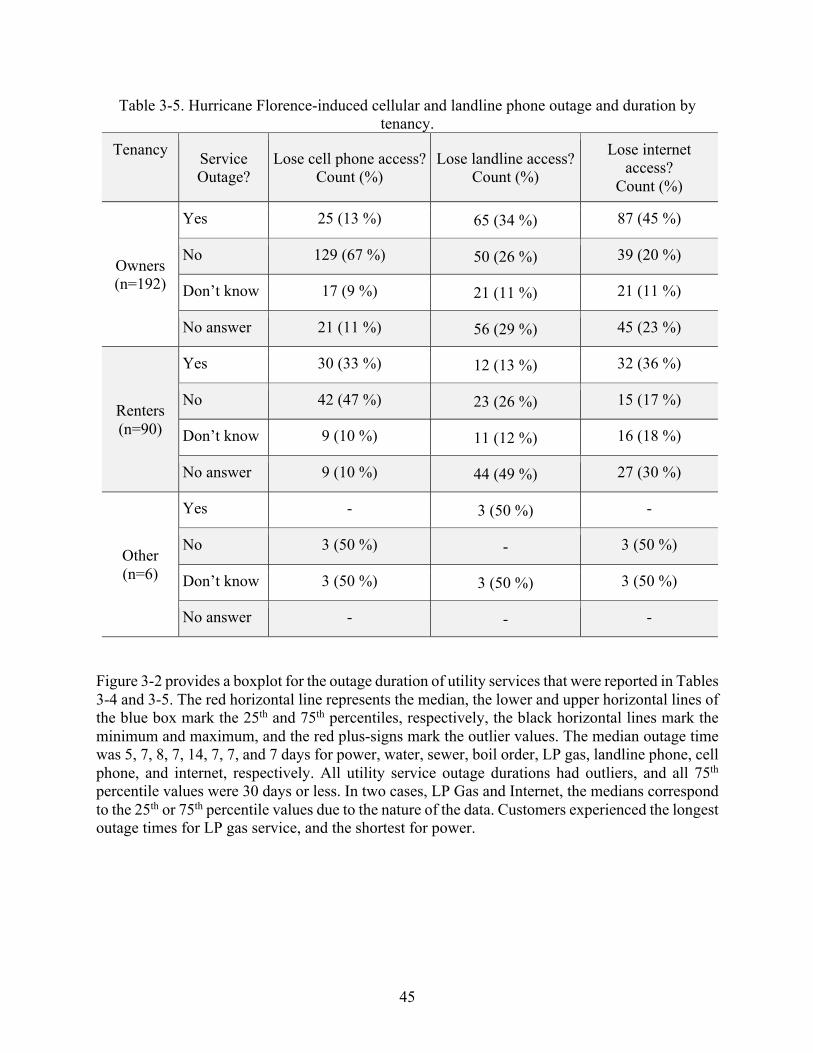
45
Table 3-5. Hurricane Florence-induced cellular and landline phone outage and duration by tenancy.
Tenancy Service Outage?
Lose cell phone access? Count (%)
Lose landline access? Count (%)
Lose internet access?
Count (%)
Owners (n=192)
Yes 25 (13 %) 65 (34 %) 87 (45 %)
No 129 (67 %) 50 (26 %) 39 (20 %)
Don’t know 17 (9 %) 21 (11 %) 21 (11 %)
No answer 21 (11 %) 56 (29 %) 45 (23 %)
Renters (n=90)
Yes 30 (33 %) 12 (13 %) 32 (36 %)
No 42 (47 %) 23 (26 %) 15 (17 %)
Don’t know 9 (10 %) 11 (12 %) 16 (18 %)
No answer 9 (10 %) 44 (49 %) 27 (30 %)
Other (n=6)
Yes - 3 (50 %) -
No 3 (50 %) - 3 (50 %)
Don’t know 3 (50 %) 3 (50 %) 3 (50 %)
No answer - - -
Figure 3-2 provides a boxplot for the outage duration of utility services that were reported in Tables 3-4 and 3-5. The red horizontal line represents the median, the lower and upper horizontal lines of the blue box mark the 25th and 75th percentiles, respectively, the black horizontal lines mark the minimum and maximum, and the red plus-signs mark the outlier values. The median outage time was 5, 7, 8, 7, 14, 7, 7, and 7 days for power, water, sewer, boil order, LP gas, landline phone, cell phone, and internet, respectively. All utility service outage durations had outliers, and all 75th percentile values were 30 days or less. In two cases, LP Gas and Internet, the medians correspond to the 25th or 75th percentile values due to the nature of the data. Customers experienced the longest outage times for LP gas service, and the shortest for power.

46
Figure 3-2. Utility service outage time.
Dislocation Time and Decision-Making
Housing dislocation after Hurricane Florence is presented in Table 3-6 with 178 of the 282 respondent households (63 %) reporting spending at least one night away from their home after Hurricane Florence. Approximately 33 % of renters and 25 % of occupants of multi-family dwellings were dislocated relative to homeowners and occupants of single-family dwellings, respectively. While 85 % of renters reported dislocating from their homes, only 53 % of homeowners were dislocated. Although a small number of occupants of other building types answered this survey question, 50 % of manufactured home residents were dislocated after Hurricane Florence. The average number of days of dislocation was nearly twice as long for homeowners (25.3 days) when compared with renters (13.3 days) with the duration of dislocation reported by homeowners having a higher variance compared to renters. Similarly, average dislocation duration was longer for occupants of single-family homes (21.2 days) compared to occupants of multi-family dwellings (15.9 days) and manufactured homes (4.5 days) with pretty similar standard deviation for single- and multi-family dwellings and less so for manufactured homes. Median days of dislocation were relatively consistent for all housing and tenancy types, except for manufactured homes and the Other category, which were both shorter.

47
Table 3-6. Household dislocation and duration by housing type following Hurricane Florence. Count
(%) Average (days)
Median (days)
Std. Dev. (days)
Housing Type
Single-Family (n=232)
137 (59 %) 21.2 10 32.2
Multi-Family (n=44)
37 (84 %) 15.9 10 29.2
Manufactured Home (n=4)
2 (50 %) 4.5 4.5 3.5
Other (n=2)
2 (100 %) 13 3.5 11.3
Tenure Renter (n=87)
74 (85 %) 13.3 10 22.2
Owner (n=192)
101 (53 %) 25.3 11 36.6
Other (n=3)
3 (100 %) 8.0 8 0
Figure 3-3 presents the distribution of dislocation time by tenancy. As shown in Figure 3-3, 104 households did not dislocate after Hurricane Florence, including 91 homeowners and 13 renters. Of the 178 households who were dislocated from their homes, the majority, comparable numbers of homeowners (39 and 25) and renters (34 and 32) were dislocated for one and two weeks. In total, 29 homeowners and 8 renters were dislocated for longer than two weeks.
Figure 3-3. Dislocation time after Hurricane Florence.
Researchers asked respondents four questions to understand the issues that hindered the return to their homes. These questions were framed around the timing of insurance payouts, the operational status of their place of employment, and school and business closures. The results are provided in

48
Table 3-7. Overall, these factors influenced the decision to return for small portions of households in our sample. The largest proportion of respondents (15 %) answered that the timing of insurance company payouts or financial assistance delayed their return to their home. When asked if a change or closure of their workplace caused a delay in returning to their home, 12 % responded that it did. Smaller proportions, 8 % and 9 % of respondents indicated that their child’s school closure and changes with other businesses in town caused a delay in their return to home after Hurricane Florence.
Table 3-7. External influences on decision to return home after Hurricane Florence.
Influence your decision to return home?
Timing of assistance Work changes Children’s
school changes Changes with
other businesses
Count (%)
Count (%)
Count (%)
Count (%)
Yes 22 (15 %)
16 (12 %)
9 (8 %)
13 (9 %)
No 129 (86 %)
118 (88 %)
107 (92 %)
134 (89 %)
Don’t know - - 1 (1 %)
3 (2 %)
n= 151 134 117 150
Dislocation has ripple effects in the lives of the individual and household functions. When asked if any household members missed any time at work, 74 (26 %) of the respondents reported that members of their household had to miss work due to flooding since the beginning of 2018, while 105 (37 %) did not miss any work, one did not know and 105 (37 %) did not answer the question. Figure 3-4 presents the distribution of the reported work days missed by any household member. Overall, 47 (63 %) of those who missed work missed one week or less of work. One household had an individual miss 120 days of work due to housing issues since the beginning of 2018.

49
Figure 3-4. Number of days household member missed work since the beginning of 2018 due to
housing issues caused by flooding.
Housing Recovery Progress Stability and accessibility were introduced as housing recovery metrics during Wave 2 (Sutley, Dillard, and van de Lindt et al. 2021). Stability is measured as a household intending to stay in their current home for at least one year. Accessibility is measured by whether the household indicates they have the same access to essential needs, including work, school, and grocery stores, in their current home now as they did before the flood event(s). In Wave 3c, households were again asked whether they planned to move from their home due to hurricane related reasons within the next year and 22 of the 192 homeowners (11 %) answered “Yes” compared to 20 of the 90 renters (22 %) also said that they intended to move. Of those homeowners responding in the affirmative, 13 of the 22 said that they planned on moving “somewhere else in North Carolina.” Of the renters responding yes to this question, 15 of the 20 (75 %) said they planned to move “somewhere else in North Carolina.” In Wave 3c, households were again asked whether they had the same level of access to their children’s school, work, and grocery stores at present compared to before Hurricane Matthew and Hurricane Florence. The results are presented in Table 3-8, where 32 %, 52 %, and 80 % of homeowners indicated increased access to school, work, and grocery stores, respectively. Similar proportions of renters indicated increased access to school, work, and grocery stores, including 40 %, 49 %, and 74 %, respectively. As shown in Table 3-8, larger portions of surveyed households did not respond to the question about school access given that they did not have children living in the home.

50
Table 3-8. Change in household access to essential needs after Hurricane Matthew. Tenancy Increased since
Hurricane Matthew School?
Count (%) Work?
Count (%) Grocery Stores?
Count (%)
Owners (n=192)
Yes 61 (32 %) 99 (52 %) 153 (80 %)
No 5 (3 %) 10 (5 %) 34 (17 %)
Don’t know 8 (4 %) 5 (3 %) -
No answer 118 (61 %) 78 (41 %) 5 (3 %)
Renters (n=90)
Yes 36 (40 %) 44 (49 %) 67 (74 %)
No 6 (7 %) 7 (8 %) 8 (9 %)
Don’t know 2 (2 %) 2 (2 %) 1 (1 %)
No answer 46 (51 %) 37 (41 %) 14 (16 %)
Other (n=6)
Yes - - 3 (50 %)
No - - -
Don’t know - - -
No answer 6 (100 %) 6 (100 %) 3 (50 %)
Educational Recovery Based on 285 survey responses, 85 (30 %) households reported having at least one person under the age of 18 living in the household at the time of the Wave 3c survey. If there were children in the household, researchers asked if those children were enrolled in a Lumberton district school in the last 12 months. Eighty-two of the 85 (97 %) responded to the question, of which 78 (95 %) of the respondents replied in the affirmative. For those 78 respondents, a multiple-choice question was presented asking about the perceived trajectory of the children’s educational recovery following both Hurricanes. The majority of respondents had a positive view about their child/ren’s educational recovery with 2 (3 %) and 52 (67 %) reporting that their child/ren’s educational recovery was better than and back to where it was prior to the two Hurricanes, respectively. Approximately 22 % reported that their child/ren’s educational recovery trajectory was worse than before the Hurricanes, and 9 % said they were uncertain.
Recovery Resources and Unmet Needs There are many recovery resources that become available to households after disasters. Table 3-9 presents insurance coverage and claim payment timing after Hurricane Florence. Eighty-one percent of respondents had an active homeowner’s insurance policy, 26 % were covered by flood insurance, and 11 % were covered by renter’s insurance. Looking at those covered by the individual types of insurance, 16 % of the 156 who had homeowner’s insurance were paid for a

51
claim, 47 % of the 49 who had flood insurance received a claim payment, and 30 % of the 10 who had renter’s insurance received a claim payment after Hurricane Florence. The average number of days to receive insurance claim payments after Hurricane Florence were approximately 37 days, 39 days, and 7 days for homeowner’s, flood, and renter’s insurance, respectively, with the greatest variation in waiting time for flood insurance claim recipients.
Table 3-9. Insurance coverage, insurance payment receipt, and timing after Hurricane Florence.
Homeowner’s Insurance
Flood Insurance
Renter’s Insurance
Count (%) Count (%) Count (%)
Had coverage 156 (81 %) 49 (265 %) 10 (11 %)
Received payment 25 (16 %) 23 (47 %) 3 (30 %)
Average days to receive payment 36.6 39 7
Std. dev. days to receive payment 27.9 42.8 0
Table 3-10 provides the proportion of households surveyed who applied for different types of assistance. Considering who did apply, Table 3-11 provides the proportion of households who received different types of assistance and when they received it after Hurricane Matthew. Table 3-12 provides the same information about who received assistance and what kind and when after Hurricane Florence. As shown in Table 3-10, the highest proportion of survey respondents applied for Federal Emergency Management Agency (FEMA) Individual and Household Program (IHP) funds (61 %), followed by asking or applying for cleanup help from NGOs (43 %), and followed by asking friends and family (F&F) for help with cleanup (32 %). The smallest portion of respondents applied for Department of Housing and Urban Development (HUD) funding (9 %) and FEMA Hazard Mitigation Grant Program (HMGP) funds (11 %). In general, as evident from Table 3-10, a significant portion of affected households did not apply for external recovery funding.
Of those who did apply for funding, the highest proportion received FEMA IHP funds (97 %), following by cleanup help from friends and family (80 %) after Hurricane Matthew. After Hurricane Matthew, the lowest recovery funding rate was with HUD (38 %) and NGO funding (39 %). After Hurricane Matthew, FEMA IHP funding took 138 days on average, whereas NGO funding took 165 days on average to arrive. Notably, cleanup help and financial assistance from friends and family were much quicker than other recovery help and came in during the first month after Hurricane Matthew. Although some households were approved for FEMA HMGP and HUD recovery assistance, few households had received either at the time of the Wave 3c survey.
Differently, of those who did apply for funding after Hurricane Florence, the highest proportion received NGO funding (74 %), followed by cleanup help from NGOs and funds from friends and family (both at 53 %). FEMA HMGP (20 %) and HUD (13 %) had the lowest rates of approved applications. Funding distribution was faster, on average, after Hurricane Florence compared to

52
Hurricane Matthew. FEMA IHP and NGO funding took an average of 48 days, and funding from friends and family took 23 days on average after Hurricane Florence.
Table 3-10. Household recovery resource inquiries. FEMA
IHP Count (%)
FEMA HMGP Count (%)
SBA Count (%)
HUD Count (%)
NGO funding Count (%)
NGO cleanup Count (%)
F&F funding Count (%)
F&F cleanup Count (%)
Applied/ asked
69 (61 %)
10 (11 %)
22 (22 %)
8 (9 %)
23 (24 %)
45 (43 %)
16 (17 %)
30 (32 %)
Did not apply/ask
44 (39 %)
83 (89 %)
77 (78 %)
85 (91 %)
73 (76 %)
60 (57 %)
77 (83 %)
64 (68 %)
Total responding 113 93 99 93 96 105 93 94
Table 3-11. Resources received and timing of receipt after Hurricane Matthew. FEMA
IHP Count (%)
FEMA HMGP Count (%)
SBA Count (%)
HUD Count (%)
NGO funding Count (%)
NGO cleanup Count (%)
F&F funding Count (%)
Received Resource (Count (%))
67 (97 %)
6 (60 %)
13 (59 %)
3 (38 %)
9 (39 %)
21 (47 %)
24 (80 %)
Total households applying/asking
69 10 22 8 23 45 30
Average days to receive resource
137.7 - 203.3 - 165.3 23.3 24.5
Std. dev. days to receive resource
237.0 - 117.8 - 151.7 22.8 51.9

53
Table 3-12. Resources received and timing of receipt after Hurricane Florence. FEMA
IHP Count (%)
FEMA HMGP Count (%)
SBA Count (%)
HUD Count (%)
NGO funding Count (%)
NGO cleanup Count (%)
F&F funding Count (%)
Received Resource (Count (%))
32 (46 %)
2 (20 %)
5 (23 %)
1 (13 %)
17 (74 %)
24 (53 %)
16 (53 %)
Total households applying/asking
69 10 22 8 23 45 30
Average days to receive resource
47.5 - 59 - 102 47.5 23.1
Std. dev. days to receive resource
45.4 - 0 - 34.9 50.4 52.4
Respondents were asked to consider all of the types of recovery resources listed in Tables 3-9 through 3-12 and determine whether the resources were sufficient to repair and replace all physical damages to their home and contents caused by both Hurricanes Matthew and Florence. As shown in Table 3-13, 26 % indicated that they did receive sufficient funding to complete repairs and replacement, whereas 67 % reported unmet needs. Of those with unmet needs, 83 % indicated their unmet needs were covered using personal funds. Respondents were also asked to provide the approximate proportion of their repairs covered by recovery resources. Of the 48 who responded to this question, 39 % indicated very little, 54 % indicated some, and 6 % indicated almost all of their repairs were covered (results not shown).
Table 3-13. Covering repair and replacement costs. External Funds Covered Everything
Count (%) Paid for Rest from Personal
Funds Count (%)
Yes 19 (26 %) 40 (83 %) No 49 (67 %) 7 (15 %) Unsure 5 (7 %) 1 (2 %) Total responding 73 48
Preparedness and Mitigation, and Social Capital
Researchers asked a series of questions about changes in social interactions and individual preparedness and mitigation actions taken as one aspect of understanding household- and neighborhood-level capacity. These responses are presented in Table 3-14. When asked if the impacts of Hurricane Matthew had increased their community involvement, roughly one-third of homeowners (64 out of 192, 33 %) and renters (30 out of 90, 33 %) alike responded that the events of Hurricane Matthew increased their community involvement. When asked if the events of

54
Hurricane Matthew increased their contact with neighbors or extended family, 72 out of the 192 (38 %) of the homeowners and 36 out of the 90 (40 %) renters agreed that the events of Hurricane Matthew had increased their contact with neighbors or extended family members.
Table 3-14 presents results from a series of prompts regarding actions taken by households either before Hurricane Florence or at the time of the Wave 3c survey (after Hurricane Florence. Varying numbers of households responded to each portion of each prompt, so percentages are not provided. In total, 32 households elevated their hot water heater and/or HVAC before Hurricane Florence, and 45 (including the 32 reported above) had an elevated water heater and/or HVAC at the time of the Wave 3c survey. More households (59 before Hurricane Florence and 71 at the time of the survey) had elevated interior contents in preparation for the flood. Fewer (25 before Hurricane Florence and 33 at the time of the survey) had their home assessed by a structural engineer. The fewest households (15 before Hurricane Florence and 24 at the time of the survey) had re-routed ductwork from below the floor of their home to the attic space above their home. The largest number of households (129 before Hurricane Florence and 133 at the time of the survey) made a disaster plan with their household members. In terms of other strategies, seven households described actions taken either before or after Hurricane Florence, including limiting the amount of food kept in their freezer, taping their windows, stocking food and water, knowing where to go should they need to evacuate again, and having a preparedness kit.
Table 3-14. Mitigation and preparedness strategies taken by households before Hurricane Florence and at the time of the Wave 3c survey (after Hurricane Florence).
Strategies Had before Hurricane Florence
Have now
Yes No Don’t Know
Yes No Don’t Know
Elevate hot water heater and/or HVAC
32 253 12 45 215 10
Elevate interior contents in preparation for the flood
59 225 5 71 199 2
Assess the building (structurally) by an engineer
25 233 29 33 210 22
Re-route ductwork from below floor to attic space
15 250 18 24 227 14
Make disaster plan with household members
129 147 12 133 121 12
Other 5 - - 2 - -
Households were then asked whether their involvement with their community (defined by the respondent) and contacts with their neighbors or extended family had increased since Hurricane Matthew. This set of questions reflect the construct of social capital and aim to show whether social capital and social connectedness have been affected by the disaster experience. Table 3-15 presents the responses to the social capital questions grouped based on tenure status. From the 192 homeowner households who responded, only 64 (33 %) believed their community involvement has increased very similar to renters, 30 (33 %) of whom reported such increase. Changes were slightly higher when households were asked about contact with their neighbors or extended family.

55
Of the 192 homeowner households, 72 (37 %) and of the 90 renter households 36 (40 %) reported an increase in such contacts since Hurricane Florence
Table 3-15. Change in community involvement and contact with neighbors and extended family since Hurricane Matthew.
Tenancy Increased since
Hurricane Matthew Community Involvement?
Count (%)
Contact with neighbors/extended
Family? Count (%)
Owners (n=192)
Yes 64 (33 %) 72 (38 %)
No 120 (63 %) 108 (56 %)
Don’t know 4 (2 %) 5 (3 %)
No answer 4 (2 %) 7 (4 %)
Renters (n=90)
Yes 30 (33 %) 36 (40 %)
No 47 (52 %) 41 (46 %)
Don’t know 1 (1 %) 2 (2 %)
No answer 12 (13 %) 11 (12 %)
Other (n=6)
Yes - -
No 3 (50 %) 3 (50 %)
Don’t know - -
No answer 3 (50 %) 3 (50 %)
Household Socio-Demographics The demographic characteristics of the households responding to the survey are shown in Tables 3-16 through 3-18. Respondents were asked to self-identify the race and ethnicity of their household. The values in Table 3-16 are similar to those for the City of Lumberton, but differ from Robeson County, and the state of North Carolina, as reported in the ACS five-year estimates for 2019 (ACS, 2020). For example, White (alone) is reported as 43 %, 28 %, and 71 % for the City, County, and State, respectively, compared to 31 % in the Wave 3c data.

56
Table 3-16. Race and ethnicity of surveyed households.
Count %
White 110 31
Black or African American 130 37
American Indian or Native American 52 15
More than one race 13 4
Other 9 3
Hispanic or Latino 13 4
Missing, Race 40 11
Missing, Ethnicity 47 13 Table 3-17 provides the maximum educational attainment of any individual residing in the household. The values in Table 3-17 are similar in some cases and different in other cases when compared to 2019 ACS five-year estimates. For example, the five-year ACS estimates for 2019 report 11 %, 20 %, and 19 % for the State, County, and City, respectively, for the percentage of the voting age population with less than high school education; all of which are much higher than the 4 % of respondents surveyed. However, ACS reports 27 %, 34 %, and 32 % for the State, County, and City, respectively, for the percentage of the voting age population with a high school diploma, all of which are similar for the survey respondents in Wave 3c (28 %).
Table 3-17. Maximum household member education level of surveyed households.
Count %
Less than high school 14 4
High school 98 28
Associate’s degree or technical school 70 20
Bachelor’s degree 80 23
Master’s degree or higher 52 15
Missing 40 11
Table 3-18 provides survey results for the respondent’s household’s combined annual income. The values in Table 3-18 are similar to ACS data for Lumberton. For example, the ACS five-year estimates for 2019 report 6 %, 14 %, and 14 % for the State, County, and City, respectively, for households earning less than $10 000 per year, compared to 14 % recorded in Wave 3c. Similarly,
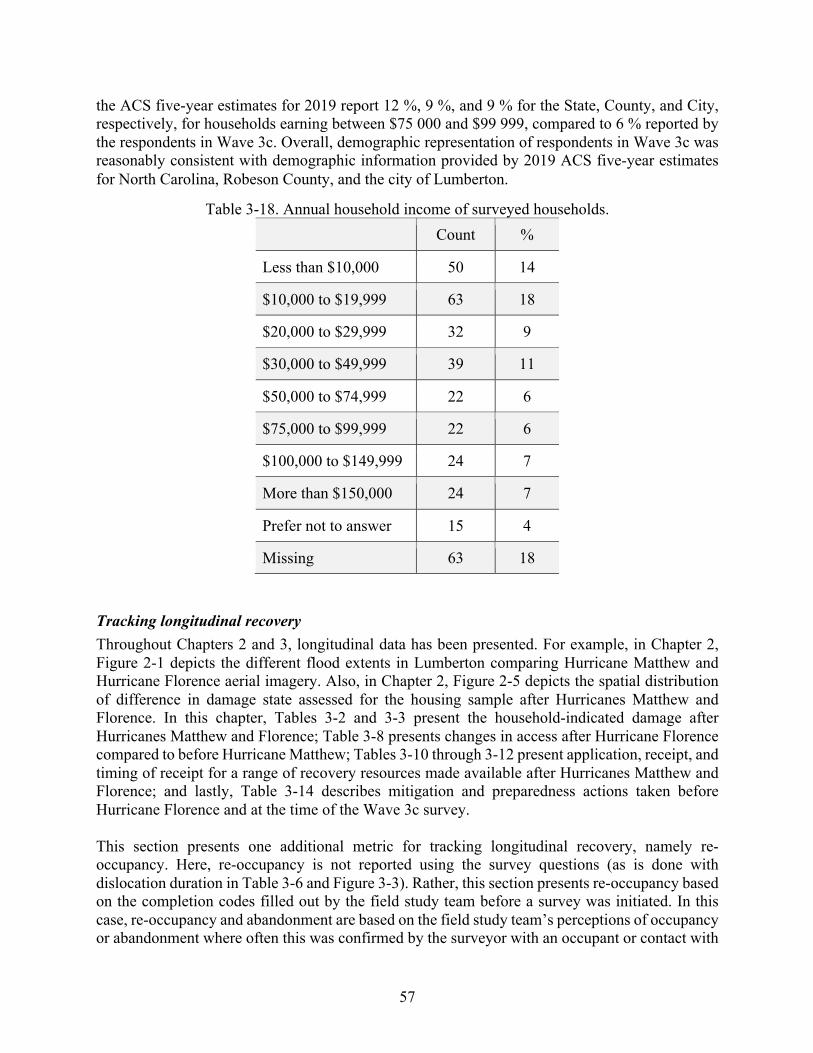
57
the ACS five-year estimates for 2019 report 12 %, 9 %, and 9 % for the State, County, and City, respectively, for households earning between $75 000 and $99 999, compared to 6 % reported by the respondents in Wave 3c. Overall, demographic representation of respondents in Wave 3c was reasonably consistent with demographic information provided by 2019 ACS five-year estimates for North Carolina, Robeson County, and the city of Lumberton.
Table 3-18. Annual household income of surveyed households. Count %
Less than $10,000 50 14
$10,000 to $19,999 63 18
$20,000 to $29,999 32 9
$30,000 to $49,999 39 11
$50,000 to $74,999 22 6
$75,000 to $99,999 22 6
$100,000 to $149,999 24 7
More than $150,000 24 7
Prefer not to answer 15 4
Missing 63 18
Tracking longitudinal recovery Throughout Chapters 2 and 3, longitudinal data has been presented. For example, in Chapter 2, Figure 2-1 depicts the different flood extents in Lumberton comparing Hurricane Matthew and Hurricane Florence aerial imagery. Also, in Chapter 2, Figure 2-5 depicts the spatial distribution of difference in damage state assessed for the housing sample after Hurricanes Matthew and Florence. In this chapter, Tables 3-2 and 3-3 present the household-indicated damage after Hurricanes Matthew and Florence; Table 3-8 presents changes in access after Hurricane Florence compared to before Hurricane Matthew; Tables 3-10 through 3-12 present application, receipt, and timing of receipt for a range of recovery resources made available after Hurricanes Matthew and Florence; and lastly, Table 3-14 describes mitigation and preparedness actions taken before Hurricane Florence and at the time of the Wave 3c survey. This section presents one additional metric for tracking longitudinal recovery, namely re-occupancy. Here, re-occupancy is not reported using the survey questions (as is done with dislocation duration in Table 3-6 and Figure 3-3). Rather, this section presents re-occupancy based on the completion codes filled out by the field study team before a survey was initiated. In this case, re-occupancy and abandonment are based on the field study team’s perceptions of occupancy or abandonment where often this was confirmed by the surveyor with an occupant or contact with

58
a neighbor. Three categories are presented in Figure 3-5: perceived or confirmed occupancy, perceived or confirmed abandonment, and not assessed. The latter category varies based on field study team size and time in the field, where Wave 3a had the smallest team and shortest duration. The decision to present these data is to provide information about the full sample of housing units in each wave, as opposed to changing portions of the sample which completed surveys during each wave. As evident from Figure 3-5, the highest proportion of the housing sample was perceived to be occupied during Wave 1, where all 861 housing units were assessed. In Wave 2, 13 of the units were not assessed, 105 units that were perceived as occupied in Wave 1 were recorded as abandoned in Wave 2, whereas 45 of the housing units perceived as abandoned in Wave 1 were recorded as occupied in Wave 2. Approximately six months later and shortly after Hurricane Florence hit, 106 units that were recorded as occupied in Wave 2 were recorded as abandoned in Wave 3a, whereas 32 units that were perceived as abandoned in Wave 2 were recorded as occupied in Wave 3a. Wave 3a had the highest proportion (24 %) of the sample not assessed, which consisted of 174 units recorded as occupied in Wave 2, 37 units recorded as abandoned in Wave 2, and 160 were recorded as occupied six months later in Wave 3c. At the time of Wave 3c, 640 (74 %) of the sample was recorded as occupied, and 25 % were recorded as abandoned. Figure 3-6 provides a Venn Diagram showing which housing units were recorded as abandoned consistently in one or more waves. As shown in Figure 3-6, 12 housing units were recorded as abandoned in Wave 1 only, 26 in Wave 2 only, 52 in Wave 3a only, and 35 in Wave 3c only, whereas 29 housing units were recorded as abandoned in Waves 1, 2, 3a, and 3c. Wave 3a had the single most housing units recorded as abandoned, whereas there were 49 housing units consistently recorded as abandoned in Waves 2, 3a, and 3c. There are many reasons that could explain why housing units were not consistently recorded as abandoned across waves, including variability based on which units were assessed by the team during each wave, team members’ bias, household instability in the housing unit, damage and new abandonment caused by Hurricane Florence, among other reasons. Both Figures 3-5 and 3-6 communicate approximately 12 %, 18 %, 23 %, and 25 % of the housing sample were marked as abandoned and 88 %, 81 %, 52 %, and 74 % of the housing sample were marked as occupied in Waves 1, 2, 3a, and 3c respectively. This finding implies a concerning upward trajectory of abandonment across the longitudinal study nearly doubling from November 2016 to April 2019.

59
Figure 3-5. Sankey diagram depicting perceived or confirmed occupancy and abandonment of
housing sample across Waves 1, 2, 3a, and 3c.
Figure 3-6. Venn diagram with four sets depicting the number of housing units consistently
recorded as abandoned in one or more waves.

60
Chapter 4: Business Interruption and Recovery
4.1 Goals and Objectives The business interruption and recovery component of the Wave 3c data collection was conducted in support of on-going research in the Center and at NIST on business functioning and operation, including modeling efforts on business disruption and recovery, as well as potential links between business and household recovery. The business component of Wave 3c was primarily built upon the survey efforts of the Wave 2 business component of the Lumberton study. The specific goals across the business interruption and recovery efforts in Wave 3c are to:
● Collect data on continued recovery from Hurricane Matthew, thus extending the business component of the Lumberton study to a longitudinal data collection2
● Document how long businesses were interrupted from both Hurricanes Matthew and Florence and/or closed considering different initial damage levels, ownership structures, industry, available recovery resources, and accessibility issues
● Better understand what interdependent infrastructure and services contributed to business closures and their reopening
● Obtain business-level data on a range of factors expected to influence business interruption and recovery, including recovery policy and finance programs
In the remainder of this chapter, we discuss how these goals were addressed in Wave 3c planning, field data collection, and analysis in greater detail.
4.2 Sampling Procedure The original business sample was developed for the Wave 2 data collection. Full details of the original sampling strategy can be found in Sutley et al. (2021). In summary, the original (Wave 2) business sample was drawn from the ReferenceUSA database (InfoGroup, 2016), provided by an InfoGroup company of the same name for subscription by libraries, academic institutions or government agencies to draw the business sample. Businesses were included if they were for-profit organizations, had a physical location (rather than a post office box), and were “verified’ by ReferenceUSA through phone calls to help reduce error in sampling operating establishments prior to Hurricane Matthew. Using ArcGIS, all businesses that fell within the Hurricane Matthew inundation area—or a 100-m buffer around it—were included in the original sample (n = 218). An additional random sample of businesses in the floodplain were identified, reaching a total sample of 350 businesses, proportioned in a similar manner to the original housing sample. Businesses from the initial sample were eligible for inclusion in Wave 3c data collection if their location was sampled for the Wave 2 field study and there was still a physical structure at the address observed during Wave 3a. This includes businesses that completed the full in-person survey in addition to businesses for which operating status was observed (without a completed
2 The first business survey took place during Wave 2 of the Lumberton study. Thus, the business survey that took place during Wave 3C of the study was the first longitudinal follow-up for the business component.

61
survey) during Wave 2. The number of observed and surveyed businesses eligible for inclusion in Wave 3c was 229. No new businesses were added to the sample as a result of Hurricane Florence. The locations within Lumberton boundaries that were affected by Hurricane Florence and not by Hurricane Matthew were primarily residential; researchers analyzed the original business population from which the Wave 2 sample was created and found no businesses in the newly damaged area. Therefore, the original business sample was maintained for Wave 3c. The sector distribution of the sample based on North American Industry Classification System (NAICS) classification is provided in Table 4-1 below, in addition to a comparison of the overall number of businesses in Lumberton based on the 2017 County Business Patterns and Economic Census.

62
Table 4-1. Sector distribution of the sample.
NAICS Code NAICS Description
Total Sample (Observed +
Survey) Survey Only
Sample
Lumberton Population
(all)
% Count % Count % Count
22 Utilities 0 % 1 1 % 1 0 % 3
23 Construction 5 % 12 5 % 6 9 % 143
31-33 Manufacturing 4 % 10 5 % 5 4 % 57
42 Wholesale 2 % 5 2 % 2 4 % 62
44-45 Retail 34 % 77 44 % 49 19 % 286
48-49 Transportation/warehousing 0 % 1 0 % 0 4 % 65
51 Information 2 % 4 2 % 2 1 % 15
52 Finance/insurance 7 % 15 5 % 6 5 % 71
53 Real estate/rental 4 % 9 5 % 5 3 % 46
54 Professional, Scientific, and Technical Services 4 % 8 1 % 1
6 % 96
55 Management 0 % 0 0 % 0 0 % 5
56 Administration 1 % 3 1 % 1 3 % 51
61 Educational services 0 % 1 0 % 0 1 % 8
62 Health care and social assistance 3 % 6 1 % 1 15 % 230
71 Leisure and Hospitality 0 % 1 1 % 1 1 % 15
72 Accommodation and Food Services 19 % 43 14 % 15 10 % 150
81 Other services 13 % 29 14 % 16 14 % 213
225 111 1516
As shown in Table 4-1, retail businesses, accommodation and food service businesses, and other service businesses continue to make up a large portion of the responding sample. However, this sector distribution of those participating in the survey is similar to the larger Lumberton sample as well as the overall business population in Lumberton.

63
4.3 Survey Instrument The Wave 3a survey instrument was developed to mirror the Wave 2 business survey and the Hurricane Matthew data collection as much as possible. The questions on the Wave 3c survey retained the same wording as the previous survey when possible, in order to keep consistency across measurements. As an additional way to evaluate respondent consistency between waves (and saliency across time), some questions were repeated verbatim in Wave 3c from Wave 2 in order to see whether the business responded with the same answer. For example, businesses were asked to re-assess their building, contents, and structural damage as a result of Hurricane Matthew to compare to the damage state reported in the previous wave. If the business answered markedly differently than it had previously, the researcher would then have the option to discard that observation as invalid. However, it is also possible for respondents to give a different answer due to updated information or more complete information on their losses as time progressed. The survey instrument was built around three primary objectives:
1. Understanding where the business was in recovery from Hurricane Matthew prior to the Impact of Hurricane Florence. The first part of the survey asked the business to describe where it was in its recovery from Hurricane Matthew prior to the Impact of Hurricane Florence. The questions in the first section consisted primarily of those longitudinal indicators of recovery. This includes a self-reported measure of recovery, questions on the business’s profitability, and a question on the business’s perceived organizational capacity. This section also included a question on how the business financed their recovery, which resulted from the limited of financial assistance observed in the business community after Wave 2.
2. Understanding how Hurricane Florence affected the business and how the business has recovered. This second part of the survey asked the business to recount their impact from Hurricane Florence and assess their current recovery position and trajectory. This section was almost identical to the Wave 2 business survey (Xiao et al., 2020),3 with the major difference being that the business was asked to respond about Hurricane Florence, rather than Hurricane Matthew. Since Hurricane Florence had more wind effects than did Hurricane Matthew, which was corroborated by business observations during Wave 3a, the decision was made to add damage state information and related questions for wind damage in addition to flood water damage to the business survey. Definitions for the wind-driven damage state was added to the damage state handout given to the business (see Appendix 2B). Questions on business characteristics, for example ownership structure and whether
3 For full survey, see Sutley, E., Dillard, M. and van, J. (2021), Community Resilience-Focused Technical Investigation of the 2016 Lumberton, North Carolina Flood: Community Recovery One Year Later, Special Publication (NIST SP), National Institute of Standards and Technology, Gaithersburg, MD, [online], https://doi.org/10.6028/NIST.SP.1230-2, https://tsapps.nist.gov/publication/get_pdf.cfm?pub_id=930866 (Accessed June 16, 2021)

64
the business rented the building, were kept in the survey in case the business inhabiting the sampled structure had changed within the previous year and a half (since wave 2).
3. Understanding how the business has mitigated, adapted, and prepared as a result of both events. The third major survey section aimed to understand what kinds of mitigation, adaptation, and preparedness actions the business took ahead of and resulting from Hurricane Matthew and Florence. Due to the potential constraints faced by renters in doing any physical modifications of the structure, questions were separated by ownership status of the building. Questions were modified from the 2009 business survey in Galveston, TX after Hurricane Ike from which the original survey was also adapted (Xiao & Peacock, 2014). Businesses were asked whether they floodproofed the building, secured a secondary storage location, performed risk assessments, developed emergency plans, and other anticipatory actions. For each action, the business was asked whether the measure was taken prior to Hurricane Matthew, between Hurricane Matthew and Hurricane Florence, after Hurricane Florence, or not at all. These questions can inform both how repeat events affect adaptive behavior, as well as whether these measures were effective in reducing damage and event-related losses.
4. Understanding Operator Demographic Characteristics and Business Characteristics. Questions on social and demographic characteristics of the respondent were duplicated from the Wave 2 business survey and included categorizing respondents as renters or owners of their business property, race, ethnicity, level of education, and year of experience as a business manager or owner. These types of questions and the associated data document whether our sample matched the distribution of socio-demographics for Lumberton as a whole, and help us determine if the same business representative had been surveyed across Waves 2 and 3.
Researchers expressed the major objectives of each section of questioning when surveying a respondent in the field. The goal was to reduce error in those surveyed engaging in retroactive sensemaking – trying to make sense of their experiences after the fact when engaging in the survey process. Furthermore, there was an effort to make the instrument brief, while maintaining the scope described in the research objectives. Given the necessity of differentiating between the effects of both hurricanes and compounded recovery challenges, the final survey length was four pages, front and back. The final page of the survey asked the respondent to provide their demographic information, general information on the business, and to add any comments the business had in conclusion. The Wave 3c business survey is provided in Appendix 4A. The business surveys were conducted face-to-face by interviewer teams of two. An information sheet about the field study and Center project were handed to potential respondents; a consent script was used to obtain verbal consent prior to surveying (see Appendix 4B for the information sheet and Appendix 3C for the consent script).

65
4.4 Data Collection Methodology
4.4.1. Field Procedures Researchers were split into field teams of two individuals, when possible. Mirroring the process used for the household survey, a Google map of business locations was updated daily and used by the research teams in the field on their mobile devices. During Wave 3c, the Google map was updated live by researchers in the field to help coordinate across teams.
During Wave 2, researchers in the field encountered some issues with business respondent availability; this information was incorporated into the Wave 3c procedures. For example, Wave 2 respondents were unavailable when businesses were too busy with customers, the business hours were limited, and/or the owner/manager was away on travel or not in the office for another reason. To address this issue in Wave 3c, names and email addresses were collected from respondents allowing business managers/owners to take the survey online at their convenience in future waves, and reduce the burden on researchers in the field, though an online option was not provided for Wave 3c.
Similar availability issues occurred during Wave 3c. In some cases, respondents or their co-workers suggested that the researcher return at a different time. Given the limited time and personnel in the field, the researcher prioritized businesses for a revisit depending on their responses in Wave 2. Businesses unaffected by Hurricane Matthew, and businesses that provided limited responses in Wave 2, were assigned the lowest priority. The success rate for revisits varied, but the researchers were able to either collect email addresses or provide information for how the respondent could take the survey online at their leisure. In some cases, a copy of the survey was left behind for respondents to complete and to be picked up by a field team member at a time specified by the respondent. After Wave 3c concluded, the researchers attempted to follow up with respondents that had provided email addresses or phone numbers with limited success. The outcome further emphasized the importance of in-person interviews for such surveys.
In some cases, it was noted during Wave 3c that the business at the sampled locations had changed since Wave 2. This issue may have been related to medium- or long-term impacts of the two Hurricanes but occurred between the two events. In cases where there was a new/different business at a previously surveyed location, researchers attempted to verify when the previous business closed with the owner or manager of the new business in the same location. In a few cases, the owner or manager of the new business was able to provide the updated location of the previously surveyed business from Wave 2. Public records were checked to determine the date that the business moved. Follow-up contact was attempted, but in most cases was unsuccessful, especially if the business had left Lumberton. There were challenges involved in verifying the situation when businesses had closed or moved when there was not a new business occupying the building unit. Where possible, researchers attempted to obtain information from neighboring businesses. Additional closure verification was done after the researchers returned from the field, which is discussed in Section 4.2.
Other forms of attrition included businesses that were fatigued by continued participation in the survey; i.e., the respondent felt that they had contributed during Wave 2, but did not appreciate a need to answer similar questions a second time. Yet, only three businesses refused to respond

66
citing survey fatigue as their reason. Some businesses were hesitant to respond to the survey without permission from their corporate office. However, there were also many businesses that remembered responding to the Wave 2 survey and were enthusiastic to contribute to the longitudinal study by participating in the Wave 3c survey. The survey was only offered in English. There were three occasions when business owners or managers were interested in participating, but they were preempted from doing so due to a language barrier. A major challenge for the Wave 3c survey effort was differentiating between businesses’ experience of the two Hurricanes and appropriately disentangling impacts. This was a challenge for both the researchers in the field and for survey respondents. To reduce confusion, a brief summary sentence was written for each survey section, which the surveyor would read to the respondent. Highlights and font color were used strategically in the survey instrument to help with clarification. The summary text for each section was highlighted for emphasis. Directional text, such as clarification for challenging questions or when the business needed to refer to additional material, was written in red.
4.4.2. Data Entry and Cleaning The method of data entry and data cleaning was similar to that of Wave 2 with some modifications reflecting the lessons learned during previous field work. For data entry the team used Qualtrics, and for data cleaning STATA was used. Cleaning and entry for the business survey and the housing survey were conducted in close conjunction using similar codes for both surveys. Changes from the Wave 2 process to help improve data quality in Wave 3c included making data cleaning decisions in the field and prior to data entry (e.g., taking the higher value of a range when provided), using STATA as the primary data cleaning software, and using STATA’s codebook command to generate the codebook of variables and record the survey metadata. In Wave 2 the data cleaning process for the housing and business data collections differed. In Wave 3c, the team coded data for the business survey in a manner more consistent with the housing survey. There are some survey questions that accept a range, as opposed to a point value, especially when taking notes in the field and accounting for uncertainty expressed by respondents. The field team decided to take the highest value when a range of values was provided by the respondent (and noted by the surveyor). This differed from Wave 2, for which data were cleaned using the midpoint value of the range. In light of this decision, Wave 2 business data were re-cleaned to ensure that there was consistency with Wave 3c data. It should be noted that when running summary statistics on the affected variables, taking the midpoint versus the high point made no noticeable effect. Similar to the procedure employed following Wave 2, researchers verified all field-reported closures and business relocations through online record searches. Online sources included tax registration searches, google imagery, the business’s previous online or social media presence, and third-party business sites such as Yelp. Multiple sources were triangulated and viewed as a whole to make the final decision on the business’ current operating status. Given that the unit of analysis is the physical structure, data was collected from the current business building occupant when a business had moved or gone out of business.

67
4.5 Results In total, 111 businesses responded to the survey. The team also gathered observational information for 225 businesses (including the 111 businesses referenced previously), documenting whether the business was open, closed, or moved. In cases of a business that moved location, this was determined initially via internet information and confirmed by surveyors in-person. The Wave3c of data collection also helped clarify some of the conclusions from Wave 2 and provide updated information on error in the original database. As discussed in Section 4.2, the final sample at Wave 2 included observational data for 229 businesses. Of these businesses, after talking to neighboring businesses during Wave 3c and having another year for online records to update, 11 businesses were identified to be nonprofits, rather than for-profit businesses, and deemed to be ineligible. Others that were not able to participate in Wave 3c included those that had closed since or prior to Hurricane Matthew. One business was interviewed at a location other than its business location, but it was ultimately left in the sample. This left 219 commercial units in the sample. There were six new businesses that began to occupy these structures after Hurricane Matthew that were added, leading to the final 225 sample. Counting all businesses that were in the Wave 3c sample, which includes closed businesses, the survey response rate was 49 %. The operating status for the 225-business sample is provided in Table 4-2, below.
Table 4-2. Operating status of the business sample.
Operating Status Count %
Open 165 73 %
Closed 43 19 %
Moved 17 8 %
Total 225 100 %
Of the businesses visited during Wave 3c, 73 % were open, 19 % were closed, and 8 % had moved to a new location, either within or outside Lumberton city limits. It should be noted that the original sample consisted of an over-sampling of businesses that were more likely to be damaged, specifically those that were located in the projected inundation area from Hurricane Matthew and in the 100-year floodplain. Therefore, this is not an accurate representation of all Lumberton businesses since this table, and all tables in the chapter are not weighted based on their sampling probability. The results in this section are presented aligning the three major sections of the business survey, as outlined in Section 4.3: (1) understanding the business level of recovery from Hurricane Matthew prior to the impacts attributable to Hurricane Florence, (2) understanding how Hurricane Florence affected the business and how the business has recovered, and (3) understanding how the business has mitigated, adapted, and prepared as a result of both events.
4.5.1 Hurricane Matthew Recovery Follow-up The survey asked about businesses’ operating status immediately before Hurricane Florence, as noted in Table 4-3. Only 1 % of respondents reported that they were still operational, but expect to never recover fully and 4 % were still in survival or response mode from the impacts of

68
Hurricane Matthew. Of those still in the recovery stage, 13 % are recovering and an additional 13 % are mostly recovered. Finally, 68 % of respondents reported being fully recovered from Hurricane Matthew immediately before Hurricane Florence.
Table 4-3. Recovery status from Hurricane Matthew immediately before Hurricane Florence. Recovery Status Prior to Hurricane Matthew Count % 1. Still in survival/response mode 4 4 % 2. Recovering 13 13 % 3. Mostly recovered 13 13 % 4. Fully recovered 67 68 % 5. Still operational but will never recover 1 1 % Total 98 100 %
In Wave 3c, we also followed up on how respondents financed their business’ recovery from Hurricane Matthew. These results are reported in Table 4-4 for those who responded to the question. Respondents were able to select one or more source of finance. Personal savings were used most frequently (48 %) to finance at least part of recovery. Corporate assistance was used by 15 % of respondents and 20 % employed insurance in their recovery. Notably, the use of donations (<1 %), assistance from friend or family (3 %), and Federal assistance programs (3 %) were all very low.
Table 4-4. Self-reported financing sources used for recovery from the impacts of Hurricane Matthew (n=49).
Finance Sources used in Recovery from Hurricane Matthew (% of Total Recovery Finance) Count
Mean (%)
Std. Dev. (%)
Min (%)
Max (%)
Personal savings 49 48 % 49 % 0 % 100 % Credit card 49 <1 % 1 % 0 % 10 % Corporate assistance (or assistance from another branch or location) 49 15 % 35 %
0 % 100 %
Insurance 49 20 % 36 % 0 % 100 % Donations 49 <1 % 3 % 0 % 20 % Crowd funding 49 0 % <1 % 0 % 0 % Assistance from friends or family 49 3 % 16 % 0 % 100 % Federal assistance programs 49 3 % 15 % 0 % 100 % State assistance programs 49 0 % 0 % 0 % 0 % Local assistance programs 49 0 % 0 % 0 % 0 % Other 49 10 % 26 % 0 % 100 %
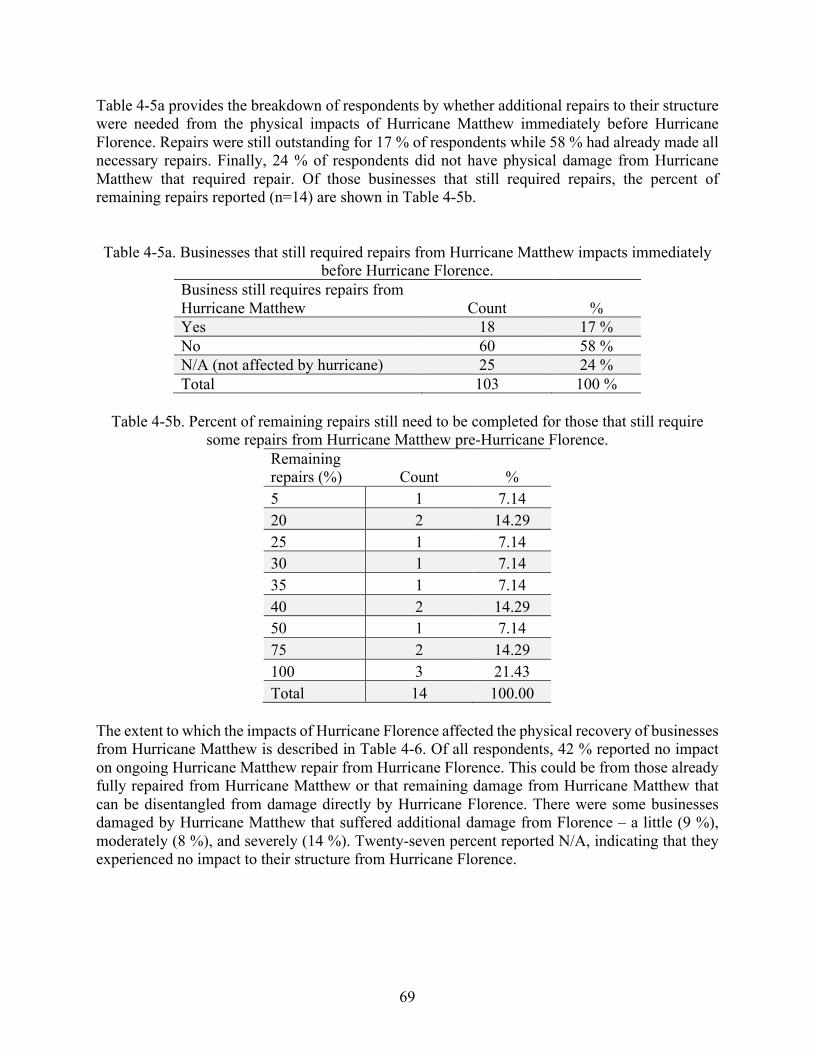
69
Table 4-5a provides the breakdown of respondents by whether additional repairs to their structure were needed from the physical impacts of Hurricane Matthew immediately before Hurricane Florence. Repairs were still outstanding for 17 % of respondents while 58 % had already made all necessary repairs. Finally, 24 % of respondents did not have physical damage from Hurricane Matthew that required repair. Of those businesses that still required repairs, the percent of remaining repairs reported (n=14) are shown in Table 4-5b.
Table 4-5a. Businesses that still required repairs from Hurricane Matthew impacts immediately before Hurricane Florence.
Business still requires repairs from Hurricane Matthew Count % Yes 18 17 % No 60 58 % N/A (not affected by hurricane) 25 24 % Total 103 100 %
Table 4-5b. Percent of remaining repairs still need to be completed for those that still require
some repairs from Hurricane Matthew pre-Hurricane Florence. Remaining repairs (%) Count % 5 1 7.14 20 2 14.29 25 1 7.14 30 1 7.14 35 1 7.14 40 2 14.29 50 1 7.14 75 2 14.29 100 3 21.43 Total 14 100.00
The extent to which the impacts of Hurricane Florence affected the physical recovery of businesses from Hurricane Matthew is described in Table 4-6. Of all respondents, 42 % reported no impact on ongoing Hurricane Matthew repair from Hurricane Florence. This could be from those already fully repaired from Hurricane Matthew or that remaining damage from Hurricane Matthew that can be disentangled from damage directly by Hurricane Florence. There were some businesses damaged by Hurricane Matthew that suffered additional damage from Florence – a little (9 %), moderately (8 %), and severely (14 %). Twenty-seven percent reported N/A, indicating that they experienced no impact to their structure from Hurricane Florence.

70
Table 4-6. Extent to which Hurricane Florence affected ongoing business recovery from Hurricane Matthew.
Extent of the Effect of Hurricane Florence on Hurricane Matthew Recovery Count % Not at all 42 42 % A little 9 9 % Moderately 8 8 % Severely 14 14 % N/A (not affected by the Hurricane) 27 27 % Total 100 100 %
4.5.2 Hurricane Florence Damage and Interruption Businesses in the sample varied in their impact from Hurricane Florence. Table 4-7 displays the different types of damage the businesses experienced to their building (due to both flood and wind), their contents, and their machinery.
Table 4-7. Damage states reported by the businesses resulting from Hurricane Florence. Damage
from Hurricane Florence Building (flood) Building (wind) Contents Machinery
Count % Count % Count % Count %
None 87 79 % 74 70 % 74 69 % 88 84 %
Minor 14 13 % 18 17 % 15 14 % 8 8 %
Moderate 4 4 % 12 11 % 11 10 % 2 2 %
Severe 5 5 % 5 5 % 4 4 % 5 5 %
Complete 0 0 % 0 0 % 3 3 % 2 2 %
Total 110 100 % 109 100 % 107 100 % 105 100 %
The majority of businesses reported no or minor damage from Hurricane Florence. Yet, some businesses did report some flood damage attributable to Hurricane Florence: 21 % experienced some level of damage to their flood damage to the building, 30 % experienced wind damage to the building structure, 31 % experienced damage to the business’ contents, and 16 % reported machinery damage. It should be noted machinery damage is not a category of potential damage that is relevant across business types depending on their sector and/or set-up of their physical work location.

71
In all categories, “minor” was the most frequently reported damage level among businesses that experienced any damage. Eleven percent of businesses surveyed experienced moderate wind damage and 10 % experienced moderate damage to contents, but very few experienced severe or complete damage in any category. Businesses can experience losses as a result of utility disruption in addition to physical damages. The percentage of businesses that lost critical utilities from Hurricane Florence and the average duration of that loss is presented in Table 4-8. Eighty percent of businesses reported losing electricity after Hurricane Florence, which was the most frequently reported utility loss. Internet/IT was the second most common utility loss (45 % reporting losing service) followed by landline (39 %). Internet/IT, landline, and electricity are all closely related, which could explain why they consist of the three most common losses. These three services were also disrupted for the longest time. Electricity was out for businesses for an average of 5 days, internet/IT was out for an average of 4 days, and landline phone service was out for an average of 3 days. Water was both the fourth most reported utility disruption and the fourth longest duration of loss with 27 % of businesses reporting losing water for an average of 3 days. Sewer, cell, and natural gas service disruptions were experienced by fewer than 15 % of businesses and for relatively short durations.
Table 4-8. Percent of businesses reporting utility loss and the number of days of disruption resulting from Hurricane Florence.
Utility Disruption % lost Avg. days lost Std. Dev.
Electric 80 % 5 5
Water 27 % 3 6
Natural Gas 6 % 2 13
Sewer 14 % 2 7
Landline 39 % 3 7
Cell 14 % 1 23
Internet/IT 45 % 4 7
The Wave 3c survey asked about physical accessibility issues (e.g., closure of roads or sidewalks) after Hurricane Florence. Of the 108 respondents to this question, 65 % experienced such accessibility issues, which could limit their ability to access the site to assess damage and start repairs and also could limit customers from coming to the business, impacting revenue and recovery. Similarly, respondents were asked if any of their employees had issues coming to work (at that location) with more than one option that could be selected for this question. Response frequencies for this question are presented in Table 4-9. Employees were most frequently unable to report to work due to transportation issues after Hurricane Florence (63 %), personal home damage (40 %), and issues related to children not able to return to school (29 %). Physical and

72
mental health issues were rarely cited as reasons for not reporting to work, though these factors may be less likely to be reported to the owner or manager of the business.
Table 4-9. Self-reported issues for employees trying to get to the business following Hurricane
Florence. Employee Issues Count Yes (%) No (%)
Transportation problems 104 63 % 37 %
Need to repair their home 101 40 % 60 %
Children were not back in school 100 29 % 71 %
Physical health issues 101 0 % 100 %
Mental health issues 100 2 % 98 % Respondents were asked to indicate whether they had lost customers following Hurricane Florence without specifying a timeframe in this question. Of those who responded to this question (n=103), 50 % experienced loss of customers to some extent relative to pre-Hurricane Florence. Those who lost customers were asked to estimate the percent of customers lost and the mean value reported was 12 % (S.D. 19 %). Both damage and utility disruption can lead to business interruption and reduced business capacity. In the survey, interruption is defined as the number of days the business was closed to the public. Capacity is defined as aspects of the business that are most important to—and defined by—the respondent, for example the quality and/or quantity of service or product offerings. Figures 4-1 and 4-2 show days of interruption for the responding businesses and the capacity of the business after Florence. As shown in Figure 4-1, the average period of business interruption from Hurricane Florence was 10 days (S.D. 15).

73
Figure 4-1. Number of days until businesses to resumed operations after Hurricane Florence (in
seven-day increments).
Figure 4-2. Return of business capacity after Hurricane Florence (in 10 % increments), reported
at the time of Wave 3c data collection. As shown in Figure 4-2, the majority of businesses were interrupted within the first week post-Hurricane Florence, with the number of businesses interrupted declining in subsequent weeks. A large majority of businesses appear to have been interrupted for less than one month and the longest reported interruption is approximately three months or 90 days. With respect to capacity, the largest number of businesses reported being at 100 % capacity. Most of the sample falls within the
0
10
20
30
40
50
60
70
0 1 - 7 8 - 14 15 - 21 22 - 28 29 - 35 36 - 42 43 - 49 50+
Num
ber o
f Bus
ines
ses
Number of Days Needed for Businesses to Resume Operations
0
10
20
30
40
50
60
70
0 - 1
0
11 -
20
21 -
30
31 -
40
41 -
50
51 -
60
61 -
70
71 -
80
81 -
90
91 -
100
100
- 110
111
- 120
121
- 130
131
- 140
141
- 150
151
- 160
161
- 170
171
- 180
Num
ber o
f Bus
ines
ses
Current Operational Capacity (%)

74
range of 50 % to 100 % capacity, but a small number of businesses reported being over 100 percent capacity4, and some reported being at below 50 % capacity. To better understand businesses’ decision making, we asked about the influence of decisions made by businesses on the same street block regarding the decision the respondent made for their business to remain open or to close (temporarily). Responses to this question are provided in Table 4-10. Only 4 % indicate that decisions of other businesses are neither important nor unimportant.5 The majority of respondents (57 %) indicate that they assign no importance at all of the decisions of surrounding businesses, while 38 % note that the decisions of surrounding business are somewhat or very important to their own decision to open or close their business. Table 4-10. Importance of decisions of surrounding businesses (those on the same block) to the
decision for the business to remain open or to close. Importance of decisions of surrounding businesses Count % Not important at all 59 57 % Somewhat unimportant 11 11 % Neither important nor unimportant 4 4 % Somewhat important 17 17 % Very important 12 12 % Total 103 100 %
4.5.3 Hurricane Florence Recovery With respect to recovery, the survey asked businesses about changes to their profitability as a result of Hurricane Florence in addition to their self-reported recovery status. Table 4-11 displays the reported changes in profitability and Table 4-12 shows self-reported recovery statuses.
Table 4-11. Business profitability change as a result of Hurricane Florence.
Revenue Change after Hurricane Florence Count % Greatly increased 2 2% Increased 6 6% No change 76 78% Decreased 10 10% Greatly decreased 4 4% Total 98 100%
4 There is not a clear explanation as to why this may be the case, as these businesses do not group into a particular sector or ownership structure. 5 It is very possible that the traditionally neutral category in this Likert scale (neither important nor unimportant) might be more conceptually similar to “somewhat unimportant” or “not important at all.” Further analysis will need to examine this coding more closely.

75
Table 4-12. Business self-reported recovery status after Hurricane Florence.
Recovery Status after Hurricane Florence Count % Still in survival/response mode 5 5% Recovering 18 17% Mostly recovered 22 21% Fully recovered 58 56% Still in operation but will never recover 0 0% Total 103 100%
Looking at Table 4-11, a majority of businesses (78 %) reported no change in revenue as a result of Hurricane Florence. Decreased revenue was the second-highest reported category (10 % of the responding sample). In other categories, 6 % of businesses reported an increase in revenue, 4 % reported greatly decreased revenue, while 2 % had a greatly increased revenue. When asked to report their own perception of their recovery, over half of businesses (58 %) reported being fully recovered at the time of wave 3c relative to their state ahead of Hurricane Florence. As shown in Table 4-12, very few businesses reported that they would never recover or were still in survival/response mode (5 %), with the remaining businesses reporting being mostly recovered (22 %) or recovering (18 %). Again, as discussed in Section 4.5, these statistics reflect the raw responses that have not been weighted with respect to their probability of being damaged. Oversampling businesses in the inundation area might cause a higher percentage of businesses that are still recovering or are not as far along in their recovery process. Respondents were asked whether the location of their suppliers has changed post-Hurricane Florence compared to the period between Hurricane Matthew and Hurricane Florence. Specifically, the question asked for agreement with the statement “we have more suppliers outside our city than we did prior to Hurricane Florence (Between Hurricane Matthew and Hurricane Florence).” Of those who responded (n=101), 20 % disagree or strongly disagree with the statement, 71 % find it to be a neutral statement, and only 9 % agree or strongly agree indicating that for most businesses the number of outside suppliers has gone down. Insurance is a means by which businesses plan ahead of an event to help hedge the risk of impacts. We asked about insurance coverage before Hurricane Florence and outcomes of insurance claims post-Hurricane Florence. The percent of insurance holders is shown in Table 4-13. The greatest frequency of insurance type reported is for building insurance (71 %) and content insurance (29 %). Additionally, some respondents held interruption insurance (37 %) and a significant portion had liability insurance (66 %). We further asked if the business had made an insurance claim, presenting the results in Table 4-13. Of those who responded, 38 % filed an insurance claim for building damage, 52 % of whom received a payout on average 90 days after filing (S.D. 57 days). Thirty percent of respondents made a claim on content insurance, 50 % of whom received the payout within an average of 66 days months (S.D. 33 days). Claims against interruption and liability insurance were less frequently reported, with 11 % and 7 % reporting making such a claim, respectively.
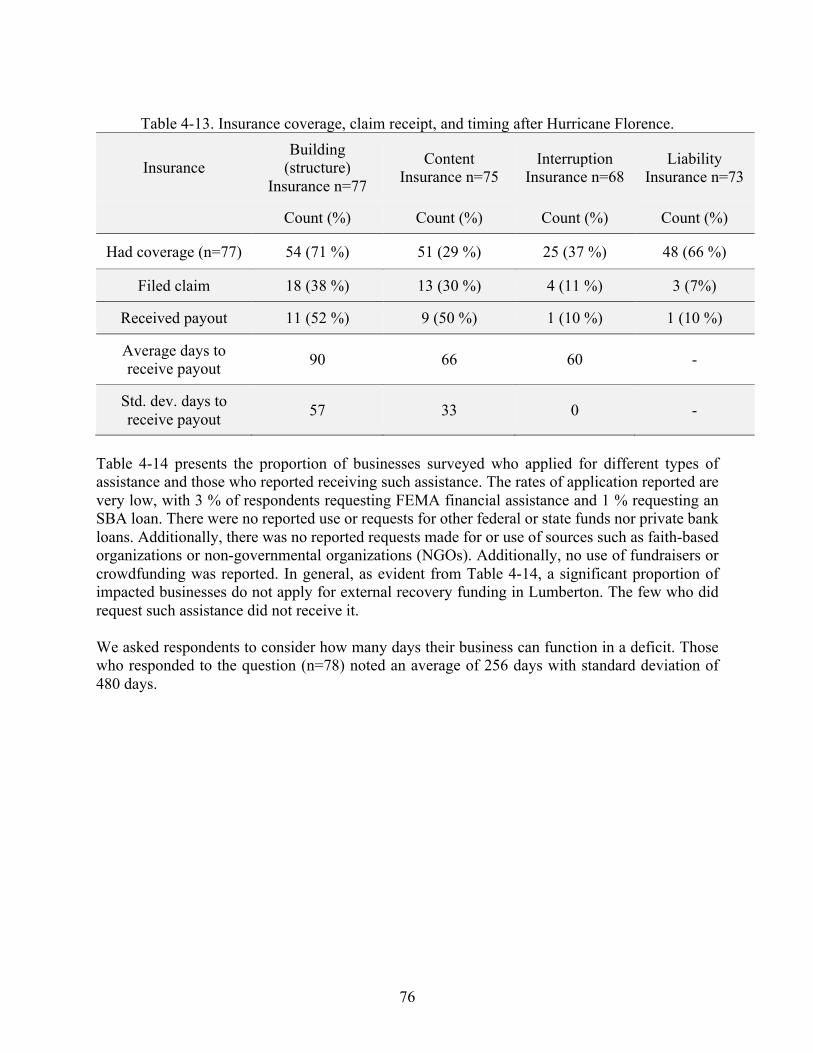
76
Table 4-13. Insurance coverage, claim receipt, and timing after Hurricane Florence.
Insurance Building
(structure) Insurance n=77
Content Insurance n=75
Interruption Insurance n=68
Liability Insurance n=73
Count (%) Count (%) Count (%) Count (%)
Had coverage (n=77) 54 (71 %) 51 (29 %) 25 (37 %) 48 (66 %)
Filed claim 18 (38 %) 13 (30 %) 4 (11 %) 3 (7%)
Received payout 11 (52 %) 9 (50 %) 1 (10 %) 1 (10 %)
Average days to receive payout 90 66 60 -
Std. dev. days to receive payout 57 33 0 -
Table 4-14 presents the proportion of businesses surveyed who applied for different types of assistance and those who reported receiving such assistance. The rates of application reported are very low, with 3 % of respondents requesting FEMA financial assistance and 1 % requesting an SBA loan. There were no reported use or requests for other federal or state funds nor private bank loans. Additionally, there was no reported requests made for or use of sources such as faith-based organizations or non-governmental organizations (NGOs). Additionally, no use of fundraisers or crowdfunding was reported. In general, as evident from Table 4-14, a significant proportion of impacted businesses do not apply for external recovery funding in Lumberton. The few who did request such assistance did not receive it. We asked respondents to consider how many days their business can function in a deficit. Those who responded to the question (n=78) noted an average of 256 days with standard deviation of 480 days.

77
Table 4-14. Assistance requested and received by businesses. Yes No
Assistance Total Count (%) Count (%)
FEMA financial assistance 67 2 (3 %) 65 (97 %)
SBA (Small Business Administration) loan
67 1 (1 %) 66 (99 %)
Other federal or state funds 65 0 (0 %) 65 (100 %)
Local government funds 65 0 (0 %) 65 (100 %)
Financial assistance from any church or other non-government organizations
65 0 (0 %) 65 (100 %)
Clean up or repair help from church or other non-government organizations
65 0 (0 %) 65 (100 %)
Loan from a Bridge Loan program
65 0 (0 %) 65 (100 %)
Private bank loans 65 0 (0 %) 65 (100 %)
Crowdfunding 65 0 (0 %) 65 (100 %)
Fundraisers 65 0 (0 %) 65 (100 %)
Other 63 1 (2 %) 62 (98 %)
4.5.4 Business Information and Respondent Details Table 4-15 provides the federal classification of surveyed businesses. The majority (79 %) have no official federal classification. Of those with such classifications, 4 % are women-owned, 6 % are minority certified by the SBA (8a), and 3 % are veteran-owned.

78
Table 4-15. Businesses’ self-reported federal classifications.
Federal Classification Count %
Woman-owned 4 4 %
Minority certified by the SBA (8a) 6 6 %
Veteran-owned 3 3 %
None 82 79 %
Do not know 5 5 %
Did not ask 4 4 %
Total 104 100 % Data on the business and its location were obtained in the survey. For those who responded (n=101) the average length of time at the location was 20 years (S.D. 16 yr.). The ownership of the business location/structure directly influences the type of preparedness and adaptation actions available to the business. Of those responding (n=108), there was an even split between those who own their location (49 %) and those who rent their business location (49 %), with 2 % reporting “other.” Ownership structure of a business has been shown to influence preparedness levels (Barman et al, 2012), but this finding is inconsistent across the literature (e.g., Webb et al., 2000). Respondents (n=108) indicated their ownership structure ahead of Hurricane Florence shown in Table 4-16. The majority identify their business as part of a corporation or franchise (46 %), single owner (40 %), partnership (12 %), and other (2 %).
Table 4-16. Businesses’ self-reported ownership structure ahead of Hurricane Florence.
Ownership Structure Count %
Single owner 43 40 %
Partnership 13 12 %
Corporation or franchise 50 46 %
Other 2 2 %
Total 108 100 % The Wave 3c survey captured respondents’ role with the business for which they responded. Of the 112 business responses to this question, 22 % are business owners, 61 % are managers, 16 % have the dual role of owner and manager, and one respondent held another role (i.e., senior employee). For those who responded (n=107), the average length a respondent had been a business owner or manager for any business was reported as 18 years (S.D. 14 yr.).

79
The Wave 3c survey repeated additional questions related to respondents’ demographic information. We obtained data from 103 respondents on their age with the average reported age at 49 years (S.D. 14 yr.). The average number of years of schooling reported was 14 (S.D. 2 yr.) (n=105). Only 6 % of respondents (total n=106) identify as Hispanic. Self-reported race and ethnicity of respondents is reported in Table 4-17. The majority of respondents identify as white, while 15 % identify as Black or African American, and 14 % identify as American Indian or Alaska Native.
Table 4-17. Race and ethnicity of surveyed business owners/managers. Race of Owner or Manager Count %
White 65 62 %
Black or African American 16 15 %
American Indian or Native American 15 14 %
Asian 1 1 %
Native Hawaiian or Pacific Islander 1 1 %
More than one race 5 5 %
Other 1 1 %
Hispanic or Latino 6 6 %
Total 106 100 %
4.5.5 Longitudinal Trends Mitigation and preparedness actions can help businesses escape severe disaster impact and improve recovery outcomes. Business respondents were asked a series of questions concerning their mitigation and preparedness actions based on whether they owned the premises of the business and whether the actions were taken before Hurricane Matthew, between Hurricane Matthew and Hurricane Florence, or after Hurricane Florence. Table 4-18 shows results for businesses that owned their premises and could make changes to the structure itself.

80
Table 4-18. Mitigation, adaptation, and preparedness measures for respondents that own the business premises/storefront.
Floodproofing of building
(professional)
Floodproofing of building (non- professional)
Secured Secondary
Storage Location
Had the Building
Structurally Assessed
Count % Count % Count % Count %
Adopted before Hurricane Matthew
1 1 % 9 10 % 9 10 % 9 11 %
Adopted between Hurricane Matthew and Hurricane Florence
2 2 % 12 14 % 12 14 % 5 6 %
Adopted after Hurricane Florence 2 2 % 1 1 % 0 0 3 4 %
Adopted (any) 5 6 % 22 25 % 21 24 % 17 20 %
No adoption 81 94 % 65 75 % 67 76 % 66 80 %
Total 86 100 % 87 100 % 88 100 % 83 100 %
HM= Hurricane Matthew, HF= Hurricane Florence As shown in Table 4-18, most respondents did not take any of the mitigation actions listed that are relevant to those who own their business location. These options included: floodproofing the building themselves or through a professional, securing a secondary storage location, or having the building structurally assessed. Professional floodproofing was the most reported action that businesses took, followed closely by securing a secondary storage location. Approximately a quarter of businesses responding to each question had taken those actions at some point prior to the Wave 3 survey. Looking at the timing of these actions, it appears many businesses that mitigated did so either before Hurricane Matthew or between Hurricane Matthew and Hurricane Florence. Table 4-19 presents mitigation and preparedness actions that businesses may have taken, regardless of whether they owned the building in which they conduct business. These options include: performing a risk assessment, adopting strategies to stay informed of weather warnings, developing an emergency plan or checklist, assigning disaster responsibilities to certain employees, and performing emergency drills. Forty-eight percent of businesses reported adopting strategies to stay informed of weather warnings and 47 % have an emergency plan. Assigning disaster responsibilities to certain employees was also a commonly adopted measure with 34 % of businesses responding that they had taken this action in any time period. Adoption was lowest for risk assessments and emergency drills, with 17 % of businesses reporting having taken these
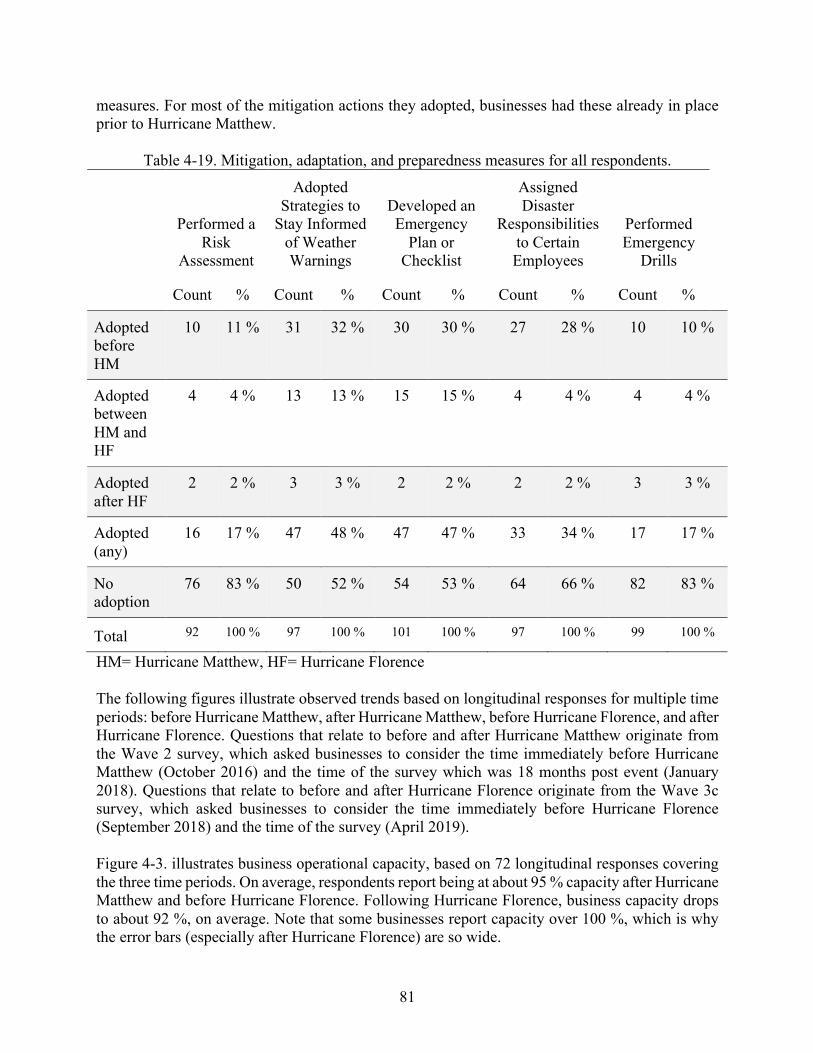
81
measures. For most of the mitigation actions they adopted, businesses had these already in place prior to Hurricane Matthew.
Table 4-19. Mitigation, adaptation, and preparedness measures for all respondents.
Performed a Risk
Assessment
Adopted Strategies to
Stay Informed of Weather Warnings
Developed an Emergency
Plan or Checklist
Assigned Disaster
Responsibilities to Certain Employees
Performed Emergency
Drills
Count % Count % Count % Count % Count %
Adopted before HM
10 11 % 31 32 % 30 30 % 27 28 % 10 10 %
Adopted between HM and HF
4 4 % 13 13 % 15 15 % 4 4 % 4 4 %
Adopted after HF
2 2 % 3 3 % 2 2 % 2 2 % 3 3 %
Adopted (any)
16 17 % 47 48 % 47 47 % 33 34 % 17 17 %
No adoption
76 83 % 50 52 % 54 53 % 64 66 % 82 83 %
Total 92 100 % 97 100 % 101 100 % 97 100 % 99 100 %
HM= Hurricane Matthew, HF= Hurricane Florence The following figures illustrate observed trends based on longitudinal responses for multiple time periods: before Hurricane Matthew, after Hurricane Matthew, before Hurricane Florence, and after Hurricane Florence. Questions that relate to before and after Hurricane Matthew originate from the Wave 2 survey, which asked businesses to consider the time immediately before Hurricane Matthew (October 2016) and the time of the survey which was 18 months post event (January 2018). Questions that relate to before and after Hurricane Florence originate from the Wave 3c survey, which asked businesses to consider the time immediately before Hurricane Florence (September 2018) and the time of the survey (April 2019). Figure 4-3. illustrates business operational capacity, based on 72 longitudinal responses covering the three time periods. On average, respondents report being at about 95 % capacity after Hurricane Matthew and before Hurricane Florence. Following Hurricane Florence, business capacity drops to about 92 %, on average. Note that some businesses report capacity over 100 %, which is why the error bars (especially after Hurricane Florence) are so wide.

82
Figure 4-3. Business operational capacity: after Matthew, before Florence, and after Florence.
Figure 4-4 demonstrates the change in number of employees, based on 60 longitudinal responses covering the three time periods. The impact of Hurricane Matthew on employment on average is a less than 1 % decrease, with 25 % of respondents reporting at least 5 % decrease. Prior to Hurricane Florence, many more respondents reported positive change in employment relative to the post-Matthew time period. On average, respondents reported roughly 15 % increase in employment, with over a quarter of respondents reporting 30 % increase or more.

83
Figure 4-4. Average number of employees reported: before Matthew, between Matthew and
Florence, and after Florence. Figure 4-5 illustrates respondents’ self-reported recovery status, based on 90 longitudinal responses covering the three time periods. After Hurricane Matthew, most respondents reported being mostly recovered, with responses ranging between recovering and fully recovered. Immediately before Hurricane Florence, most respondents reported being somewhere between mostly recovered and fully recovered. After Florence, this drops back down to mostly recovered.

84
Figure 4-5. Recovery status after Matthew, between Matthew and Florence, and after Florence.
Figure 4-6. demonstrates self-reported business profitability, based on 97 longitudinal responses covering the three time periods. After Matthew, most businesses reported being somewhere between profitable and highly profitable. Immediately before Florence, this falls to somewhere between breaking even and profitable, suggesting other trends and business concerns impact business profitability. After Florence, responses are largely unchanged.

85
Figure 4-6. Business profitability: before Matthew, between Matthew and Florence, and after
Florence.

86
Chapter 5: Conclusions and Next Steps
5.1 Conclusions for Damage Measurement following Successive Flood Events The community of Lumberton experienced two extreme hurricane-induced floods over a span of only two years (2016-2018). Based on USGS stream gage data, the intensity of flooding imposed on Lumberton by Hurricanes Matthew and Florence were similar, with only slightly more flow and a higher gage elevation occurring during Hurricane Florence. Post-event aerial imagery showed that flooding extents were also reasonably comparable between the two events, although mitigation efforts by the City of Lumberton post-Hurricane Matthew likely played a role in changing the flood dynamics, including how long the flood waters stayed in the area during and after Hurricane Florence. Door-to-door damage assessments recorded widespread damage and disruption throughout the community for both events. However, flood depths measured over a large proportion of the community, as well as reported morbidities and mortalities, were much lower for Hurricane Florence. The Wave 3a damage surveys revealed approximately two-thirds of the sampled housing units that sustained any damage suffered more damage after Hurricane Matthew than Hurricane Florence. In total, approximately 18 % of sampled housing units and 15 % of sampled businesses sustained some damage from Hurricane Florence. The reduction in flood extents and damage is likely due to city-wide and individual-level mitigation actions taken ahead of Hurricane Florence, including temporary berms placed strategically at the levee, surrounding the Lumberton Water Plant and an electrical power network substation, and the deployment of hydraulic pumps at strategic points around the City. Some households and businesses elevated interior contents and evacuated in immediate preparation, and had also elevated exterior air conditioning condenser units and relocated ductwork from crawlspaces to attics. The measurable reduction in the impacts from flooding demonstrates the potential benefits of community-level preparation and individual-level flood mitigation efforts as a result of the lessons learned from a recent flood. While it is clear that less damage was sustained during Hurricane Florence than during Hurricane Matthew in Lumberton, further investigation and analyses is needed to resolve sources of uncertainty in damage measurements across events, including uncertainty due to sparse and therefore neglected wind damage, faint or absent high-water marks, as well as evidence of multiple high-water marks from both Hurricane Matthew and Hurricane Florence flood events. In limited cases it remains unclear if damage attributable to Hurricane Florence was sustained or incurred in part due to incomplete repair of damages from Hurricane Matthew. The Wave 3a damage investigation provided an opportunity to utilize new measurement science approaches. In particular, the field study team employed methods to help discern between damage from each of the two hurricane events. These tools may become important for future field study teams in the wake of climate change, causing compounding and concurrent impacts from multiple events, for instance when a second extreme event occurs before a community fully recovers from a first extreme event. In the case of Wave 3a damage investigation, the team needed situational flagging of compounded damage. Future research is needed to (1) develop the measurement science to capture unrepaired damage compounded by a second extreme event; (2) enable better determination of new versus old damage, including damage caused by deferred maintenance; (3) investigate how the duration of flood inundation leads to differential damage; (4) identify and

87
communicate easily-adoptable mitigation strategies that have major payoffs, such as elevating air handling units; and (5) shed light on inherent modeling consequences stemming from the adopted measurement approach.
5.2 Conclusions for Housing Disruption and Recovery The Wave 3c housing survey provided a detailed picture of household experiences immediately after Hurricane Florence, the actions taken in preparation for Hurricane Florence, and the status of recovery since Hurricanes Matthew and Florence. Counting abandoned units as survey completions provides a 71 % response rate; not counting abandoned units and only considering new and continuous residents who responded to the survey questions, the response rate was 34 %, which is considered satisfactory when compared to other social science field survey data collections. What is concerning about Lumberton is the proportion of the sampled units (25 %) that were abandoned in Wave 3c, signaling very slow recovery from Hurricane Matthew further exacerbated by Hurricane Florence. Immediately prior to Hurricane Florence, approximately one-third of households reported unrepaired damage from Hurricane Matthew. After Hurricane Florence nearly 85 % of the housing sample reported lost power, smaller but still significant portions reported lost water (45 %), internet (45 %), sewer (33 %), landline phone service (34 %), and cell phone access (13 %). Approximately two-thirds of the sample were dislocated from their home for at least one night after Hurricane Florence, with dislocation times being longer, on average for residents of single-family dwellings and for homeowners, as opposed to multi-family dwellings and renters. Of the households that were dislocated, and the team was able to survey, a majority returned within two weeks. Overall, shelters were not open as long after Hurricane Florence as after Hurricane Matthew. For the 132 households who had completed repairs at the time of the survey, it took them an average of two months to complete repairs after Hurricane Florence while 38 % of respondents still had unrepaired damages. Work, school, access, and household stability were also all disrupted in Lumberton after Hurricane Florence. Small proportions of respondents received insurance payouts and other recovery resources, with FEMA IHP funds received by the largest proportion of households compared to all other resources inquired about. The distribution of recovery funding was, on average, faster after Hurricane Florence than Hurricane Matthew. Nevertheless, two-thirds of respondents reported unmet needs which can be due to the slow arrival of relief funds from Hurricane Matthew. Although recovery was still underway at the time of the survey, 85 % of respondents reported intentions of remaining in their home for the next year, and more than 80 % indicated having the same access to school and grocery stores after Hurricane Florence compared to before Hurricane Matthew. The Wave 3c housing survey asked about the impacts of the two events on community cohesion as well. Respondents were asked about changes in their involvement with their community compared to before Hurricane Matthew. Approximately one-third of homeowners and renters indicated increased community involvement and approximately 40 % indicated increased contact with neighbors and extended family. Both of these factors are positive indications of social capital, and thereby community resilience. Many households made a disaster plan with their household members before Hurricane Florence. After Hurricane Florence, 40 % more households elevated their hot water heater and/or HVAC, 20 % more households elevated interior contents like

88
furniture and valuables to protect them from flood waters, 32 % had their home assessed by a structural engineer, and 60 % re-routed ductwork from below the home’s floor and into the attic space, as compared to before Hurricane Florence. Longitudinal comparisons about housing and household recovery are provided throughout Chapter 3. Re-occupancy and consistent abandonment are also reported for the entire 861 housing units in the weighted sample. In Waves 1, 2, 3a, and 3c, respectively 12 %, 18 %, 23 %, and 25 % of the sample housing units were recorded as abandoned, whereas 88 %, 81 %, 52 %, and 74 % were reported as occupied, respectively. These findings indicate a gradual increased number of abandoned homes in Lumberton since Hurricane Matthew as a result of failure to restore those units.
5.3 Conclusions for Business Interruption and Recovery
The Wave 3c business survey collected data on the impacts of Hurricane Matthew and Hurricane Florence, mitigation and other planning activities undertaken across the survey period, and resulting interruption and longitudinal recovery from both Hurricanes Matthew and Florence. Including all businesses that were part of the Wave 3c sample, which includes closed businesses, the survey response rate was 49 %. This response rate is relatively high when compared to other social science field survey collections and similar to the response rate for the Wave 2 Business survey (52 %).
Before Hurricane Florence, about 5 % of businesses surveyed reported expecting to never fully recover or to be in continued survival or response mode due to Hurricane Matthew. An additional 68 % of respondents reported being fully recovered from Hurricane Matthew immediately before Hurricane Florence. Finally, before Hurricane Florence, repairs were still outstanding for 17 % of the sample.
Seventy-three percent of businesses observed in Wave 3a were open, 19 % were closed, and 17 % had moved to a new location, either within or outside Lumberton city limits since Hurricane Matthew. Due to oversampling in the inundation zone to better understand the differences in the number of businesses still recovering from Hurricane Matthew and affected by Florence, future models can statistically control for covariates. The majority of business reported temporary utility loss: electricity (80 %), water (27 %), internet (45 %), sewer (14 %), landline phone service (39 %), and cell phone access (14 %). However, in all cases, a majority of sampled businesses reported no or minor damage from Hurricane Florence. Some businesses experienced damage to their business location; these categories and the associated sample percentages are as follows: flood damage to the building (21 %), wind damage to the building (30 %), contents damage (31 %), and machinery damage (16 %).
The Wave 3c business survey also sought to measure business recovery using a variety of indicators, following from the Wave 2 recovery measures. Most businesses (78 %) reported no change in revenue as a result of Hurricane Florence. Decreased revenue was the second-highest reported category (10 % of the responding sample). Most businesses reported operational interruptions for some period during the first week post-Hurricane Florence, with the number of businesses interrupted declining in subsequent weeks.

89
A relatively small of businesses adopted mitigation, preparedness, or adaptation measures before Hurricane Florence. For those who own their business building structure, these include professional floodproofing of building (2 %), floodproofing of building by a non-professional (14 %), secured a secondary storage location (14 %), and had the building structurally accessed (6 %). For those who either own or rent their business premises these options include performing a risk assessment (4 %), strategies to stay informed of weather warnings (13 %), development of an emergency plan or checklist (4 %) and performing emergency drills (4 %). Some businesses indicated taking one or more of these steps.
A major challenge for the Wave 3c survey effort was differentiating between the experience of the two Hurricanes, especially disentangling impacts. This was a challenge for both the researchers in the field and for survey respondents.
5.4 Next Steps for the Lumberton Longitudinal Field Study Wave 3 data collection occurred in three phases with associated field deployments. Wave 3a was focused on initial reconnaissance post Hurricane Florence, Wave 3b focused on a qualitative study of public housing, and Wave 3c focused on follow-up longitudinal survey efforts for households and businesses. The data collection in Wave 3 presented unique challenges to the original objectives of the longitudinal field study. Recovery following Hurricane Matthew was disrupted for the Lumberton community by a second extreme flood event associated with Hurricane Florence just two years later. Systematically and decisively tracking recovery from Hurricane Matthew and understanding and controlling for the damage and disruption from Hurricane Florence became the focus of the Wave 3 data collection. A second major objective of the longitudinal field study is to advance the area of field study metrology with a focus on community resilience. The successive events in Wave 3 expanded the team’s ability to advance metrology in a way that can become widely applicable in the wake of climate change. The Lumberton longitudinal field study is planned to continue. As the dataset is built over time, it is anticipated that the field study will make major contributions to community resilience and recovery modelling efforts that are generalizable to other communities. In order to accomplish these long-term objectives, set out by the research team, the following steps are recommended:
1. Both the housing and business survey collections continue in-person, as feasible due to health and safety, every 12-16 months with improvements and appropriate temporally-based changes made, as needed. The surveys should not, however, be lengthened, in an effort to maintain response rates and minimize burden and survey fatigue on respondents. Key questions or sections should be replicated throughout surveys to ensure comparability across timeframes.
2. Interviews with key community stakeholders should continue every 12-18 months to provide context for the findings of the field observations and structured data collections through surveys.
3. Temporal analyses should be conducted comparing results across time, advancing the cross-wave comparisons made in Chapters 2, 3, and 4 of this report.
4. Ongoing analysis should be conducted to ensure that the field study continues to align with what is needed for NIST measurement and modeling, and improvements to standardized field study protocols. This includes the use of data in: (1) development of the Alternatives

90
for Resilient Communities (ARC) model, a web-based tool to assist in community resilience planning, (2) a case study linking ARC and the NIST Economic Decision Guide Software (EDGe$) Tool Online, (3) for recovery measurement to inform the Tracking Community Resilience (TraCR) Methodology, and (4) accounting for disaster losses with a focus on major indirect losses, such as business interruption, and distributional effects.
5. A testbed of Lumberton should be developed and incorporated into IN-CORE for more detailed numerical analysis that incorporates the state-of-the-art resilience science and modeling from Center and NIST researchers with the novel data collection through the Lumberton longitudinal field study.
6. Housing and business survey instruments, IRB protocols and supplemental documents, and the collected data should continue to be published and receive Digital Object Identifier (DOI). The on-going collection can be found on DesignSafe-CI: https://www.designsafe-ci.org/data/browser/public/designsafe.storage.published/PRJ-2656
91
References American Community Survey. (2020). “2019: ACS 5-Year Estimates Data Profiles”. United
States Census Bureau. Armstrong, T., Hurricane Matthew in the Carolinas: October 8, 2016. National Weather Service,
7 September 2017, Wilmington, NC, 15 November 2018. Deniz, D., Sutley, E.J., van de Lindt, J.W., Peacock, W.G., Gu, D., Rosenheim, N., Mitrani-
Reiser, J., Dillard, M., Hamideh, S., and Koliou, M. (2019). “Flood Performance and Dislocation Assessment for Lumberton Homes after Hurricane Matthew.” 13th International Conference on Applications of Statistics and Probability in Civil Engineering, Seoul, South Korea, May 26-30, 2019.
Helgeson, J., P. Lavappa, and D. Webb. (2020), EDGe$ (Economic Decision Guide Software) Online Tool, Version 1.0, National Institute of Standards and Technology, https://doi.org/10.18434/M32185 (June 20, 2021).
InfoGroup (2016). List of Businesses in Lumberton, NC. ReferenceUSA. Retrieved from referenceusa.com. October 2, 2017.
IPCC, 2021: Climate Change 2021: The Physical Science Basis. Contribution of Working Group I to the Sixth Assessment Report of the Intergovernmental Panel on Climate Change [Masson-Delmotte, V., P. Zhai, A. Pirani, S. L. Connors, C. Péan, S. Berger, N. Caud, Y. Chen, L. Goldfarb, M. I. Gomis, M. Huang, K. Leitzell, E. Lonnoy, J. B. R. Matthews, T. K. Maycock, T. Waterfield, O. Yelekçi, R. Yu and B. Zhou (eds.)]. Cambridge University Press. In Press.
Koenig, T.A., Bruce, J.L., O’Connor, J.E., McGee, B.D., Holmes, R.R., Jr., Hollins, Ryan, Forbes, B.T., Kohn, M.S., Schellekens, M.F., Martin, Z.W., and Peppler, M.C., 2016, Identifying and preserving high-water mark data: U.S. Geological Survey Techniques and Methods, book 3, chap. A24, 47 p., http://dx.doi.org/10.3133/tm3A24
National Oceanic and Atmospheric Administration (NOAA). 2016. Hurricane Matthew: Rapid Response Imagery of the Surrounding Regions. Available at http://geodesy.noaa.gov/storm_archive/storms/matthew/index.html
National Oceanic and Atmospheric Administration (NOAA). 2018. Hurricane Florence: Emergency Response Imagery of the Surrounding Regions. Available at https://storms.ngs.noaa.gov/storms/florence/index.html
Robesonian. (2018). Sandbags being used to prevent flooding. Retrieved 18 October 2020, from https://www.robesonian.com/news/115384/sandbags-being-used-to-prevent-flooding.
Stewart and Berg. (2019). Hurricane Florence (AL062018). National Hurricane Center Tropical Cyclone Report. National Hurricane Center, 20 May 2019. https://www.nhc.noaa.gov/data/tcr/AL062018_Florence.pdf
Sutley, E.J., Dillard, M.K., and van de Lindt, J.W. (Eds.). (2021). Community Resilience-Focused Technical Investigation of the 2016 Lumberton, North Carolina Flood: Multi-Disciplinary Approach. NIST Special Publication 1230-2.
Sutley, E. J., Hamideh, S., Dillard, M. K., Gu, D., Seong, K., and van de Lindt, J. W. Integrative Modeling of Housing Recovery as a Physical, Economic, and Social Process. In 13th International Conference on Applications of Statistics and Probability in Civil Engineering, 2019.
U.S. Census Bureau (2017). “Population and Housing Unit Estimates.” United States Census Bureau. (https://www.census.gov/programs-surveys/popest.html)

92
United States Geological Survey, The National Map, 2017, 3DEP products and services: The National Map, 3D Elevation Program Web page, accessed 20 May 2019 at https://nationalmap.gov/3DEP/3dep_prodserv.html.
van de Lindt, J.W., Peacock, W.G. and Mitrani-Reiser, J. (Eds.). (2018). Community Resilience-Focused Technical Investigation of the 2016 Lumberton, North Carolina Flood Multi-Disciplinary Approach. NIST Special Publication 1230.
van de Lindt, J.W., W. G. Peacock, J. Mitrani-Reiser, N. Rosenheim, D. Deniz, M. Dillard, T. Tomiczek, M. Koliou, A. Graettinger, P. S. Crawford, K. Harrison, A. Barbosa, J. Tobin, J. Helgeson, L. Peek, M. Memari, E. J. Sutley, S. Hamideh, D. Gu, S. Cauffman, J. Fung. (2020). “Community Resilience-Focused Technical Investigation of the 2016 Lumberton, North Carolina Flood: An Interdisciplinary Approach”. ASCE Natural Hazards Review, 2020, 21(3): 04020029.
Xiao, Y., Watson, M., Helgeson, J., Farokhnia, K., van de Lindt, J., Mitrani-Reiser, J., Sutley, E., Deniz, D., Tomiczek, T., Barbosa, A., Fung, J., Nofal, O., Koliou, M. (2020). "Business Survey Instrument, January 19, 2018: Wave 2," in A Longitudinal Community Resilience Focused Technical Investigation of the Lumberton, North Carolina Flood of 2016. DesignSafe-CI. https://doi.org/10.17603/ds2-f9kt-fm93

Appendix 2A – Wave 3a SurveyNorth Carolina Flood Field Study Damage Inspection Tool
2018 Draft developed by Elaina Sutley and Shane Crawford, October 5, 2018 2016 Draft developed by Derya Deniz, Tori Johnson, and John van de Lindt, November 16, 2016
Please fill in the fields and circle the option that best identifies the condition for multiple-choice questions.
BUILDING ID:______________ SURVEYOR NAMES: (list all)
Building Address:_____________________________ Date/Time of survey:___________________________ GPS- N:_________ GPS-E:__________
ID Photo #: (1) ____________ (2)____________ (3)___________ (4)____________ (5)_______
Building Type: (circle one)
Single Family Multi-Family (3+ units)
Attached Business (e.g., strip mall)
Other building type, Explain: If Residential, is there a garage? Y or N:______
If Y, how many cars fit in the garage? 1, 2:____ Mobile Home Duplex Standalone Business
Enter Number of above ground stories (e.g., 1, 2, 3):___________ Is there a basement? Y or N:__________
Construction Type: Wood Concrete Masonry Steel Pre-fab metal Other, Explain:
Foundation Type: Slab on grade Crawlspace Split Other, Explain:
Does the building appear to be well-maintained? Y, N or N/A:__________ Comments:
FLOOD INFORMATION
Flood level w.r.t to ground: ___________inches Height between Ground level and FFE: FFE=threshold of front or rear door ___________inches
High water mark location (HWM): Foundation First Floor Second Floor Other, Explain:
A-1

OVERALL DAMAGE CLASSIFICATION: (circle one) (refer to either the residential or business damage state descriptions card)
DS0 DS1 DS2 DS3 DS4
Have interior contents or finishes been removed? YES Date*_________ NO
Is there evidence of current occupancy? Y or N: ___________ (based on inspection only)
Has repair work started? YES Date*_________ NO Is mold present? Y or N: _____________ *Date can be collected for businesses only without IRB.
EXTERIOR DAMAGE
Foundation: (circle one) DS0 DS1 DS2 DS3 DS4
Walls: (circle one) DS0 DS1 DS2 DS3 DS4
Attachments or Detached Structures: (circle one) DS0 DS1 DS2 DS3 DS4
OVERALL INTERIOR DAMAGE CLASSIFICATION: (circle one) DS0 DS1 DS2 DS3 DS4
Mark the damage level for the interior items below, where ruined requires full replacement. If item is not applicable or assessable, mark accordingly.
Interior Items Not Applicable Not Assessable No Damage Lightly Damaged Ruined Plywood Subfloor Flooring Carpet Pad Base Trim Water Heater Furnace HVAC equipment Water Softener Drywall Electrical Outlets Base Cabinets (Bathroom) Upper Cabinets (Bathroom) Countertop (Bathroom) Bathroom Facilities Base Cabinets (Kitchen) Upper Cabinets (Kitchen)
A-2

Countertop (Kitchen) Electrical Panelboard Staircase
Continue marking damage level for the interior items below, where ruined requires full replacement. If item is not applicable or assessable, mark accordingly. Front door Interior doors Windows Lighting fixtures Ductwork Kitchen appliances (e.g., dishwasher) Furniture (including nail stations, medical beds)
Inventory Not Applicable Not Assessable No Damage Lightly Damaged Ruined Perishable inventory for sale (e.g., temperature- or electricity-sensitive; e.g., food, drink, medication) Non-perishable inventory for sale (not sensitive to temperature or electricity; e.g., construction materials) Documents / records Molds (manufacturing) Racks, shelving, storage container Office supplies (e.g., paper, pens)
Machinery Not Applicable Not Assessable No Damage Lightly Damaged Ruined Computer Printers Cash register Manufacturing equipment Phones Refrigerator Escalator / elevator Heavy machinery (construction)
EXTRA NOTES: Explain condition of the drinking water well if there is any around the house: _________
A-3
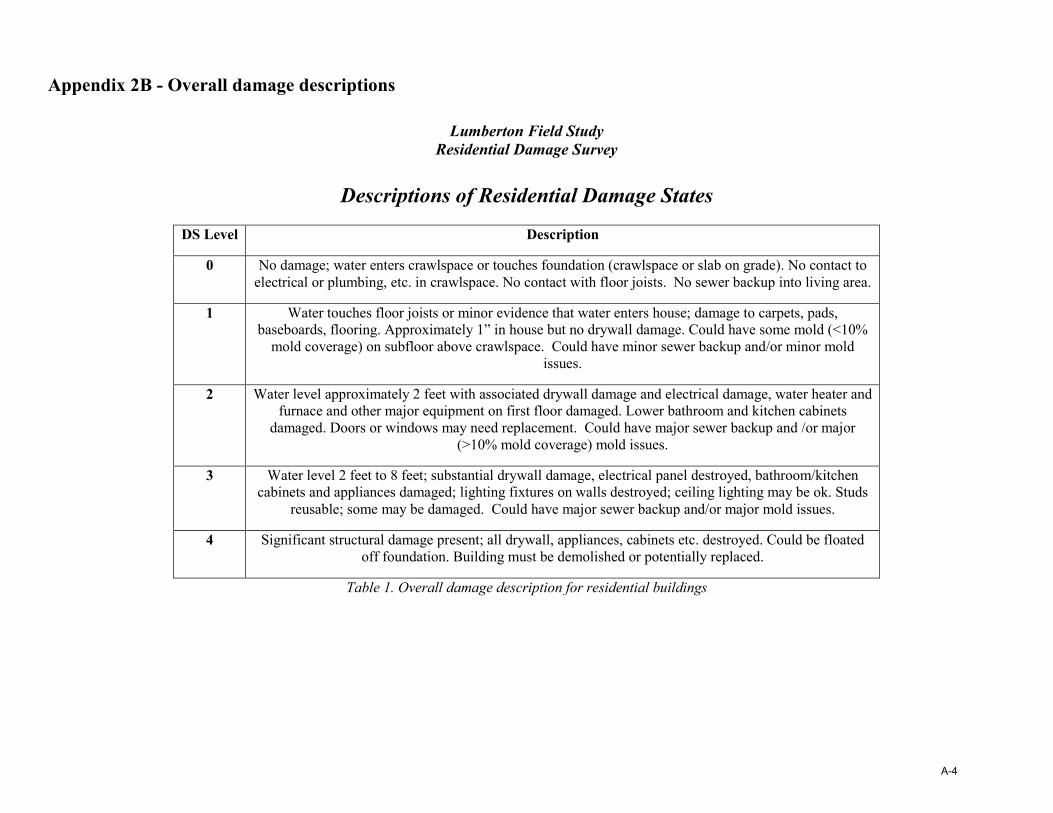
Appendix 2B - Overall damage descriptions
Lumberton Field Study Residential Damage Survey
Descriptions of Residential Damage States
DS Level Description
0 No damage; water enters crawlspace or touches foundation (crawlspace or slab on grade). No contact to electrical or plumbing, etc. in crawlspace. No contact with floor joists. No sewer backup into living area.
1 Water touches floor joists or minor evidence that water enters house; damage to carpets, pads, baseboards, flooring. Approximately 1” in house but no drywall damage. Could have some mold (<10%
mold coverage) on subfloor above crawlspace. Could have minor sewer backup and/or minor mold issues.
2 Water level approximately 2 feet with associated drywall damage and electrical damage, water heater and furnace and other major equipment on first floor damaged. Lower bathroom and kitchen cabinets
damaged. Doors or windows may need replacement. Could have major sewer backup and /or major (>10% mold coverage) mold issues.
3 Water level 2 feet to 8 feet; substantial drywall damage, electrical panel destroyed, bathroom/kitchen cabinets and appliances damaged; lighting fixtures on walls destroyed; ceiling lighting may be ok. Studs
reusable; some may be damaged. Could have major sewer backup and/or major mold issues.
4 Significant structural damage present; all drywall, appliances, cabinets etc. destroyed. Could be floated off foundation. Building must be demolished or potentially replaced.
Table 1. Overall damage description for residential buildings
A-4
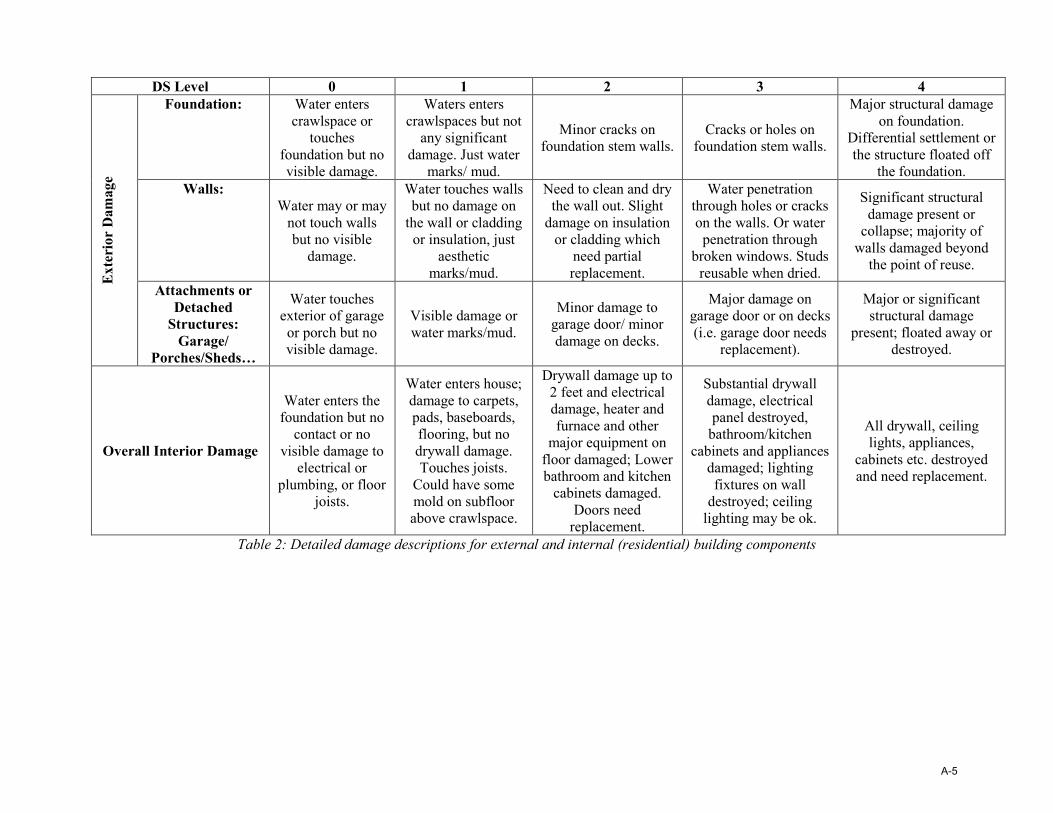
DS Level 0 1 2 3 4 E
xter
ior
Dam
age
Foundation: Water enters crawlspace or
touches foundation but no visible damage.
Waters enters crawlspaces but not
any significant damage. Just water
marks/ mud.
Minor cracks on foundation stem walls.
Cracks or holes on foundation stem walls.
Major structural damage on foundation.
Differential settlement or the structure floated off
the foundation. Walls:
Water may or may not touch walls but no visible
damage.
Water touches walls but no damage on
the wall or cladding or insulation, just
aesthetic marks/mud.
Need to clean and dry the wall out. Slight
damage on insulation or cladding which
need partial replacement.
Water penetration through holes or cracks on the walls. Or water
penetration through broken windows. Studs
reusable when dried.
Significant structural damage present or
collapse; majority of walls damaged beyond
the point of reuse.
Attachments or Detached
Structures: Garage/
Porches/Sheds…
Water touches exterior of garage or porch but no visible damage.
Visible damage or water marks/mud.
Minor damage to garage door/ minor damage on decks.
Major damage on garage door or on decks (i.e. garage door needs
replacement).
Major or significant structural damage
present; floated away or destroyed.
Overall Interior Damage
Water enters the foundation but no
contact or no visible damage to
electrical or plumbing, or floor
joists.
Water enters house; damage to carpets, pads, baseboards, flooring, but no drywall damage. Touches joists.
Could have some mold on subfloor above crawlspace.
Drywall damage up to 2 feet and electrical damage, heater and furnace and other
major equipment on floor damaged; Lower bathroom and kitchen
cabinets damaged. Doors need
replacement.
Substantial drywall damage, electrical panel destroyed,
bathroom/kitchen cabinets and appliances
damaged; lighting fixtures on wall
destroyed; ceiling lighting may be ok.
All drywall, ceiling lights, appliances,
cabinets etc. destroyed and need replacement.
Table 2: Detailed damage descriptions for external and internal (residential) building components
A-5

Lumberton Field Study Business Damage Survey
Descriptions of Business Damage States
DS Level Description
0 No damage; No contact to electrical or plumbing, etc. in crawlspace. No contact with floor joists. No sewer backup
1 Water touches floor joists or minor evidence that water enters building; damage to carpets, pads, baseboards, flooring. Approximately 1” in the building but no drywall damage. Could have some mold
in crawlspace. Could have minor sewer backup and/or minor mold issues (<10% mold coverage). 2 Water level approximately 2 feet with associated drywall damage and electrical damage, water heater
and other major equipment. Doors or windows may need replacement. Could have major sewer backup and /or major mold issues (>10% mold coverage).
3 Water level 2 feet to 8 feet; substantial drywall damage, electrical panel destroyed, office cabinets or storage racks; lighting fixtures on walls destroyed; ceiling lighting may be ok. Studs reusable; some may
be damaged. Could have major sewer backup and/or major mold issues. 4 Significant structural damage present; all drywall, cabinets etc. destroyed. Could be floated off
foundation. Building must be demolished or potentially replaced. Table 1: Overall damage descriptions for business buildings
A-6

DS Level 0 1 2 3 4
Ext
erio
r D
amag
e
Foundation: Water enters crawlspace or
touches foundation but no visible damage.
Waters enters crawlspaces but aesthetic damage only (e.g., water
marks/ mud.
Minor cracks on foundation stem walls.
Cracks or holes on foundation stem walls.
Major structural damage on foundation.
Differential settlement or the structure floated off
the foundation. Walls:
Water may or may not touch walls but no visible
damage.
Water touches walls but no damage on
the wall or cladding or insulation, just
aesthetic marks/mud.
Need to clean and dry the wall out. Slight
damage on insulation or cladding requiring partial replacement.
Water penetration through holes or cracks on the walls or through broken windows. Studs
reusable when dried.
Significant structural damage present or
collapse; majority of walls damaged beyond
the point of reuse.
Attachments or Detached
Structures: Garage/ Loading
Dock/Sheds…
Water touches exterior of
structure but no visible damage.
Visible damage or water marks/mud.
Minor (repairable) damage to structure door/ minor damage on deck or loading
docks.
Major (irrepairable) damage on structure
door or on loading dock (i.e. needs
replacement).
Major or significant structural damage
present; floated away or destroyed.
Overall Interior Damage
Water enters the foundation but no
contact or no visible damage to
electrical or plumbing, or floor
joists.
Water enters building; damage to finishes, but no wall
damage. Touches joists. Could have
some mold on subfloor above
crawlspace.
Drywall damage up to 2 feet and electrical damage, heater and furnace and other
major equipment on floor damaged; Lower cabinets or shelving
damaged. Doors need replacement.
Substantial drywall damage, electrical panel destroyed,
bathroom facilities, shelving, and
equipment damaged; lighting fixtures on wall
destroyed; ceiling lighting may be ok.
All drywall, ceiling lights, equipment and
machinery, cabinets and shelving, etc. destroyed and need replacement.
Table 2: Detailed damage descriptions for external and internal (business) building components
A-7

Appendix 2C – Wave 3a Information sheetHurricane Community Recovery Study for Lumberton, NC
Center for Risk-Based Community Resilience Planning A U.S. National Institute of Standards and Technology-funded Center of Excellence _______________________________________________________________________
The Center for Risk-Based Community Resilience Planning is based at Colorado State University in Fort Collins, Colorado, and includes collaborations with researchers from universities across the United States. The National Institute of Standards and Technology’s Community Resilience Program is based in Gaithersburg, Maryland and includes engineers, economists, and sociologists. Collectively, we are working to understand what makes a community “resilient” – or able to bounce back – in the face of disaster.
Our research in Lumberton focuses on community recovery following the flooding that occurred due to Hurricane Matthew in early October 2016, and after Hurricane Florence in September 2018. We are returning to Lumberton October 16-19, 2018 to follow up our first two studies performed in November 2016 and January 2018. We will be collecting information on the physical damage to residential and commercial buildings to gain knowledge on the initial physical impact from Hurricane Florence and the resulting flooding. We will return in January 2019 to speak with households and businesses to learn more about the disruption experienced following two successive hurricane and flooding events. We hope to learn from your experiences to help communities better prepare for similar events in the future.
During the October trip, we will be collecting measurements of flood height and information on visible physical damage to residential and commercial structures, including to the building exterior, foundation, walls, and interior items if visible.
This research is part of a five-year project that will be carried out by experts from engineering, the social sciences, economics, and many other disciplines. This community was selected as one of our five research locations around the country that we hope to learn from. Our field team will be in Lumberton from October 16 through 19, 2018, and expects to return in January 2019.
If you have more general questions about the project or the Center for Risk-Based Community Resilience Planning, please contact: Dr. John van de Lindt at 970-218-4076 or via email: [email protected].
A-8

Appendix 2D - Handouts available to sampleMental Health Resources
Should you need additional assistance, the following local resources are available to provide timely services.
Crisis Services for Robeson County are managed by: Eastpointe
Phone Access: Eastpointe Access Center is available 24 hours a day, 7 days a week. Customer Service Specialists will assist you to find a crisis provider that is well-matched with your needs. Your local number is: 800-913-6109 or for TTY 888-819-5112 If you already have a service provider, call them first. Providers who know you are usually best prepared to assist you in a crisis.
Hurricane Florence Resources: http://www.eastpointe.net/home/hurricane-florence-related-information/
State Level Resources:
If you’re feeling anxious, stressed or need to talk, call the state’s behavioral health “Disaster Distress” hotline at 1-800-985-5990.
You can also request to talk to a crisis counselor with Magellan Health. Call the crisis information and resource hotline at 1-800-327-7451. Magellan can also give referrals to local shelters, food and other services.
Trillium Health Resources supports mental health in 26 eastern North Carolina counties. Call them at 1-877-685-2415 to connect with mental health resources.
Parents and caregivers can access resources on how to help children recover after the hurricane on the website of the National Child Traumatic Stress Network: https://www.nctsn.org/what-is-child-trauma/trauma-types/disasters/hurricane-resources.
A-9

Appendix 3A – Wave 3c Housing SurveyOMB Control #0693-0078 Expiration 07/31/2019
Surveyor(s):_________________________________________ Date:________________________________________
Building ID:______________ Wave 2 DS: _____ Repaired in Wave 2?_____ Unit Address:________________________
Building Type: 1, Single family 2, Multi-family, # housing units _______ 3, Mobile home 4, Other, _____________
Comments:_________________________________________________________________________________________ Result/
Completion Codes
1. Completed interview 2. Ineligible, no adult or eligible person to answer questions 3. Bad address, could not locate HU 4. Incomplete/partial 5. Not occupied residence, abandoned; home destroyed 6. Ineligible, structure not a residence7. No answer or response, but evidence or confirmed occupied 8. No access, gated community, fence preventing entry
Housing Unit Occupancy status:
YES: household present interviewed or attempted
YES, household not present; evidence of habitation
DK: Indeterminate/ uncertain
NO: not occupied, appears abandoned
YES, household not present; occupied confirmed by neighbor
YES, household not present but occupied, confirmed by management
NO: not occupied, under repair/ reconstruction. NO, damaged and not habitable
If interview not possible but neighbors, apartment managers, or others can provide information, record here: Mark type of informant: Neighbor Manager Other: (specify) ________________
Was the housing unit occupied at the time of HURRICANE FLORENCE? YES, #HH members______ NO DK
Is the household still living there? YES NO DK
If not still living there, do you know when the household left? ____________MM/YY Did household leave because of HURRICANE FLORENCE flooding? YES NO DK
[The following questions are to be answered upon consent of a household (HH) member over 18 years of age.]
1. How many people live in your household? Adults (≥ 18) ______ Children (< 18) ______ 2. When did you move into this home?
IF AFTER SEPT 2018, SKIP TO Q26. ________________ MM/YY 3. Was this house damaged from HURRICANE MATTHEW? YES NO DK
3a. If YES, how much of your HURRICANE MATTHEW damage was fully repaired at the time of HURRICANE FLORENCE?
None Some Most All
4. Was this house damaged from HURRICANE FLORENCE? YES NO DK 4a. If YES, how long until it was fully repaired? _________ D/WK/MO Still not repaired
The next set of questions are intended to capture the impacts of HURRICANE FLORENCE and the flooding on your HH.
5. 5. Did your home lose electricpower? YES NO DK* If yes, for how long? Record in hours or days*
______ Hrs. ______ Dys
6. a. Did your home lose water? YES NO DK* If yes, for how long? Record in hours or days* ______ Hrs. ______ Dys
6b. Did your home lose wastewater/sewer? YES NO DK* If yes, for how long? Record in hours or days*
______ Hrs. ______ Dys 7. Was your water unsafe to drink
or under a boil water order? YES NO DK* If yes, for how long? Record hours or days* ______ Hrs. ______ Dys
A-10

8. Did you home lose gas (LP)? YES NO NA DK* If yes, for how long? Record hours or days* ______ Hrs. ______ Dys
9. a. Did your Household lose cellphone service? YES NO NA DK*
If yes, for how long without cell phone service?
Record hours or days* ______ Hrs. ______ Dys
9. b. Did your Household lose landline phone service? YES NO NA DK*
If yes, for how long without landline phone service?
Record hours or days* ______ Hrs. ______ Dys
10. Did you lose any internetconnectivity to your home? YES NO NA DK*
If yes, for how long without internet service?
Record hours or days* ______ Hrs. ______ Dys
NA = not appropriate question, did not have this utility DK* = don't know because were out of their home when utility may have been off. If the household evacuated, and never lost cell service, put NO
*Record hours or days, but not both.Record hour, if utility disruption for less than a day. Record days, to nearest day, if disruption over a day.
11. Were you and your household dislocated from your home?[If YES, continue to a-e. If NO, skip to Q12.] YES NO DK
a. How long were you and your household dislocated from your homebecause of the flood following HURRICANE FLORENCE? (insert time range, and circle whether in D, WK, or MO) ______________ D/WK/MO b. Did the timing of insurance payout or other financial assistance causea delay in your household returning home? YES NO DK
c. Did a closure or change in your place of work cause a delay in yourhousehold returning home? YES NO DK
d. Did a closure or change in your child/ren’s school cause a delay inyour household returning home? YES NO DK
e. Did closure of businesses, such as day care or grocery stores, cause adelay in your household returning home? YES NO DK
12. Since the beginning of 2018, did you or any household members misswork due to housing issues caused by the flooding? [housing issues areany problems with your house that started with HURRICANEMATTHEW/HURRICANE FLORENCE and/or the flooding]
YES NO DK
a. If YES, what was the greatest number of days/weeks of work missedby household members: __________________D/WK
b. If YES, where does the person who missed the greatest number ofdays/weeks work? _______________________
The next set of questions are about assistance you may have received to help with your recovery following HURRICANE FLORENCE.
13. Does your household OWN or RENT this house? Own Rent Other, specify_________ a. If RENT, did you have renter’s insurance prior to
HURRICANE FLORENCE? YES NO DK
b. If OWN, did you have flood insurance prior toHURRICANE FLORENCE? YES NO DK
c. If OWN, did you have homeowner’s insurance prior toHURRICANE FLORENCE? YES NO DK
d. If OWN, did you have a mortgage prior to HURRICANEFLORENCE? YES NO DK
A-11

14. If YES to insurance (Q13a-c), did you receive a payout for damages from HURRICANE FLORENCE flooding?[Circle all that apply] YES, from renters ins. YES, from flood ins. YES, from homeowner’s ins. NO DK
a. If YES to receive payout (Q14), when did you receive your insurance payout(s)?(Date MM/YY)_____________________
b. If YES to receive payout (Q14), how many of your repairs were covered by insurance payout(s)?Very little Some Almost all/All
15. If NO to insurance (Q13a-c) before HURRICANE FLORENCE, do you have insurance now?[Circle all that apply] YES, renters ins. YES, flood ins. YES, homeowner’s ins. NO DK
[Homeowners continue to next question; Renters skip to Q18.] Now I am going to ask you about seven types of assistance to learn what resources were available to community members. Please answer whether you applied or received any of these types of assistance since the beginning of 2018, considering either HURRICANE MATTHEW or HURRICANE FLORENCE.
16. For each of the following types of disasterrecovery assistance, did you apply for, and/orreceive the following:
Wave 2 responses
Applied? (Y or N)
Received? (Y or N)
HM* (X)
HF* (X)
If received, when? MM/YY
a. Home repair funds from FEMA (IHP)b. SBA (Small Business Administration) loansc. Home repair grant (HUD/CDBG-DR) from
governmentd. Hazard Mitigation Grant Program from
FEMA (HMGP) (e.g., elevations, buyouts,demolition, rebuild)
e. Financial assistance from non-governmentalorganizations?
f. Clean up or repair help from non-governmental organizations?
g. Financial assistance from friends or familyh. Cleanup or repair assistance from friends or
family*mark (X) if they applied and/or received from either/both hurricane (HM=Matthew; HF=Florence)
17. If you received any of the above types of assistance and/or insurancepayouts, was the total amount you received enough to pay for repairand replacement of all of the physical damages to your home andcontents considering both HURRICANE MATTHEW & HURRICANEFLORENCE?
YES NO DK
a. If NO, how many of your repairs/replacement were covered? Very little Some Almost all/all b. If NO, did you and your household personally pay for the rest? YES NO DK
Now I am going to ask you about your assessment of recovery from HURRICANE MATTHEW and HURRICANE FLORENCE..
18. Does your household have the same access to school in this home asyou did before HURRICANE MATTHEW and HURRICANE FLORENCE? YES NO DK
A-12

19. Does your household have the same access to work in this home asyou did before HURRICANE MATTHEW and HURRICANE FLORENCE? YES NO DK
20. Does your household have the same access to grocery stores andother essential needs in this home as you did before HURRICANEMATTHEW and HURRICANE FLORENCE?
YES NO DK
21. Has your involvement with neighborhood and/or community groupsincreased since HURRICANE MATTHEW? YES NO DK
22. Has your contact with neighbors and/or extended family and friendsincreased since HURRICANE MATTHEW? YES NO DK
23. Does your household plan to move to a different housing unit withinthe next year because of any issue that unfolded as a result ofHURRICANE MATTHEW and/or HURRICANE FLORENCE?
YES NO DK
a. If YES (to Q23), do you have any specific area in mind to move? Somewhere else in
Lumberton
Somewhere else in NC
Out of State
[See Q1, if 0 children in household, skip to Q26] Next, I want to ask about the experience of the children in your HH.
24. Was your child/ren enrolled in a school in Lumberton in the past 12 months? Yes No [If NO, skip to Q26] 25. When thinking about your child/ren’s educational recovery following both hurricanes, would you say that your
child/ren’s educational situation is…a. Better than it was before the hurricanesb. Back to where it was before the hurricanesc. Worse than before the hurricanesd. Uncertain, things are still changing for you child/rene. Other (Please specify)___________________________________________________________
26. The next set of questions looks at mitigation andpreparedness strategies used in this house before or sinceHurricane Florence. Did your household:
Had before Florence Have now
a. Elevate hot water heater and/or HVAC Yes No DK Yes No DK b. Elevate interior contents in preparation for the flood Yes No DK Yes No DK c. Assess the building (structurally) by an engineer Yes No DK Yes No DK d. Re-route ductwork from below floor to attic space Yes No DK Yes No NA* e. Make disaster plan with household members Yes No DK Yes No DK f. Other: Yes No DK Yes No DK g. Other: Yes No DK Yes No DK h. Other: Yes No DK Yes No DK
Finally, I have four questions about your household in general. 27. When considering all members in your household,
what is the highest number of years of schoolingcompleted?
High School Associate’s degree Bachelor’s degree Master’s deg. or higher
28. While we often ask about each member of ahousehold, in general, when considering yourhousehold how would you characterize its racial makeup? Select one or more.
1) White2) Black or African American3) American Indian or Native American4) Asian
5) Native Hawaiian or other Pacific Islander6) [If respondent selects >1, surveyor mustspecify codes] _______________
29. Are members of your household Hispanic orLatino? 1) Not Hispanic or Latino 2) Yes, Hispanic or Latino
30. Finally, I don’t want to know the exact amount,but can you identify the letter associated with thecategory that best captures your household’scombined annual income? (hand respondent theincome card)
A. $1 to $3,999B. $4,000 to $5,999 C. $6,000 to $7,999 D. $8,000 to $9,999 E. $10,000 to $11,999
F. $12,000 to $14,999 G. $15,000 to $19,999 H. $20,000 to $24,999I. $25,000 to $29,999 J. $30,000 to $39,999
K. $40,000 to $49,999 L. $50,000 to $74,999 M. $75,000 to $99,999 N. $100,000 to $149,999O. $150,000+
A-13
Thank you for your time!
This collection of information contains Paperwork Reduction Act (PRA) requirements approved by the Office of Management and Budget (OMB). Notwithstanding any other provisions of the law, no person is required to respond to, nor shall any person be subject to a penalty for failure to comply with, a collection of information subject to the requirements of the PRA unless that collection of information displays a currently valid OMB control number. For this collection, the OMB Control number is:0693-0078 with an expiration date: July 31, 2019. Public reporting burden for this collection is estimated to be 10 minutes per survey, including the time for reviewing instructions, searching existing data sources, gathering and maintaining the data needed and completing and reviewing the collection of information. Send comments regarding this burden estimate or any aspect of this collection of information, including suggestions for reducing this burden, to the National Institute of Standards and Technology, Attn: Dr. Jennifer Helgeson, NIST, 100 Bureau Drive, MS 8603, Gaithersburg, MD 20899-1710, telephone 301-975-6133, or via email:[email protected].
Privacy Act Statement Authority: The Paperwork Reduction Act of 1980 (Pub. L. No. 96-511, 94 Stat. 2812, codified at 44 U.S.C. §§ 3501–3521).
Purpose: The National Institute for Standards and Technology (NIST) conducts Community Resilience research and surveys through the Generic Paperwork Reduction Act Clearance, OMB CONTROL NO. 0693-0078 Expiration date: 07/31/2019.
Routine Uses: NIST will use this information to conduct a systematic process evaluation of the NIST Community Resilience Planning Guide implementation. This is not a Privacy Act system of Records, therefore there is no System of Records Notice associated with this collection.
Disclosure: Furnishing this information is voluntary. When you submit the form, you are indicating your voluntary consent for NIST to use of the information you submit for the purpose stated.
A-14

Appendix 3B - Wave 3c Housing Information sheetHurricane Matthew Community Recovery Study for Lumberton, NC
Center for Risk-Based Community Resilience Planning A U.S. National Institute of Standards and Technology-funded Center of Excellence _______________________________________________________________________
The Center for Risk-Based Community Resilience Planning is based at Colorado State University in Fort Collins, Colorado, and includes collaborations with researchers from universities across the United States. The National Institute of Standards and Technology’s Community Resilience Program is based in Gaithersburg, Maryland and includes engineers, economists, and sociologists. Collectively, we are working to understand what makes a community “resilient” – or able to bounce back – in the face of disaster.
Our research in Lumberton focuses on community recovery following the flooding that occurred due to Hurricanes Matthew and Florence. We are returning to Lumberton for our third year to follow up on progress with recovery. We will be collecting information from households like yours to gain knowledge on the impacts and the recovery from Hurricanes Matthew and Florence. We hope to learn from your experiences to help communities better prepare for similar events in the future.
This research is part of a five-year project that will be carried out by experts from engineering, the social sciences, economics, and many other disciplines. This community was selected as one of our five research locations around the country that we hope to learn from. Our field team will be in Lumberton from April 11 through 21, 2019.
Because NIST is part of the federal government, this research was reviewed through a special process. This collection of information contains Paperwork Reduction Act (PRA) requirements approved by the Office of Management and Budget (OMB). Notwithstanding any other provisions of the law, no person is required to respond to, nor shall any person be subject to a penalty for failure to comply with, a collection of information subject to the requirements of the PRA unless that collection of information displays a currently valid OMB control number. For this collection, the OMB Control number is: 0693-0078 with an expiration date of July 31, 2019.
Public reporting burden for this collection is estimated to be 15 minutes per survey, including the time for reviewing instructions, searching existing data sources, gathering and maintaining the data needed and completing and reviewing the collection of information. Send comments regarding this burden estimate or any aspect of this collection of information, including suggestions for reducing this burden, to the National Institute of Standards and Technology, Attn: Dr. Jennifer Helgeson, NIST, 100 Bureau Drive, MS 8603, Gaithersburg, MD 20899-1710, telephone 301-975-6133, or via email:[email protected]
If you have more general questions about the project or the Center for Risk-Based Community Resilience Planning, please contact: Dr. John van de Lindt at 970-218-4076 or via email: t [email protected].
A-15

Appendix 3C - Wave 3c Housing Consent ScriptTwo-Year Post-Hurricane Matthew Field Study in Lumberton, North Carolina
Housing/Household Recovery Survey Consent Script
OMB CONTROL NO. 0693-0078 Expiration date: 07/31/2019
Hello, my name is (interviewer name) and I am a researcher from (name of university or National Institute of Standards and Technology) in the (department name/Engineering Laboratory). We are conducting a research study on recovery following the flooding that occurred in Lumberton, N.C. from Hurricane Matthew and Hurricane Florence. We would like to speak with you about how this event affected your household. In particular, we are interested in learning about the process of recovering from the flooding.
This study is part of a larger project led by Center of Excellence for Risk-Based Community Resilience Planning at Colorado State University. This project is led by Drs. John van de Lindt and Bruce Ellingwood, both Professors from the Civil and Environmental Engineering Department and is funded by the National Institute of Standards and Technology (NIST).
We would like to ask you some brief survey questions about your household’s experience after the flood as well as some details about your household during this time. Participation will take approximately fifteen minutes. Your participation is voluntary. If you decide to participate in the study, you may withdraw your consent and stop participation at any time without penalty.
We will be collecting information about the damage to your home, the process of making repairs, and how the flood disrupted your household’s living arrangements and daily routines, such as going to work and school. When we report and share our findings, we will combine the data from all participants into summary statistics and tables so no unique individual or household can be identified. There are NO KNOWN RISKS or direct benefits to you. We hope to gain more knowledge on how you and others were affected by Hurricanes Matthew and Florence so that we can learn from your experiences to help communities better prepare for similar events in the future.
So again, we would like to speak with an adult member of the household. Would that person be you and would you be willing to participate?
This collection of information contains Paperwork Reduction Act (PRA) requirements approved by the Office of Management and Budget (OMB). Notwithstanding any other provisions of the law, no person is required to respond to, nor shall any person be subject to a penalty for failure to comply with, a collection of information subject to the requirements of the PRA unless that collection of information displays a currently valid OMB control number. For this collection, the OMB Control number is:0693-0078 with an expiration date: July 31, 2019. Public reporting burden for this collection is estimated to be 10 minutes per survey, including the time for reviewing instructions, searching existing data sources, gathering and maintaining the data needed and completing and reviewing the collection of information. Send comments regarding this burden estimate or any aspect of this collection of information, including suggestions for reducing this burden, to the National Institute of Standards and Technology, Attn: Dr. Jennifer Helgeson, NIST, 100 Bureau Drive, MS 8603, Gaithersburg, MD 20899-1710, telephone 301-975-6133, or via email:[email protected].
A-16

Appendix 4A – Wave 3c Business SurveyTWO-YEAR POST-HURRICANE FLORENCE FIELD STUDY IN LUMBERTON, NORTH CAROLINA
BUSINESS RECOVERY SURVEY
OMB CONTROL #0693-0078; EXPIRATION DATE: 07/31/2019 (NIST GENERIC CLEARANCE FOR COMMUNITY RESILIENCE DATA COLLECTIONS)
Date: ______________________ Surveyor(s): ________________________
PIN: _________________ Business Name: ____________________
Address: ___________________________________________________________
1. What is the operational status of this business?1. Open2. Permanently closed3. Moved to alternative location (provide address:______________________________)4. Not sure/don’t know:
(take notes on any information that can help us identify the status of the business:_____________________________________________________________ )
[THE FOLLOWING QUESTIONS SHOULD BE ANSWERED BY BUSINESS OWNER OR MANAGER]
2. What is your role with this business? 1. Owner 2. Manager 3. Owner and Manager
3. Does this business have any of the following federal classification? [Please circle all that apply]
1. Woman-owned 2. Minority certified by the SBA (8a) 3. Veteran-owned 4. NONE
“The first set of questions are intended to capture how recovery is going following the flooding in 2016 caused by Hurricane Matthew. And to give us an idea of where your business was in recovery before Hurricane Florence.”
FOLLOW-UP: HURRICANE MATTHEW 4. What kind of damage was caused by Hurricane Matthew and how severe was the damage? [hand damage
description card to business owner/manager]
Flood depth __________ inches
Building damage (due to flood) 1. None 2. Minor 3. Moderate 4. Severe 5. Complete
Building damage (due to wind) 1. None 2. Minor 3. Moderate 4. Severe 5. Complete
Contents/inventory damage 1. None 2. Minor 3. Moderate 4. Severe 5. Complete
Machinery/equipment damage 1. None 2. Minor 3. Moderate 4. Severe 5. Complete
5. Where do you feel your business was in the process of recovery immediately BEFORE Hurricane Florence?1. Still in survival/response mode2. Recovering
A-17

3. Mostly recovered4. Fully recovered5. Still in operation but would never recover (please explain):_______________________________
6. What is the % capacity at which you were operating immediately BEFORE Hurricane Florence? ______ %[For “capacity,” ask the business to consider aspects of the business that are most important to them, like thequality and/or quantity of service or product offerings. For example: 50% for reduced capacity, 110% forincreased capacity, or 0% for businesses that have not resumed operations.]
7. How profitable was your business…
a. Before HurricaneMatthew
b. Between HurricaneMatthew and Florence
How profitable is your business now?
c. Current profitability
8. Do you still require physical repairs from Hurricane Matthew?1. Yes 2. No 3. N/A
a. If YES, what percent of your repairs still need to be completed? ___________
9. How much would you say Hurricane Florence affected your recovery from Hurricane Matthew?1. Not at all2. A little3. Moderately4. Severely5. Not applicable (not affected by Matthew)
10. How important are the decisions of other businesses (those on the same block as your business) toremain open or to close in your own decision-making?
1. Not at all important2. Somewhat unimportant3. Neither important nor unimportant4. Somewhat important5. Very important
“Okay, thank you. The next question is going to ask about financial recovery resources to understand what was or may not have been available to businesses in Lumberton.”
1. HighlyProfitable 2. Profitable
3. BreakingEven 4. Unprofitable
5. HighlyUnprofitable
6. Closed
1. HighlyProfitable 2. Profitable
3. BreakingEven 4. Unprofitable
5. HighlyUnprofitable
6. Closed
1. HighlyProfitable 2. Profitable
3. BreakingEven 4. Unprofitable
5. HighlyUnprofitable
6. Closed
A-18

11. How did you finance your business's recovery from Hurricane Matthew? [Ask the business to indicate witha percentage for example, their recovery was funded 20% by credit card, 60% by personal savings, and 20% byinsurance.]
Personal savings Credit card Corporate assistance (or assistance from another branch/location) Insurance Donations Private bank loans Crowd funding Assistance from friends or family Federal assistance programs (e.g. Small Business Administration loans) (List:___________________________________________________________) State assistance programs (e.g. Resilient Recovery Loan Program) (List:___________________________________________________________) Local assistance programs (e.g. grant or loan from the city or local non-profit) (List:___________________________________________________________) Other: Other: Other:
TOTAL 100
[Alternative, circle if the business doen’t know or cannot answer]: DK
IMPACT AND RECOVERY FROM HURRICANE FLORENCE
“These next series of questions are intended to capture information about the impact and recovery from Hurricane Florence. Please think about the days or weeks immediately following Hurricane Florence when providing your responses.”
12. What kind of damage was caused by Hurricane Florence and how severe was the damage? [hand damagedescription card to owner/manager]
Building damage (due to flood) 1. None 2. Minor 3. Moderate 4. Severe 5. CompleteFlood depth __________ inches
Building damage (due to wind) 1. None 2. Minor 3. Moderate 4. Severe 5. CompleteContents/inventory damage 1. None 2. Minor 3. Moderate 4. Severe 5. CompleteMachinery/equipment damage 1. None 2. Minor 3. Moderate 4. Severe 5. Complete
13. Did your business lose any of the following utilities? And for how long?[* N/A: not applicable, if the business does not use this service, please indicate N/A; DK: don’t know]
electric power? 1. Yes 2. No 3. DK 4. N/A _____Hours or _____ Days still don’t have electricity
water? 1. Yes 2. No 3. DK 4. N/A _____Hours or _____ Days still don’t have water
natural gas? 1. Yes 2. No 3. DK 4. N/A _____Hours or _____ Days still don’t have natural gas
A-19

sewer? 1. Yes 2. No 3. DK 4. N/A _____Hours or _____ Days still don’t have sewer
landline phone? 1. Yes 2. No 3. DK 4. N/A _____Hours or _____ Days still don’t have landline
cell phone service? 1. Yes 2. No 3. DK 4. N/A _____Hours or _____ Days still don’t have cell service
Internet/IT? 1. Yes 2. No 3. DK 4. N/A _____Hours or _____ Days still don’t have internet/IT
14. Did this business experience physical accessibility problems after Hurricane Florence like street or sidewalkclosures?
1. Yes 2. No
15. Immediately following Hurricane Florence, did you completely cease operation at this location?1. Yes 2. No
16. How long did it take for your business to resume operations? ____________ (days)
17. Did you have any employee(s) who could not report to work due to any of the following issues afterHurricane Florence:
transportation problems? 1. Yes 2. No
their need to repair their home?1. Yes 2. No
their children were not back to school?1. Yes 2. No
disaster-related physical health issues?1. Yes 2. No
disaster-related mental health issues?1. Yes 2. No
18. Did this business experience loss of customers after Hurricane Florence?1. Yes (_____% loss of customers) 2 . No
19. Where do you feel your business is in the process of recovery since Hurricane Florence?
1. Still in survival/response mode2. Recovering3. Mostly recovered4. Fully recovered5. Still in operation but will never recover (please explain) _______________________________
20. Compared to before Hurricane Florence, what is the % capacity at which you are NOW operating? _____%
21. a. Immediately before Hurricane Florence, how many full time and part time employees did thisbusiness have?
Before: Full time __________ Part time ____________ b. What about now?
Now: Full time __________ Part time ____________
A-20

22. Please indicate your level of agreement with the following statement.
We have more suppliers outside our city than we did prior to Hurricane Florence
RECOVERY FINANCE “Thank you! These next few questions are about recovery finance options following Hurricane Florence.”
23. Did you have flood insurance coverage on the building, contents, or business interruption beforeHurricane Florence? Did you file claims and receive money?
Had Insurance? Filed Claim? Received Money? Received When? (months after Florence)
Building insurance 1. Yes 2. No 1. Yes 2. No 1. Yes 2. NoContent insurance 1. Yes 2. No 1. Yes 2. No 1. Yes 2. NoBusiness interruption insurance
1. Yes 2. No 1. Yes 2. No 1. Yes 2. No
Liability insurance 1. Yes 2. No 1. Yes 2. No 1. Yes 2. No
24. Did you receive any of the following assistance in recovery from Hurricane Florence?
Assistance Description Applied? Received? Received When? (months after Florence)
a. FEMA financial assistance 1. Yes 2. No 1. Yes 2. No
b. SBA (Small Business Administration) loan 1. Yes 2. No 1. Yes 2. No
c. Other federal or state funds (specify):______________________________________
1. Yes 2. No 1. Yes 2. No
d. Local government funds (specify):______________________________________
1. Yes 2. No 1. Yes 2. No
e. Financial assistance from any church or othernon-government organizations?
1. Yes 2. No 1. Yes 2. No
f. Clean up or repair help from church or othernon-government organizations?
1. Yes 2. No 1. Yes 2. No
g. Loan from a Bridge Loan** program 1. Yes 2. No 1. Yes 2. No
h. Private/bank loans 1. Yes 2. No 1. Yes 2. No
i. Crowdsourcing (e.g. online) 1. Yes 2. No 1. Yes 2. No
j. Fundraisers (e.g. in-person/events/not online)? 1. Yes 2. No 1. Yes 2. No
k. Other(s)? _____________________ 1. Yes 2. No 1. Yes 2. No
** Bridge Loan: typically, loans between $1,000 and $50,000 for up to one year. While the bridge loan is a source of expedient funds, it is not designed to be the primary source of assistance for affected small businesses
25. How long can this business function in a deficit [enter number of days, weeks, months, and specify whichtime unit]? ________________
1. Stronglydisagree 2. Disagree 3. Neutral 4. Agree 5. Strongly
agree
A-21

MITIGATION, PREPAREDNESS, AND ADAPTATION“These next questions are going to capture information about mitigation, preparedness, and adaptation following Hurricanes Matthew and Florence.”
26. IF YOUR BUSINESS OWNED/OWNS THE BUILDING. Did you adopt any of the following mitigationstrategies? [Please indicate with an “X” all that apply; If the business does not own the building, skip to Q27]
Mitigation or Preparedness Action
No adoption
Adopted before Hurricane Matthew
Adopted between Hurricane Matthew and Hurricane Florence
Adopted after Hurricane Florence
a. Floodproofing of building done byprofessionalsb. Floodproofing of building done bynonprofessionals (including yourself)c. Secured a secondary storage locationd. Had the building structurally assessed byan engineer
27. FOR ALL BUSINESSES: Did this business have any of the following emergency management strategies inplace before Hurricane Florence? Does it still have or has it added them since Hurricane Florence? [Pleaseindicate with an “X” all that apply]
Mitigation or Preparedness Action
No adoption
Adopted before Hurricane Matthew
Adopted between Hurricane Matthew and Hurricane Florence
Adopted after Hurricane Florence
a. Performed risk assessment to identifybusiness vulnerability todisastersb. Adopted strategies to stay informed ofweather watches andwarningsc. Developed a written emergency actionplan or checklistd. Assigned disaster responsibilities tospecific employeese. Performed emergency management drillsregularly
BUSINESS INFORMATION “Now, I’d like to ask you general questions about your business and yourself.”
28. In what year was this business established at this location? ______________ (Year)
A-22

29. Does this business own or rent the building?1. Own (including buying the building with mortgage)2. Rent3. Other (please specify) __________________________________
30. What was the business ownership structure before Hurricane Florence?1. Single owner2. Partnership (multiple owners)3. Corporation or franchise4. Cooperative
Other (please specify): __________________________________
OWNER/MANAGER DEMOGRAPHICS
31. How many years have you worked as a business owner/manager here or for other businesses?_____________ (years)32. What is your age? ________________ (years)33. What is your number of years of schooling? Enter number of years _______ and indicate
type of diploma or degree: 1. High School 2. Associate degree 3. Bachelors 4. Masters or higher degree
34. Are you Hispanic? 1. Yes 2. No35. What is your race? Please select one or more.
1) White2) Black or African American3) American Indian or Native American4) Asian
5) Native Hawaiian or other Pacific Islander6) [If respondent selects >1, surveyor must specifycodes] _______________
We would like to get some additional information from you in order to make future surveys easier and at your convenience. Would you be willing to provide your first name and email address? YOU WILL NOT RECEIVE
ANY EMAILS BEYOND OUR REQUEST FOR ADDITIONAL CLARIFICATION ON THIS SURVEY.
Name:______________________________
Business Email:________________________________
Lastly, if you have any comments about the survey and/or business recovery after the flood, please write them down in the space below.
A-23

THANK YOU VERY MUCH FOR COMPLETING THE SURVEY!
This collection of information contains Paperwork Reduction Act (PRA) requirements approved by the Office of Management and Budget (OMB). Notwithstanding any other provisions of the law, no person is required to respond to, nor shall any person be subject to a penalty for failure to comply with, a collection of information subject to the requirements of the PRA unless that collection of information displays a currently valid OMB control number. For this collection, the OMB Control number is:0693-0078 with an expiration date: July 31, 2019. Public reporting burden for this collection is estimated to be 15 minutes per survey, including the time for reviewing instructions, searching existing data sources, gathering and maintaining the data needed and completing and reviewing the collection of information. Send comments regarding this burden estimate or any aspect of this collection of information, including suggestions for reducing this burden, to the National Institute of Standards and Technology, Attn: Dr. Jennifer Helgeson, NIST, 100 Bureau Drive, MS 8603, Gaithersburg, MD 20899-1710, telephone 301-975-6133, or via email:[email protected].
Privacy Act Statement Authority: The Paperwork Reduction Act of 1980 (Pub. L. No. 96-511, 94 Stat. 2812, codified at 44 U.S.C. §§ 3501–3521).
Purpose: The National Institute for Standards and Technology (NIST) conducts Community Resilience research and surveys through the Generic Paperwork Reduction Act Clearance, OMB CONTROL NO. 0693-0078 Expiration date: 07/31/2019.
Routine Uses: NIST will use this information to conduct a systematic process evaluation of the NIST Community Resilience Planning Guide implementation. This is not a Privacy Act system of Records, therefore there is no System of Records Notice associated with this collection.
Disclosure: Furnishing this information is voluntary. When you submit the form, you are indicating your voluntary consent for NIST to use of the information you submit for the purpose stated.
A-24

Appendix 4B - Wave 3c Business Information sheetHurricane Matthew Community Recovery Study for Lumberton, NC
Center for Risk-Based Community Resilience Planning A U.S. National Institute of Standards and Technology-funded Center of Excellence _______________________________________________________________________
The Center for Risk-Based Community Resilience Planning is based at Colorado State University in Fort Collins, Colorado, and includes collaborations with researchers from universities across the United States. The National Institute of Standards and Technology’s Community Resilience Program is based in Gaithersburg, Maryland and includes engineers, economists, and sociologists. Collectively, we are working to understand what makes a community “resilient” – or able to bounce back – in the face of disaster.
Our research in Lumberton focuses on community recovery following the flooding that occurred due to Hurricanes Matthew and Florence. We are returning to Lumberton for our third year to follow up on progress with recovery. We will be collecting information from businesses like yours to gain knowledge on the impacts and the recovery from Hurricane Matthews and Florence. We hope to learn from your experiences to help communities better prepare for similar events in the future.
This research is part of a five-year project that will be carried out by experts from engineering, the social sciences, economics, and many other disciplines. This community was selected as one of our five research locations around the country that we hope to learn from. Our field team will be in Lumberton from April 11 through 21, 2019.
Because NIST is part of the federal government, this research was reviewed through a special process. This collection of information contains Paperwork Reduction Act (PRA) requirements approved by the Office of Management and Budget (OMB). Notwithstanding any other provisions of the law, no person is required to respond to, nor shall any person be subject to a penalty for failure to comply with, a collection of information subject to the requirements of the PRA unless that collection of information displays a currently valid OMB control number. For this collection, the OMB Control number is:0693-0078 with an expiration date of July 31, 2019.
Public reporting burden for this collection is estimated to be 15 minutes per survey, including the time for reviewing instructions, searching existing data sources, gathering and maintaining the data needed and completing and reviewing the collection of information. Send comments regarding this burden estimate or any aspect of this collection of information, including suggestions for reducing this burden, to the National Institute of Standards and Technology, Attn: Dr. Jennifer Helgeson, NIST, 100 Bureau Drive, MS 8603, Gaithersburg, MD 20899-1710, telephone 301-975-6133, or via email:[email protected]
If you have more general questions about the project or the Center for Risk-Based Community Resilience Planning, please contact: Dr. John van de Lindt at 970-218-4076 or via email: [email protected].
A-25

Appendix 4C - Wave 3c Business Consent ScriptTwo-Year Post-Hurricane Matthew Field Study in Lumberton, North Carolina
Business Recovery Survey Consent Script
OMB CONTROL NO. 0693-0078 Expiration date: 07/31/2019
Hello, my name is (interviewer name) and I am a researcher from (name of university or National Institute of Standards and Technology) in the (department name/Engineering Laboratory). We are conducting a research study on recovery following the flooding that occurred in Lumberton, N.C. from Hurricane Matthew and Hurricane Florence. We would like to speak with you about how this event affected your business. In particular, we are interested in learning about the process of recovering from the flooding.
This study is part of a larger project led by Center of Excellence for Risk-Based Community Resilience Planning at Colorado State University. This project is led by Drs. John van de Lindt and Bruce Ellingwood, both Professors from the Civil and Environmental Engineering Department and is funded by the National Institute of Standards and Technology (NIST).
We would like to ask you some brief survey questions about your business’s experience after the flood as well as some details about your business during this time. Participation will take approximately fifteen minutes. Your participation is voluntary. If you decide to participate in the study, you may withdraw your consent and stop participation at any time without penalty.
We will be collecting information about the damage to your business, the repair process, and how the flood disrupted your business’s employees, supply chain, and revenues. When we report and share our findings, we will combine the data from all participants into summary statistics and tables so no unique individual or business can be identified. There are NO KNOWN RISKS or direct benefits to you. We hope to gain more knowledge on how you and others were affected by Hurricane Matthew and the flooding, so that we can learn from your experiences to help communities better prepare for similar events in the future.
So again, we would like to speak with an owner or manager of the business. Would that person be you and would you be willing to participate?
This collection of information contains Paperwork Reduction Act (PRA) requirements approved by the Office of Management and Budget (OMB). Notwithstanding any other provisions of the law, no person is required to respond to, nor shall any person be subject to a penalty for failure to comply with, a collection of information subject to the requirements of the PRA unless that collection of information displays a currently valid OMB control number. For this collection, the OMB Control number is:0693-0078 with an expiration date: July 31, 2019. Public reporting burden for this collection is estimated to be 15 minutes per survey, including the time for reviewing instructions, searching existing data sources, gathering and maintaining the data needed and completing and reviewing the collection of information. Send comments regarding this burden estimate or any aspect of this collection of information, including suggestions for reducing this burden, to the National Institute of Standards and Technology, Attn: Dr. Jennifer Helgeson, NIST, 100 Bureau Drive, MS 8603, Gaithersburg, MD 20899-1710, telephone 301-975-6133, or via email:[email protected].
A-26