MySQL Installation Guide. MySQL Downloading MySQL Installer.
Upload
mark-leithCategory
view
1.208download
0
Copyright © 2016, Oracle and/or its affiliates. All rights reserved.
MySQL SYS Schema Deep Dive
Mark Leith Senior Software Development Manager MySQL Enterprise Tools, Oracle

Copyright © 2014, Oracle and/or its affiliates. All rights reserved. |
Program Agenda
Introduction to the MySQL sys schema
Installation
Formatting / Helper Routines
Summary Views
Tracing Routines
1
2
3
4
5

Copyright © 2014, Oracle and/or its affiliates. All rights reserved. |
Program Agenda
Introduction to the MySQL sys schema
Installation
Formatting / Helper Routines
Summary Views
Tracing Routines
1
2
3
4
5

Copyright © 2014, Oracle and/or its affiliates. All rights reserved. |
Why the sys schema?
• Performance Schema exposes a huge amount of data • Many of its tables can implement multiple different use cases,
depending on the type of data • The sys schema layers on top the (sometimes complex) queries in to a
packaged set of easy to use views • It also adds a number of functions and procedures that help format,
configure the output of, and record, Performance Schema data • Implements many of the common day to day DBA and Developer
debugging and tuning use cases

Copyright © 2014, Oracle and/or its affiliates. All rights reserved. |
Program Agenda
Introduction to the MySQL sys schema
Installation
Formatting / Helper Routines
Summary Views
Tracing Routines
1
2
3
4
5

Copyright © 2014, Oracle and/or its affiliates. All rights reserved. |
Installation from the command line
• $ git clone https://github.com/mysql/mysql-sys.git /tmp/sys
• $ cd /tmp/sys • $ mysql -u user -p < sys_<version>.sql
<version> can be 56 or 57, for 5.6 and 5.7 respectively

Copyright © 2014, Oracle and/or its affiliates. All rights reserved. |
Installation from MySQL Workbench 6.1+

Copyright © 2014, Oracle and/or its affiliates. All rights reserved. |
Installation on the new MySQL 5.7 GA
• Do nothing other than install/mysql_upgrade it is there by default!
• You will be able to install future upgrades from the sys repository as you wish, no restrictions there
Copyright © 2014, Oracle and/or its affiliates. All rights reserved. |
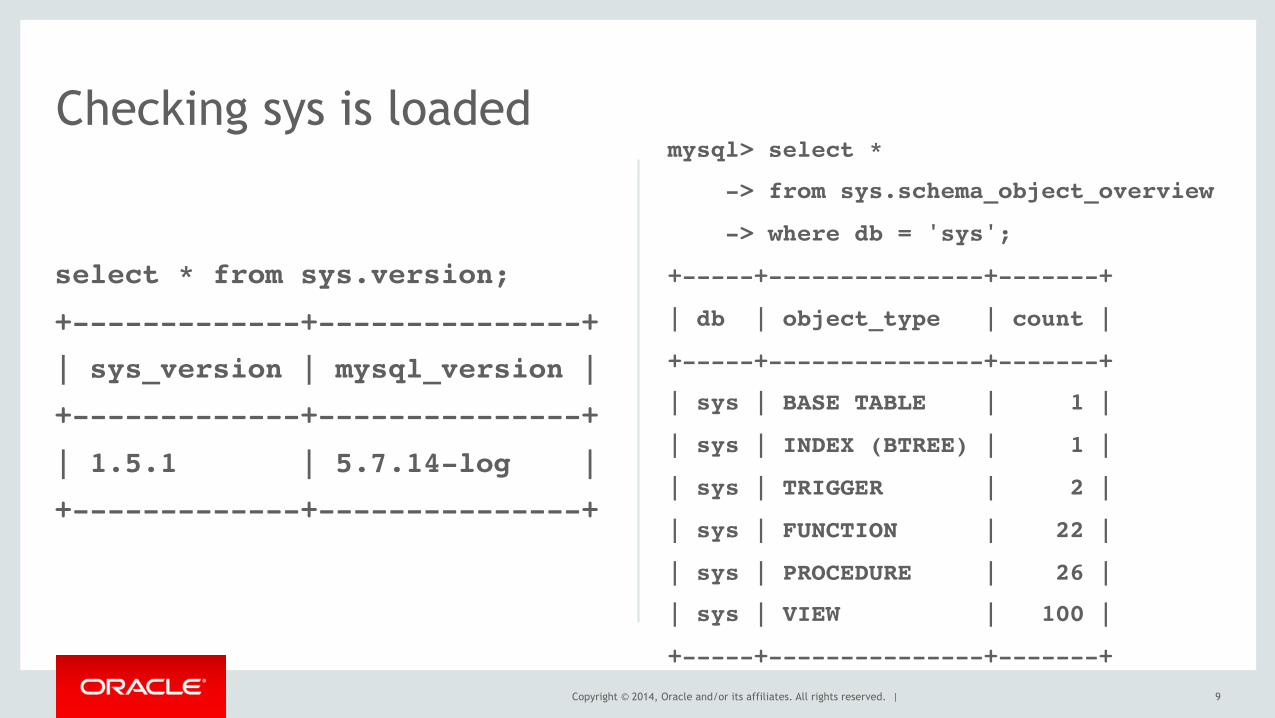
select * from sys.version;
+-------------+---------------+
| sys_version | mysql_version |
+-------------+---------------+
| 1.5.1 | 5.7.14-log |
+-------------+---------------+
9
Checking sys is loadedmysql> select *
-> from sys.schema_object_overview
-> where db = 'sys';
+-----+---------------+-------+
| db | object_type | count |
+-----+---------------+-------+
| sys | BASE TABLE | 1 |
| sys | INDEX (BTREE) | 1 |
| sys | TRIGGER | 2 |
| sys | FUNCTION | 22 |
| sys | PROCEDURE | 26 |
| sys | VIEW | 100 |
+-----+---------------+-------+

Copyright © 2014, Oracle and/or its affiliates. All rights reserved. |
Program Agenda
Introduction to the MySQL sys schema
Installation
Formatting / Helper Routines
Summary Views
Tracing Routines
1
3
2
4
5

Copyright © 2014, Oracle and/or its affiliates. All rights reserved. |
• Make output human readable • Format time appropriately • Format bytes appropriately • Truncate output for large
width values for CLI • Extract object names • Check instrumentation state
11
Formatting / Helper Functions
format_time format_bytes format_path format_statement
extract_table_from_file_name extract_schema_from_file_name
ps_is_account_enabled ps_is_consumer_enabled ps_is_instrument_default_enabled ps_is_instrument_default_timed ps_is_thread_instrumented

Copyright © 2014, Oracle and/or its affiliates. All rights reserved. |
format_time() function
mysql> select format_time(23849723429) as time -> union select format_time(8327423749233) -> union select format_time(83274237492335);+-------------+| time |+-------------+| 23.85 ms || 8.33 s || 00:01:23.27 |+-------------+

Copyright © 2014, Oracle and/or its affiliates. All rights reserved. |
format_bytes() function
mysql> select format_bytes(23423) as bytes -> union select format_bytes(23432423) -> union select format_bytes(42839479283) -> union select format_bytes(2293848203489);+-----------+| bytes |+-----------+| 22.87 KiB || 22.35 MiB || 39.90 GiB || 2.09 TiB |+-----------+

Copyright © 2014, Oracle and/or its affiliates. All rights reserved. |
Performance Schema Config Helper Procedures
• ps_setup_show_disabled() / ps_setup_show_enabled() • ps_setup_disable_thread() / ps_setup_enable_thread() • ps_setup_disable_background_threads() /
ps_setup_enable_background_threads() • ps_setup_disable_instrument() / ps_setup_enable_instrument() • ps_setup_disable_consumer() / ps_setup_enable_consumer() • ps_setup_save() / ps_setup_reload_saved() • ps_setup_reset_to_default() / ps_truncate_all_tables()

Copyright © 2014, Oracle and/or its affiliates. All rights reserved. |
Program Agenda
Introduction to the MySQL sys schema
Installation
Formatting / Helper Routines
Summary Views
Tracing Routines
1
4
2
3
5

Copyright © 2014, Oracle and/or its affiliates. All rights reserved. |
MySQL sys views
• Reference set of views solving various administrator use cases • Simple views, create/copy your own, sys is not “locked down”
• Build upon both performance_schema and INFORMATION_SCHEMA • Both formatted and raw views are available • All raw views are prefixed with x$ • Raw views are there for tools to poll
• Formatted views are for humans and the command line

Copyright © 2014, Oracle and/or its affiliates. All rights reserved. |
• High level user/host overviews • Breakdowns by: • IO usage • Stages • Statement details
• Following show users only
17
User / Host Summary Views
user_summary user_summary_by_file_io user_summary_by_file_io_type user_summary_by_stages user_summary_by_statement_latency user_summary_by_statement_type host_summary host_summary_by_file_io host_summary_by_file_io_type host_summary_by_stages host_summary_by_statement_latency host_summary_by_statement_type
Copyright © 2014, Oracle and/or its affiliates. All rights reserved. |
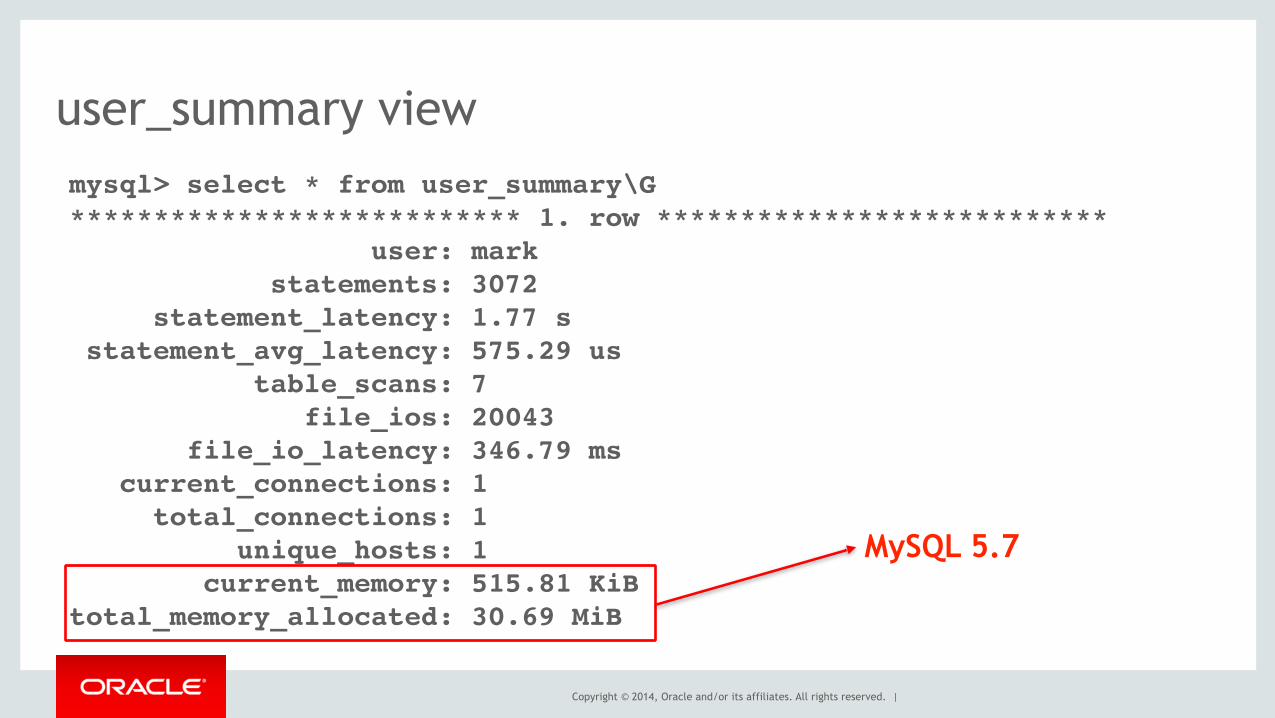
user_summary viewmysql> select * from user_summary\G*************************** 1. row *************************** user: mark statements: 3072 statement_latency: 1.77 s statement_avg_latency: 575.29 us table_scans: 7 file_ios: 20043 file_io_latency: 346.79 ms current_connections: 1 total_connections: 1 unique_hosts: 1 current_memory: 515.81 KiBtotal_memory_allocated: 30.69 MiB
MySQL 5.7

Copyright © 2014, Oracle and/or its affiliates. All rights reserved. |
user_summary_by_file_io_type view
mysql> select * from user_summary_by_file_io_type;+------+--------------------------------------+---------+-------------+-------------+| user | event_name | total | latency | max_latency |+------+--------------------------------------+---------+-------------+-------------+| mark | wait/io/file/myisam/dfile | 19540 | 215.20 ms | 120.79 ms || mark | wait/io/file/myisam/kfile | 501 | 131.58 ms | 57.74 ms || mark | wait/io/file/sql/dbopt | 2 | 17.29 us | 9.17 us || root | wait/io/file/innodb/innodb_log_file | 2079432 | 00:28:27.62 | 1.30 s || root | wait/io/file/myisam/kfile | 5195927 | 00:17:07.33 | 1.17 s || root | wait/io/file/myisam/dfile | 1533813 | 00:07:27.59 | 1.18 s || root | wait/io/file/sql/binlog | 3517008 | 00:03:07.34 | 1.42 s || root | wait/io/file/innodb/innodb_data_file | 20720 | 00:02:37.81 | 492.23 ms || root | wait/io/file/sql/FRM | 41412 | 3.17 s | 80.43 ms || root | wait/io/file/sql/dbopt | 110993 | 1.23 s | 63.27 ms |

Copyright © 2014, Oracle and/or its affiliates. All rights reserved. |
user_summary_by_statement_latency view
mysql> select * from user_summary_by_statement_latency\G*************************** 1. row *************************** user: mark total: 176total_latency: 1.26 s max_latency: 583.33 ms lock_latency: 216.95 ms rows_sent: 311rows_examined: 307rows_affected: 0 full_scans: 7

Copyright © 2014, Oracle and/or its affiliates. All rights reserved. |
user_summary_by_statement_type view
mysql> select * from user_summary_by_statement_type\G*************************** 1. row *************************** user: mark statement: commit total: 2463190total_latency: 13.33h max_latency: 12.18 s lock_latency: 0 ps rows_sent: 0rows_examined: 0rows_affected: 0 full_scans: 0

Copyright © 2014, Oracle and/or its affiliates. All rights reserved. |
• IO by current threads • Global summaries by file and
class, aggregating by bytes or latency
• Stream of last file IO events in raw form
22
IO Summary Views
io_by_thread_by_latency io_global_by_file_by_bytes io_global_by_file_by_latency io_global_by_wait_by_bytes io_global_by_wait_by_latency

Copyright © 2014, Oracle and/or its affiliates. All rights reserved. |
io_by_thread_by_latency viewmysql> select * from io_by_thread_by_latency\G*************************** 1. row *************************** user: main total: 1193 total_latency: 136.45 ms min_latency: 731.38 ns avg_latency: 269.99 us max_latency: 20.72 ms thread_id: 1processlist_id: NULL*************************** 2. row *************************** user: root@localhost total: 533 total_latency: 53.81 ms min_latency: 780.39 ns avg_latency: 8.41 ms max_latency: 25.06 ms thread_id: 23processlist_id: 4

Copyright © 2014, Oracle and/or its affiliates. All rights reserved. |
io_global_by_file_by_latency view
mysql> select * from io_global_by_file_by_latency limit 1\G*************************** 1. row *************************** file: @@datadir/ibdata1 total: 1395714total_latency: 00:28:53.06 count_read: 1006 read_latency: 4.51 s count_write: 1326529write_latency: 33.39 s count_misc: 68179 misc_latency: 00:28:15.16

Copyright © 2014, Oracle and/or its affiliates. All rights reserved. |
latest_file_io viewmysql> select * from latest_file_io;+-----------------------------+----------------------------------+-----------+-----------+-----------+| thread | file | latency | operation | requested |+-----------------------------+----------------------------------+-----------+-----------+-----------+| root@localhost:63153:179371 | @@datadir/ib_logfile1 | 7.16 us | lock | NULL || root@localhost:63153:179371 | @@datadir/ib_logfile1 | 6.16 us | write | 1.50 KiB || root@localhost:63153:179371 | @@datadir/ib_logfile1 | 14.36 ms | sync | NULL || root@localhost:63153:179371 | @@datadir/cerberus-bin.000012 | 28.25 us | write | 905 bytes || root@localhost:63177:179394 | @@datadir/ib_logfile1 | 15.25 us | write | 1.00 KiB || root@localhost:57487:3 | @@datadir/cerberus-bin.000012 | 32.12 us | read | 905 bytes || root@localhost:63177:179394 | @@datadir/ib_logfile1 | 6.65 us | write | 1.00 KiB || root@localhost:63177:179394 | @@datadir/ib_logfile1 | 213.32 us | sync | NULL || root@localhost:63177:179394 | @@datadir/ib_logfile1 | 17.27 us | write | 1.00 KiB || root@localhost:63177:179394 | @@datadir/ib_logfile1 | 286.01 us | sync | NULL || root@localhost:63177:179394 | @@datadir/cerberus-bin.000012 | 18.77 us | write | 601 bytes || root@localhost:57487:3 | @@datadir/cerberus-bin.000012 | 7.55 us | read | 601 bytes || root@localhost:63177:179394 | @@datadir/ib_logfile1 | 10.67 us | write | 1.00 KiB || root@localhost:63177:179394 | @@datadir/ib_logfile1 | 200.28 us | sync | NULL || root@localhost:63177:179394 | @@datadir/cerberus-bin.000012 | 12.91 us | write | 601 bytes || root@localhost:57487:3 | @@datadir/cerberus-bin.000012 | 6.47 us | read | 601 bytes || root@localhost:63177:179394 | @@datadir/ib_logfile1 | 9.22 us | write | 1.50 KiB |……

Copyright © 2014, Oracle and/or its affiliates. All rights reserved. |
• Object overview • Table usage statistics • Index usage statistics • Following show users only
26
Schema Analysis Views
schema_index_statistics schema_object_overview schema_table_statistics schema_table_statistics_with_buffer schema_tables_with_full_table_scans schema_unused_indexes

Copyright © 2014, Oracle and/or its affiliates. All rights reserved. |
schema_table_statistics viewmysql> select * from schema_table_statistics limit 1\G*************************** 1. row *************************** table_schema: mem__quan table_name: normalized_statements_by_server_by_schema_data total_latency: 00:55:07.80 rows_fetched: 239685 fetch_latency: 17.10 s rows_inserted: 1102895 insert_latency: 00:52:18.10 rows_updated: 55910 update_latency: 00:02:28.62 rows_deleted: 17899 delete_latency: 3.98 s
io_read_requests: 20639 io_read: 324.94 MiB io_read_latency: 00:03:04.10io_write_requests: 1965973 io_write: 40.36 GiB io_write_latency: 25.46 s io_misc_requests: 18217 io_misc_latency: 00:14:06.02

Copyright © 2014, Oracle and/or its affiliates. All rights reserved. |
schema_index_statistics view
mysql> select * from schema_index_statistics limit 1\G*************************** 1. row *************************** table_schema: mem__inventory table_name: mysqlconnectionconfiguration index_name: PRIMARY rows_selected: 131399select_latency: 00:07:05.03 rows_inserted: 0insert_latency: 0 ps rows_updated: 41608update_latency: 21.96 s rows_deleted: 0delete_latency: 0 ps

Copyright © 2014, Oracle and/or its affiliates. All rights reserved. |
schema_tables_with_full_table_scans view
mysql> select * from schema_tables_with_full_table_scans limit 10;+--------------------+--------------------------------+-------------------+-----------+| object_schema | object_name | rows_full_scanned | latency |+--------------------+--------------------------------+-------------------+-----------+| mem30__instruments | fsstatistics | 10207042 | 13.10 s || mem30__instruments | preparedstatementapidata | 436428 | 973.27 ms || mem30__instruments | mysqlprocessactivity | 411702 | 282.07 ms || mem30__instruments | querycachequeriesincachedata | 374011 | 767.15 ms || mem30__instruments | rowaccessesdata | 322321 | 1.55 s || mem30__instruments | connectionsmaxdata | 301242 | 857.63 ms || mem30__instruments | innodbdatadictionarymemorydata | 292564 | 495.38 ms || mem30__instruments | innodbbufferpooldata | 277112 | 1.95 s || mem30__instruments | avgrowaccessesdata | 269236 | 1.25 s || mem30__instruments | innodbrowdetailsdata | 248208 | 653.25 ms |+--------------------+--------------------------------+-------------------+-----------+

Copyright © 2014, Oracle and/or its affiliates. All rights reserved. |
schema_unused_indexes view
mysql> select * from schema_unused_indexes limit 10;+--------------------+-----------------------------------+--------------------+| object_schema | object_name | index_name |+--------------------+-----------------------------------+--------------------+| mem30__bean_config | plists | path || mem30__config | group_selections | name || mem30__config | notification_groups | name || mem30__config | user_form_defaults | FKC1AEF1F9E7EE2CFB || mem30__enterprise | whats_new_entries | entryId || mem30__events | action_logs | policyId || mem30__events | action_logs | eventId || mem30__events | action_logs | ts || mem30__events | advisor_scopes_advisorcategoryids | FKF0CB0DB962CAB4 || mem30__events | advisor_scopes_advisorclassids | FK650AF1BF962CAB4 |+--------------------+-----------------------------------+--------------------+
You should ensure you have representative time frame before taking any actions!

Copyright © 2014, Oracle and/or its affiliates. All rights reserved. |
• Wait summaries by class • Wait details per: • User • Host • Globally
31
Wait Analysis Views
wait_classes_global_by_avg_latency wait_classes_global_by_latency waits_by_host_by_latency waits_by_user_by_latency waits_global_by_latency
Copyright © 2014, Oracle and/or its affiliates. All rights reserved. |
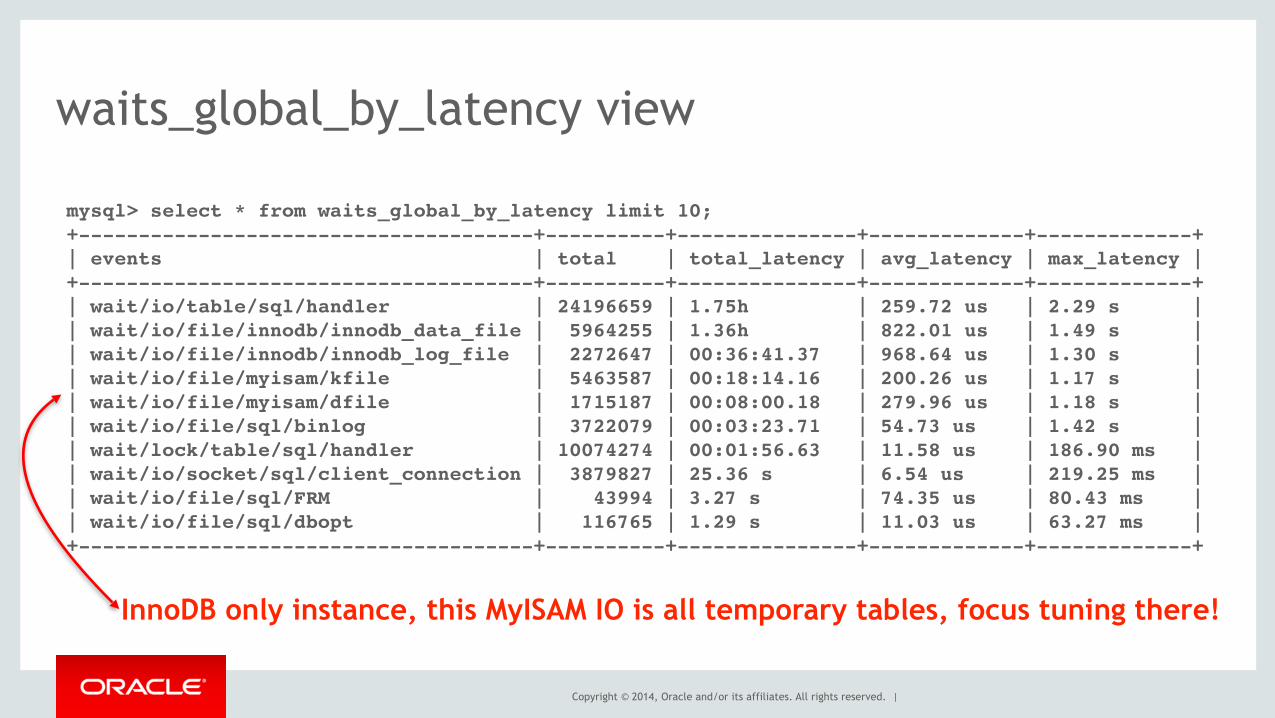
waits_global_by_latency view
mysql> select * from waits_global_by_latency limit 10;+--------------------------------------+----------+---------------+-------------+-------------+| events | total | total_latency | avg_latency | max_latency |+--------------------------------------+----------+---------------+-------------+-------------+| wait/io/table/sql/handler | 24196659 | 1.75h | 259.72 us | 2.29 s || wait/io/file/innodb/innodb_data_file | 5964255 | 1.36h | 822.01 us | 1.49 s || wait/io/file/innodb/innodb_log_file | 2272647 | 00:36:41.37 | 968.64 us | 1.30 s || wait/io/file/myisam/kfile | 5463587 | 00:18:14.16 | 200.26 us | 1.17 s || wait/io/file/myisam/dfile | 1715187 | 00:08:00.18 | 279.96 us | 1.18 s || wait/io/file/sql/binlog | 3722079 | 00:03:23.71 | 54.73 us | 1.42 s || wait/lock/table/sql/handler | 10074274 | 00:01:56.63 | 11.58 us | 186.90 ms || wait/io/socket/sql/client_connection | 3879827 | 25.36 s | 6.54 us | 219.25 ms || wait/io/file/sql/FRM | 43994 | 3.27 s | 74.35 us | 80.43 ms || wait/io/file/sql/dbopt | 116765 | 1.29 s | 11.03 us | 63.27 ms |+--------------------------------------+----------+---------------+-------------+-------------+
InnoDB only instance, this MyISAM IO is all temporary tables, focus tuning there!

Copyright © 2014, Oracle and/or its affiliates. All rights reserved. |
waits_by_user_by_latency view
mysql> select * from waits_by_user_by_latency;+------+--------------------------------------+----------+---------------+-------------+-------------+| user | event | total | total_latency | avg_latency | max_latency |+------+--------------------------------------+----------+---------------+-------------+-------------+| mark | wait/io/file/myisam/dfile | 19540 | 215.20 ms | 11.01 us | 120.79 ms || mark | wait/io/file/myisam/kfile | 501 | 131.58 ms | 262.63 us | 57.74 ms || mark | wait/io/file/sql/dbopt | 2 | 17.29 us | 8.64 us | 9.17 us || root | wait/io/table/sql/handler | 24189319 | 1.74h | 258.77 us | 2.29 s || root | wait/io/file/innodb/innodb_log_file | 2162650 | 00:30:52.87 | 856.76 us | 1.30 s || root | wait/io/file/myisam/kfile | 5460992 | 00:18:12.83 | 200.11 us | 1.17 s || root | wait/io/file/myisam/dfile | 1694624 | 00:07:59.50 | 282.95 us | 1.18 s || root | wait/io/file/sql/binlog | 3711637 | 00:03:23.16 | 54.74 us | 1.42 s || root | wait/io/file/innodb/innodb_data_file | 22577 | 00:03:05.73 | 8.23 ms | 492.23 ms || root | wait/lock/table/sql/handler | 10069000 | 00:01:56.59 | 11.58 us | 186.90 ms |……
root is doing the most temporary table IO

Copyright © 2014, Oracle and/or its affiliates. All rights reserved. |
• Table Metadata Lock Waits • InnoDB Row Lock Waits
34
Lock Wait Views
schema_table_lock_waits innodb_lock_waits

Copyright © 2014, Oracle and/or its affiliates. All rights reserved. |
sys.schema_table_lock_waitsmysql> select * from sys.schema_table_lock_waits\G*************************** 1. row *************************** object_schema: test object_name: t waiting_thread_id: 43 waiting_pid: 21 waiting_account: msandbox@localhost waiting_lock_type: SHARED_UPGRADABLE waiting_lock_duration: TRANSACTION waiting_query: alter table test.t add foo int waiting_query_secs: 988 waiting_query_rows_affected: 0 waiting_query_rows_examined: 0 blocking_thread_id: 42 blocking_pid: 20 blocking_account: msandbox@localhost blocking_lock_type: SHARED_NO_READ_WRITE blocking_lock_duration: TRANSACTION sql_kill_blocking_query: KILL QUERY 20sql_kill_blocking_connection: KILL 20

Copyright © 2014, Oracle and/or its affiliates. All rights reserved. |
sys.innodb_lock_waitsmysql> SELECT * FROM sys.innodb_lock_waits\G*************************** 1. row *************************** wait_started: 2014-11-11 13:39:20 wait_age: 00:00:07 wait_age_secs: 7 locked_table: `db1`.`t1` locked_index: PRIMARY locked_type: RECORD waiting_trx_id: 867158 waiting_trx_started: 2014-11-11 13:39:15 waiting_trx_age: 00:00:12 waiting_trx_rows_locked: 0 waiting_trx_rows_modified: 0 waiting_pid: 3 waiting_query: UPDATE t1 SET val = val + 1 WHERE id = 2 waiting_lock_id: 867158:2363:3:3 waiting_lock_mode: X blocking_trx_id: 867157 blocking_pid: 4 ...
blocking_query: UPDATE t1 SET val … blocking_lock_id: 867157:2363:3:3 blocking_lock_mode: X blocking_trx_started: 2014-11-11 13:39:11 blocking_trx_age: 00:00:16 blocking_trx_rows_locked: 1 blocking_trx_rows_modified: 1 sql_kill_blocking_query: KILL QUERY 4sql_kill_blocking_connection: KILL 4

Copyright © 2014, Oracle and/or its affiliates. All rights reserved. |
• Statement overview • Find statements by: • Those with errors • Those with full table scans • Those creating temp tables • Those that cause sorting • With latency in 95th %ile
37
Statement Analysis Views
statement_analysis statements_with_errors_or_warnings statements_with_full_table_scans statements_with_runtimes_in_95th_percentile statements_with_sorting statements_with_temp_tables

Copyright © 2014, Oracle and/or its affiliates. All rights reserved. |
statement_analysis viewmysql> select * from statement_analysis limit 2\G*************************** 1. row *************************** query: INSERT INTO `mem30__quan` . `n ... nDuration` = IF ( VALUES ( ... db: mem full_scan: exec_count: 4657 err_count: 0 warn_count: 0 total_latency: 00:03:57.40 max_latency: 10.54 s avg_latency: 50.98 ms lock_latency: 00:03:00.93 rows_sent: 0 rows_sent_avg: 0 rows_examined: 0rows_examined_avg: 0 rows_affected: 4794rows_affected_avg: 1
tmp_tables: 0 tmp_disk_tables: 0 rows_sorted: 0sort_merge_passes: 0 digest: b98bfe333642e8e4e72c73515810d865 first_seen: 2014-09-24 11:27:01 last_seen: 2014-09-24 11:53:00

Copyright © 2014, Oracle and/or its affiliates. All rights reserved. |
statements_with_errors_or_warnings view
mysql> select * from statements_with_errors_or_warnings limit 1\G*************************** 1. row *************************** query: CREATE TEMPORARY TABLE IF NOT ... _logs` ( `id` INT8 NOT NULL ) db: mem exec_count: 1725 errors: 1725 error_pct: 100.0000 warnings: 0warning_pct: 0.0000 first_seen: 2014-05-20 10:42:32 last_seen: 2014-05-21 18:39:22 digest: 51fb979dbc3910a6294c7cdabd7839c3

Copyright © 2014, Oracle and/or its affiliates. All rights reserved. |
statements_with_temp_tables view
mysql> select * from statements_with_temp_tables limit 1\G*************************** 1. row *************************** query: SELECT * FROM ( SELECT `digest ... ` , `sum_no_index_used` AS ... db: mysql exec_count: 68 total_latency: 2.31 s memory_tmp_tables: 476 disk_tmp_tables: 204avg_tmp_tables_per_query: 7 tmp_tables_to_disk_pct: 43 first_seen: 2014-09-24 11:26:18 last_seen: 2014-09-24 12:33:00 digest: 50761c6a1818824328745d8a136b9ed6

Copyright © 2014, Oracle and/or its affiliates. All rights reserved. |
statements_with_full_table_scans viewmysql> select * from statements_with_full_table_scans limit 1\G*************************** 1. row *************************** query: SELECT `pojotimese0_` . `id` A ... ty_timeseries` `pojotimese0_` db: mem exec_count: 1 total_latency: 940.89 us no_index_used_count: 1no_good_index_used_count: 0 no_index_used_pct: 100 rows_sent: 116 rows_examined: 116 rows_sent_avg: 116 rows_examined_avg: 116 first_seen: 2014-09-24 11:25:03 last_seen: 2014-09-24 11:25:03 digest: f81b5ce10baee9be754cf35fd245a516
Copyright © 2014, Oracle and/or its affiliates. All rights reserved. |
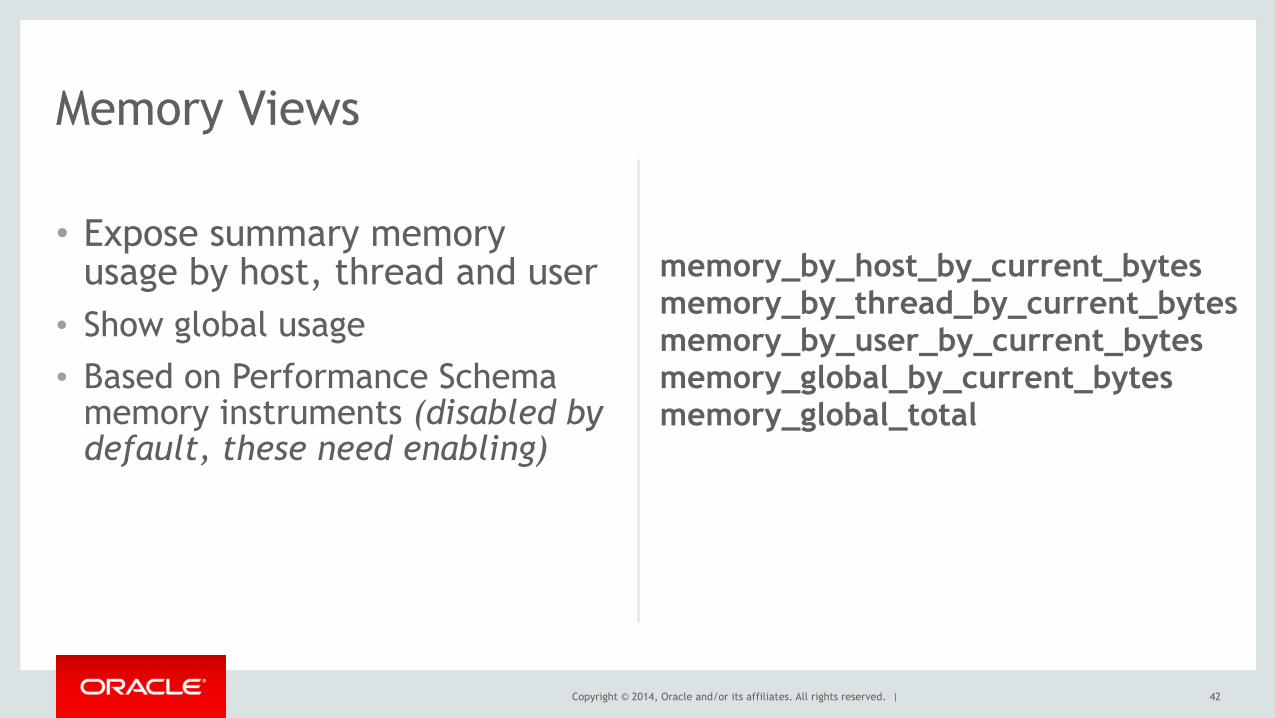
• Expose summary memory usage by host, thread and user
• Show global usage
• Based on Performance Schema memory instruments (disabled by default, these need enabling)
42
Memory Views
memory_by_host_by_current_bytes memory_by_thread_by_current_bytes memory_by_user_by_current_bytes memory_global_by_current_bytes memory_global_total

Copyright © 2014, Oracle and/or its affiliates. All rights reserved. |
memory_global_by_current_bytes view
mysql> select * from sys.memory_global_by_current_bytes limit 5\G*************************** 1. row *************************** event_name: memory/innodb/buf_buf_pool current_count: 6 current_alloc: 785.62 MiBcurrent_avg_alloc: 130.94 MiB high_count: 6 high_alloc: 785.62 MiB high_avg_alloc: 130.94 MiB*************************** 2. row *************************** event_name: memory/innodb/os0file current_count: 431 current_alloc: 52.51 MiBcurrent_avg_alloc: 124.76 KiB high_count: 434 …
InnoDB Buffer Pool
InnoDB file IO memory usage (various)

Copyright © 2014, Oracle and/or its affiliates. All rights reserved. |
memory_by_thread_by_current_bytes viewmysql> select * from sys.memory_by_thread_by_current_bytes -> where user not like 'innodb%' and user not like 'sql%';+-----------+----------------+--------------------+-------------------+-------------------+-------------------+-----------------+| thread_id | user | current_count_used | current_allocated | current_avg_alloc | current_max_alloc | total_allocated |+-----------+----------------+--------------------+-------------------+-------------------+-------------------+-----------------+| 176167 | root@localhost | 67 | 633.36 KiB | 9.45 KiB | 256.00 KiB | 246.06 MiB || 176220 | root@localhost | 67 | 246.73 KiB | 3.68 KiB | 73.46 KiB | 10.34 MiB || 176223 | root@localhost | 48 | 192.12 KiB | 4.00 KiB | 64.10 KiB | 1.03 MiB || 176221 | root@localhost | 49 | 180.79 KiB | 3.69 KiB | 64.10 KiB | 766.13 KiB || 176224 | root@localhost | 58 | 169.58 KiB | 2.92 KiB | 64.10 KiB | 4.26 MiB || 176225 | root@localhost | 83 | 159.06 KiB | 1.92 KiB | 64.10 KiB | 4.38 MiB || 176217 | root@localhost | 56 | 149.91 KiB | 2.68 KiB | 64.10 KiB | 5.75 MiB || 176226 | root@localhost | 68 | 148.90 KiB | 2.19 KiB | 64.10 KiB | 2.80 MiB || 176205 | root@localhost | 41 | 148.06 KiB | 3.61 KiB | 64.10 KiB | 5.08 MiB || 176204 | root@localhost | 51 | 143.25 KiB | 2.81 KiB | 64.10 KiB | 11.22 MiB || 176222 | root@localhost | 73 | 139.38 KiB | 1.91 KiB | 64.10 KiB | 1.46 MiB || 176201 | root@localhost | -33 | 122.04 KiB | -3787 bytes | 64.10 KiB | 14.55 MiB |
Note values can go negative if threads allocate memory, but pass it to another thread to be freed, this thread has freed memory from another thread

Copyright © 2014, Oracle and/or its affiliates. All rights reserved. |
• Better SHOW PROCESSLIST • No mutex contention • Live statistics for query
• Consolidated metrics
45
Miscellaneous Views
processlist session metrics

Copyright © 2014, Oracle and/or its affiliates. All rights reserved. |
processlist / session viewsmysql> select * from session\G*************************** 1. row *************************** thd_id: 7890 conn_id: 7870 user: root@localhost db: mem command: Query state: update time: 0 current_statement: /* mem dbpool.default */ inser ...<truncated> lock_latency: 0 ps rows_examined: 0 rows_sent: 0 rows_affected: 0 tmp_tables: 0
tmp_disk_tables: 0 full_scan: NO last_statement: NULLlast_statement_latency: NULL last_wait: wait/io/table/sql/handler last_wait_latency: Still Waiting source: handler.cc:7274

Copyright © 2014, Oracle and/or its affiliates. All rights reserved. |
sys.sessions progress estimationmysql> select * from sys.sessions\G*************************** 1. row *************************** thd_id: 44524 conn_id: 44502 user: msandbox@localhost db: test command: Query state: alter table (flush) time: 18 current_statement: alter table t1 add column g int statement_latency: 18.45 s progress: 98.84 lock_latency: 265.43 ms rows_examined: 0 rows_sent: 0 rows_affected: 0 tmp_tables: 0 tmp_disk_tables: 0 ...

Copyright © 2014, Oracle and/or its affiliates. All rights reserved. |
sys.metrics
mysql> select * from sys.metrics limit 199, 10;+-----------------------------+----------------+--------------------------------------+---------+| Variable_name | Variable_value | Type | Enabled |+-----------------------------+----------------+--------------------------------------+---------+| tc_log_page_waits | 0 | Global Status | YES || threads_cached | 7 | Global Status | YES || threads_connected | 3 | Global Status | YES || threads_created | 10 | Global Status | YES || threads_running | 3 | Global Status | YES || uptime | 275689 | Global Status | YES || uptime_since_flush_status | 275689 | Global Status | YES || adaptive_hash_pages_added | 0 | InnoDB Metrics - adaptive_hash_index | NO || adaptive_hash_pages_removed | 0 | InnoDB Metrics - adaptive_hash_index | NO || adaptive_hash_rows_added | 0 | InnoDB Metrics - adaptive_hash_index | NO |+-----------------------------+----------------+--------------------------------------+---------+
performance_schema.global_status
information_schema.innodb_metrics

Copyright © 2014, Oracle and/or its affiliates. All rights reserved. |
Program Agenda
Introduction to the MySQL sys schema
Installation
Formatting / Helper Routines
Summary Views
Tracing Routines
1
5
2
3
4

Copyright © 2014, Oracle and/or its affiliates. All rights reserved. |
• Dump all P_S data to a dot graph file to trace a thread
• Look in the statement history table to capture more info on a statement digest
• Show detailed transaction info • Dump as much diagnostics info
as possible (support enabler)
50
Statement Tracing Routines
ps_trace_thread ps_trace_statement_digest ps_thread_trx_info ps_thread_stack ps_statement_avg_latency_histogram diagnostics

Copyright © 2014, Oracle and/or its affiliates. All rights reserved. |
ps_trace_statement_digest procedure
• ps_trace_statement_digest() analyses live traffic looking for certain statement digest for a period of time • Captures statistics on each matching statement it finds • Returns a report of the captured stats • An overall summary • A break down for the longest running example • An EXPLAIN (if the statement is not truncated)

Copyright © 2014, Oracle and/or its affiliates. All rights reserved. |
ps_trace_statement_digest procedure
• ps_trace_statement_digest() parameters • in_digest The statement digest to analyse • in_runtime How long to run analysis for • in_interval How often to snapshot data • in_start_fresh Whether to truncate P_S tables first • in_auto_enable Whether to auto enable required config

Copyright © 2014, Oracle and/or its affiliates. All rights reserved. |
ps_trace_statement_digest procedure examplemysql> call ps_trace_statement_digest(‘6134e9d6f25eb8e6cddf11f6938f202a’, 60, 1, true, true); +--------------------+ | SUMMARY STATISTICS | +--------------------+ | SUMMARY STATISTICS | +--------------------+ 1 row in set (59.93 sec)
+------------+-----------+-----------+-----------+---------------+------------+------------+ | executions | exec_time | lock_time | rows_sent | rows_examined | tmp_tables | full_scans | +------------+-----------+-----------+-----------+---------------+------------+------------+ | 360 | 1.41 s | 138.39 ms | 720 | 0 | 0 | 0 | +------------+-----------+-----------+-----------+---------------+------------+------------+ 1 row in set (59.93 sec)
+--------------------------------+-------+-----------+ | event_name | count | latency | +--------------------------------+-------+-----------+ | stage/sql/Sending data | 14 | 1.10 s | | stage/sql/update | 198 | 667.34 ms | | stage/sql/removing tmp table | 9 | 240.48 ms | ...

Copyright © 2014, Oracle and/or its affiliates. All rights reserved. |
ps_trace_statement_digest procedure example+---------------------------+ | LONGEST RUNNING STATEMENT | +---------------------------+ | LONGEST RUNNING STATEMENT | +---------------------------+ 1 row in set (59.95 sec)
+-----------+-----------+-----------+-----------+---------------+------------+-----------+ | thread_id | exec_time | lock_time | rows_sent | rows_examined | tmp_tables | full_scan | +-----------+-----------+-----------+-----------+---------------+------------+-----------+ | 23277 | 77.64 ms | 97.00 us | 2 | 0 | 0 | 0 | +-----------+-----------+-----------+-----------+---------------+------------+-----------+ 1 row in set (59.95 sec)
+-------------------------------------------------------------------------------------------+ | sql_text | +-------------------------------------------------------------------------------------------+ | /* mem dbpool.default */ insert into `mem__quan`.`normalized_statements_by_server_by_schema` (firstSeen, lastSeen, normalized_statement_id, `schema`, server, id) values (1378983745000, 1378998600000, x'808ACEB88FC4B45BC47C4FE9D86C7F26', 'mem', '753c939e-1b99-11e3-b6d4-bc761a1f4f2f', x'7CFE81F98B1E3FE0895D1AA2C39B326D') ON DUPLICATE KEY UPDATE ... +-------------------------------------------------------------------------------------------+ ...

Copyright © 2014, Oracle and/or its affiliates. All rights reserved. |
ps_trace_statement_digest procedure example+--------------------------------+----------+ | event_name | latency | +--------------------------------+----------+ | stage/sql/init | 10.41 ms | | stage/sql/checking permissions | 2.35 us | | stage/sql/Opening tables | 10.32 us | | stage/sql/init | 13.53 us | | stage/sql/System lock | 3.66 us | | stage/sql/update | 61.74 ms | | stage/sql/end | 1.11 us | | stage/sql/query end | 1.31 us | | stage/sql/closing tables | 5.44 ms | | stage/sql/freeing items | 23.31 us | +--------------------------------+----------+ 10 rows in set (59.99 sec)
+----+-------------+-------+------+---------------+------+---------+------+------+----------------+ | id | select_type | table | type | possible_keys | key | key_len | ref | rows | Extra | +----+-------------+-------+------+---------------+------+---------+------+------+----------------+ | 1 | SIMPLE | NULL | NULL | NULL | NULL | NULL | NULL | NULL | No tables used | +----+-------------+-------+------+---------------+------+---------+------+------+----------------+ ...

Copyright © 2014, Oracle and/or its affiliates. All rights reserved. |
sys.ps_thread_trx_info(<thread_id>)SELECT sys.ps_thread_trx_info(48) as trx_info\G*************************** 1. row ***************************trx_info: [ { "time": "790.70 us", "state": "COMMITTED", "mode": "READ WRITE", "autocommitted": "NO", "gtid": "AUTOMATIC", "isolation": "REPEATABLE READ", "statements_executed": [ { "sql_text": "INSERT INTO info VALUES (1, 'foo')", "time": "471.02 us", "schema": "trx", "rows_examined": 0, "rows_affected": 1, "rows_sent": 0, "tmp_tables": 0, "tmp_disk_tables": 0, "sort_rows": 0, "sort_merge_passes": 0 }, ...
Pass in thread id

Copyright © 2014, Oracle and/or its affiliates. All rights reserved. |
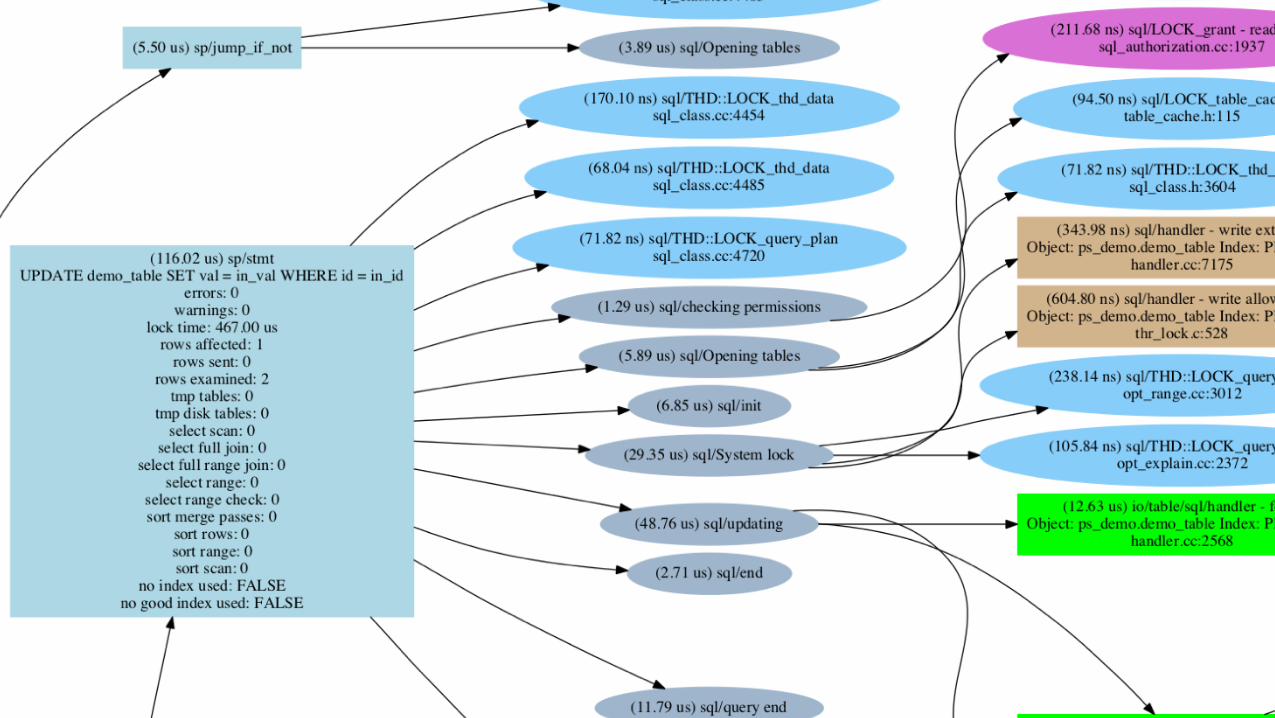
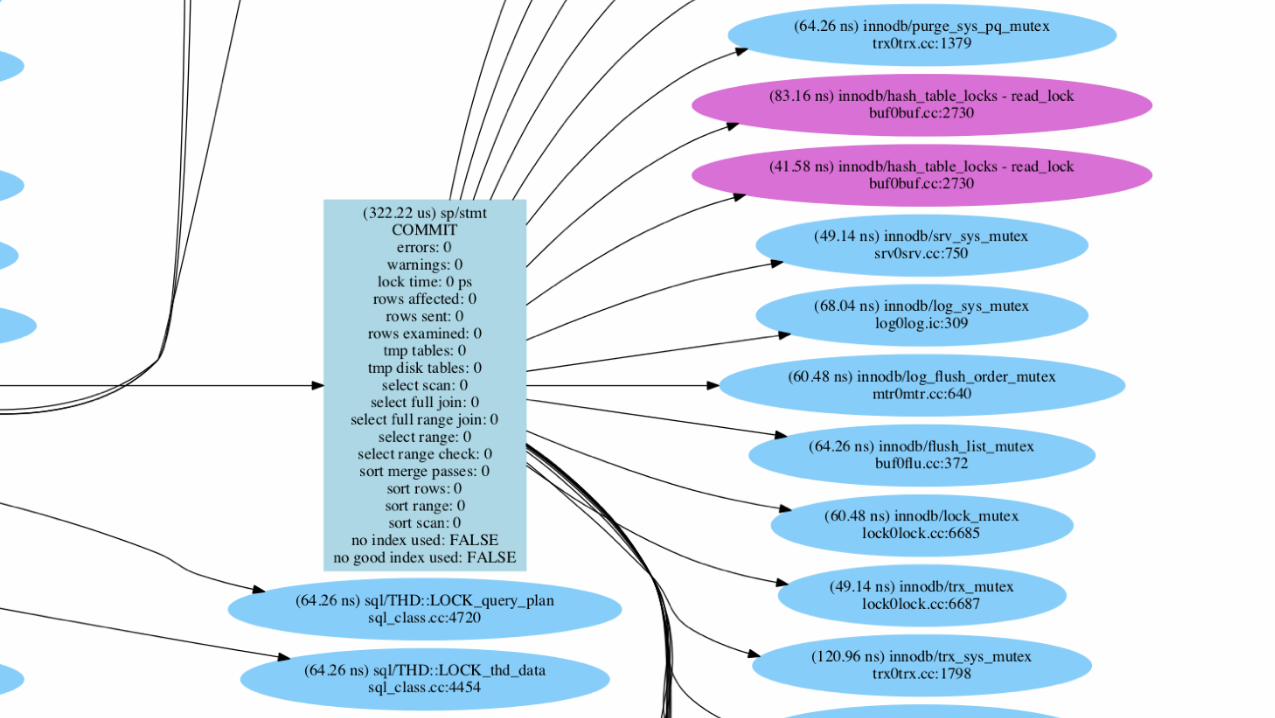
ps_trace_thread procedure
• ps_trace_thread() monitors a specific thread for a period • Captures as much information on the thread activity as possible • Returns a “dot” formatted file, that can graph the event hierarchy • http://en.wikipedia.org/wiki/DOT_(graph_description_language)

Copyright © 2014, Oracle and/or its affiliates. All rights reserved. |
ps_trace_thread procedure
• ps_trace_thread parameters • in_thread_id The thread to analyse • in_outfile The file to dump the data to (INTO OUTFILE) • in_max_runtime How long to run analysis for • in_interval How often to snapshot for data • in_start_fresh Whether to truncate P_S tables first • in_auto_setup Whether to auto enable required config • in_debug Whether to also print debug info (source info)

Copyright © 2014, Oracle and/or its affiliates. All rights reserved. |
ps_trace_thread procedure examplemysql> call ps_trace_thread(27768, '/tmp/stack_27768.dot', 60, 0.1, true, true, true); +------------------------------------------------+ | Info | +------------------------------------------------+ | Data collection starting for THREAD_ID = 27768 | +------------------------------------------------+ 1 row in set (4.82 sec)
+---------------------------------------------+ | Info | +---------------------------------------------+ | Stack trace written to /tmp/stack_27768.dot | +---------------------------------------------+ 1 row in set (60.90 sec)
+--------------------------------------------------------+ | Convert to PDF | +--------------------------------------------------------+ | dot -Tpdf -o /tmp/stack_27768.pdf /tmp/stack_27768.dot | +--------------------------------------------------------+ 1 row in set (60.90 sec)
+--------------------------------------------------------+ | Convert to PNG | +--------------------------------------------------------+ | dot -Tpng -o /tmp/stack_27768.png /tmp/stack_27768.dot | +--------------------------------------------------------+ 1 row in set (60.90 sec)+
Copyright © 2014, Oracle and/or its affiliates. All rights reserved. |
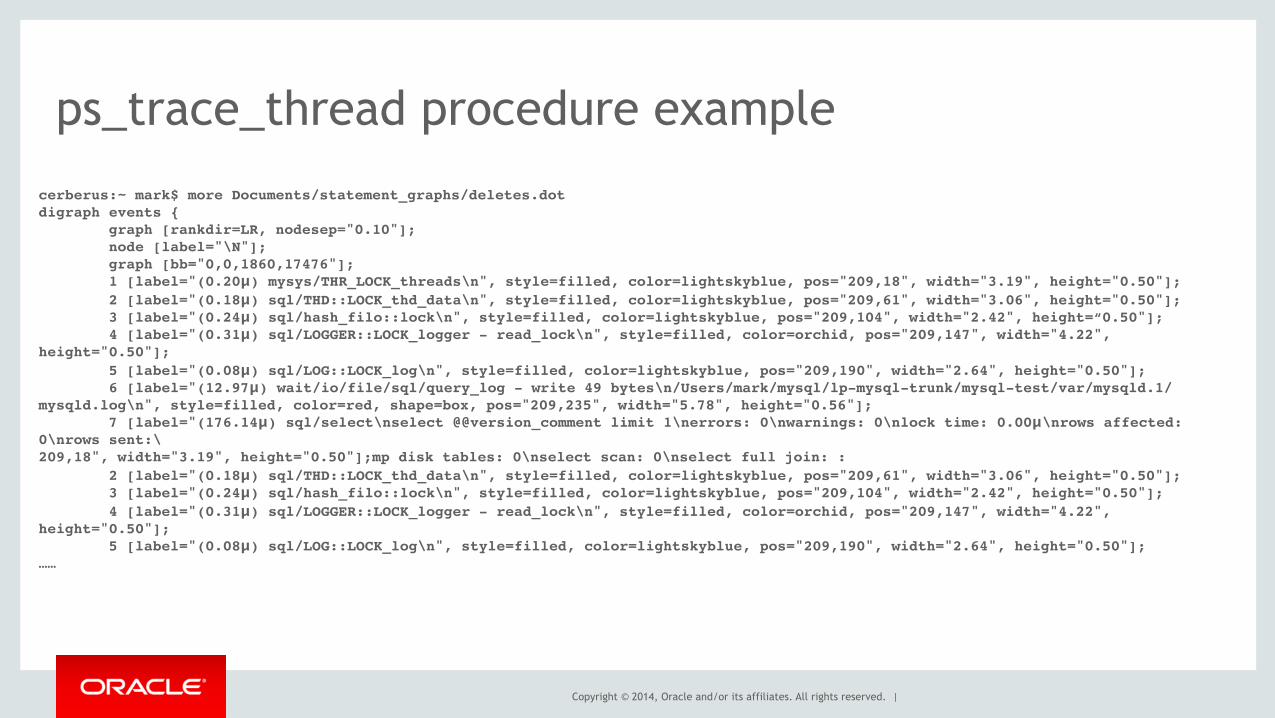
ps_trace_thread procedure example
cerberus:~ mark$ more Documents/statement_graphs/deletes.dotdigraph events { graph [rankdir=LR, nodesep="0.10"]; node [label="\N"]; graph [bb="0,0,1860,17476"]; 1 [label="(0.20μ) mysys/THR_LOCK_threads\n", style=filled, color=lightskyblue, pos="209,18", width="3.19", height="0.50"]; 2 [label="(0.18μ) sql/THD::LOCK_thd_data\n", style=filled, color=lightskyblue, pos="209,61", width="3.06", height="0.50"]; 3 [label="(0.24μ) sql/hash_filo::lock\n", style=filled, color=lightskyblue, pos="209,104", width="2.42", height=“0.50"]; 4 [label="(0.31μ) sql/LOGGER::LOCK_logger - read_lock\n", style=filled, color=orchid, pos="209,147", width="4.22", height="0.50"]; 5 [label="(0.08μ) sql/LOG::LOCK_log\n", style=filled, color=lightskyblue, pos="209,190", width="2.64", height="0.50"]; 6 [label="(12.97μ) wait/io/file/sql/query_log - write 49 bytes\n/Users/mark/mysql/lp-mysql-trunk/mysql-test/var/mysqld.1/mysqld.log\n", style=filled, color=red, shape=box, pos="209,235", width="5.78", height="0.56"]; 7 [label="(176.14μ) sql/select\nselect @@version_comment limit 1\nerrors: 0\nwarnings: 0\nlock time: 0.00μ\nrows affected: 0\nrows sent:\209,18", width="3.19", height="0.50"];mp disk tables: 0\nselect scan: 0\nselect full join: : 2 [label="(0.18μ) sql/THD::LOCK_thd_data\n", style=filled, color=lightskyblue, pos="209,61", width="3.06", height="0.50"]; 3 [label="(0.24μ) sql/hash_filo::lock\n", style=filled, color=lightskyblue, pos="209,104", width="2.42", height="0.50"]; 4 [label="(0.31μ) sql/LOGGER::LOCK_logger - read_lock\n", style=filled, color=orchid, pos="209,147", width="4.22", height="0.50"]; 5 [label="(0.08μ) sql/LOG::LOCK_log\n", style=filled, color=lightskyblue, pos="209,190", width="2.64", height="0.50"];……

Copyright © 2014, Oracle and/or its affiliates. All rights reserved. |
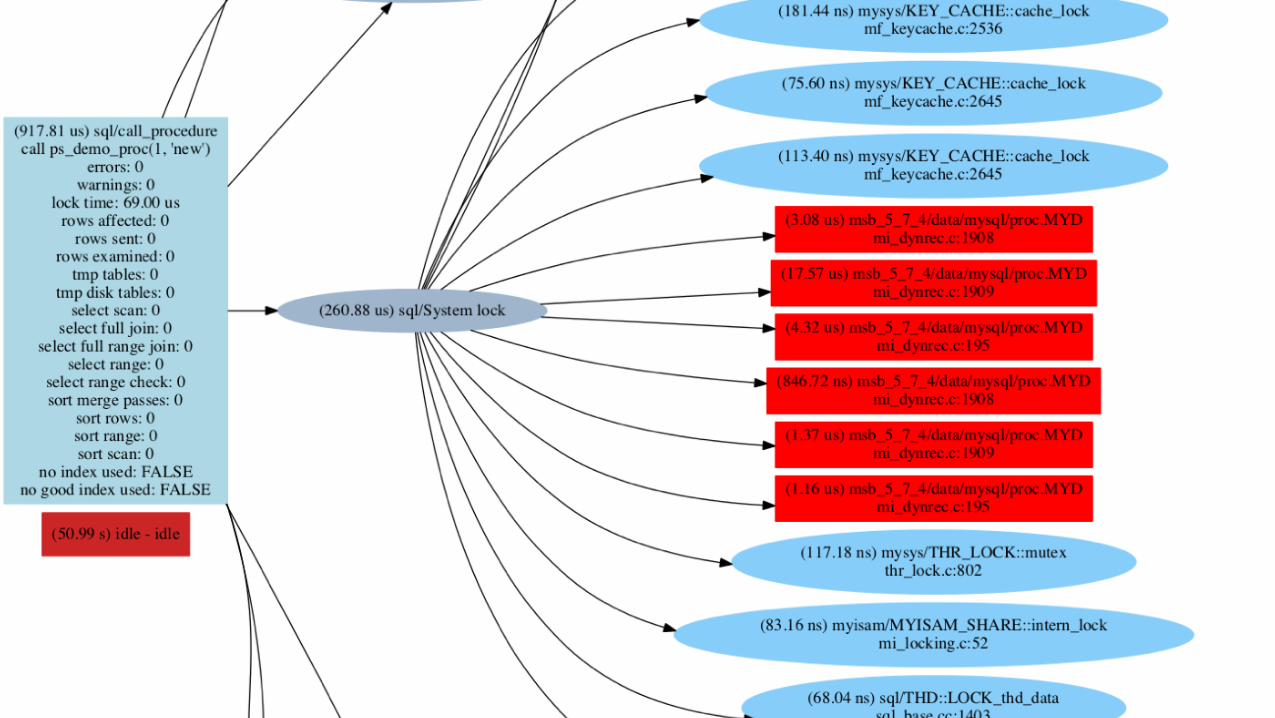
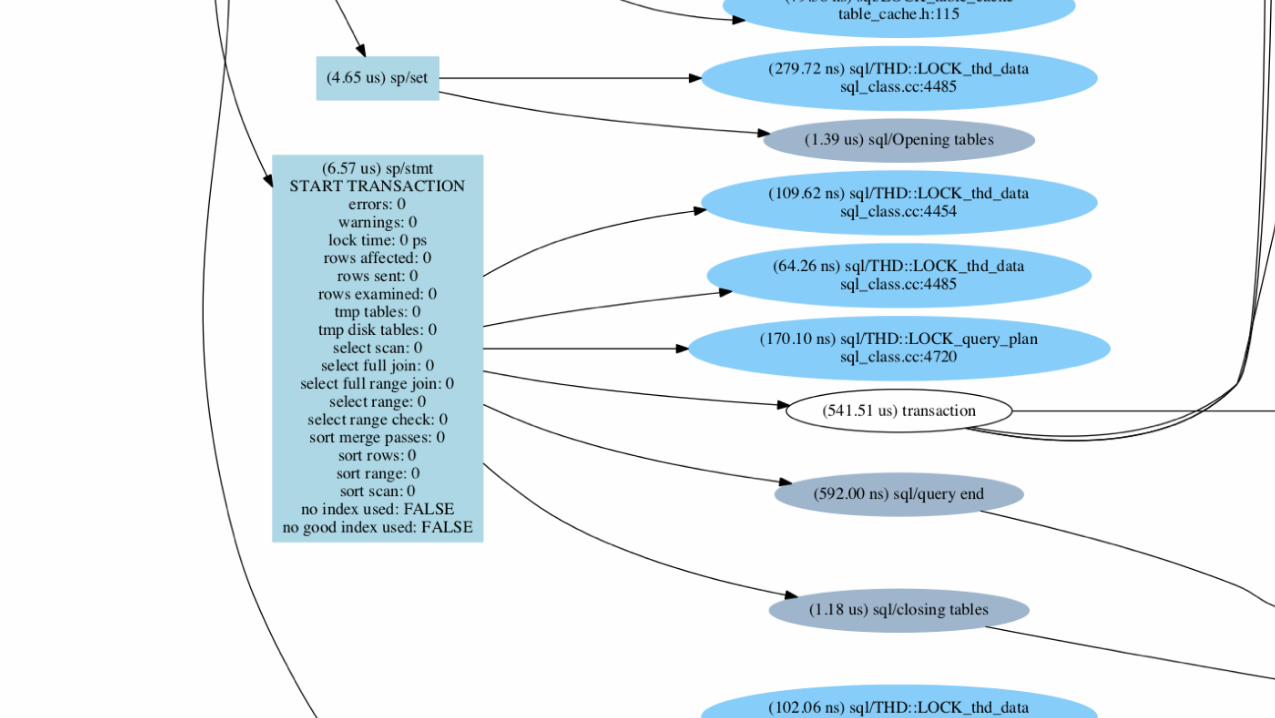
ps_trace_thread procedure example
MySQL 5.7
Procedures Transactions Statements Stages Waits
Copyright © 2014, Oracle and/or its affiliates. All rights reserved. |
Copyright © 2014, Oracle and/or its affiliates. All rights reserved. |

Copyright © 2014, Oracle and/or its affiliates. All rights reserved. |
Copyright © 2014, Oracle and/or its affiliates. All rights reserved. |
Copyright © 2014, Oracle and/or its affiliates. All rights reserved. |

Copyright © 2014, Oracle and/or its affiliates. All rights reserved. |

Copyright © 2014, Oracle and/or its affiliates. All rights reserved. |
Question time!

Copyright © 2014, Oracle and/or its affiliates. All rights reserved. |
Safe Harbor Statement
The preceding is intended to outline our general product direction. It is intended for information purposes only, and may not be incorporated into any contract. It is not a commitment to deliver any material, code, or functionality, and should not be relied upon in making purchasing decisions. The development, release, and timing of any features or functionality described for Oracle’s products remains at the sole discretion of Oracle.

Copyright © 2014, Oracle and/or its affiliates. All rights reserved. |