MySQL sys schema deep dive
67
Copyright © 2014, Oracle and/or its affiliates. All rights reserved. | MySQL SYS Schema Deep Dive Mark Leith Senior Software Development Manager MySQL Enterprise Tools, Oracle Copyright © 2014, Oracle and/or its affiliates. All rights reserved. |
-
Upload
mark-leith -
Category
Technology
-
view
8.081 -
download
0
Transcript of MySQL sys schema deep dive

Copyright © 2014, Oracle and/or its affiliates. All rights reserved. |
MySQL SYS Schema Deep Dive
Mark Leith Senior Software Development Manager MySQL Enterprise Tools, Oracle
Copyright © 2014, Oracle and/or its affiliates. All rights reserved. |

Copyright © 2014, Oracle and/or its affiliates. All rights reserved. |
Program Agenda
Introduction to the MySQL sys schema
Installation
Formatting / Helper Routines
Tracing Routines
Summary Views
1
2
3
4
5

Copyright © 2014, Oracle and/or its affiliates. All rights reserved. |
Program Agenda
Introduction to the MySQL sys schema
Installation
Formatting / Helper Routines
Tracing Routines
Summary Views
1
2
3
4
5

Copyright © 2014, Oracle and/or its affiliates. All rights reserved. |
You are … :
• Using 5.1? • Using 5.5? • Using 5.6? • Using 5.7? • A Performance Schema user? • A Sys Schema user?

Copyright © 2014, Oracle and/or its affiliates. All rights reserved. |
Why the sys schema?
• Performance Schema exposes a huge amount of data • Many of its tables can implement multiple different use cases,
depending on the type of data • The sys schema layers on top the (sometimes complex) queries in to
a packaged set of easy to use views • It also adds a number of functions and procedures that help format,
configure the output of, and record, Performance Schema data • Implements many of the common day to day DBA and Developer
debugging and tuning use cases

Copyright © 2014, Oracle and/or its affiliates. All rights reserved. |
Program Agenda
Introduction to the MySQL sys schema
Installation
Formatting / Helper Routines
Tracing Routines
Summary Views
1
2
3
4
5

Copyright © 2014, Oracle and/or its affiliates. All rights reserved. |
Installation from the command line
• $ git clone https://github.com/MarkLeith/mysql-sys.git /tmp/sys
• $ cd /tmp/sys • $ mysql -u user -p < sys_<version>.sql
<version> can be 56 or 57, for 5.6 and 5.7 respectively

Copyright © 2014, Oracle and/or its affiliates. All rights reserved. |
Installation from MySQL Workbench 6.1+

Copyright © 2014, Oracle and/or its affiliates. All rights reserved. |
Installation on the new MySQL 5.7 GA
• Do nothing other than install/mysql_upgrade it is there by default!
• You will be able to install future upgrades from the sys repository as you wish, no restrictions there

Copyright © 2014, Oracle and/or its affiliates. All rights reserved. |
select * from sys.version;
+-------------+---------------+
| sys_version | mysql_version |
+-------------+---------------+
| 1.5.0 | 5.7.9 |
+-------------+---------------+
10
Checking sys is loadedmysql> select *
-> from sys.schema_object_overview
-> where db = 'sys';
+-----+---------------+-------+
| db | object_type | count |
+-----+---------------+-------+
| sys | BASE TABLE | 1 |
| sys | INDEX (BTREE) | 1 |
| sys | TRIGGER | 2 |
| sys | FUNCTION | 21 |
| sys | PROCEDURE | 26 |
| sys | VIEW | 100 |
+-----+---------------+-------+

Copyright © 2014, Oracle and/or its affiliates. All rights reserved. |
Program Agenda
Introduction to the MySQL sys schema
Installation
Formatting / Helper Routines
Tracing Routines
Summary Views
1
3
2
4
5

Copyright © 2014, Oracle and/or its affiliates. All rights reserved. |
• Make output human readable • Format time appropriately • Format bytes appropriately • Truncate output for large
width values for CLI • Extract object names • Check instrumentation state
12
Formatting / Helper Functions
format_time format_bytes format_path format_statement
extract_table_from_file_name extract_schema_from_file_name
ps_is_account_enabled ps_is_consumer_enabled ps_is_instrument_default_enabled ps_is_instrument_default_timed ps_is_thread_instrumented

Copyright © 2014, Oracle and/or its affiliates. All rights reserved. |
format_time() function
mysql> select format_time(23849723429) as time -> union select format_time(8327423749233) -> union select format_time(83274237492335);+-------------+| time |+-------------+| 23.85 ms || 8.33 s || 00:01:23.27 |+-------------+

Copyright © 2014, Oracle and/or its affiliates. All rights reserved. |
format_bytes() function
mysql> select format_bytes(23423) as bytes -> union select format_bytes(23432423) -> union select format_bytes(42839479283) -> union select format_bytes(2293848203489);+-----------+| bytes |+-----------+| 22.87 KiB || 22.35 MiB || 39.90 GiB || 2.09 TiB |+-----------+
Copyright © 2014, Oracle and/or its affiliates. All rights reserved. |
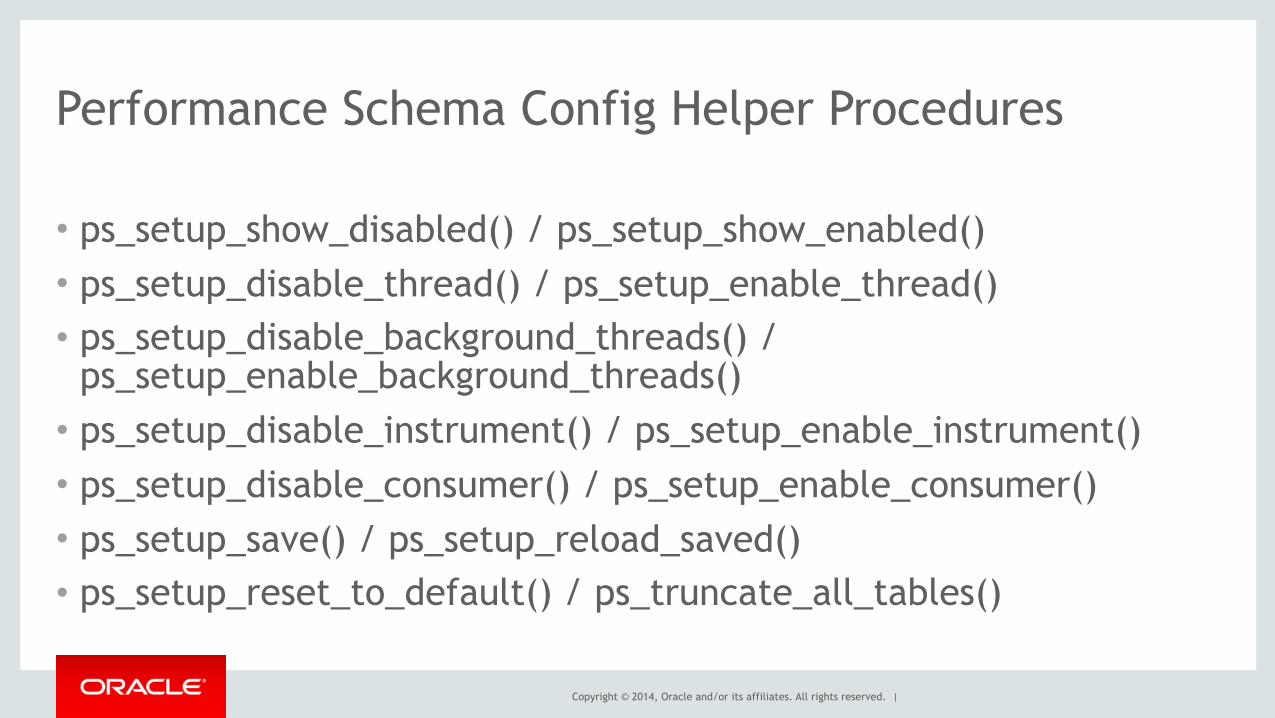
Performance Schema Config Helper Procedures
• ps_setup_show_disabled() / ps_setup_show_enabled() • ps_setup_disable_thread() / ps_setup_enable_thread() • ps_setup_disable_background_threads() /
ps_setup_enable_background_threads() • ps_setup_disable_instrument() / ps_setup_enable_instrument() • ps_setup_disable_consumer() / ps_setup_enable_consumer() • ps_setup_save() / ps_setup_reload_saved() • ps_setup_reset_to_default() / ps_truncate_all_tables()

Copyright © 2014, Oracle and/or its affiliates. All rights reserved. |
Program Agenda
Introduction to the MySQL sys schema
Installation
Formatting / Helper Routines
Tracing Routines
Summary Views
1
4
2
3
5

Copyright © 2014, Oracle and/or its affiliates. All rights reserved. |
• Dump all P_S data to a dot graph file to trace a thread
• Look in the statement history table to capture more info on a statement digest
• Show detailed transaction info • Dump as much diagnostics info
as possible (support enabler)
17
Statement Tracing Routines
ps_trace_thread ps_trace_statement_digest ps_thread_trx_info ps_thread_stack ps_statement_avg_latency_histogram diagnostics

Copyright © 2014, Oracle and/or its affiliates. All rights reserved. |
ps_trace_statement_digest procedure
• ps_trace_statement_digest() analyses live traffic looking for certain statement digest for a period of time • Captures statistics on each matching statement it finds • Returns a report of the captured stats • An overall summary • A break down for the longest running example • An EXPLAIN (if the statement is not truncated)

Copyright © 2014, Oracle and/or its affiliates. All rights reserved. |
ps_trace_statement_digest procedure
• ps_trace_statement_digest() parameters • in_digest The statement digest to analyse • in_runtime How long to run analysis for • in_interval How often to snapshot data • in_start_fresh Whether to truncate P_S tables first • in_auto_enable Whether to auto enable required config

Copyright © 2014, Oracle and/or its affiliates. All rights reserved. |
ps_trace_statement_digest procedure examplemysql> call ps_trace_statement_digest(‘6134e9d6f25eb8e6cddf11f6938f202a’, 60, 1, true, true); +--------------------+ | SUMMARY STATISTICS | +--------------------+ | SUMMARY STATISTICS | +--------------------+ 1 row in set (59.93 sec)
+------------+-----------+-----------+-----------+---------------+------------+------------+ | executions | exec_time | lock_time | rows_sent | rows_examined | tmp_tables | full_scans | +------------+-----------+-----------+-----------+---------------+------------+------------+ | 360 | 1.41 s | 138.39 ms | 720 | 0 | 0 | 0 | +------------+-----------+-----------+-----------+---------------+------------+------------+ 1 row in set (59.93 sec)
+--------------------------------+-------+-----------+ | event_name | count | latency | +--------------------------------+-------+-----------+ | stage/sql/Sending data | 14 | 1.10 s | | stage/sql/update | 198 | 667.34 ms | | stage/sql/removing tmp table | 9 | 240.48 ms | ...

Copyright © 2014, Oracle and/or its affiliates. All rights reserved. |
ps_trace_statement_digest procedure example+---------------------------+ | LONGEST RUNNING STATEMENT | +---------------------------+ | LONGEST RUNNING STATEMENT | +---------------------------+ 1 row in set (59.95 sec)
+-----------+-----------+-----------+-----------+---------------+------------+-----------+ | thread_id | exec_time | lock_time | rows_sent | rows_examined | tmp_tables | full_scan | +-----------+-----------+-----------+-----------+---------------+------------+-----------+ | 23277 | 77.64 ms | 97.00 us | 2 | 0 | 0 | 0 | +-----------+-----------+-----------+-----------+---------------+------------+-----------+ 1 row in set (59.95 sec)
+-------------------------------------------------------------------------------------------+ | sql_text | +-------------------------------------------------------------------------------------------+ | /* mem dbpool.default */ insert into `mem__quan`.`normalized_statements_by_server_by_schema` (firstSeen, lastSeen, normalized_statement_id, `schema`, server, id) values (1378983745000, 1378998600000, x'808ACEB88FC4B45BC47C4FE9D86C7F26', 'mem', '753c939e-1b99-11e3-b6d4-bc761a1f4f2f', x'7CFE81F98B1E3FE0895D1AA2C39B326D') ON DUPLICATE KEY UPDATE ... +-------------------------------------------------------------------------------------------+ ...

Copyright © 2014, Oracle and/or its affiliates. All rights reserved. |
ps_trace_statement_digest procedure example+--------------------------------+----------+ | event_name | latency | +--------------------------------+----------+ | stage/sql/init | 10.41 ms | | stage/sql/checking permissions | 2.35 us | | stage/sql/Opening tables | 10.32 us | | stage/sql/init | 13.53 us | | stage/sql/System lock | 3.66 us | | stage/sql/update | 61.74 ms | | stage/sql/end | 1.11 us | | stage/sql/query end | 1.31 us | | stage/sql/closing tables | 5.44 ms | | stage/sql/freeing items | 23.31 us | +--------------------------------+----------+ 10 rows in set (59.99 sec)
+----+-------------+-------+------+---------------+------+---------+------+------+----------------+ | id | select_type | table | type | possible_keys | key | key_len | ref | rows | Extra | +----+-------------+-------+------+---------------+------+---------+------+------+----------------+ | 1 | SIMPLE | NULL | NULL | NULL | NULL | NULL | NULL | NULL | No tables used | +----+-------------+-------+------+---------------+------+---------+------+------+----------------+ ...
Copyright © 2014, Oracle and/or its affiliates. All rights reserved. |
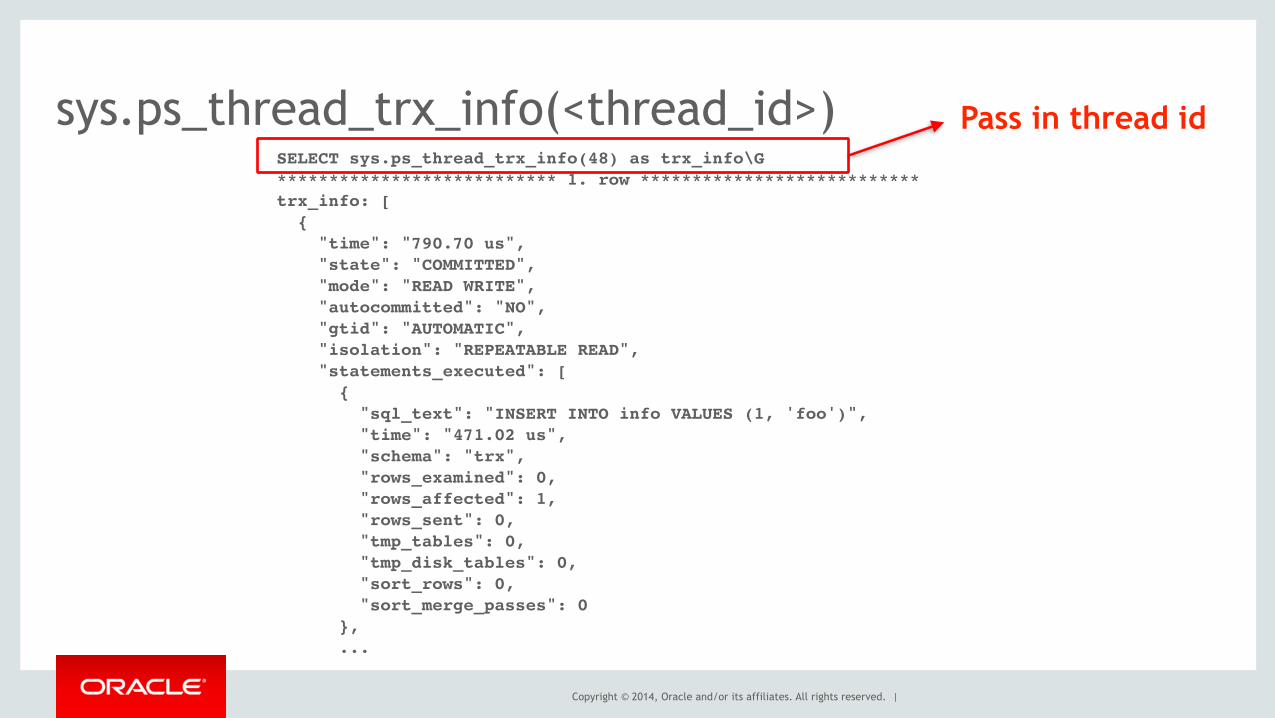
sys.ps_thread_trx_info(<thread_id>)SELECT sys.ps_thread_trx_info(48) as trx_info\G*************************** 1. row ***************************trx_info: [ { "time": "790.70 us", "state": "COMMITTED", "mode": "READ WRITE", "autocommitted": "NO", "gtid": "AUTOMATIC", "isolation": "REPEATABLE READ", "statements_executed": [ { "sql_text": "INSERT INTO info VALUES (1, 'foo')", "time": "471.02 us", "schema": "trx", "rows_examined": 0, "rows_affected": 1, "rows_sent": 0, "tmp_tables": 0, "tmp_disk_tables": 0, "sort_rows": 0, "sort_merge_passes": 0 }, ...
Pass in thread id

Copyright © 2014, Oracle and/or its affiliates. All rights reserved. |
ps_trace_thread procedure
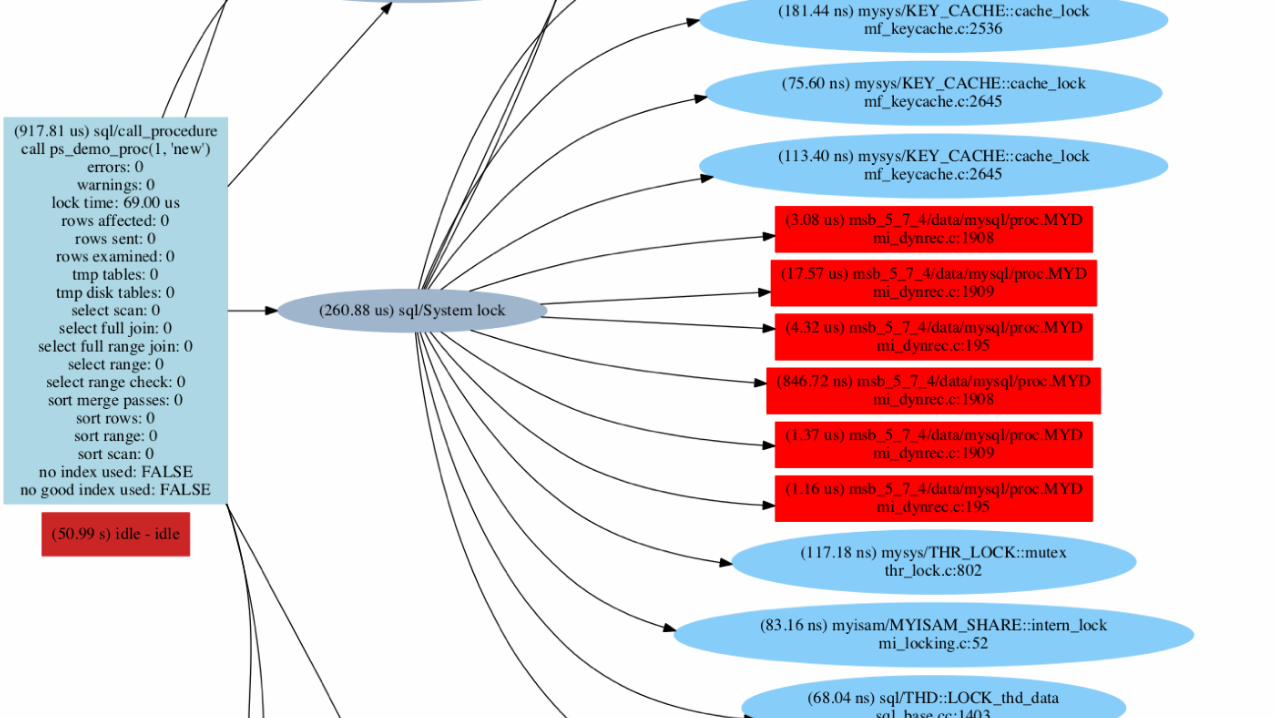
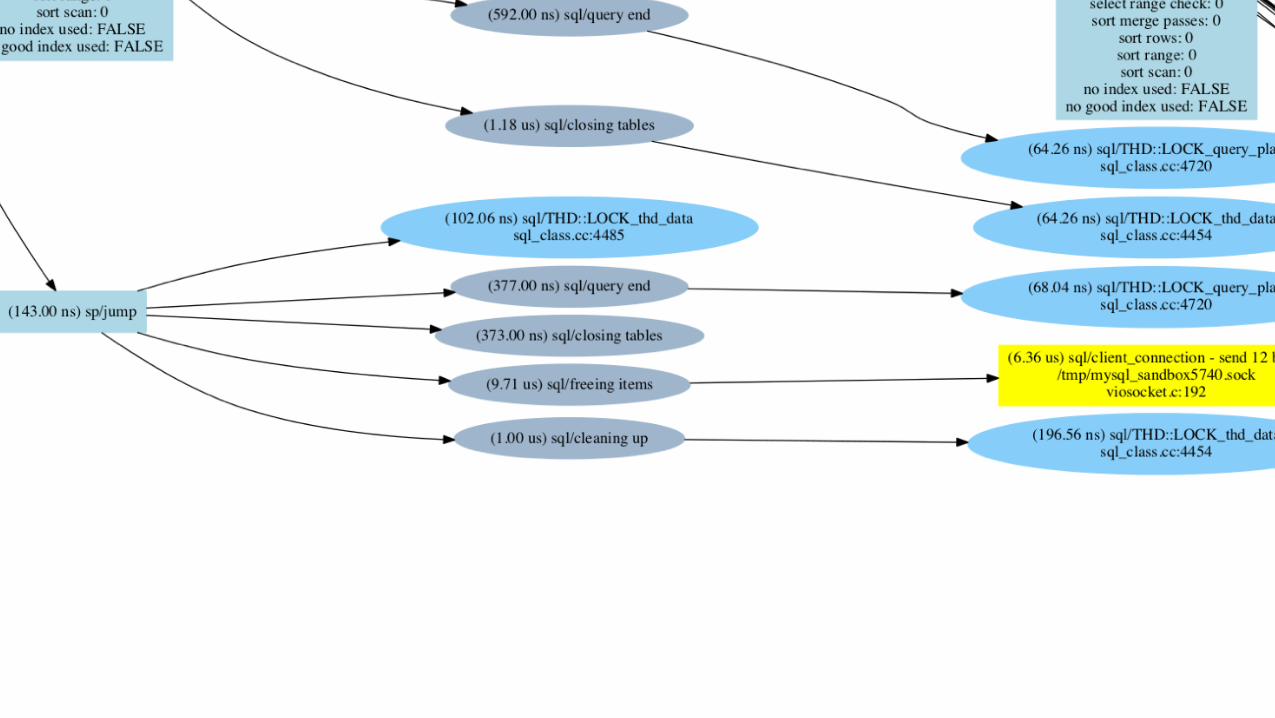
• ps_trace_thread() monitors a specific thread for a period • Captures as much information on the thread activity as possible • Returns a “dot” formatted file, that can graph the event hierarchy • http://en.wikipedia.org/wiki/DOT_(graph_description_language)

Copyright © 2014, Oracle and/or its affiliates. All rights reserved. |
ps_trace_thread procedure
• ps_trace_thread parameters • in_thread_id The thread to analyse • in_outfile The file to dump the data to (INTO OUTFILE) • in_max_runtime How long to run analysis for • in_interval How often to snapshot for data • in_start_fresh Whether to truncate P_S tables first • in_auto_setup Whether to auto enable required config • in_debug Whether to also print debug info (source info)

Copyright © 2014, Oracle and/or its affiliates. All rights reserved. |
ps_trace_thread procedure examplemysql> call ps_trace_thread(27768, '/tmp/stack_27768.dot', 60, 0.1, true, true, true); +------------------------------------------------+ | Info | +------------------------------------------------+ | Data collection starting for THREAD_ID = 27768 | +------------------------------------------------+ 1 row in set (4.82 sec)
+---------------------------------------------+ | Info | +---------------------------------------------+ | Stack trace written to /tmp/stack_27768.dot | +---------------------------------------------+ 1 row in set (60.90 sec)
+--------------------------------------------------------+ | Convert to PDF | +--------------------------------------------------------+ | dot -Tpdf -o /tmp/stack_27768.pdf /tmp/stack_27768.dot | +--------------------------------------------------------+ 1 row in set (60.90 sec)
+--------------------------------------------------------+ | Convert to PNG | +--------------------------------------------------------+ | dot -Tpng -o /tmp/stack_27768.png /tmp/stack_27768.dot | +--------------------------------------------------------+ 1 row in set (60.90 sec)+

Copyright © 2014, Oracle and/or its affiliates. All rights reserved. |
ps_trace_thread procedure example
cerberus:~ mark$ more Documents/statement_graphs/deletes.dotdigraph events { graph [rankdir=LR, nodesep="0.10"]; node [label="\N"]; graph [bb="0,0,1860,17476"]; 1 [label="(0.20μ) mysys/THR_LOCK_threads\n", style=filled, color=lightskyblue, pos="209,18", width="3.19", height="0.50"]; 2 [label="(0.18μ) sql/THD::LOCK_thd_data\n", style=filled, color=lightskyblue, pos="209,61", width="3.06", height="0.50"]; 3 [label="(0.24μ) sql/hash_filo::lock\n", style=filled, color=lightskyblue, pos="209,104", width="2.42", height=“0.50"]; 4 [label="(0.31μ) sql/LOGGER::LOCK_logger - read_lock\n", style=filled, color=orchid, pos="209,147", width="4.22", height="0.50"]; 5 [label="(0.08μ) sql/LOG::LOCK_log\n", style=filled, color=lightskyblue, pos="209,190", width="2.64", height="0.50"]; 6 [label="(12.97μ) wait/io/file/sql/query_log - write 49 bytes\n/Users/mark/mysql/lp-mysql-trunk/mysql-test/var/mysqld.1/mysqld.log\n", style=filled, color=red, shape=box, pos="209,235", width="5.78", height="0.56"]; 7 [label="(176.14μ) sql/select\nselect @@version_comment limit 1\nerrors: 0\nwarnings: 0\nlock time: 0.00μ\nrows affected: 0\nrows sent:\209,18", width="3.19", height="0.50"];mp disk tables: 0\nselect scan: 0\nselect full join: : 2 [label="(0.18μ) sql/THD::LOCK_thd_data\n", style=filled, color=lightskyblue, pos="209,61", width="3.06", height="0.50"]; 3 [label="(0.24μ) sql/hash_filo::lock\n", style=filled, color=lightskyblue, pos="209,104", width="2.42", height="0.50"]; 4 [label="(0.31μ) sql/LOGGER::LOCK_logger - read_lock\n", style=filled, color=orchid, pos="209,147", width="4.22", height="0.50"]; 5 [label="(0.08μ) sql/LOG::LOCK_log\n", style=filled, color=lightskyblue, pos="209,190", width="2.64", height="0.50"];……

Copyright © 2014, Oracle and/or its affiliates. All rights reserved. |
ps_trace_thread procedure example
MySQL 5.7
Procedures Transactions Statements Stages Waits
Copyright © 2014, Oracle and/or its affiliates. All rights reserved. |

Copyright © 2014, Oracle and/or its affiliates. All rights reserved. |

Copyright © 2014, Oracle and/or its affiliates. All rights reserved. |

Copyright © 2014, Oracle and/or its affiliates. All rights reserved. |

Copyright © 2014, Oracle and/or its affiliates. All rights reserved. |
Copyright © 2014, Oracle and/or its affiliates. All rights reserved. |

Copyright © 2014, Oracle and/or its affiliates. All rights reserved. |
Program Agenda
Introduction to the MySQL sys schema
Installation
Formatting / Helper Routines
Tracing Routines
Summary Views
1
5
2
3
4

Copyright © 2014, Oracle and/or its affiliates. All rights reserved. |
MySQL sys views
• Reference set of views solving various administrator use cases • Simple views, create/copy your own, sys is not “locked down”
• Build upon both performance_schema and INFORMATION_SCHEMA • Both formatted and raw views are available • All raw views are prefixed with x$ • Raw views are there for tools to poll
• Formatted views are for humans and the command line

Copyright © 2014, Oracle and/or its affiliates. All rights reserved. |
• High level user/host overviews • Breakdowns by: • IO usage • Stages • Statement details
• Following show users only
37
User / Host Summary Views
user_summary user_summary_by_file_io user_summary_by_file_io_type user_summary_by_stages user_summary_by_statement_latency user_summary_by_statement_type host_summary host_summary_by_file_io host_summary_by_file_io_type host_summary_by_stages host_summary_by_statement_latency host_summary_by_statement_type

Copyright © 2014, Oracle and/or its affiliates. All rights reserved. |
user_summary viewmysql> select * from user_summary\G*************************** 1. row *************************** user: mark statements: 3072 statement_latency: 1.77 s statement_avg_latency: 575.29 us table_scans: 7 file_ios: 20043 file_io_latency: 346.79 ms current_connections: 1 total_connections: 1 unique_hosts: 1 current_memory: 515.81 KiBtotal_memory_allocated: 30.69 MiB
MySQL 5.7

Copyright © 2014, Oracle and/or its affiliates. All rights reserved. |
user_summary_by_file_io_type view
mysql> select * from user_summary_by_file_io_type;+------+--------------------------------------+---------+-------------+-------------+| user | event_name | total | latency | max_latency |+------+--------------------------------------+---------+-------------+-------------+| mark | wait/io/file/myisam/dfile | 19540 | 215.20 ms | 120.79 ms || mark | wait/io/file/myisam/kfile | 501 | 131.58 ms | 57.74 ms || mark | wait/io/file/sql/dbopt | 2 | 17.29 us | 9.17 us || root | wait/io/file/innodb/innodb_log_file | 2079432 | 00:28:27.62 | 1.30 s || root | wait/io/file/myisam/kfile | 5195927 | 00:17:07.33 | 1.17 s || root | wait/io/file/myisam/dfile | 1533813 | 00:07:27.59 | 1.18 s || root | wait/io/file/sql/binlog | 3517008 | 00:03:07.34 | 1.42 s || root | wait/io/file/innodb/innodb_data_file | 20720 | 00:02:37.81 | 492.23 ms || root | wait/io/file/sql/FRM | 41412 | 3.17 s | 80.43 ms || root | wait/io/file/sql/dbopt | 110993 | 1.23 s | 63.27 ms |
Copyright © 2014, Oracle and/or its affiliates. All rights reserved. |
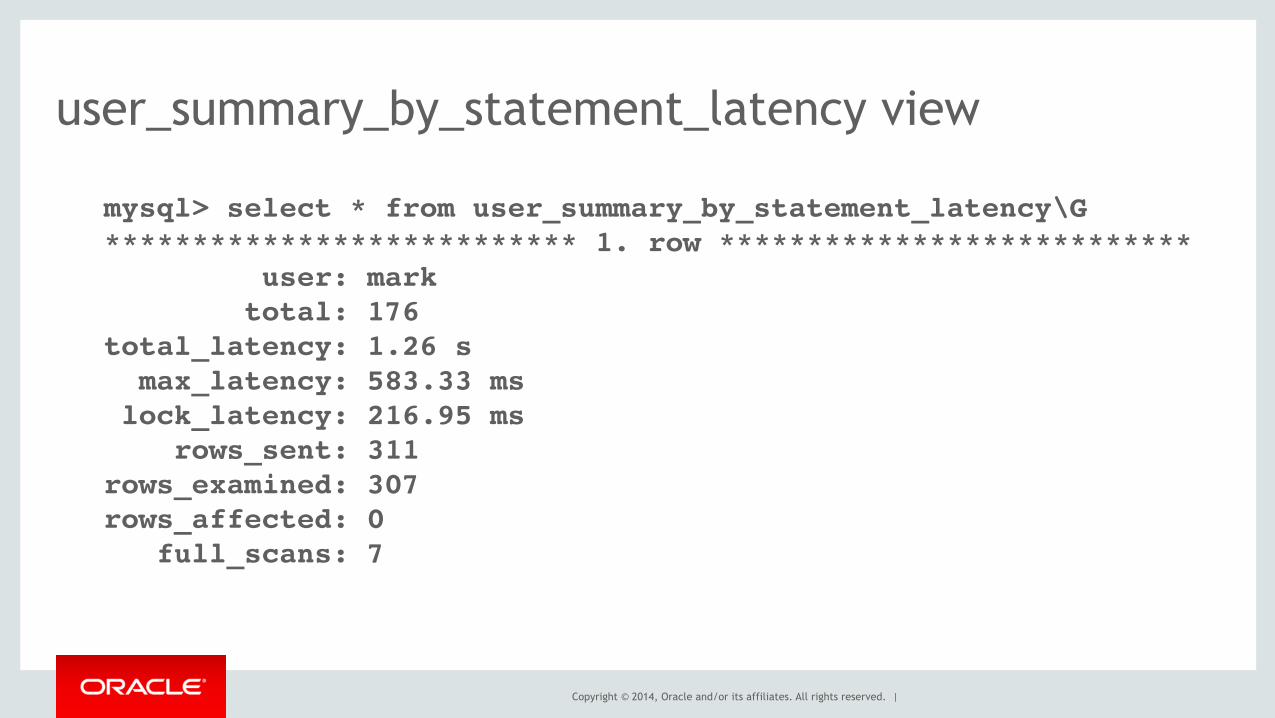
user_summary_by_statement_latency view
mysql> select * from user_summary_by_statement_latency\G*************************** 1. row *************************** user: mark total: 176total_latency: 1.26 s max_latency: 583.33 ms lock_latency: 216.95 ms rows_sent: 311rows_examined: 307rows_affected: 0 full_scans: 7

Copyright © 2014, Oracle and/or its affiliates. All rights reserved. |
user_summary_by_statement_type view
mysql> select * from user_summary_by_statement_type\G*************************** 1. row *************************** user: mark statement: commit total: 2463190total_latency: 13.33h max_latency: 12.18 s lock_latency: 0 ps rows_sent: 0rows_examined: 0rows_affected: 0 full_scans: 0

Copyright © 2014, Oracle and/or its affiliates. All rights reserved. |
• IO by current threads • Global summaries by file and
class, aggregating by bytes or latency
• Stream of last file IO events in raw form
42
IO Summary Views
io_by_thread_by_latency io_global_by_file_by_bytes io_global_by_file_by_latency io_global_by_wait_by_bytes io_global_by_wait_by_latency

Copyright © 2014, Oracle and/or its affiliates. All rights reserved. |
io_by_thread_by_latency viewmysql> select * from io_by_thread_by_latency\G*************************** 1. row *************************** user: main total: 1193 total_latency: 136.45 ms min_latency: 731.38 ns avg_latency: 269.99 us max_latency: 20.72 ms thread_id: 1processlist_id: NULL*************************** 2. row *************************** user: root@localhost total: 533 total_latency: 53.81 ms min_latency: 780.39 ns avg_latency: 8.41 ms max_latency: 25.06 ms thread_id: 23processlist_id: 4

Copyright © 2014, Oracle and/or its affiliates. All rights reserved. |
io_global_by_file_by_latency view
mysql> select * from io_global_by_file_by_latency limit 1\G*************************** 1. row *************************** file: @@datadir/ibdata1 total: 1395714total_latency: 00:28:53.06 count_read: 1006 read_latency: 4.51 s count_write: 1326529write_latency: 33.39 s count_misc: 68179 misc_latency: 00:28:15.16

Copyright © 2014, Oracle and/or its affiliates. All rights reserved. |
latest_file_io viewmysql> select * from latest_file_io;+-----------------------------+----------------------------------+-----------+-----------+-----------+| thread | file | latency | operation | requested |+-----------------------------+----------------------------------+-----------+-----------+-----------+| root@localhost:63153:179371 | @@datadir/ib_logfile1 | 7.16 us | lock | NULL || root@localhost:63153:179371 | @@datadir/ib_logfile1 | 6.16 us | write | 1.50 KiB || root@localhost:63153:179371 | @@datadir/ib_logfile1 | 14.36 ms | sync | NULL || root@localhost:63153:179371 | @@datadir/cerberus-bin.000012 | 28.25 us | write | 905 bytes || root@localhost:63177:179394 | @@datadir/ib_logfile1 | 15.25 us | write | 1.00 KiB || root@localhost:57487:3 | @@datadir/cerberus-bin.000012 | 32.12 us | read | 905 bytes || root@localhost:63177:179394 | @@datadir/ib_logfile1 | 6.65 us | write | 1.00 KiB || root@localhost:63177:179394 | @@datadir/ib_logfile1 | 213.32 us | sync | NULL || root@localhost:63177:179394 | @@datadir/ib_logfile1 | 17.27 us | write | 1.00 KiB || root@localhost:63177:179394 | @@datadir/ib_logfile1 | 286.01 us | sync | NULL || root@localhost:63177:179394 | @@datadir/cerberus-bin.000012 | 18.77 us | write | 601 bytes || root@localhost:57487:3 | @@datadir/cerberus-bin.000012 | 7.55 us | read | 601 bytes || root@localhost:63177:179394 | @@datadir/ib_logfile1 | 10.67 us | write | 1.00 KiB || root@localhost:63177:179394 | @@datadir/ib_logfile1 | 200.28 us | sync | NULL || root@localhost:63177:179394 | @@datadir/cerberus-bin.000012 | 12.91 us | write | 601 bytes || root@localhost:57487:3 | @@datadir/cerberus-bin.000012 | 6.47 us | read | 601 bytes || root@localhost:63177:179394 | @@datadir/ib_logfile1 | 9.22 us | write | 1.50 KiB |……

Copyright © 2014, Oracle and/or its affiliates. All rights reserved. |
• Object overview • Table usage statistics • Index usage statistics • Following show users only
46
Schema Analysis Views
schema_index_statistics schema_object_overview schema_table_statistics schema_table_statistics_with_buffer schema_tables_with_full_table_scans schema_unused_indexes
Copyright © 2014, Oracle and/or its affiliates. All rights reserved. |
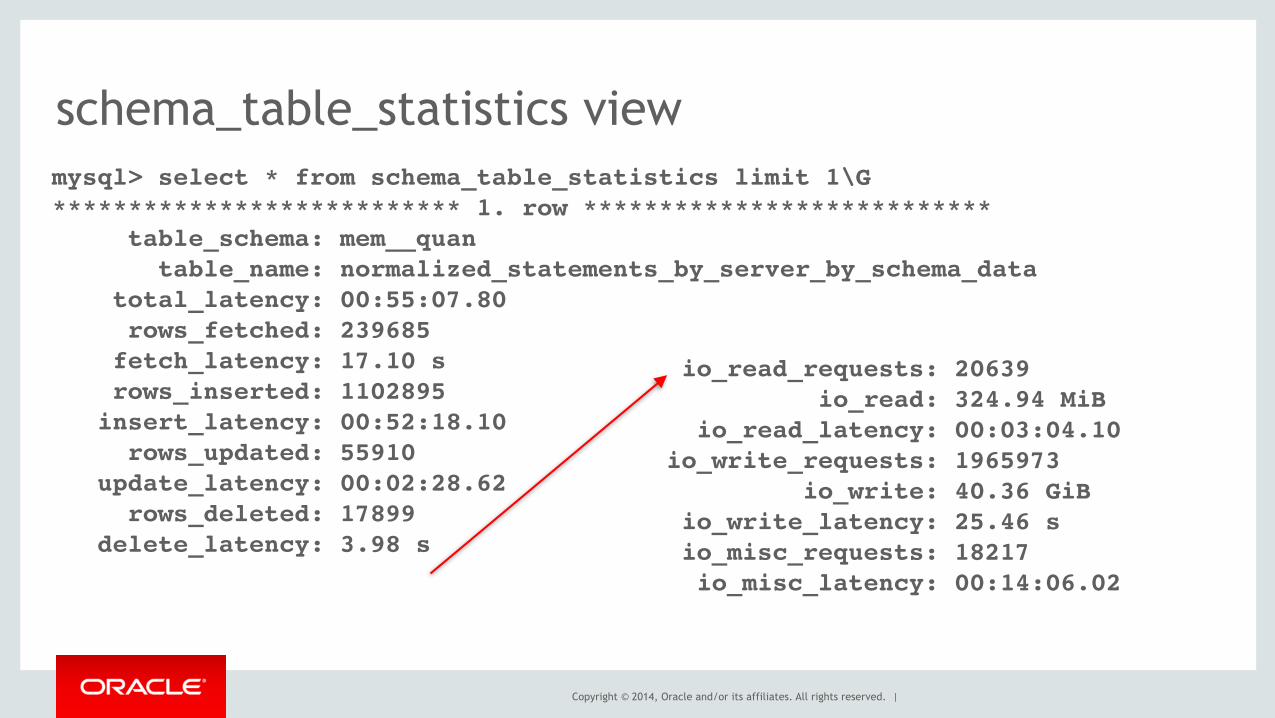
schema_table_statistics viewmysql> select * from schema_table_statistics limit 1\G*************************** 1. row *************************** table_schema: mem__quan table_name: normalized_statements_by_server_by_schema_data total_latency: 00:55:07.80 rows_fetched: 239685 fetch_latency: 17.10 s rows_inserted: 1102895 insert_latency: 00:52:18.10 rows_updated: 55910 update_latency: 00:02:28.62 rows_deleted: 17899 delete_latency: 3.98 s
io_read_requests: 20639 io_read: 324.94 MiB io_read_latency: 00:03:04.10io_write_requests: 1965973 io_write: 40.36 GiB io_write_latency: 25.46 s io_misc_requests: 18217 io_misc_latency: 00:14:06.02

Copyright © 2014, Oracle and/or its affiliates. All rights reserved. |
schema_index_statistics view
mysql> select * from schema_index_statistics limit 1\G*************************** 1. row *************************** table_schema: mem__inventory table_name: mysqlconnectionconfiguration index_name: PRIMARY rows_selected: 131399select_latency: 00:07:05.03 rows_inserted: 0insert_latency: 0 ps rows_updated: 41608update_latency: 21.96 s rows_deleted: 0delete_latency: 0 ps

Copyright © 2014, Oracle and/or its affiliates. All rights reserved. |
schema_tables_with_full_table_scans view
mysql> select * from schema_tables_with_full_table_scans limit 10;+--------------------+--------------------------------+-------------------+-----------+| object_schema | object_name | rows_full_scanned | latency |+--------------------+--------------------------------+-------------------+-----------+| mem30__instruments | fsstatistics | 10207042 | 13.10 s || mem30__instruments | preparedstatementapidata | 436428 | 973.27 ms || mem30__instruments | mysqlprocessactivity | 411702 | 282.07 ms || mem30__instruments | querycachequeriesincachedata | 374011 | 767.15 ms || mem30__instruments | rowaccessesdata | 322321 | 1.55 s || mem30__instruments | connectionsmaxdata | 301242 | 857.63 ms || mem30__instruments | innodbdatadictionarymemorydata | 292564 | 495.38 ms || mem30__instruments | innodbbufferpooldata | 277112 | 1.95 s || mem30__instruments | avgrowaccessesdata | 269236 | 1.25 s || mem30__instruments | innodbrowdetailsdata | 248208 | 653.25 ms |+--------------------+--------------------------------+-------------------+-----------+

Copyright © 2014, Oracle and/or its affiliates. All rights reserved. |
schema_unused_indexes view
mysql> select * from schema_unused_indexes limit 10;+--------------------+-----------------------------------+--------------------+| object_schema | object_name | index_name |+--------------------+-----------------------------------+--------------------+| mem30__bean_config | plists | path || mem30__config | group_selections | name || mem30__config | notification_groups | name || mem30__config | user_form_defaults | FKC1AEF1F9E7EE2CFB || mem30__enterprise | whats_new_entries | entryId || mem30__events | action_logs | policyId || mem30__events | action_logs | eventId || mem30__events | action_logs | ts || mem30__events | advisor_scopes_advisorcategoryids | FKF0CB0DB962CAB4 || mem30__events | advisor_scopes_advisorclassids | FK650AF1BF962CAB4 |+--------------------+-----------------------------------+--------------------+
You should ensure you have representative time frame before taking any actions!

Copyright © 2014, Oracle and/or its affiliates. All rights reserved. |
• Wait summaries by class • Wait details per: • User • Host • Globally
51
Wait Analysis Views
wait_classes_global_by_avg_latency wait_classes_global_by_latency waits_by_host_by_latency waits_by_user_by_latency waits_global_by_latency

Copyright © 2014, Oracle and/or its affiliates. All rights reserved. |
waits_global_by_latency view
mysql> select * from waits_global_by_latency limit 10;+--------------------------------------+----------+---------------+-------------+-------------+| events | total | total_latency | avg_latency | max_latency |+--------------------------------------+----------+---------------+-------------+-------------+| wait/io/table/sql/handler | 24196659 | 1.75h | 259.72 us | 2.29 s || wait/io/file/innodb/innodb_data_file | 5964255 | 1.36h | 822.01 us | 1.49 s || wait/io/file/innodb/innodb_log_file | 2272647 | 00:36:41.37 | 968.64 us | 1.30 s || wait/io/file/myisam/kfile | 5463587 | 00:18:14.16 | 200.26 us | 1.17 s || wait/io/file/myisam/dfile | 1715187 | 00:08:00.18 | 279.96 us | 1.18 s || wait/io/file/sql/binlog | 3722079 | 00:03:23.71 | 54.73 us | 1.42 s || wait/lock/table/sql/handler | 10074274 | 00:01:56.63 | 11.58 us | 186.90 ms || wait/io/socket/sql/client_connection | 3879827 | 25.36 s | 6.54 us | 219.25 ms || wait/io/file/sql/FRM | 43994 | 3.27 s | 74.35 us | 80.43 ms || wait/io/file/sql/dbopt | 116765 | 1.29 s | 11.03 us | 63.27 ms |+--------------------------------------+----------+---------------+-------------+-------------+
InnoDB only instance, this MyISAM IO is all temporary tables, focus tuning there!

Copyright © 2014, Oracle and/or its affiliates. All rights reserved. |
waits_by_user_by_latency view
mysql> select * from waits_by_user_by_latency;+------+--------------------------------------+----------+---------------+-------------+-------------+| user | event | total | total_latency | avg_latency | max_latency |+------+--------------------------------------+----------+---------------+-------------+-------------+| mark | wait/io/file/myisam/dfile | 19540 | 215.20 ms | 11.01 us | 120.79 ms || mark | wait/io/file/myisam/kfile | 501 | 131.58 ms | 262.63 us | 57.74 ms || mark | wait/io/file/sql/dbopt | 2 | 17.29 us | 8.64 us | 9.17 us || root | wait/io/table/sql/handler | 24189319 | 1.74h | 258.77 us | 2.29 s || root | wait/io/file/innodb/innodb_log_file | 2162650 | 00:30:52.87 | 856.76 us | 1.30 s || root | wait/io/file/myisam/kfile | 5460992 | 00:18:12.83 | 200.11 us | 1.17 s || root | wait/io/file/myisam/dfile | 1694624 | 00:07:59.50 | 282.95 us | 1.18 s || root | wait/io/file/sql/binlog | 3711637 | 00:03:23.16 | 54.74 us | 1.42 s || root | wait/io/file/innodb/innodb_data_file | 22577 | 00:03:05.73 | 8.23 ms | 492.23 ms || root | wait/lock/table/sql/handler | 10069000 | 00:01:56.59 | 11.58 us | 186.90 ms |……
root is doing the most temporary table IO

Copyright © 2014, Oracle and/or its affiliates. All rights reserved. |
• Table Metadata Lock Waits • InnoDB Row Lock Waits
54
Lock Wait Views
schema_table_lock_waits innodb_lock_waits

Copyright © 2014, Oracle and/or its affiliates. All rights reserved. |
sys.schema_table_lock_waitsmysql> select * from sys.schema_table_lock_waits\G*************************** 1. row *************************** object_schema: test object_name: t waiting_thread_id: 43 waiting_pid: 21 waiting_account: msandbox@localhost waiting_lock_type: SHARED_UPGRADABLE waiting_lock_duration: TRANSACTION waiting_query: alter table test.t add foo int waiting_query_secs: 988 waiting_query_rows_affected: 0 waiting_query_rows_examined: 0 blocking_thread_id: 42 blocking_pid: 20 blocking_account: msandbox@localhost blocking_lock_type: SHARED_NO_READ_WRITE blocking_lock_duration: TRANSACTION sql_kill_blocking_query: KILL QUERY 20sql_kill_blocking_connection: KILL 20

Copyright © 2014, Oracle and/or its affiliates. All rights reserved. |
sys.innodb_lock_waitsmysql> SELECT * FROM sys.innodb_lock_waits\G*************************** 1. row *************************** wait_started: 2014-11-11 13:39:20 wait_age: 00:00:07 wait_age_secs: 7 locked_table: `db1`.`t1` locked_index: PRIMARY locked_type: RECORD waiting_trx_id: 867158 waiting_trx_started: 2014-11-11 13:39:15 waiting_trx_age: 00:00:12 waiting_trx_rows_locked: 0 waiting_trx_rows_modified: 0 waiting_pid: 3 waiting_query: UPDATE t1 SET val = val + 1 WHERE id = 2 waiting_lock_id: 867158:2363:3:3 waiting_lock_mode: X blocking_trx_id: 867157 blocking_pid: 4 ...
blocking_query: UPDATE t1 SET val … blocking_lock_id: 867157:2363:3:3 blocking_lock_mode: X blocking_trx_started: 2014-11-11 13:39:11 blocking_trx_age: 00:00:16 blocking_trx_rows_locked: 1 blocking_trx_rows_modified: 1 sql_kill_blocking_query: KILL QUERY 4sql_kill_blocking_connection: KILL 4
Copyright © 2014, Oracle and/or its affiliates. All rights reserved. |
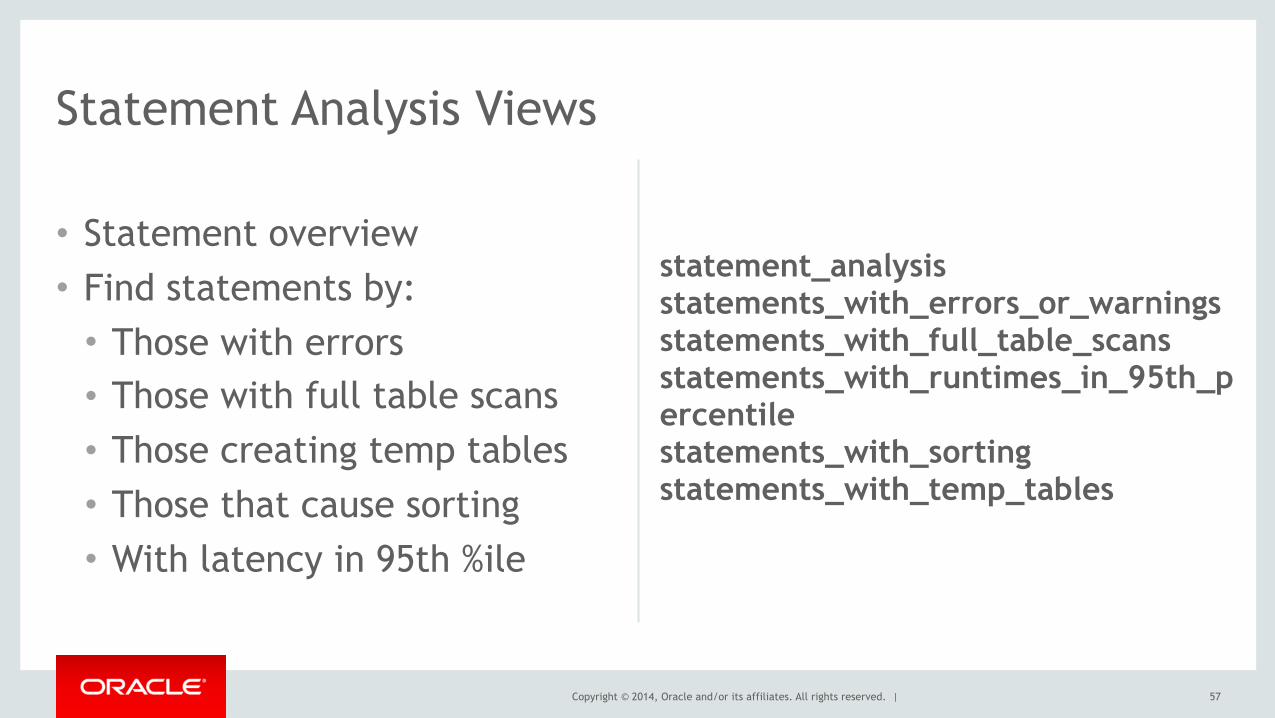
• Statement overview • Find statements by: • Those with errors • Those with full table scans • Those creating temp tables • Those that cause sorting • With latency in 95th %ile
57
Statement Analysis Views
statement_analysis statements_with_errors_or_warnings statements_with_full_table_scans statements_with_runtimes_in_95th_percentile statements_with_sorting statements_with_temp_tables

Copyright © 2014, Oracle and/or its affiliates. All rights reserved. |
statement_analysis viewmysql> select * from statement_analysis limit 2\G*************************** 1. row *************************** query: INSERT INTO `mem30__quan` . `n ... nDuration` = IF ( VALUES ( ... db: mem full_scan: exec_count: 4657 err_count: 0 warn_count: 0 total_latency: 00:03:57.40 max_latency: 10.54 s avg_latency: 50.98 ms lock_latency: 00:03:00.93 rows_sent: 0 rows_sent_avg: 0 rows_examined: 0rows_examined_avg: 0 rows_affected: 4794rows_affected_avg: 1
tmp_tables: 0 tmp_disk_tables: 0 rows_sorted: 0sort_merge_passes: 0 digest: b98bfe333642e8e4e72c73515810d865 first_seen: 2014-09-24 11:27:01 last_seen: 2014-09-24 11:53:00

Copyright © 2014, Oracle and/or its affiliates. All rights reserved. |
statements_with_errors_or_warnings view
mysql> select * from statements_with_errors_or_warnings limit 1\G*************************** 1. row *************************** query: CREATE TEMPORARY TABLE IF NOT ... _logs` ( `id` INT8 NOT NULL ) db: mem exec_count: 1725 errors: 1725 error_pct: 100.0000 warnings: 0warning_pct: 0.0000 first_seen: 2014-05-20 10:42:32 last_seen: 2014-05-21 18:39:22 digest: 51fb979dbc3910a6294c7cdabd7839c3

Copyright © 2014, Oracle and/or its affiliates. All rights reserved. |
statements_with_temp_tables view
mysql> select * from statements_with_temp_tables limit 1\G*************************** 1. row *************************** query: SELECT * FROM ( SELECT `digest ... ` , `sum_no_index_used` AS ... db: mysql exec_count: 68 total_latency: 2.31 s memory_tmp_tables: 476 disk_tmp_tables: 204avg_tmp_tables_per_query: 7 tmp_tables_to_disk_pct: 43 first_seen: 2014-09-24 11:26:18 last_seen: 2014-09-24 12:33:00 digest: 50761c6a1818824328745d8a136b9ed6

Copyright © 2014, Oracle and/or its affiliates. All rights reserved. |
statements_with_full_table_scans viewmysql> select * from statements_with_full_table_scans limit 1\G*************************** 1. row *************************** query: SELECT `pojotimese0_` . `id` A ... ty_timeseries` `pojotimese0_` db: mem exec_count: 1 total_latency: 940.89 us no_index_used_count: 1no_good_index_used_count: 0 no_index_used_pct: 100 rows_sent: 116 rows_examined: 116 rows_sent_avg: 116 rows_examined_avg: 116 first_seen: 2014-09-24 11:25:03 last_seen: 2014-09-24 11:25:03 digest: f81b5ce10baee9be754cf35fd245a516

Copyright © 2014, Oracle and/or its affiliates. All rights reserved. |
• Better SHOW PROCESSLIST • No mutex contention • Live statistics for query
• Consolidated metrics
62
Miscellaneous Views
processlist session metrics

Copyright © 2014, Oracle and/or its affiliates. All rights reserved. |
processlist / session viewsmysql> select * from session\G*************************** 1. row *************************** thd_id: 7890 conn_id: 7870 user: root@localhost db: mem command: Query state: update time: 0 current_statement: /* mem dbpool.default */ inser ...<truncated> lock_latency: 0 ps rows_examined: 0 rows_sent: 0 rows_affected: 0 tmp_tables: 0
tmp_disk_tables: 0 full_scan: NO last_statement: NULLlast_statement_latency: NULL last_wait: wait/io/table/sql/handler last_wait_latency: Still Waiting source: handler.cc:7274

Copyright © 2014, Oracle and/or its affiliates. All rights reserved. |
sys.sessions progress estimation mysql> select * from sys.sessions\G*************************** 1. row *************************** thd_id: 44524 conn_id: 44502 user: msandbox@localhost db: test command: Query state: alter table (flush) time: 18 current_statement: alter table t1 add column g int statement_latency: 18.45 s progress: 98.84 lock_latency: 265.43 ms rows_examined: 0 rows_sent: 0 rows_affected: 0 tmp_tables: 0 tmp_disk_tables: 0 ...

Copyright © 2014, Oracle and/or its affiliates. All rights reserved. |
sys.metrics
mysql> select * from sys.metrics limit 199, 10;+-----------------------------+----------------+--------------------------------------+---------+| Variable_name | Variable_value | Type | Enabled |+-----------------------------+----------------+--------------------------------------+---------+| tc_log_page_waits | 0 | Global Status | YES || threads_cached | 7 | Global Status | YES || threads_connected | 3 | Global Status | YES || threads_created | 10 | Global Status | YES || threads_running | 3 | Global Status | YES || uptime | 275689 | Global Status | YES || uptime_since_flush_status | 275689 | Global Status | YES || adaptive_hash_pages_added | 0 | InnoDB Metrics - adaptive_hash_index | NO || adaptive_hash_pages_removed | 0 | InnoDB Metrics - adaptive_hash_index | NO || adaptive_hash_rows_added | 0 | InnoDB Metrics - adaptive_hash_index | NO |+-----------------------------+----------------+--------------------------------------+---------+
performance_schema.global_status
information_schema.innodb_metrics

Copyright © 2014, Oracle and/or its affiliates. All rights reserved. |