Myanmar - United Nations Office on Drugs and Crime · Myanmar Opium Survey 2005 3 EXECUTIVE SUMMARY...
62
Opium Survey 2005 Myanmar November 2005 Central Committee for Drug Abuse Control
Transcript of Myanmar - United Nations Office on Drugs and Crime · Myanmar Opium Survey 2005 3 EXECUTIVE SUMMARY...

Opium Survey 2005
Vienna International Centre, P.O. Box 500, A-1400 Vienna, Austria Tel: (+43 1) 26060-0, Fax: (+43 1) 26060-5866, www.unodc.org
Printed in Myanmar
Myanmar
Nove
mbe
r 200
5
Central Committeefor Drug Abuse
Control

Myanmar Opium Survey 2005
i
ABBREVIATIONS
CCDAC Central Committee for Drug Abuse Control
INGO International Non Governmental Organization
ICMP UNODC Illicit Crop Monitoring Programme
GoUM Government of the Union of Myanmar
KOWI UNODC Kokang and Wa Initiative
SR Special Region
UNODC United Nations Office on Drugs and Crime
Wa Project UNODC Wa Project
ACKNOWLEDGEMENTS
The following organizations and individuals contributed to the implementation of the 2005 Opium Survey in Myanmar and the preparation of the present report:
CCDAC:
Pol. Col. Hkam Awng Joint Secretary and Head of Department, Office of CCDAC
Pol. Lt. Col. Wa Tin Deputy Director (Legal and Research), Office of CCDAC
U Maung Maung Than Assistant Director RS & GIS Section, Forest Department
The implementation of the survey would not have been possible without the support from the local administrations and the dedicated work of 185 surveyors.
UNODC:
Jean Luc Lemahieu UNODC Resident Representative in Myanmar
Xavier Bouan Regional Illicit Crop Monitoring Expert, supervision and management of the survey, ICMP, Research and Analysis Section, Myanmar
U Kyaw Ngwe Ground survey supervision, ICMP - Myanmar
U Sai Aung Kyaw Win Ground survey supervision, ICMP- Myanmar
U Kyaw Naing Win GIS analyst, ICMP - Myanmar
Coen Bussink Remote Sensing/GIS Expert, ICMP, Research and Analysis Section
Hakan Demirbuken Regional Illicit Crop Monitoring Expert for South-west Asia, ICMP, Research and Analysis Section, Afghanistan
Thibault Le Pichon Chief, Research and Analysis Section
Anja Korenblik Programme Management Officer, ICMP, Research and Analysis Section
Suzanne Kunnen Public Information Assistant, Research and Analysis Section
Patrick Seramy Database management, ICMP, Research and Analysis Section
Javier Teran Statistician , ICMP, Research and Analysis Section
The implementation of the UNODC illicit Crop Monitoring Programme in South East Asia and the 2005 Myanmar Opium Survey were made possible thanks to financial support from the Governments of Italy, Japan and USA.

Myanmar Opium Survey 2005
ii
CONTENTS
ABBREVIATIONS ......................................................................................................................... I
ACKNOWLEDGEMENTS............................................................................................................ I
PREFACE..................................................................................................................................... III
FACT SHEET- MYANMAR OPIUM SURVEY 2005 ................................................................1
EXECUTIVE SUMMARY.............................................................................................................3
OPIUM POPPY CULTIVATION ....................................................................................................... 3 OPIUM YIELD AND PRODUCTION................................................................................................ 4 OPIUM PRICES AND TRADE .......................................................................................................... 5 HOUSEHOLD INCOME FROM OPIUM CULTIVATION............................................................... 5 ADDICTION ....................................................................................................................................... 5 ERADICATION .................................................................................................................................. 5 FOOD SECURITY AND ASSISTANCE............................................................................................ 5
1. INTRODUCTION.......................................................................................................................7
2. FINDINGS ...................................................................................................................................9
2.1 OPIUM POPPY PLANTED AREA............................................................................................... 9 2.2 YIELD AND PRODUCTION ..................................................................................................... 19 2.3. OPIUM PRICES AND CASH INCOME ................................................................................... 22 2.4 ADDICTION ............................................................................................................................... 27 2.5 SOCIO-ECONOMIC CHARACTERISTICS OF THE SURVEYED POPULATION ............... 29 2.6 REPORTED ERADICATION..................................................................................................... 37
3. METHODOLOGY....................................................................................................................41
3.1 SAMPLING PROCEDURE FOR THE VILLAGE SURVEY. ................................................... 41 3.2 ORGANIZATION AND STAFF................................................................................................. 46 3.3 FIELD OPERATIONS................................................................................................................. 46 3.5 REMOTE SENSING PROCEDURE........................................................................................... 49 3.6 ESTIMATION PROCEDURES .................................................................................................. 55


Myanmar Opium Survey 2005
iii
PREFACE
Opium cultivation in Myanmar has steadily declined since 2000, and two-thirds of poppy crops have disappeared. Compared with the peak in 1996, the number of hectares devoted to opium has been reduced by 80% in 2005, from 163,000 hectares to 32,800 hectares. When adding the weather factor, influencing opium yields on the fields, an 82% decline in the opium production is registered over the same period of time. While the data included in the report is largely positive, certain worrying factors, with a potential to undo this rapid progress, need addressing. Compared to the previous year, opium production has doubled in the southern Shan State despite the acreage showing only a slight increase. This is in part due to additional rains, however, and more disquieting, also due to improved cultivation practices. The latter, in turn, is an indication of more sophisticated criminal activity, transcending poverty, and not dissimilar to the trends witnessed with ATS production: cross-border networking and transfer of new and improved techniques. Even so and taking note of the exception mentioned, general figures overwhelmingly associate opium with marginal economic conditions typical to remote mountainous areas in which most of the opium is grown. Shocking for anybody less familiar to the opium problem in Myanmar, is the low income of farmers in the Shan State. Non-opium growing households in the Shan State earn an average US$364 annually, against only US$292 for an opium farming household, consisting of both parents and two to four children. Half of the households surveyed in the Shan State report food insecurity; a figure that rises to an astounding 90% in concentrated poppy-cultivation areas. With the loss of opium income, these poor farmers and their families not only lose their coping mechanism to deal with endemic poverty and a chronic food shortage; they equally lose access to health services and to schools. They end up very vulnerable to exploitation and misery – from human right abuses to enforce the opium bans, to internal displacement or human trafficking to survive the bans. For the United Nations, replacing one social evil (narcotics) with another (hunger and poverty) is wrong. Therefore the United Nations Office on Drugs and Crime calls on the international community to provide for the basic human needs of those affected. The situation in the Golden Triangle is similar to the one in Afghanistan and the Andeans: some of the poorest people are being affected by the loss of income from drugs as cultivation declines. Thus, the international community must have the wisdom to fight drugs and poverty simultaneously, to eliminate both the causes and the effects of these twin afflictions. In other words, the world will not condone counter-narcotic measures that result in humanitarian disasters. If there is one concrete measure that the Government and its development assistance partners can take now to ensure Myanmar’s future, it is this: food security and income generation programmes must remain in place and be strengthened to support both the farmers’ decisions not to plant opium, and enforcement measures to eradicate the opium that is planted against the law.
Antonio Maria Costa Executive Director
UNODC


Myanmar Opium Survey 2005
1
FACT SHEET- MYANMAR OPIUM SURVEY 2005
2004 2005 Variation on 2004
Opium poppy cultivation in the Union of Myanmar1 44,200 ha 32,800 ha -26% Opium poppy planted area in the Shan State 41,000 ha 30,800 ha -25% Weighted average opium yield 8 kg/ha 9.5 kg / ha +19 % Potential production of opium in the whole of the 370 mt 312 mt -16% Union of Myanmar (including the Shan State) Opium poppy eradication in the Union of 2,820 ha 3,907 ha +39% Myanmar2 Average farm gate price of opium3 US$ 153/kg US$ 187/kg +22% Total potential value of opium production US$ 57 million US $ 58 million +3%
(0.7% of GDP) Estimated number of households involved in 260,000 193,000 -26% opium poppy cultivation in Myanmar Number of persons involved in opium poppy 1.3 million 965,000 -26% cultivation in Myanmar4 Estimated number of households involved in 240,000 181,000 -24% opium poppy cultivation in the Shan State Household average yearly income in opium producing household (Shan State) US$ 214 US$ 292 +36% of which from opium sale US$ 133 US$ 152 +14% (or 62%) (or 52%) Per capita income in opium producing households (Shan State) US$ 43 US$ 58 Household average yearly income in non-opium poppy producing household (Shan State) US$ 276 US$ 364 +32% Per capita income in non-opium US$ 55 US$ 73 producing households (Shan State) Addiction prevalence rate in Shan State 0.61% 0.57% -7% (Population aged 15 and above) Estimated number of opium addicts in Shan State 20,600 19,600 -5%
1 In 2005, no estimates were available for Kayah State and Sagaing Division, which had, respectively, 1,300 ha and 800 ha under opium poppy cultivation in 2004. 2 Official CCDAC statistics. 3 Last year’s estimates for the average opium price in 2004, as well as the 2004 potential farm gate value, have been updated with data collected during the 2005 Myanmar Opium Survey. 4 In 2004, as well as in 2005, the average number of people per household was 5

Myanmar Opium Survey 2005
3
EXECUTIVE SUMMARY
The 2005 Opium Poppy Survey in Myanmar was conducted jointly by the Myanmar Government and the United Nations Office on Drugs and Crime (UNODC). An extensive survey, combining the use of satellite images and ground verification was conducted in the Shan State, where most of the opium poppy cultivation takes place. In addition, a rapid assessment was conducted in Kachin state to assess the level of opium poppy cultivation in this area and monitor possible cultivation displacement. An opium free certification mission was also conducted again this year in Special Region 4.
Opium poppy cultivation
In 2005, the total area under opium poppy cultivation in Myanmar was estimated at 32,800 hectares, representing a decrease of 26% over the 44,200 hectares under cultivation in 2004. In 2005, the estimated area under opium poppy cultivation in the Shan State continued to decline in line with the trend already observed in previous years. Opium poppy cultivation in Myanmar has decreased by 75% since 1998, the year of the UNGASS: from 130,000 ha to 32,800 ha. Since 2002 –the year of the first joint GoUM/UNODC survey- opium poppy cultivation has fallen by 57%. While the country remains the second largest opium grower in the world, its share of world opium poppy cultivation fell slightly from 23% in 2004 to 21% in 2005.
Opium poppy cultivation in Myanmar 1990-2005
0
20,000
40,000
60,000
80,000
100,000
120,000
140,000
160,000
180,000
USG 150,100 160,000 153,700 165,800 146,600 154,070 163,000 155,150 130,300 89,500 108,700 105,000
GoUM-UNODC 81,400 62,200 44,200 32,800
1990 1991 1992 1993 1994 1995 1996 1997 1998 1999 2000 2001 2002 2003 2004 2005
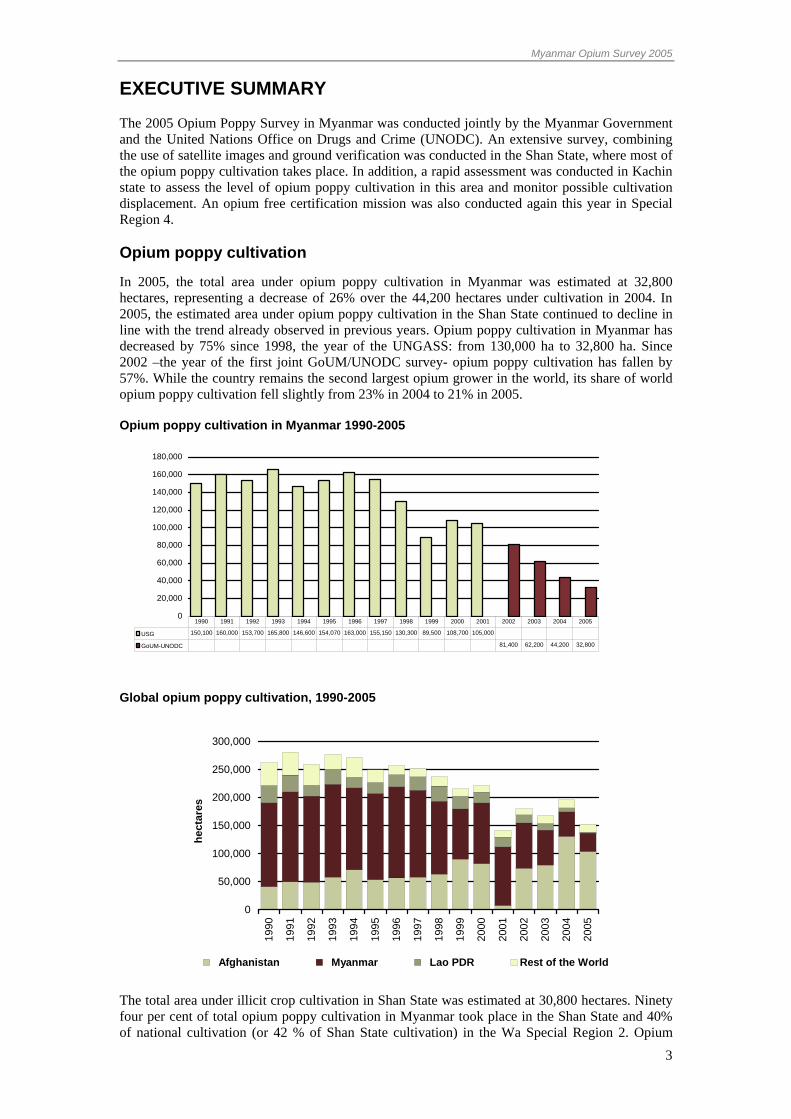
Global opium poppy cultivation, 1990-2005
0
50,000
100,000
150,000
200,000
250,000
300,000
1990
1991
1992
1993
1994
1995
1996
1997
1998
1999
2000
2001
2002
2003
2004
2005
hect
ares
Afghanistan Myanmar Lao PDR Rest of the World
The total area under illicit crop cultivation in Shan State was estimated at 30,800 hectares. Ninety four per cent of total opium poppy cultivation in Myanmar took place in the Shan State and 40% of national cultivation (or 42 % of Shan State cultivation) in the Wa Special Region 2. Opium

Myanmar Opium Survey 2005
4
poppy cultivation was reported in 20% of the villages surveyed in the Shan State and 50% of these were located in Wa Special Region 2. This year’s survey was conducted before the Wa authorities declared a total ban on opium poppy cultivation and trade on 26 June 2005.
A rapid assessment conducted in a randomly selected area in Kachin State showed that opium poppy cultivation in this State remains a concern. The area under cultivation was estimated at 2,000 hectares -- a slight hike compared to 2004. With the poppy ban in the Wa Region now in effect, opium poppy cultivation in this State could rise due to displacement effects – and therefore, despite the currently limited cultivation, there is a need for continued monitoring. Opium cultivation outside of the Shan and Kachin States, though marginal, remains a reality. In these areas, opium is used mainly for medicine or personal consumption. This year, no estimates were available for Kayah State and Sagaing Division.
No poppy could be found in Kokang Special Region 1, where cultivation has been banned since 2003. For the second consecutive year, a rapid assessment survey was conducted in Special Region No 4, confirming the opium free status declared in 1997. A rapid assessment was also conducted in East Shan State, along the Thai border. Opium poppy cultivation was not found at any of the surveyed sites, nor was it observed by surveyors while travelling across this region.
Opium yield and production
The weighted national average opium yield for 2005 was estimated at 9.5 kg/ha (against 8 kg/ha in 2004). Yields ranged from 5.4 kg in East Shan State to 13.4 kg in South Shan State, where additional rain and improved cultivation practices hiked yields. In 2005, the total estimated production of opium was around 312 metric tons, a 16% decrease compared to the previous year and a 76% decrease with respect to 1998. Although production continued to decrease in other areas, higher yields effectively doubled opium production this year in South Shan State.
Opium production 1996-2005 (in metric tons)
0
200
400
600
800
1,000
1,200
1,400
1,600
1,800
2,000
UNODC 1,791 1,583 1,664 1,760 1,676 1,303 895 1,087 1,097
UNODC-GoUM 828 810 370 312
1993 1994 1995 1996 1997 1998 1999 2000 2001 2002 2003 2004 2005
Global opium production 1990-2005 (metric tons)
0
1,000
2,000
3,000
4,000
5,000
6,000
1990
1991
1992
1993
1994
1995
1996
1997
1998
1999
2000
2001
2002
2003
2004
2005
met
ric to
ns
Afghanistan Myanmar Lao PDR Rest of the World

Myanmar Opium Survey 2005
5
Opium prices and trade
The average farm gate price of opium at harvest time was estimated at 187 US$/kg. This represents an increase of 22% compared to the average price reported by farmers for the year 2004. The opium price increases were distributed unevenly over the different regions. In the Wa Region, the opium price increased by only 8%, however in South Shan -where opium prices used to be lower- a 36 % increase was observed this year. A possible explanation for the different price levels could be the scarcity of opium and difficulties of trading opium near the Thai border this year.
Household income from opium cultivation
Higher opium prices in 2005 pushed incomes up 36% over previous year. Average annual cash income of an opium producing household was estimated at US$ 292.
Fifty two per cent of the income of opium producing households comes from opium itself, making farmers vulnerable to opium price fluctuations. Decreases in opium production –whether caused by drought, diseases or law enforcement – have a serious and immediate impact on household food security.
The average annual income of a non-opium producing household was estimated at US$ 364. The higher income level for non-opium producing households confirms that opium production is linked to poverty, which is exacerbated when opium addiction amongst males further reduces the productivity of households.
Addiction
In the survey area, opium addiction affected 0.57% of the adult population in 2005 (19,600 addicts in the Shan State). Within the same survey area, if one considers only villages where opium cultivation took place in 2005, the average level of addiction was 1.74%. This is significantly higher than in villages where opium is not cultivated, where the average level of opium addiction amounted to just 0.28%. ATS addiction was reported mainly in East Shan State and heroin addiction in North Shan State.
Eradication
Official reports from the Myanmar Government indicate that 3,907 ha of opium poppy were eradicated in 2005, an increase of 39% compared to 2004. In the Shan State the level of eradication remained similar to 2004, while it increased by more than 900% in the Kachin State (1,341 ha in 2005), reflecting an increase in government efforts to control opium poppy cultivation in this State.
Food security and assistance
Food insecurity (households facing a period of food shortage) was reported by 52% of the surveyed households. Food insecurity was more prevalent in Wa Special Region 2, which has received less external assistance in comparison with other regions. The majority of households (55%) reported a rice deficit of up to 3 months and 45% reported a deficit between 3-12 months. These levels of food deficits are high and explain the strong reliance on opium poppy cultivation in these communities.
Lack of income for food is among the main reasons reported by the farmers for growing opium poppy. 82% indicated that they cultivated opium poppy in order to obtain food (through purchase or barter). One fourth of the opium producing households indicate that they do not sell all of their opium, since they have addicts within their household.
While some external assistance had been delivered, farmers reported that it was not always suitable and not sufficient to sustain opium elimination. The main areas where delivered assistance did not match requested assistance were (alternative) crop production and animal husbandry.

Myanmar Opium Survey 2005
6

Myanmar Opium Survey 2005
7
1. INTRODUCTION
This report presents the results of the fourth consecutive opium survey, conducted annually in Myanmar by the Central Committee for Drug Abuse Control (CCDAC), with the support and participation of UNODC. UNODC started to carry out extensive yearly surveys following a pilot survey in 2001. These surveys are implemented in the framework of the UNODC Illicit Crop Monitoring Programme and use a combination of satellite images and ground verification to provide the most accurate and objective estimate of the area under opium poppy cultivation. Related socio economic data are collected through village surveys.
The objectives of the UNODC Illicit Crop Monitoring programme are two-fold:
• to establish methodologies for data collection and analysis, so as to increase the government’s capacity to monitor illicit crops, and
• to assist the international community in monitoring the extent and evolution of these crops in the context of the elimination strategy adopted by the Member States at the General Assembly Special Session on Drugs in June 1998.
In 1999, the Myanmar Government and local authorities of drug-production areas decided to engage in a 15 year plan to eliminate opium production in the country by the year 2014.
UNODC joined in the effort with an alternative development programme that started in the Special Regions 4 and 2 of the East Shan State and later extended to the Kokang region. Annual opium surveys enable UNODC to monitor the evolution of opium production in the country, and to evaluate the extent to which alternative development programmes and law enforcement actions are successful.
The vast majority of Myanmar’s opium is produced in the Shan State, a part of the notorious Golden Triangle, which is located in the northeast of Myanmar and shares borders with China, Laos and Thailand. One of the seven states and seven divisions constituting the Union of Myanmar, the Shan State covers some 155,000 km2, making it roughly equal in size to Bangladesh.
With ethnic minority groups accounting for about one third of the population, Myanmar is one of the most ethnically diverse countries in the world. Following independence in 1948, some of the ethnic groups struggled for autonomy from the central government, leading to a number of prolonged armed conflicts. These conflicts were concentrated primarily in the border regions, which are home to a large number of ethnic minority groups. It was during this time of conflict that opium cultivation in the Shan State grew exponentially, as drug profits financed fighting and strategic alliances.
In the 1980s, Myanmar was the world’s largest producer of illicit opium, with an average production of about 700 metric tons of opium per year between 1981 and 1987. For the following ten years, until 1996, Myanmar’s opium production continued to increase, reaching an annual average production of 1,600 metric tons. Afghanistan’s opium production grew even faster during this period and the country replaced Myanmar as the world’s largest producer of opium in 1991. Nonetheless, the differences in opium poppy varieties, growing methods and climatic conditions resulted in higher yields in Afghanistan and the area under cultivation in Myanmar remained larger than that of Afghanistan until 2003.
The drug control context in Myanmar changed with the military hand-over in 1988. The new government sought to bring stability to the Union of Myanmar. Between 1988 and 1996, the government signed 17 ceasefire agreements with various ethnic groups, granting them different degrees of autonomy and self-governance. As ethnic minorities became more integrated into the Union of Myanmar, the government was able to assert some degree of control, and local authorities agreed to phase out poppy cultivation. The first visible result of this was the surrender of the notorious drug lord Khun Sa and his Mong Tai Army to government forces in 1996. In April 2002, the Kokang and Wa ethnic leaders, whose regions account for most of Myanmar’s opium cultivation, reiterated their commitment to make their territories (the Kokang Region and Wa Region) opium-free, by the year 2003 and July 2005 respectively.

Myanmar Opium Survey 2005
8
Opium cultivation in Myanmar has since declined rapidly: last year, the area under cultivation stood at 44,200 ha – a decline of 73% from its peak in 1996. In the same year the government reported the eradication of 2,820 ha opium poppy: more than four times the amount of hectares eradicated in 2003 (638 ha).
Although Myanmar has managed to reduce opium cultivation, widespread poverty, porous borders, limited control over the border areas and lawlessness all stimulate a thriving unrecorded cross-border economy. The region has yet to develop and ensure alternative livelihoods or even basic levels of food security for its communities. The 2003 opium ban in the Kokang region had a significantly detrimental effect on the local economy and well being of the local population. The same is expected starting in June 2005 when a similar ban takes effect in the Wa region, the most important opium-producing region in Myanmar and home to 400,000 people. Annual opium surveys remain essential to measuring the effectiveness of the country’s opium bans, their implications for the local communities, as well as to detect any possible displacement of opium cultivation to other parts of the country.
An in-depth socio-economic survey was planned for 2005. The survey was to look at the impact of reduced opium poppy cultivation in Shan State in order to gain greater knowledge and insight into the motivations, decision making, and socio economic context of farmers. An important objective was to look into how it might be possible to help farmers reduce and/or stop their production and communities cope with the impacts of that. Unfortunately, security issues linked to changes at the highest levels of government limited travel in the areas to be surveyed forcing its postponement. Regular village survey activities and ground verification continued despite some limitations. International staff were unable to go to the Shan State from January 22 through April 3 and even travel of national staff to conduct and monitor the survey was not always possible. The present reports presents the best possible information gathered within these extenuating circumstances.
Low yielding opium poppy in Shan State

Myanmar Opium Survey 2005
9
2. FINDINGS
2.1 Opium poppy planted area
To estimate the area under opium poppy cultivation, the 2005 Myanmar Opium Survey combined satellite imagery and a sample-based village ground assessment. While the Special Region No.2 (Wa Region) was fully covered by 10-meter resolution imagery, very high resolution (2.8 meter) imagery of selected sample sites was used to estimate the opium poppy area in East and South Shan State. Opium poppy cultivation in North Shan and other areas of interest was estimated based on ground assessments.
In 2005, an estimated of 32,800 ha of opium poppy was cultivated in Myanmar, compared to 44,200 ha in 2004 – a decrease of 26%. Ninety four per cent of total opium poppy cultivation in Myanmar took place in the Shan State. Forty per cent of national cultivation (or 42 % of Shan State cultivation) took place in Wa Special Region 2. The area under illicit crop cultivation in Shan State was estimated at 30,800 hectares, ranging from 23,600 to 33,500 hectares. Rapid assessments indicated that no cultivation occurred in areas previously declared poppy free. In Kachin State, an estimated 2,000 ha were under opium poppy cultivation, a slight increase compared to last year’s 1,100 ha.
Figure 1: Opium poppy cultivation in Myanmar 1990-2005
0
20,000
40,000
60,000
80,000
100,000
120,000
140,000
160,000
180,000
USG 150,100 160,000 153,700 165,800 146,600 154,070 163,000 155,150 130,300 89,500 108,700 105,000
GoUM-UNODC 81,400 62,200 44,200 32,800
1990 1991 1992 1993 1994 1995 1996 1997 1998 1999 2000 2001 2002 2003 2004 2005
Table 1: Opium poppy planted area estimate in the union of Myanmar in 2005
Administrative Region
2004 Opium poppy
cultivation (ha)
2005 Opium poppy
cultivation (ha)
2005 % of total area under
opium poppy cultivation
Shan State 41,000 30,800 94% Kachin State 1,100 2,000 6% Sagaing Division 800 n.a. Kayah State 1,300 n.a. Total 44,200 32,800
Opium poppy cultivation in Myanmar has decreased by 75% since 1998, the year of the UNGASS: from 130,000 ha to 32,800 ha. Since 2002 –the year of the first joint GoUM/UNODC survey- opium poppy cultivation has fallen by 57%. While the country remains the second largest opium grower in the world, its share of world opium poppy cultivation fell slightly from 23% in 2004 to 21% in 2005.
Myanmar Opium Survey 2005
10
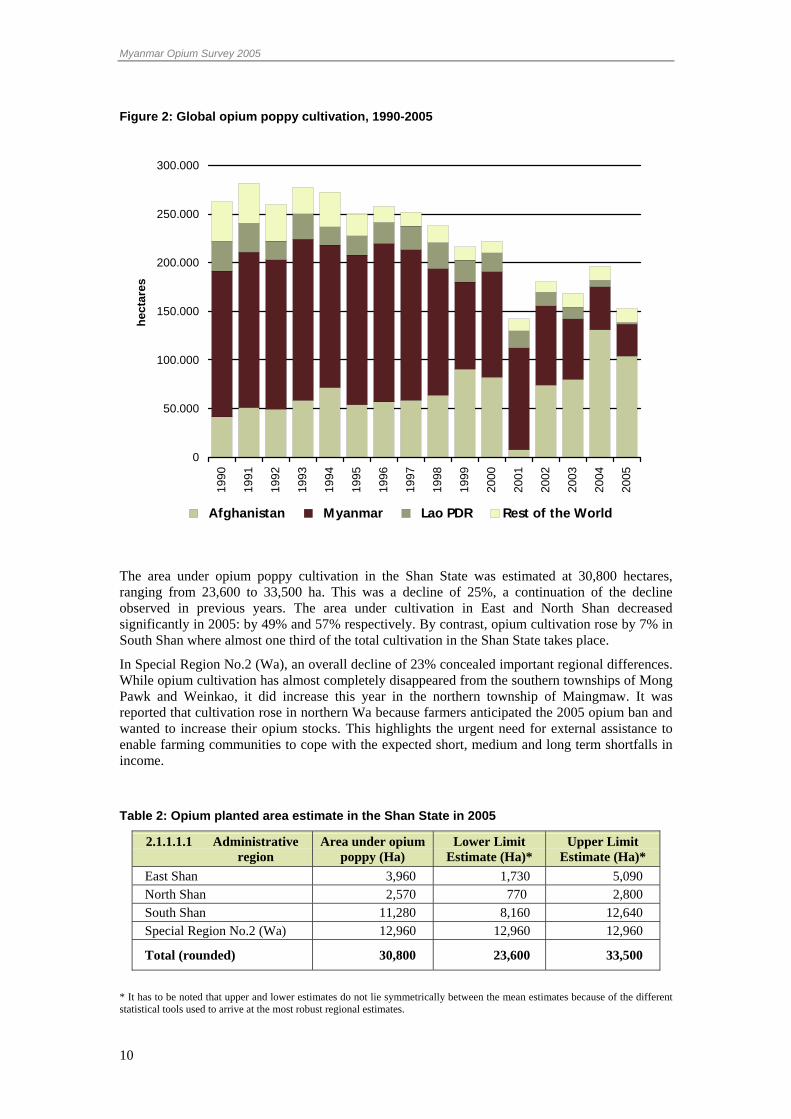
Figure 2: Global opium poppy cultivation, 1990-2005
0
50.000
100.000
150.000
200.000
250.000
300.000
1990
1991
1992
1993
1994
1995
1996
1997
1998
1999
2000
2001
2002
2003
2004
2005
hect
ares
Afghanistan Myanmar Lao PDR Rest of the World
The area under opium poppy cultivation in the Shan State was estimated at 30,800 hectares, ranging from 23,600 to 33,500 ha. This was a decline of 25%, a continuation of the decline observed in previous years. The area under cultivation in East and North Shan decreased significantly in 2005: by 49% and 57% respectively. By contrast, opium cultivation rose by 7% in South Shan where almost one third of the total cultivation in the Shan State takes place.
In Special Region No.2 (Wa), an overall decline of 23% concealed important regional differences. While opium cultivation has almost completely disappeared from the southern townships of Mong Pawk and Weinkao, it did increase this year in the northern township of Maingmaw. It was reported that cultivation rose in northern Wa because farmers anticipated the 2005 opium ban and wanted to increase their opium stocks. This highlights the urgent need for external assistance to enable farming communities to cope with the expected short, medium and long term shortfalls in income.
Table 2: Opium planted area estimate in the Shan State in 2005
2.1.1.1.1 Administrative region
Area under opium poppy (Ha)
Lower Limit Estimate (Ha)*
Upper Limit Estimate (Ha)*
East Shan 3,960 1,730 5,090 North Shan 2,570 770 2,800 South Shan 11,280 8,160 12,640 Special Region No.2 (Wa) 12,960 12,960 12,960
Total (rounded) 30,800 23,600 33,500
* It has to be noted that upper and lower estimates do not lie symmetrically between the mean estimates because of the different statistical tools used to arrive at the most robust regional estimates.

Myanmar Opium Survey 2005
11
Table 3: Opium poppy planted area estimate in the Shan State in 2004 and 2005.
Administrative region 2004 Estimated planted area (Ha)
2005 Estimated planted area (Ha) Variation (%)
East Shan 7,750 3,960 -49%North Shan 6,000 2,570 -57%South Shan 10,500 11,280 7%Special Region No.2 (Wa) 16,750 12,960 -23%Total (rounded) 41,000 30,800 -25%
Figure 3: Variation in opium poppy planted area in the Shan State, 2002-2005
-
5.000
10.000
15.000
20.000
25.000
30.000
35.000
40.000
East Shan North Shan South Shan Special Region No.2(Wa)
Ha
2002 2003 2004 2005
Poppy fields in a Wa village

Myanmar Opium Survey 2005
12
Terraces of opium poppy in Wa Special Region 2
Cultivation outside of the Shan State
The 2005 Myanmar survey did not cover marginal growing areas outside of the Shan State. In Sagaing Division, Chin State and the Kayah State opium poppy cultivation and eradication, though marginal, remains a reality. Opium cultivated in these areas is mainly used for medical purposes and personal consumption, there are no indications of any inter-regional trafficking. In Chin State no information was available for establishing an estimate. Opium poppy cultivation was also reported in the three townships of Loikaw, Demawso and Pruso in Kayah State, bordering South Shan State. Practical and resource constraints prevented UNODC from conducting a survey in this area. In Sagaing Division, opium poppy cultivation is minimal and mostly confined to the North (Lahe and Nan Yun Townships), where local people smoke the drug for traditional and therapeutic reasons. External trading of opium is rare.
Due to logistical constraints a rapid assessment was conducted in only two townships in Kachin State. Randomly chosen aerial photography taken in December 2004 was used to verify the situation on the ground. The proportion of opium poppy fields was measured and used to estimate land under cultivation in these townships. In Chipwe Township no poppy fields were found. In Waingmaw Township (Sadone area) an estimated 1,613 ha of opium poppy cultivation took place. It is not possible to say whether this level of cultivation was representative of other townships. However, eradication details reported by the Government indicate that it could be. Based on the findings of the rapid assessment and considering the level of eradication in each township, the total area under opium poppy cultivation in Kachin State was estimated to be 2,000 ha in 2005. The slight increase in opium cultivation, as well as increased eradication as compared to 2004, indicate that opium poppy cultivation in Kachin State should be closely monitored. A more comprehensive survey needs to be conducted in 2006 to confirm these estimates.
In the Special Region 4 a rapid assessment survey found no opium poppy cultivation, continuing the opium free status of the region declared in 1997.
A rapid assessment conducted in the Southern part of the East Shan State (including townships of Tachileik, Maing Sat, Maing Tong), an area under Wa control bordering Myanmar and Thailand, found no evidence of opium poppy cultivation. Large plantations of fruit trees and other agriculture exist in this area.

Myanmar Opium Survey 2005
13
Map 1:

Myanmar Opium Survey 2005
14
Map 2:
!
!
!
!
!
!!
!
!
!
!
!
!
!!
!!
!
!
!!
!
!
!
!
!!
!
!
!
!
!
!
!
!!
!
!
!
!
!
!
!
!
!
!
!
!
!
!
!
!
!
!
!
!
!
!
!!
!
!
!
!
!
!
!
!
!
!
!
!
!
!
! !
!!
!
!
!
!
!
!
!
!
!
!
!
!
!
!
!
!
!!
!!!
!
!
!
!
!!
!!
!
!
!
!
!
!
!
!
!
!!
!
!
!
!
!
!
!
!
!
!
!
!
!
!!
!!
!
!
!
!
!
!
!
!
!
!
!
!
!
!
!
!!
!
!
!
!
!
!
!
!
!
!
!
!
!
!
!
!
!
!
!
!
!
!
! !
!!
!
!
!
!
!
!
!
!
!
!!
Hotao
Na Wi
Nam Pai
Metmang
Man Tun
Nam Tit
Mong Kar
Ai' Chun
Long Tan
Hkwin Ma
Saun Hpa
Pang Yan
Yin Pang
Ling Haw
MongPhenMong Pawk
Yaung Lin
Pang Kham
Nar Kaung
Naung KhitNam Kham Wu
Ka LaungPa
Man ManHsain
Kaung Ming Sang
98°30'E
98°30'E
99°0'E
99°0'E 99°30'E
99°30'E
22°0
'N
22°0
'N
23°0
'N
23°0
'N
Regional boundaries
Township boundaries
International boundaries
Special region 2 (Wa)
North Shan CHINA
!
!
!
!
Myanmar(Burma)
S.R. 2 (Wa)
East Shan
0 10 20 30 405km
UTM projection, WGS84
Opium poppy cultivation density in special region 2 (Wa), Myanmar, 2005
Pangkham
Source: Government of Myanmar - National monitoring system supported by UNODCThe boundaries and names shown and designations used on this map do not imply official endorsement or acceptance by the United Nations.
Cultivation density*(ha/km²)
0.1 - 1.01.1 - 2.52.6 - 5.05.1- 10.0> 10.0
* calculated as a fraction of poppy cultivation area to the total area

Myanmar Opium Survey 2005
15
Map 3:
Three dimensional view of a SPOT5 satellite image
Part of a SPOT5 image taken on 25th of January 2005
3D rendered SPOT5 image in false colour illustrating the vegetation in red and bare soil in green. Opium poppy fields appear violet.

Myanmar Opium Survey 2005
16
Surveyors in poppy field in Kachin State
Farmers and villages involved in poppy cultivation
Based on an estimated average area under opium cultivation of 0.17 ha per household and a total cultivation of 32,800 hectares, an estimated 193,000 households were involved in opium poppy cultivation in Myanmar in 2005. Of these, 76,500 were in the Wa region. The number of households decreased by 26%, or 67,000 households, as compared to 2004. With opium formerly covering more than half of their average yearly income, these households will need to seek alternative livelihoods.
The ground survey revealed that opium poppy cultivation takes place in 20% (2,177) of all villages in the Shan State. Almost half of these villages are located in the Wa region, where 74% of all villages reported opium cultivation.
Table 4: Estimated number of villages growing poppy in 2005 in the Shan State
Region Total number of villages
Number of villages growing poppy
As % of total number of villages
East Shan 2,616 302 12%
North Shan 3,458 380 11%
South Shan 3,124 463 15%
S.R. 2 (Wa) 1,390 1,032 74%
Total Shan State 10,588 2,177 20 %
Myanmar Opium Survey 2005
17
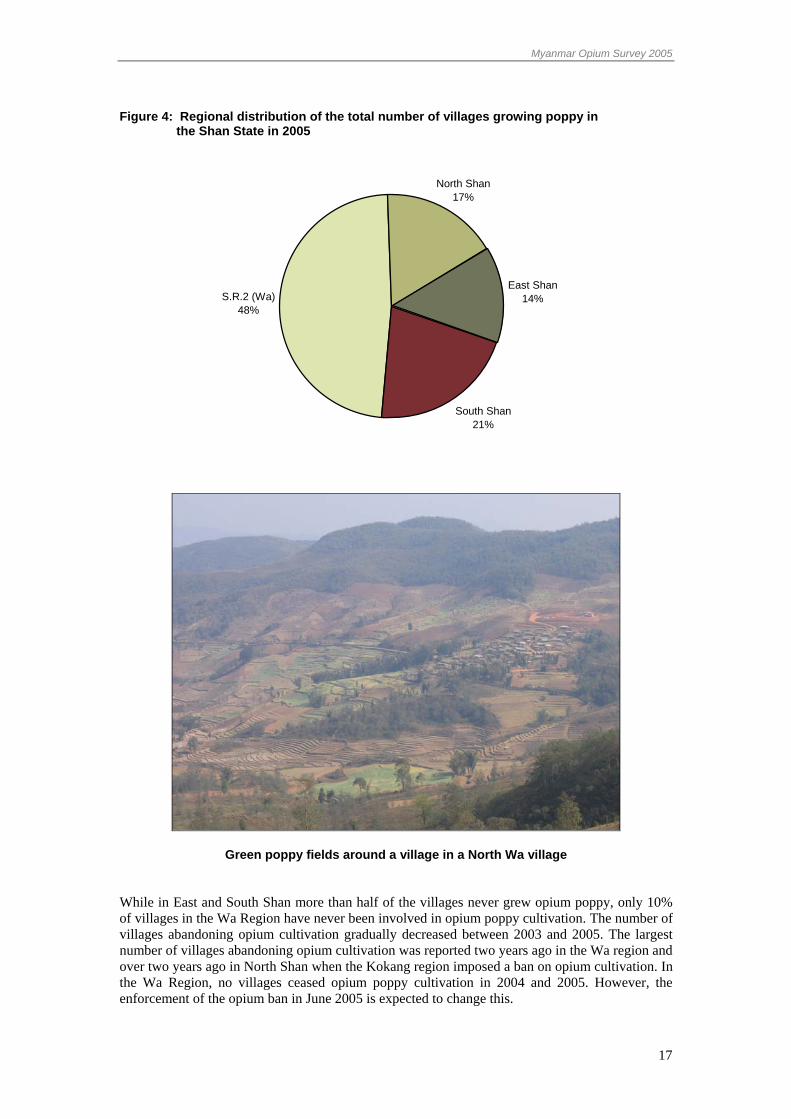
Figure 4: Regional distribution of the total number of villages growing poppy in the Shan State in 2005
S.R.2 (Wa)48%
East Shan14%
South Shan21%
North Shan17%
Green poppy fields around a village in a North Wa village
While in East and South Shan more than half of the villages never grew opium poppy, only 10% of villages in the Wa Region have never been involved in opium poppy cultivation. The number of villages abandoning opium cultivation gradually decreased between 2003 and 2005. The largest number of villages abandoning opium cultivation was reported two years ago in the Wa region and over two years ago in North Shan when the Kokang region imposed a ban on opium cultivation. In the Wa Region, no villages ceased opium poppy cultivation in 2004 and 2005. However, the enforcement of the opium ban in June 2005 is expected to change this.
Myanmar Opium Survey 2005
18
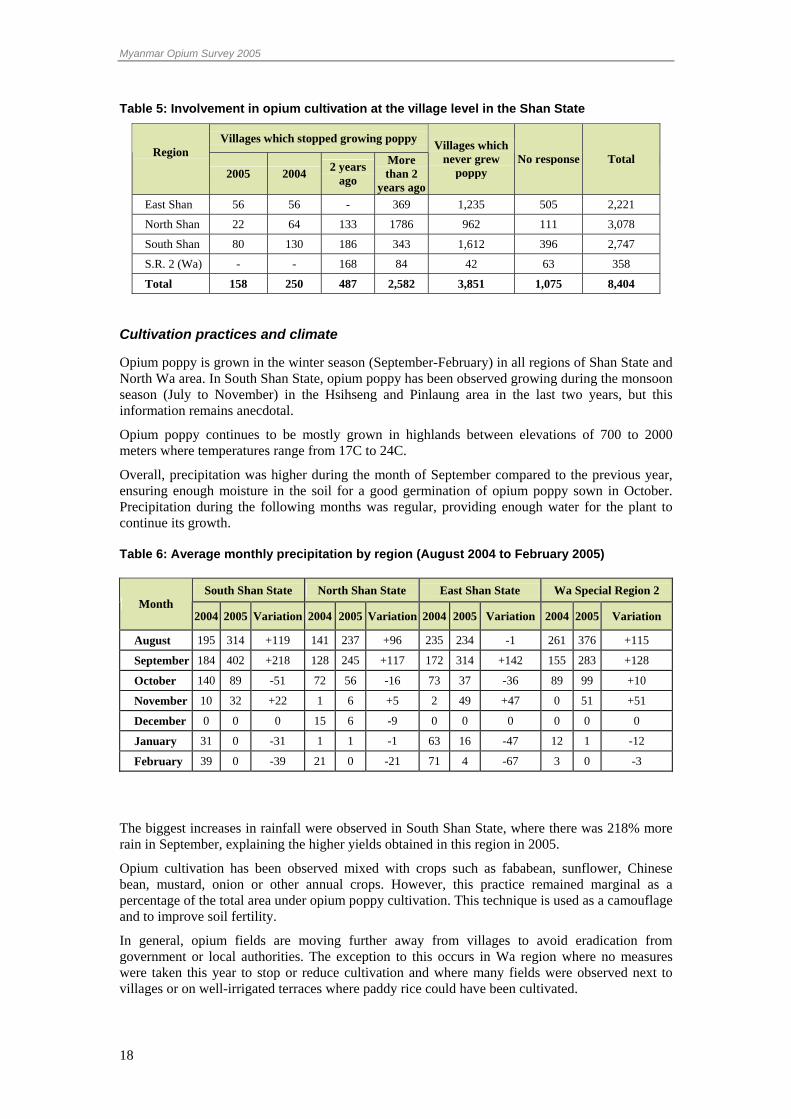
Table 5: Involvement in opium cultivation at the village level in the Shan State
Villages which stopped growing poppy Region
2005 2004 2 years ago
More than 2
years ago
Villages which never grew
poppy No response Total
East Shan 56 56 - 369 1,235 505 2,221
North Shan 22 64 133 1786 962 111 3,078
South Shan 80 130 186 343 1,612 396 2,747
S.R. 2 (Wa) - - 168 84 42 63 358
Total 158 250 487 2,582 3,851 1,075 8,404
Cultivation practices and climate
Opium poppy is grown in the winter season (September-February) in all regions of Shan State and North Wa area. In South Shan State, opium poppy has been observed growing during the monsoon season (July to November) in the Hsihseng and Pinlaung area in the last two years, but this information remains anecdotal.
Opium poppy continues to be mostly grown in highlands between elevations of 700 to 2000 meters where temperatures range from 17C to 24C.
Overall, precipitation was higher during the month of September compared to the previous year, ensuring enough moisture in the soil for a good germination of opium poppy sown in October. Precipitation during the following months was regular, providing enough water for the plant to continue its growth.
Table 6: Average monthly precipitation by region (August 2004 to February 2005)
The biggest increases in rainfall were observed in South Shan State, where there was 218% more rain in September, explaining the higher yields obtained in this region in 2005.
Opium cultivation has been observed mixed with crops such as fababean, sunflower, Chinese bean, mustard, onion or other annual crops. However, this practice remained marginal as a percentage of the total area under opium poppy cultivation. This technique is used as a camouflage and to improve soil fertility.
In general, opium fields are moving further away from villages to avoid eradication from government or local authorities. The exception to this occurs in Wa region where no measures were taken this year to stop or reduce cultivation and where many fields were observed next to villages or on well-irrigated terraces where paddy rice could have been cultivated.
South Shan State North Shan State East Shan State Wa Special Region 2 Month
2004 2005 Variation 2004 2005 Variation 2004 2005 Variation 2004 2005 Variation
August 195 314 +119 141 237 +96 235 234 -1 261 376 +115
September 184 402 +218 128 245 +117 172 314 +142 155 283 +128
October 140 89 -51 72 56 -16 73 37 -36 89 99 +10
November 10 32 +22 1 6 +5 2 49 +47 0 51 +51
December 0 0 0 15 6 -9 0 0 0 0 0 0
January 31 0 -31 1 1 -1 63 16 -47 12 1 -12
February 39 0 -39 21 0 -21 71 4 -67 3 0 -3

Myanmar Opium Survey 2005
19
2.2 Yield and production
The average national opium yield was estimated at 9.5 kg/ha, based on capsule measurements in the field. Given local variation, this yield is comparable to last year’s estimate of 8 kg/ha.
The estimates for the potential opium yield in 2005 ranged from 5.4 kg/ha in East Shan State to 13.4 kg/ha in South Shan State, averaging 9.5 kg/ha for the whole Shan State. Increased rainfall and the use of irrigation and fertilizer improved opium yields in South Shan State.
In regions where no formal yield measurements were made the average yields measured in the Shan State region were used in calculating the production potential.
Table 7: Yield and potential production by administrative regions (2005)
Based on the regional cultivation and yield estimates, 312 metric tons of opium were potentially produced in 2005 -- 16% lower than last year’s estimate of 370 metric tons. The declining production trend slowed down this year mainly due to an increase of opium poppy cultivation and production in South Shan State, which offset decreases observed in other regions of Shan State. Since 1998, opium production in Myanmar has declined by 76%, from 1,303 to 312 metric tons.
While the Wa region has the largest area under cultivation, it generates only 30% of Myanmar’s total opium production. Opium production in North and East Shan has continued to decrease in 2005 to 25 (8%) and 21 (7%) metric tons respectively. Opium production in South Shan State doubled as compared to 2004 from 74 to 151 metric tons. Opium production in South Shan State is now 48% of Myanmar’s total production.
In 2005, Myanmar’s share of global opium production fell slightly from 8% in 2004 to 7% in 2005.
Figure 5: Opium production 1996-2005 (in metric tons)
0200400600800
1,0001,2001,4001,6001,8002,000
UNODC 1,791 1,583 1,664 1,760 1,676 1,303 895 1,087 1,097
UNODC-GoUM 828 810 370 312
1993 1994 1995 1996 1997 1998 1999 2000 2001 2002 2003 2004 2005
Administrative unit Yield (kg/ha) Potential production(metric tons)
North Shan 9.7 25
South Shan 13.4 151
East Shan 5.4 21
Special Region 2 (Wa) 7.4 96
Shan State total (weighted yield) 9.5 293
Others 9.5 19
National total 9.5 312

Myanmar Opium Survey 2005
20
Figure 6: Global opium production 1990-2005 (metric tons)
0
1.000
2.000
3.000
4.000
5.000
6.000
1990 1991 1992 1993 1994 1995 1996 1997 1998 1999 2000 2001 2002 2003 2004 2005
met
ric to
ns
Afghanistan Myanmar Lao PDR Rest of the World
Poor poppy field in Wa
Irrigated poppy field in Kachin

Myanmar Opium Survey 2005
21
Map 4:
Myanmar Opium Survey 2005
22
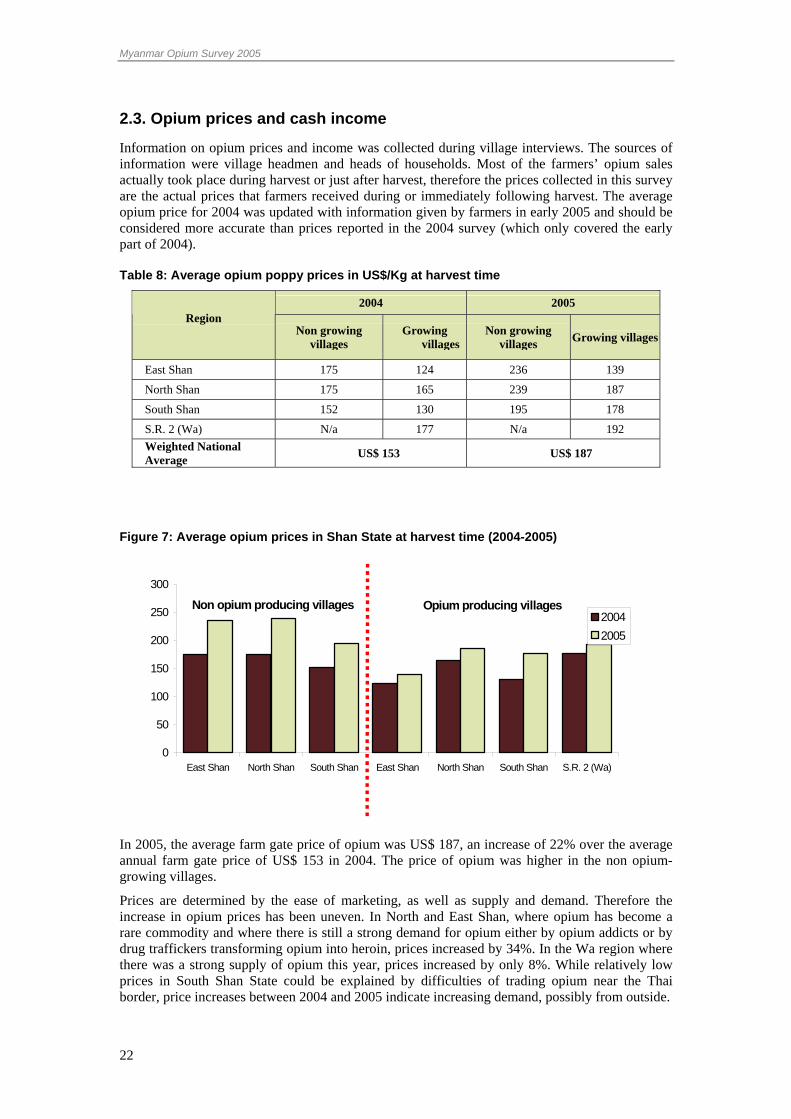
2.3. Opium prices and cash income
Information on opium prices and income was collected during village interviews. The sources of information were village headmen and heads of households. Most of the farmers’ opium sales actually took place during harvest or just after harvest, therefore the prices collected in this survey are the actual prices that farmers received during or immediately following harvest. The average opium price for 2004 was updated with information given by farmers in early 2005 and should be considered more accurate than prices reported in the 2004 survey (which only covered the early part of 2004).
Table 8: Average opium poppy prices in US$/Kg at harvest time
2004 2005 Region
Non growing villages
Growing villages
Non growing villages Growing villages
East Shan 175 124 236 139
North Shan 175 165 239 187
South Shan 152 130 195 178
S.R. 2 (Wa) N/a 177 N/a 192 Weighted National Average US$ 153 US$ 187
Figure 7: Average opium prices in Shan State at harvest time (2004-2005)
0
50
100
150
200
250
300
East Shan North Shan South Shan East Shan North Shan South Shan S.R. 2 (Wa)
20042005
Non opium producing villages Opium producing villages
In 2005, the average farm gate price of opium was US$ 187, an increase of 22% over the average annual farm gate price of US$ 153 in 2004. The price of opium was higher in the non opium-growing villages.
Prices are determined by the ease of marketing, as well as supply and demand. Therefore the increase in opium prices has been uneven. In North and East Shan, where opium has become a rare commodity and where there is still a strong demand for opium either by opium addicts or by drug traffickers transforming opium into heroin, prices increased by 34%. In the Wa region where there was a strong supply of opium this year, prices increased by only 8%. While relatively low prices in South Shan State could be explained by difficulties of trading opium near the Thai border, price increases between 2004 and 2005 indicate increasing demand, possibly from outside.

Myanmar Opium Survey 2005
23
Based on a potential opium production of 312 metric tons and an average farm gate price of US $187, the total farm gate value of opium production in Myanmar in 2005 was estimated to be Kyats 58 billion or US$ 58 million, equivalent to about 0.7% of the country’s GDP5.
An indication of the 2005 opium price can also be derived from the monthly prices collected by the WADP on the Mong Pawk market. As in previous years, prices obtained from the Mong Pawk market remain higher compared to the rest of Shan State. Mon Pawk prices show a sharp increase in the first months of 2005 and a continued rise in prices since 2003. This is in line with the general reduction of opium production in Myanmar, which is not matched by a decrease in demand (within the country and in the region). Also, part of the increase could be due to farmers and traders anticipating a shortage of opium and speculating on higher demand for opium.
Table 9: Opium price trend in Shan State and Mong Pawk market 2002-2005
Year Jan Feb Mar Apr May Jun July Aug Sept Oct Nov Dec AVG.1999 172 97 110 125 136 123 133 152 119 173 144 163 137 2000 195 193 203 172 236 226 202 230 210 210 203 218 208 2001 234 215 193 204 187 181 194 195 186 162 149 150 188 2002 158 136 124 119 108 107 124 132 126 126 144 158 130 2003 165 126 117 128 132 138 146 139 137 146 152 155 140 2004 155 151 215 214 219 218 202 205 176 176 230 273 203 2005 204 211 213 225 252 300 234
Table 10: Trend line of the Mong Pawk Market opium price monitor, 1999-2005 (US$/kg)
0
50
100
150
200
250
300
Jan-
99
May
-99
Sep
-99
Jan-
00
May
-00
Sep
-00
Jan-
01
May
-01
Sep
-01
Jan-
02
May
-02
Sep
-02
Jan-
03
May
-03
Sep
-03
Jan-
04
May
-04
Sep
-04
Jan-
05
May
-05
US$
5 Economic Intelligence Unit, August 2005, Country Report Myanmar, Myanmar GDP 2004 = 7,846.8 bn Kyat (US$ 8.6 bn)

Myanmar Opium Survey 2005
24
Table 11: Annual average and monthly opium price in Mong Pawk
December to June Annual Average
Month 2004 2005
1999 137 December 155 273 2000 208 January 155 204 2001 188 February 151 211 2002 131 March 216 213 2003 140 April 214 225 2004 203 May 219 252
2005 234 June 218 300
Average 190 240
Figure 8: Annual average and monthly price from december to may 2005 in Mong Pawk
137
208188
131 140
203
234
190
240
0
50
100
150
200
250
300
1999 2000 2001 2002 2003 2004 2005
Family Income
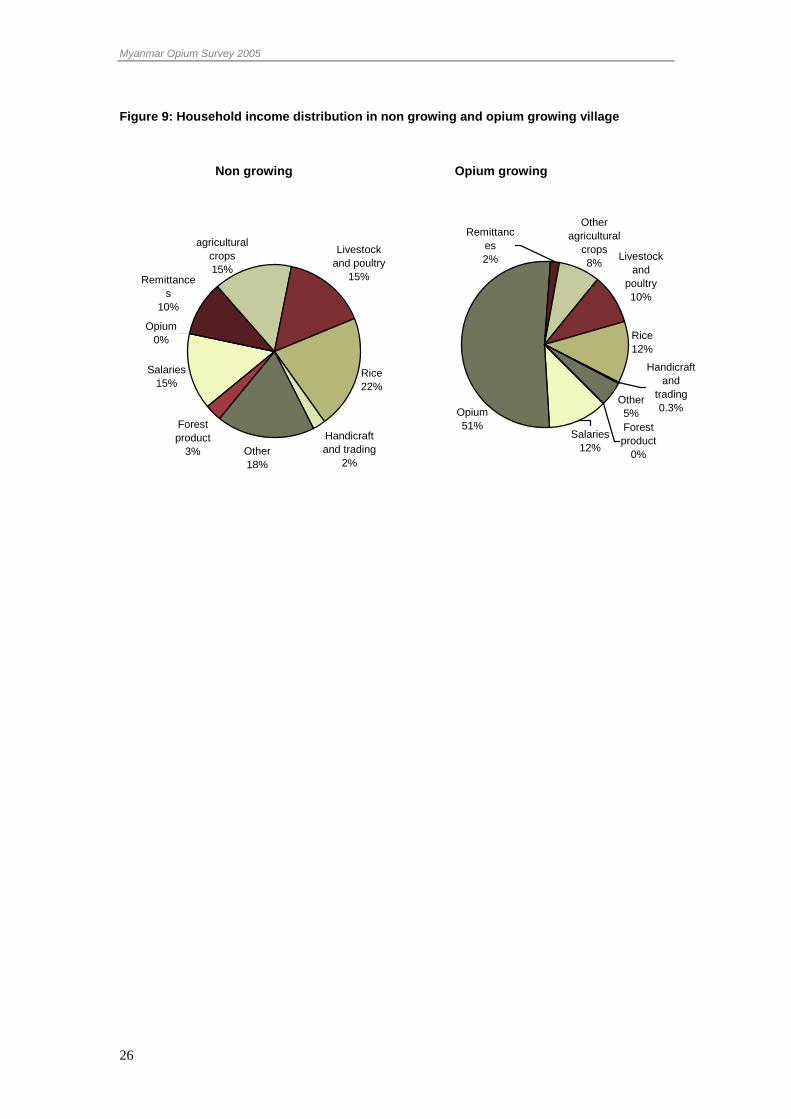
The average annual cash income of an opium producing household was estimated at US$ 292. This represents an increase of 36% over the previous year. With 52% of household derived from opium, farmers are extremely vulnerable to any decrease in opium production. The average annual income of a non-opium producing household was estimated at US$ 364, or 20% higher than opium growing households. This confirms that opium production is linked to poverty, which is exacerbated when opium addiction removes male household members from income generating activities.
Opium growing households do not grow enough rice or other crops, have few or no livestock and get significantly less income from remittances. When households are dependent on opium poppy cultivation, their ability to earn income from other sources is reduced, since opium poppy cultivation is very labour intensive. Their income from forest products, handicraft and trading is also lower because there is less labour available for other activities.
Annual Average December to June

Myanmar Opium Survey 2005
25
Table 12: Household income for opium growing and non growing villages
Average Household Income Source of Income
In Non-opium Growing Villages
In Opium Growing Villages
Salaries 53 34 Rice 77 35 Remittances 37 5 Other agricultural crops 54 24 Livestock and poultry 56 28 Opium 0 152 Handicraft and trading 9 1 Forest product 11 0 Other 67 14 Total 364 293
Wa children collecting forest products
Myanmar Opium Survey 2005
26
Figure 9: Household income distribution in non growing and opium growing village
Non growing Opium growing
Salaries15%
Remittances
10%
Rice22%
Handicraft and trading
2%
Forest product
3%
Opium0%
agricultural crops15%
Other18%
Livestock and poultry
15%
Opium51%
Other5%
Livestock and
poultry10%
Other agricultural
crops8%
Rice12%
Salaries12%
Forest product
0%
Remittances2%
Handicraft and
trading0.3%

Myanmar Opium Survey 2005
27
2.4 Addiction
Opium consumption is closely linked to opium production. Village headmen reported that daily opium addiction was prevalent in only 79 out of 471 villages surveyed. In villages where opium cultivation took place in 2005, the average level of addiction was 1.74% and thus significantly higher than in non-producing villages where the average level of opium addiction was reported to be only 0.28%. The overall addiction prevalence rate was 0.57% of the population aged 15 and above. This is about the same prevalence rate of opium addiction as reported in the 2004 opium survey (0.61%) and the 2003 survey (0.63%).
Table 13: Opium addiction in the Shan State in 2005, as reported by headmen
Villages grouping Number of
villages sampled
Total population above 15 years
old
Number of addicts
% of Opium addicts in
population age 15 and above
Villages growing opium 148 17,566 306 1.74 %
Villages non-growing opium 323 69,744 194 0.28 %
Total villages sampled 471 87,310 500 0.57 %
Table 14: Opium addicts among adult population
Adult population Opium addicts Administrative Region
Total Men Women Men Women Total
East Shan 15,176 7,572 7,604 167 2.21% 41 0.54% 208 1.37%
North Shan 30,337 14,467 15,870 81 0.56% 6 0.04% 87 0.29%
South Shan 35,414 16,603 18,811 148 0.89% 4 0.02% 152 0.43%
Wa 6,383 3,100 3,283 41 1.32% 12 0.37% 53 0.83%
Total 87,310 41,742 45,568 437 1.05% 63 0.14% 500 0.57%
Opium smoking in the Shan State is mainly a male phenomenon -- prevalence is 1.05% among males vs. 0.14% among females. As in 2004, 87% of the addicts population is male. This year’s survey identified child addicts for the first time – 16 in two villages of East Shan State.
Opium addiction continues to be high in East Shan State (1.37% of adult population) which had the highest opium addiction rates. Rates of addiction are slightly above average in the Wa region (0.83%) and relatively low in the South Shan State (0.43%) and North Shan State (0.29%).

Myanmar Opium Survey 2005
28
Figure 10: Prevalence of opium addiction of population aged 15 and above in the Shan State in 2003,2004 and 2005
0.63% 0.61% 0.57%
0.00%
0.10%
0.20%
0.30%
0.40%
0.50%
0.60%
0.70%
2003 2004 2005
The overall number of opium addicts in the Shan State is estimated to slightly over 19,600 people (out of about 4.9 million people)6, a 5% decrease compared to 2004 (20,600 addicts). These results should be interpreted with caution, as there might be a reluctance of respondents to report opium addiction in the context of the Government’s effort to curb it.
Other addiction
Among the total addict population, 74% reported opium addiction, 15% heroin addiction and 11% ATS addiction.
ATS addiction was reported mainly in East Shan State (0.43% of total population) and was lower in South Shan State and Wa region -- 0.04% and 0.03% of the total population respectively.
Heroin addiction was reported mainly in North Shan State (0.26% of the total population) and at a lower rate in South Shan State and Wa region (0.06% and 0.03%). In East Shan State, heroin addiction was minimal at only 0.01% of the total population.
Table 15: Number and percentage of addicts by type of drugs in the sample
Type of Addiction Number of Persons % as of total addiction
Total addiction 695 100%
Opium addicts 516 74%
Heroin addicts 106 15%
ATS addicts 81 11%
Table 16: Number and percentage of heroin and ATS addicts by region
Administrative Region Heroin addicts ATS addicts East Shan Sate 2 0.01% 66 0.43% North Shan State 79 0.26% 0 0.00% South Shan State 23 0.06% 13 0.04% WA 2 0.03% 2 0.03% Total 106 0.12% 81 0.09%
6 Total population of Myanmar - according to the Government of Myanmar – 53.3 million in 2004. The population in the Shan State amounted to 4,881,796 according to the Ministry of Foreign Affairs. (Population growth rate is 1.84 percent, population 52.4 million July 2003)

Myanmar Opium Survey 2005
29
2.5 Socio-economic characteristics of the surveyed population
Over the last five years, Myanmar has seen a gradual decline in opium poppy cultivation. Before 1998, when opium poppy cultivation was estimated to exceed 100,000 hectares, probably more than 500,000 households were involved. In 2004, the survey estimated that 260,000 households were involved in opium growing but by 2005, this fell by 26% to 193,000 households. This year’s survey aimed at identifying some characteristics of opium growing households, including reasons for growing opium. It also looked at issues which could be linked to continuing or stopping opium cultivation, such as shifting cultivation practices and migration.
Food security
Food insecurity was reported by both opium growing and non-growing households. More than half of the surveyed households (52%) reported food insecurity. The severity of food insecurity varied: 3% of households experienced a rice deficit for 12 months, 27% for 6 months and more than half for a maximum of 3 months. Food deficiency is acute in the Wa region with 89.5% of village reporting food insecurity. In North Shan (53.3%), East Shan (52.7%) and South Shan (45%) rates are slightly lower but still worrying. This is consistent with opium poppy cultivation patterns which see cultivation occurring in economically marginalised areas such as the Wa.
Opium is often sold or bartered in the period between the two rice harvests (March to October). However, opium is also consumed by local addicts before it can be sold to purchase rice, which exacerbates the extent of rice deficiency. Levels of addiction in the household also negatively affect work productivity and therefore have an additional negative impact on families’ food security.
Table 17: Food security among surveyed households in the Shan State, 2005
Figure 11: Rice deficiency (months) for the villages reporting shortages, Shan State, 2005
Deficit of 6 months
27%
Deficit of 3 months
55%
Deficit of 12 months
3%
Deficit of 9 months
15%
East Shan 0,5% 52,7% 46,8%North Shan 4,3% 53,3% 42,4%South Shan 0,0% 45,0% 55,0%Wa S.R. 2 2,7% 89,5% 7,8%Total (rounded) 2% 52% 46%
Region No response Insecure Secure

Myanmar Opium Survey 2005
30
Shifting cultivation
Shifting cultivation often takes place in areas which are unsuitable for permanent cultivation such as steep, hilly areas. Shifting cultivators in the Shan State, who typically have little or no paddy land, grow upland rice and opium poppy, as part of their rotational cultivation system. Unfortunately, most crops produced in these geographical conditions will be low yielding.
More than 1/3 of households surveyed in East, South and North Shan State reported practicing shifting cultivation, whereas almost all respondents did so in the Wa region, where permanent arable land is very rare. The number of years in the rotational system remains relatively high in the Wa region (7.7 years). However, it has decreased significantly to four to five years in other regions. This decrease puts more pressure on the land which will affect crop productivity and general land erosion in the future.
Table 18: Number of households practicing shifting cultivation, Shan State, 2005
Shifting Cultivation Fallow Region Total
HH No Yes % of HH Average Year let Fallow
Min Max
East Shan State 4,771 2,856 1,915 40% 4.2 1 15 North Shan State 8,441 4,316 4,125 49% 5.3 1 15 South Shan State 10,997 7,784 3,213 29% 4.3 1 15 Special Region 2 (Wa) 1,509 60 1,449 96% 7.7 3 13
Total 25,718 15,016 10,702 42% 5 2 15
Increased shifting cultivation in Shan State, 2005

Myanmar Opium Survey 2005
31
Reasons for growing opium poppy
Farmers cultivate opium primarily to ensure food security. 82% of farmers reported that they sell their opium for cash or barter it for rice. Approximately 12% of respondents stated they grow the crop for medicine or to satisfy the consumption of addicts in the family. A small portion (6 %) reported they use revenue from opium to pay local taxes. Almost none of the farmers use the income to finance education expenses. These findings are consistent with the rice deficit findings describe above: 55% of households reporting a rice deficit of less than 3 months and 45% reporting a deficit between 3-12 months.
Both for households which have grown or never grew opium, law enforcement is the main reason given for not cultivating. Combined with the information about food security, it indicates that many households have stopped opium cultivation before they had other means to ensure food security. Other important reasons for not cultivating were: food sufficiency, religion and lack of knowledge about opium cultivation. Non-availability of land and labour and lack of cash were not significant reasons for farmers to not cultivate opium.
Table 19: Reasons for growing opium poppy (2005)
Reasons for Growing Poppy Percentage
To buy food ( cash, barter) 82%
For own use ( drug abuse or medicine) 12%
Other (for tax) 6%
For schooling 1%
Figure 12: Reasons for growing poppy (2005)
For schooling
0.4%
For own use
(drug abuse,
medicine)12%
Other 6%
To buy/barter
food 82%

Myanmar Opium Survey 2005
32
Figure 13: Reasons for not growing poppy (2005)
1%
3%
8%
8%
13%
15%
17%
35%
Other
Not enough labour
Enough cash
No land available
Don't know how to grow poppy
Forbidden by the religion
Enough food
Abide by the law
Destination of household opium production
In the Shan State, 46% of the opium growing households sell all their opium, while 43% retain a portion of the harvest. In East and South Shan State a majority of farmers reported selling all of their opium (62% and 88% respectively), while in the Wa region only 20.4% reported selling all of their opium. Reasons for retaining opium include: to barter, to pay for labour, to consume, to use as medicine and to pay tax. If there is no urgent need to sell all the opium at once (to buy food), it is stocked to use in emergencies or to wait for higher prices. 26% of the farmers reported that they needed to retain opium because of addiction within the household.
Table 20: Destination of household opium production as at harvest 2005, per region
Region Total HH Growing HH Sell All Sell Part East Shan State 726 342 47% 212 62% 91 27% North Shan State 580 227 39% 93 41% 70 31% South Shan State 1730 622 36% 550 88% 61 10% Special Region 2 (Wa) 1259 1204 95% 246 20% 810 67% Total 4295 2395 56% 1101 46% 1032 43%
*The total does not add up to 100% due to some no response
Table 21: Reasons for keeping some opium
Reasons for Keeping Some Opium Percentage
They barter 34%
They have to pay some labour 26%
For own use ( addiction or medicine) 26%
Tax 14%

Myanmar Opium Survey 2005
33
Migration
Migration in Shan States is directly related to the food security situation: about 40% of the farmers migrated because of lack of food and about 35% because of lack of income. In opium growing villages migration because of food deficiency was higher than in non growing villages (44% and 38% respectively). Displacement by authorities is significantly higher in poppy-growing villages (13%), than in non-poppy growing villages (2%). There has been almost no migration from the Wa Special Region 2 to other regions in Shan State this year (farmers reported on migration between the 2004 and 2005 opium harvest, in line with the survey cycle). The distribution of migrants is almost equal in East and North Shan and a little less in South Shan State. Emigration in the overall sample population is low, at 1%, which is about half that of last year (2.3%). This might be due to the fact that this year no new areas came under the poppy ban.
Sixty two per cent of migrants go to other villages and 31% to towns. As mentioned above, the moves are mainly for economic reasons. Only 7% migrate cross-border -- almost exclusively towards Thailand.
Table 22: Reasons for emigration to the villages (growing poppy or not growing poppy)
Reasons for emigration Villages not growing poppy Villages growing poppy
Getting married 12.1% 7.5%
Displaced by authorities 1.5% 11.3%
Getting paddy land 1.3%
No food 37.7% 43.8%
No money 45.2% 26.3%
Table 23: Destination of emigrants
Destination of Emigrants Percentage
To cross border 7%
To town 31%
To other villages 62%
Table 24: Origin of emigrants
Where emigrants come from Number of Households Percentage
East Shan State 101 36%
North Shan State 105 38%
South Shan State 70 25%
Wa Special Region 2 2 1%
Total 278 100%

Myanmar Opium Survey 2005
34
Figure 14: Reason for emigration
No food39%
Displaced by authorities
2%
Being married
13%
No money46%
No Money29%
No food49%
Being married
8% Get paddy land1%
Displaced by authorities
13%
Villages not growing poppy Villages growing poppy
Figure 15: Distribution of emigrants’ origin
0,0%
5,0%
10,0%
15,0%
20,0%
25,0%
30,0%
35,0%
40,0%
East Shan North Shan South Shan S.R. 2 (Wa)
Origin

Myanmar Opium Survey 2005
35
Received and required external assistance
Forty one per cent of surveyed villages received some kind of external assistance in the past two years. Farmers in North Shan State reported that 37% of villages received assistance, more than any other region. In East Shan State 28% of the villages received assistance and 25% in South Shan. Lower levels of assistance were reported in the Wa Region (10%), where most opium poppy cultivation takes place. This is where the UNODC Kokang and Wa Initiative was initiated in 2003 and the programme will need to be further developed to support the farming communities after June 2005 when the opium ban will be enforced.
When comparing received and required assistance, it can be concluded that in most cases the assistance delivered has addressed the population’s most urgent needs. Improved health services, education, water supplies and access roads leading to villages comprised the majority of assistance received. This was perceived to be the most required assistance. Assistance to cultivate other crops, which could lead to a sustainable way of opium elimination, was delivered to less than 10% of the villages. Micro credit, food for work, raising animals and other types of assistance have been marginal. In 15% and 14% of villages farmers indicated that they would need help for alternative crop production and animal husbandry, types of assistance which have not yet been widely delivered (figure 19).
Figure 16: Distribution of the assistance received by region (over the past two years)
0,0%
5,0%
10,0%
15,0%
20,0%
25,0%
30,0%
35,0%
40,0%
45,0%
East Shan North Shan South Shan S.R. 2 (Wa)
Table 25: Received and required type of assistance
Assistance Received Required
Health service 26% 20%
Education 22% 17%
Access roads 16% 9%
Water supply 12% 11%
Grow other crops 9% 15%
Micro-credit 5% 5%
Other 4% 2%
Food for work 2% 3%
Raising animals 2% 14%

Myanmar Opium Survey 2005
36
Tea plantation in North Wa
Figure 17: Received and required type of Assistance
0%
5%
10%
15%
20%
25%
30%
Hea
lth s
ervi
ce
Educ
atio
n
Acce
ss ro
ads
Wat
er s
uppl
y
Gro
w o
ther
crop
s
Mic
ro-c
redi
t
Oth
er
Food
for w
ork
Rai
sing
ani
mal
s
Received Assistance Preferred Assistance
d

Myanmar Opium Survey 2005
37
2.6 Reported eradication
At the national level, eradication took place on 3,907 ha during the 2004-2005 season, an increase of 39% over the 2,820 ha eradicated in 2004-2003 season. The opium survey, however, was not designed to monitor or validate the results of the eradication campaigns carried out by the Myanmar Government.
The pressure from authorities has increased significantly in the Kachin State where eradication increased by approximately 900 %. In Shan State eradication took place mainly in the North Shan State, and included some ‘voluntary’ abandonment of poppy cultivation. In the Sagaing Division and Kayah State together, only 25 ha were eradicated in 2005, in contrast with 157 ha in the previous year.
Under the ceasefire agreements, ethnic groups have a certain degree of autonomy and self-governance. In the main opium poppy cultivation areas, the government was able to assert some degree of control, and local authorities agreed to phase out poppy cultivation. However, in most of these areas there are no alternative sources of income and local authorities have been reluctant to increase eradication activities, since no aid is yet in place to support this. For example, the Wa ethnic group declared in 1999 that they would enforce a total ban on opium poppy cultivation after June 2005. However, no eradication was reported in 2004 and 2005 while opium poppy cultivation continued. A similar situation occurred in the area under the control of the Paoh National Organization (PNO), an ethnic group in South Shan State, that has committed itself to the total elimination of opium poppy by 2007.
Table 26: CCDAC eradication figures
Administrative Unit 2004 (ha) 2005 (ha) Variation (%) over 2004
North Shan State 172 1,211 604%
South Shan State 2,170 1,203 -44%
East Shan State 195 124 -36%
Special Region -2 (Wa) 0 0 -
Shan State Total 2,537 2,538 -
Kachin State 126 1,341 964%
Chin State 0 3 -
Sagaing 74 17 -77%
Kayah State 83 8 -90%
Mandalay Division 0 0 -
Total 2,820 3907 39%

Myanmar Opium Survey 2005
38
Eradication of poppy field in Kachin State
Table 27: CCDAC eradication figures in Kachin State in 2004 and 2005
Township Total eradicated in 2004 (ha) Total eradicated 2005 (ha)
Monyin 5
Hpakant 36
Putao 86
Tanai 108
Sadone 1,106
Kachin State Total 126 1,341

Myanmar Opium Survey 2005
39
Map 5:

Myanmar Opium Survey 2005
40
Map 6:

Myanmar Opium Survey 2005
41
3. METHODOLOGY
As in previous years, the Central Committee for Drug Abuse Control (CCDAC) of the Union of Myanmar, in collaboration with the United Nations Office on Drugs and Crime implemented the 2005 Myanmar Opium Survey.
Opium poppy cultivation is rapidly decreasing in Myanmar. Opium growing fields are moving further away from the villages and, in certain regions, are being affected by eradication practices. In addition, cultivation is also migrating possibly to areas once considered opium poppy free or climatically speaking less favorable.
In 2005, all of these considerations, combined with reduced accessibility and the expected scarcity of the crop, influenced the survey methodology and the sampling procedures for the estimation of the planted area and other socio-economic indicators. Planning and implementation of the 2005 survey had to adapt to these challenging conditions in order to arrive at the most accurate result possible.
Considerable efforts have been made over the last years to improve on a number of methodological details and to adapt to the evolving conditions of cultivation. This survey integrated the ground data collection component, and combined the use of satellite remote sensing with field surveys and interviews, to arrive at comprehensive indicator estimates.
The 2005 opium poppy survey is composed of three parallel components:
1. A planted area estimation survey throughout four regions of the Shan State (North, South, East and Special Region No.2 of the Wa). The Shan State, traditionally, has accounted for more than 95% of the total opium production in Myanmar. This survey was based on the use of satellite remote sensing as the primary source of data. Satellite remote sensing was supplemented by field surveys to provide ground truthing and to support the interpretation of opium poppy fields.
2. An opium poppy yield estimation survey in the four regions of the Shan State for the description and measurement of opium field that were researched within a random set of sample sites.
3. A socioeconomic survey in 566 villages randomly selected over the entire Shan State based on interviews with village headmen and heads of households of the villages selected. This is approximately 5% sampling of the 10,588 villages reported by the Shan State Forest Department.
3.1 Sampling procedure for the village survey.
The planning of the surveys started with the definition of the sampling frame. The more information is available about the population, the easier it is to devise a sample that will lead to more accurate estimates.
Composition of the survey sample
In the Shan State a total of 471 villages were visited, including more than 26,000 households and a population of 131,302. The information covered in this sample was thus equivalent to 3% of the total population of the Shan State. In the Wa region, villages on average comprise fewer households (31) than other regions in Shan State. The proportion of children in the total population is much higher in the Wa region compared to other regions. The average population growth rate in the sample is 1.20% and is similar to the average annual population growth rate in rural areas of Myanmar. In the Wa region and North Shan State the growth rate is lower, possibly indicating serious health or malnutrition problems.
The ethnic composition of the regions of the Shan State is possibly the most diversified in the whole of the Union of Myanmar.

Myanmar Opium Survey 2005
42
The sampling of this year reflects major ethnic groups present in each region surveyed. In East Shan State 59% surveyed were Shan, in South Shan State 64% were Shan and Paoh and in the Wa region 84% were Wa. In North Shan State, where more ethnic groups are present, Shan represent 46% of the population surveyed, with the remained comprising a number of ethnic groups.
Table 28: Composition of the socio-economic survey sample
Particulars North Shan South Shan East Shan S.R.2 (Wa) Total
Total n. of villages surveyed 159 133 113 66 471
Total n. of household 8,375 10,997 4,619 2,028 26,019
Total population 45,168 52,182 23,068 10,884 131,302
Average population per village 284 392 204 165 279
Average n. of HH per village 53 83 41 31 55
Men 14,467 16,603 7,572 3,100 41,742
Women 15,870 18,811 7,604 3,283 45,568
Children under 15 years old 14,831 16,768 7,892 4,501 43,992
Table 29: Population growth by region
Figure 18: Ethnic composition of sample villages
North Shan
Shan46%
Bamar
Kachin9%
Kokang9%
Other8%
Palaung7%
Chinese8%
East Shan
Akar10%
Lahu21%
Other8%
Shan59%
Le Shaw2%
Region New born Death Population Growth rate
East Shan 492 198 23,823 1.23%
North Shan 1,014 577 45,783 0.95%
South Shan 1,403 651 52,182 1.44%
S.R.2 (Wa) 142 72 7,748 0.90%
Total 3,051 1,498 129,536 1.20%

Myanmar Opium Survey 2005
43
South Shan
Daue13%Kayan
3%Other11%
Paoh41%
Shan23%
Bamar9%
S.R.2 (Wa)
Wa84%
Shan4%
Lahu11%
Chinese1%
Sampling frame
In the case of the socio-economic survey, the sampling frame consisted of 10,588 villages listed in the Myanmar’s Forest Department database based on digitized village images. It is very likely that this frame did not fully reflect the current reality as many villages may not have existed anymore, moved, or changed names.
After examining the practicability of different sampling designs, a Stratified Random Sampling design was selected to carry out the survey. The survey collected social and economic information over the entire Shan State (North Shan, South Shan and East Shan) and the Special Region 2 (Wa) in Myanmar. Data were collected on: number of villages cultivation opium poppy, number of household involved with this practice, opium poppy eradication coping strategies, opium prices, income from poppy, migration, and external assistance.
Each village in the entire Shan State was classified in one of two strata, based on data obtained from the 2002 and 2003 Myanmar Opium Surveys, as well as other preliminary information about the presence of opium poppy cultivation in the village.
• High Risk: All villages with high or medium levels of opium poppy cultivation in 2003.
• No Risk: All villages with very low levels of opium poppy cultivation, no information available or not cultivating opium poppy.
Under this scheme, the resulting distribution of villages in the sampling frame is as follows:
Table 30: Distribution of villages in the sampling frame
Region No Poppy Risk High Poppy Risk Total
East Shan 2,398 218 2,616 North Shan 2,918 540 3,458 South Shan 2,823 301 3,124 Special Region 2 (Wa) 1,390 1,390 Total 8,139 2,449 10,588

Myanmar Opium Survey 2005
44
Map 7:

Myanmar Opium Survey 2005
45
Sample size
The definition of the sample size was influenced by a number of requirements and constraints. The main requirement was the level of accuracy considered acceptable for the estimates, while the constraints were either economic or logistical. In general terms, the standard of accuracy of a sample is defined by the following parameters:
The coefficient of variation (CV) is a measure of the precision of an estimate. A low CV shows that the estimator has very little variation relative to the centre estimate and is precise. Conversely, a high CV means that the estimator has a wide confidence interval and that the estimated value can change greatly given a different sample.
1. Confidence level or risk level: In a normal distribution, approximately 95% of the sample values are within two standard deviations of the true population value. In other words, if a 95% confidence level is selected, 95 out of 100 samples will have the true population value within the range of precision specified.
2. Due to time and budgetary constraints, it was agreed that the socio-economic survey would be conducted on sample of 566 villages. This is approximately 5% sampling of the 10,588 villages reported by the Myanmar’s Forest Department. The village selection was done from the existing listing of the Forest Department database.
Taking into account the potential source of bias from the village database, as well as considering that the database may not be as accurate as desired (because some villages may not exist anymore, some may have moved, some others may have changed names or have merged with other villages), a contingency plan had to be developed at the time of sample selection. Therefore, in case a village identified in the survey listing could not be found, an alternative village was selected to replace it and keep the stratification structure intact.
The sample allocation was proportional to the size of the stratum and the sample was geographically distributed across all the four regions. Systematic random selection was used within each stratum to draw the sample.
Table 31: The sample size of each stratum is:
Region No Poppy Risk High Poppy Risk Total
East Shan 100 33 133 North Shan 123 81 204 South Shan 118 45 164 Special Region 2 (Wa) 0 66 66 Total 341 225 566
In order to improve the precision of the estimates, once the survey data was collected, sample cases were reclassified into homogeneous groups (some villages were not found, did not exist anymore or it was not possible to access them). This post stratification step allows knowing population totals by weighting. The resulting post stratification table is below.
Table 32: Post stratification of sample:
Region No poppy risk Poppy risk Total
East Shan 85 28 113
North Shan 132 27 159
South Shan 106 27 133
Special Region 2 (Wa) 66 66
Total 323 148 471

Myanmar Opium Survey 2005
46
Figure 19: Distribution of the sample villages
3.2 Organization and staff
The survey campaigns were coordinated by the UNODC/ICMP office in Yangon and as in previous years, operationally implemented in close collaboration with Myanmar official institutions:
The opium yield survey and socio economic survey were supervised and implemented by the Myanmar CCDAC, while the UNODC/ICMP provided technical support, coordination and supervision throughout the survey.
The rapid assessment survey in Kachin, as well as the opium free certification survey in Special region 4 and border areas were implemented directly by UNODC/ICMP, though still in close collaboration with CCDAC and local institutions that participated in field supervision.
The area estimation campaign was conducted in collaboration with the remote sensing and GIS section of the Ministry of Forestry.
Three separate teams, each comprising two surveyors from the Remote Sensing and GIS Section of the Department of Forestry, visited the field with print outs of the satellite images. Once they reached the area represented in each single scene, they proceeded to annotate the print with the land use classes and relative boundaries, proceeding along specific transect itineraries.
Work was characterized by a slow start due to the need for access authorization to some of the sites. Field operations eventually started the first week of February and continued until mid March 2005. Due to a worsening of the security situation in East and South Shan some areas could not be visited and not all ground truth data could be acquired.
In North Shan State region, where no satellite images were acquired, a ground survey was conducted on a sample of 204 villages but only 159 could be effectively surveyed.
3.3 Field operations
The Opium poppy yield and socio-economic survey
For the socio-economic and yield estimation campaign, 185 surveyors carried out the fieldwork from January 1 to March 15 2005.
They were organized in 59 teams (21 teams for SSS, 19 for NSS, 11 for ESS and 8 for WA regions). In each team there was one surveyor from the Police Force, one from the General Administration Department and one from the Land Record Department or the Myanmar
Sample Distribution among Poppy risk villages
South Shan18%
North Shan18%
East Shan19%
Special Region 2
45%
Sample Distribution amongNo poppy risk villages
East Shan26%
North Shan41%
South Shan33%

Myanmar Opium Survey 2005
47
Agriculture Service. In Wa Special Region 2 a fourth surveyor designated by Wa Central Committee joined the survey team.
Work was coordinated by a head supervisor based in Taunggyi who relied on the work of four local supervisors, one each for the four Regions (North, South, East and Wa).
The survey teams were all involved in interviews with village headmen and heads of household, as well as field measurements for the collection of yield estimation variables.
Training courses were delivered prior to the fieldwork in Taunggyi for the South Shan, in Kyaingtong for the East Shan, in Lashio for the North Shan and in Pangkham, for the Special Region No.2 of the Wa Area.
Table 33: Training schedule and logistics
Location Survey Zone Training Dates No of Trainees
Taunggyi South Shan State 19-12-04 to 22-12-04 63 Kyaingtong East Shan State 12-01-05 to 15-01-05 33 Lashio North Shan State 18-01-05 to 21-01-05 57 Pangkham Special Region 2 (Wa) 7-02-05 to 11-02-05 32 Total 185
The training covered the description of the survey process, familiarization with the questionnaire, the use of GPS, application of field measurement techniques, including poppy capsule measurement techniques, and, finally, interview techniques. Three days of classroom lectures were conducted and a day of field practice followed the theoretical part of the preparation.
Each survey team was assigned to a township. Two townships with a heavier workload were assigned two-survey teams (Lashio and Kyaingtong townships). The fieldwork survey started on January 1, 2005 in the South Shan, and all the 185 trainees were in the field by January 15. The supervision teams met during the field survey to assess the progress of the survey and ensure quality control. The duration of the ground survey was 8 weeks and operations were wrapped up by the second week of March.
Table 34: Opium poppy yield estimation and socio-economic survey fact sheet
North Shan South Shan East Shan S. R. 2 (Wa) Total Start date 21/01/2005 01/01/2005 16/01/2005 01/02/2005 End date 28/02/2005 28/02/2005 28/02/2005 15/03/2005 Survey Teams 19 21 11 8 59 Targeted VillageTract 164 132 84 44 424 Surveyed Village Tract 135 92 74 44 345 Targeted Villages 201 168 132 45 546 Villages Surveyed 159 133 113 66 471
During the field survey work, some surveyors could not identify and/or reach all of the assigned sites due to bad security conditions prevailing in some of the assigned areas at the time of the survey, especially in the East and South Shan areas. For example, the supervisor for Taunggyi Area was unable to visit Maing Kaing, Leacha, Kyaethi, Kunhein and Maing-shu Townships for monitoring. Due to security reasons the survey teams of Maing Kaing, Kyaethi and Leacha could not reach the villages to survey. The same was the case in another 10 villages in East Shan State.
Following the survey, all the compiled questionnaires were collected and brought back to the CCDAC office in Yangon. Once there all the forms were checked by UNODC survey supervisors for possible inconsistencies and then entered into a consolidated Access database. Data entry took place from March 20 till May15. The database was designed to process data reports concerning

Myanmar Opium Survey 2005
48
socio-economic, population data, opium cultivation and addiction. It was structured for easy data recovery and consultation.
Rapid assessment surveys in the kachin state
The rapid assessment conducted in the Kachin State was the second survey by UNODC in this territory. Due to time and logistical constraints for the rapid assessment, the Regional Illicit Crop Monitoring Expert and National GIS Analyst conducted surveys only in Sadone and Chipwe Township from 1 March to 5 March 2005. The team was equipped with the latest aerial photography of an area of 121 square km and could survey an area of 30 square km counting number of poppy fields and estimating average field size. The team also visited a number of other sites to monitor any evidence of opium poppy cultivation. The anti-narcotics task force in Myitkyina was consulted for latest data and maps on eradication.
Table 26 indicates the area under poppy cultivation which was destroyed in the 2004-2005 crop season by the local authorities.

Myanmar Opium Survey 2005
49
Rapid assessment in special region 4 and south Wa along the Thai border
Rapid assessments were also carried out in Silu , Mongla, and Nampan areas of Special Region 4 from January 16 to 18 but no evidence of poppy was found, confirming this region has been and remains poppy free since the ban of 1997.
Another rapid assessment was conducted in the South Wa along the Thai Border. The area stretches from Wanhon, Yo Pang (Mong Ywng), Kyeng Kham, Hwe Au, to BP-1 (Border Post-1), inclusive of Bitter Gourd Range (Gantee) area. The assessment was made during 19 October 2004 to 4 November 2004 and no evidence of opium poppy cultivation was found in this area at that time.
3.5 Remote sensing procedure
The identification of the poppy fields and the area calculation were based on two different methods applying remote sensing techniques and different satellite images. The images were used for the calculation of opium poppy cultivation in the South and East Shan regions, where last year opium poppy cultivation accounted for 80% of the total planted surface.
Large part of the poppy cultivation is concentrated in the Wa-region (41% of the cultivation in the Shan state). In the past, the Wa-region was assessed with a sampling approach but to improve the assessment this year a census approach was used with high-resolution satellite images that covered almost the entire Wa-region. In the South and East Shan regions a sampling approach with very-high resolution images was applied (see map 8).
Remote sensing procedure in the Wa-region
For the census approach in the Wa-area, six SPOT5 images were needed to cover the total area (see map 8). The 10-meter resolution ortho-rectified SPOT images (60x60 km each) were acquired at the 30th of January when the poppy plant was at its maximum development, followed by 6 images in 22nd of March when the poppy had been harvested. The processing of the images was done separately for the east versus the west images to avoid differences in the reflectance values. In the beginning of March, GPS points were collected in the field, however the number of points collected was limited because the field workers had only access to the major roads. Nevertheless, the GPS points were useful as groundtruth data for the supervised digital classifications with a maximum likelihood classifier. To improve the resulting classifications, a decision model was developed to identify areas that show decrease in vegetation, which is typical for the poppy cultivation in this time period. Therefore the vegetation indexes (Soil Adjusted Vegetation Index) of the January and the March images were carefully compared and the result was crossed with the supervised classification by means of a logical matrix. The products of the east and west parts were mosaiced and a standard majority filter was applied to delete the “noise” in the classifications. Some manual adjustments were made to correct obvious errors in the final classification.
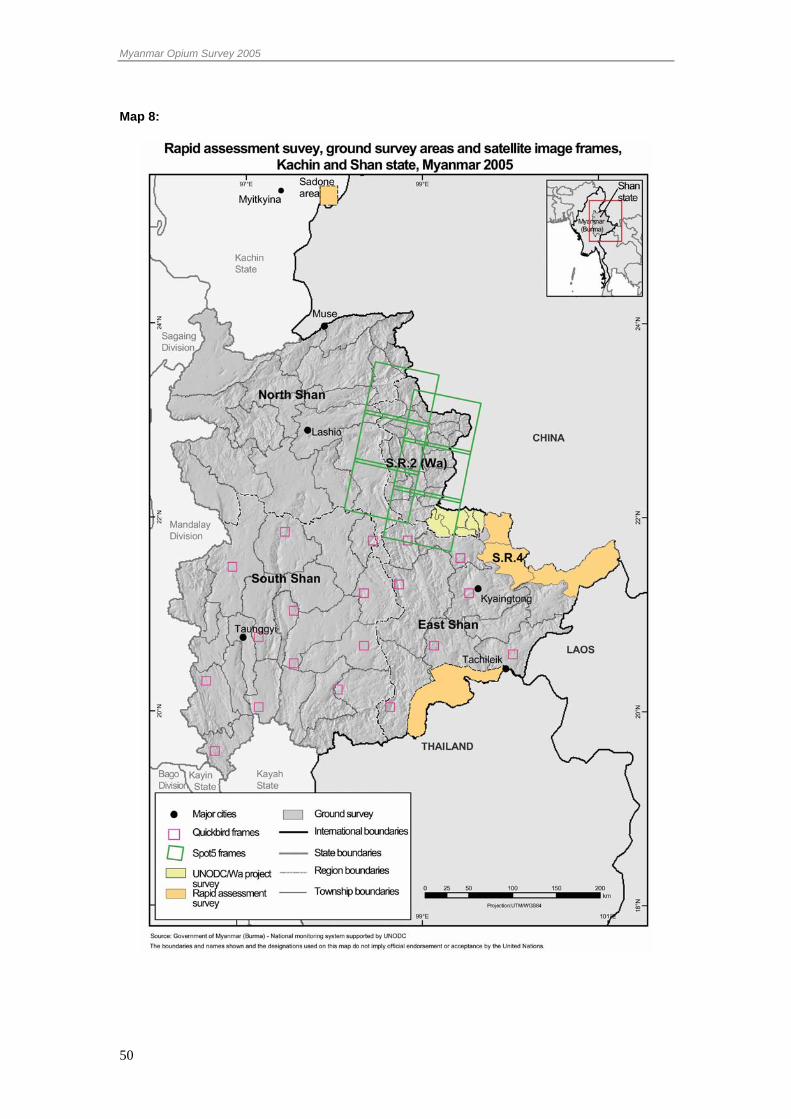
Myanmar Opium Survey 2005
50
Map 8:

Myanmar Opium Survey 2005
51
Figure 20: Flow chart of the processing of the SPOT 5 images in the Wa-region
* The vegetation index decision model was used to extract areas with high values of vegetation in January and low values of
vegetation (i.e. bare soil) in March.
Remote sensing procedure in South and East Shan regions
In the South and East Shan, the area of cultivation was estimated by classifying 16 Quickbird images (8 X 8 km) with 2.8 m resolution. The number of images was limited due to budget restrictions. The image locations were systematically selected following a sampling frame and taking into account the different crop calendars in the different regions. The poppy is earlier in the South-West and therefore the images were collected earlier (mid December) than in the North-East (end January).
In the previous surveys, sampling frames were developed based on altitude and land use zones. Non-agricultural land, including forests were considered as poppy free. However, poppy-fields are increasingly established in forested areas and easily missed in the classifications due to the low resolution (30 m) of the satellite images that are used to create the sampling frame. Moreover, this sampling approach requires frequent updating of the land use map taking into account the highland land use dynamics in the region.
Orthorectified SPOT 5 images (January)
Orthorectified SPOT5 images (March)
Mosaic east images versus west images
Mosaic east images versus west images
Supervised digital classification
GPS ground
truth data Vegetation index decision model*
Logical crossing
Mosaic east and west classifications
Forest masking, Majority filter and Manual corrections
Full coverage classification of opium poppy cultivation in the
Wa-region

Myanmar Opium Survey 2005
52
Therefore this year a sampling approach was chosen that is independent of the land cover but that uses the fact that poppy fields are mostly established in remote areas, which can be assessed by calculating an accessibility map. The accessibility map was calculated by combining a slope map and a road map, which were used as an input for a so-called cost-weighted distance calculation. The distance calculation was made from every point to the main roads taking the slope as a cost factor. The resulting map (map 9) shows a gradual pattern of areas that are easy accessible to the remote, poorly accessible areas. Three areas were identified for the sampling frame: good accessibility, medium accessibility and low accessibility. Two areas were considered as poppy-free and left out of the sampling frame: Special Region 4 in the east and a 10 kilometre buffer area with the Thailand border.
Table 35: Sampling frame of the south and east Shan
Strata Area (km²) Area (%)
Poppy free 8 979 10
Low risk 20 717 22
Medium risk 32 881 35
High risk 31 574 34
Total 94 151 100
The classification procedure of the Quickbird images is illustrated in Figure 23. For every selected location, two images were collected with four to eight weeks’ intervals. Three teams of the Forest Department were planned to collect the groundtruth data for these locations but due to security problems only 8 locations could be visited. The satellite images of visited areas were classified with the groundtruth information and carefully digitized on-screen. At the locations where groundtruth was lacking, the images of the two dates were visually interpreted to create “surrogate” groundtruth data. The criteria used for this visual interpretation of the poppy fields were the following (see figure 24):
1. Typical reflectance of poppy
2. The disappearance of the vegetation in the 2nd image.
3. Apparent open spaces surrounded by natural vegetation
4. The distance to populated places
5. Accessibility
The surrogate groundtruth data were used to perform supervised classifications with a maximum likelihood classifier and were corrected for errors (filtering and some manual corrections). The results of both classifications were used as samples for a statistical analysis to come to the total opium poppy area in the South and East Shan.

Myanmar Opium Survey 2005
53
Map 9:

Myanmar Opium Survey 2005
54
Figure 21: Flow chart of the processing of the Quickbird images in the south and east Shan
Quickbird images (January)
Quickbird images (March)
Field verification
(8 locations)
Two-date visual interpretation
(8 locations)
Classified sample areas
Surrogate ground
truth data
Supervised digital classification, filtering and manual correction
Real ground
truth data
On screen digitizing
Statistical bootstrap extrapolation
Total opium poppy cultivation area in South and East Shan
Sampling selection frame

Myanmar Opium Survey 2005
55
3.6 Estimation procedures
Area estimation formulae from satellite images.
East and South Shan
Ratio estimate approach was used in order to provide the most accurate approximation of the extent of the opium poppy cultivation.
Estimation of opium poppy cultivation for each segment:
∑=− 16
1G
xp (Equation 1)
where P = Average presence of poppy cultivation in selected area
x = Total opium poppy identified in each segment
G = Total agricultural area in each segment
Estimation of the total opium poppy cultivation:
ANpX *= (Equation 2)
where X = Total opium poppy in region
N = Sampling Frame in region
During this process, one observation was initially identified as outlier; therefore it was necessary to apply special treatment. After cross checking data with ground evidence, it was possible to assert this observation as extreme value, therefore it could not be ignored, and a special approach was used.
In order to increase the efficiency of the estimators, the skewed distribution of the illicit crop in the East and South State was split one more time. This twofold stratification allowed application of different methodologies for each subpopulation, and consequently reduced the variability contribution from each group.
The result was refined by the bootstrap method with 100,000 iterations. Bootstrapping is recommended when the sample observations have different sizes, which was the case during this survey. Since the total agricultural land differs in each selected segment, the standard formula cannot be applied.
Bootstrapping consist of sampling with replacement from the original sample with multiple iterations, composed in this case of the total poppy areas of the selected segments. After each iteration, a mean value is estimated and scored. At the end, a distribution of means can be observed, producing a mean estimate and a confidence interval for the mean. Bootstrap with 100,000 iterations revealed that there was a 90% probability that the extent of the opium poppy cultivation estimated from satellite images for the South-East region lies between 8,200 and 16,610 with mean estimate of 15,770.
Area estimation formulae from Village Ground Survey
In the North Shan State where last year only limited opium poppy cultivation was found (<15%) no satellite imagery was used this year and the area still under opium poppy cultivation was obtained by extrapolating results of the ground survey. The sample village survey was implemented to collect data in the four administrative regions in the Shan State. In addition, the

Myanmar Opium Survey 2005
56
sample ground survey was used to confirm the estimations done with satellite images in the remaining administrative regions.
During the ground survey, information about the total number of families living in the village, the total number of families growing opium poppy, and poppy extensions were collected. Correlation analyses were performed. Based on the available sampling frame, results were extrapolated and an approximation of the total area under cultivation was derived. Area estimations as well as variability of the estimates for each region in the Shan State were then available using the following formulae:
T = Total sample area under poppy
H = Total number of households growing poppy in the sample
X̄ Hh = T/H = Average area under poppy per household in the sample
Ns = Total number of households growing poppy
A = ∑ HhXNs * = Total opium poppy cultivation area
As the agricultural land varies from one village to another, the results were refined as well by the bootstrap method with 100,000 iterations. The bootstrap method also provided the standard error of the estimates.
It is known that farmers tend to underestimate the extent of the area under cultivation, due to the illicitness of the crop, as well as the risk that the declaration may entail. Therefore, a bias correction factor was used.
To calculate the confidence interval of the total area under opium poppy cultivation in the Shan State, all uncertainty contributions were expressed as standard deviations and the combined confidence intervals as shown below:
Table 36: Confidence interval of the total area under opium poppy cultivation
Administrative region Area under opium poppy (ha)
Lower Limit* Estimate (ha)
Upper Limit* Estimate (ha)
East Shan 3,960 1,730 5,090
North Shan 2,570 770 2,800
South Shan 11,280 8,160 12,640
Special Region No.2 (Wa) 12,960 12,960 12,960
Total 30,770 23,620 33,490 * It has to be noted that upper and lower estimates do not lie symmetrically between the mean estimates because of the different statistical tools used to arrive at the most robust regional estimates.