Investment Opportunities in the Transport Sector (Railways and Airports)

ASIAN DEVELOPMENT BANK
MYANMAR TRANSPORTSECTOR POLICY NOTE RAILWAYS
ASIAN DEVELOPMENT BANK
MYANMAR TRANSPORT SECTOR POLICY NOTE
RAILWAYS

Creative Commons Attribution 3.0 IGO license (CC BY 3.0 IGO)
© 2016 Asian Development Bank6 ADB Avenue, Mandaluyong City, 1550 Metro Manila, PhilippinesTel +63 2 632 4444; Fax +63 2 636 2444www.adb.org
Some rights reserved. Published in 2016. Printed in the Philippines.
ISBN 978-92-9257-463-5 (Print), 978-92-9257-464-2 (PDF)Publication Stock No. RPT168054-2
Cataloging-In-Publication Data
Asian Development Bank. Myanmar transport sector policy note: Railways.Mandaluyong City, Philippines: Asian Development Bank, 2016.
1. Transport.��2. Rail transport.��3. Myanmar.��I. Asian Development Bank.
The views expressed in this publication are those of the authors and do not necessarily reflect the views and policies of the Asian Development Bank (ADB) or its Board of Governors or the governments they represent.
ADB does not guarantee the accuracy of the data included in this publication and accepts no responsibility for any consequence of their use. The mention of specific companies or products of manufacturers does not imply that they are endorsed or recommended by ADB in preference to others of a similar nature that are not mentioned.
By making any designation of or reference to a particular territory or geographic area, or by using the term “country” in this document, ADB does not intend to make any judgments as to the legal or other status of any territory or area.
This work is available under the Creative Commons Attribution 3.0 IGO license (CC BY 3.0 IGO) https://creativecommons.org/licenses/by/3.0/igo/. By using the content of this publication, you agree to be bound by the terms of this license.
This CC license does not apply to non-ADB copyright materials in this publication. If the material is attributed to another source, please contact the copyright owner or publisher of that source for permission to reproduce it. ADB cannot be held liable for any claims that arise as a result of your use of the material.
Attribution—In acknowledging ADB as the source, please be sure to include all of the following information: Author. Year of publication. Title of the material. © Asian Development Bank [and/or Publisher].
URL. Available under a CC BY 3.0 IGO license.
Translations—Any translations you create should carry the following disclaimer:Originally published by the Asian Development Bank in English under the title [title] © [Year of publication]
Asian Development Bank. All rights reserved. The quality of this translation and its coherence with the original text is the sole responsibility of the [translator]. The English original of this work is the only official version.
Adaptations—Any adaptations you create should carry the following disclaimer:This is an adaptation of an original Work © Asian Development Bank [Year]. The views expressed here are
those of the authors and do not necessarily reflect the views and policies of ADB or its Board of Governors or the governments they represent. ADB does not endorse this work or guarantee the accuracy of the data included in this publication and accepts no responsibility for any consequence of their use.
Please contact [email protected] if you have questions or comments with respect to content, or if you wish to obtain copyright permission for your intended use that does not fall within these terms, or for permission to use the ADB logo.
Notes: In this publication, “$” refers to US dollars. Corrigenda to ADB publications may be found at http://www.adb.org/publications/corrigenda The fiscal year of the Government of Myanmar begins on 1 April and ends on 31 March. “FY” before a calendar year denotes the year in which the fiscal year starts, e.g., FY2014 begins on 1 April 2014 and ends on 31 March 2015.

iii
Contents
Tables, Figures, and Boxes iv
Foreword vi
Acknowledgments viii
Abbreviations ix
Executive Summary x
1 Rail Markets and Competitiveness 1 1.1 Passenger Services 1 1.2 Freight Transport 6
2 Railway Assets and Staff 9 2.1 Track 9 2.2 �Signals and Telecommunications 11 2.3 Locomotives and Rolling Stock 12 2.4 Myanma Railways Organization and Human Resources 14 2.5 Information Systems 16
3 Railway Performance 17 3.1 Operational 17 3.2 Safety 21 3.3 Productivity 22 3.4 Financial Performance 24 3.5 Myanma Railways Management Performance 28 3.6 Government Investments 28
4 Options for Improving Myanma Railways Performance 30 4.1 Future Scenarios 33 4.2 Key Scenario Findings 35
5 Key Requirements for Railway Revival 37 5.1 �Changing Investment Strategies 37 5.2 � Changing the Railway Sector’s Organization and Governance 39 5.3 Changing the Organization of Myanma Railways 42
6 Proposed Implementation Strategy 46 6.1 Phase 1 (2015–2016): Planning 46 6.2 Phase 2 (2017–2019): Start of the Restructuring 47 6.3 Phase 3 (2020–2025): Second Phase of Restructuring 48
Appendixes 1 Organization Chart of Myanma Railways (2015) 49 2 Example of a Restructured Myanma Railways 50

iv
Tables, Figures, and Boxes
Tables1 Train and Bus Fares (Yangon–Mandalay) 42 Overview of Myanma Railways Rolling Stock (as of 2014) 123 Coupler Systems in Use 144 Myanma Railways Daily Train Runs 185 Average Speed of Freight Trains 196 Number of Intercity Trains Operated by Myanma Railways 207 Average Speed of Passenger Trains in Main Corridors 208 On-Time Performance of Trains (as of 2013) 219 Selected Rail Operating Performance Benchmarks 2310 Analysis of Freight Cost Coverage Ratio, FY2014 2511 Analysis of Passenger Cost Coverage Ratio, FY2014 2512 Revenues and Costs by Type of Service, FY2014 2613 Summary Diagnostic 3114 Potential Solutions and Constraints 3215 Scenario Analysis 3416 Preliminary Results of Cost and Financial Modeling—Operating Ratios 3617 Investments Identified in the National Transport Development Plan 3818 Investment Projects Presented to ADB by Myanma Railways 39A2.1 Issues to be Addressed in Separating Myanma Railways into Business Units 55
FiguresA Proposed Restructuring Phases xi1 Myanma Railways Passenger Transport Trends 22 Passengers by Train Service—Main Groups 23 Passenger Volumes—Main Intercity Passenger Lines (2009/10 and 2013/14) 34 Average Railway Passenger Revenues 35 Passenger Transport Production Forecasts—Without Improvements 46 Possible Myanma Railways Passenger Long-Distance Market Share 57 Possible Range of Future Myanma Railways Intercity Passenger Demand 58 Trends in Myanma Railways Freight Transport 69 Distribution of Myanma Railways Freight Services by Lines 710 Composition of Myanma Railways Freight by Commodity, FY2013 711 Average Railway Freight Revenues 712 Myanma Railways Freight Market Share Potential 813 Possible Range of Future Freight Traffic Available to Myanma Railways 814 Sleeper and Ballast Renewal 1015 Yangon Station Train Control Equipment 11
Tables, Figures, and Boxes�v
16 Condition of Relay Points 1117 Yangon Station Train Control Circuitry 1118 Freight Train Fuel Consumption 1319 Age Distribution of Wagons 1320 Age Distribution of Coaches 1321 Myanma Railways Employees by Department 1522 Bottleneck Sections 1923 Number of Rail Accidents 2224 Distribution of Myanma Railways Network by Traffic Density 2425 Myanma Railways Revenue and Expenditures per Unit of Traffic 2526 Myanma Railways Expenses by Category, FY2013 2727 Myanma Railways Expenses by Department, FY2013 2728 Government Investments in Myanma Railways 2929 Distribution of Myanma Railways Capital Investments, 2009–2013 2930 Scenario Evaluation Aspects 3331 Outline of a Possible Structure of the Railway Sector 41A2.1 Myanma Railways Core Services 50A2.2 Myanma Railways Noncore Services 50A2.3 Model of a Restructured Myanma Railways 51A2.4 Passenger Business Unit 52A2.5 Freight Business Unit 53A2.6 Infrastructure Management Unit 54
Boxes1 Canada’s Experience in Rationalizing its Railway System 432 Perspectives on the Separation of Railway Operations from Infrastructure Management 45

vi
Myanmar is at a historic milestone in its transition into a market economy and democracy. After decades of isolation and stagnation, the country has, since 2011, been undergoing a fundamental political, economic, and social transformation at unprecedented speed and scope. Achieving the
country’s high growth potential will require continued reforms and structural transformation, especially in advancing major investments in infrastructure, developing relevant capacities and skills, and enhancing the business environment. This will enable Myanmar to reach the ranks of upper middle income economies by 2030.
Due to massive underinvestment and neglect in recent history, Myanmar’s infrastructure lags behind its Association of Southeast Asian Nations neighbors, and hinders access to markets and social services. High transport costs and associated limited access to markets and services are among the main causes of poverty and regional inequality. Twenty million people still live in villages without access to all-season roads. The questions then are: how can basic transport services be provided to all? What does it take to improve the quality of the transport infrastructure and services for the private sector? How can Myanmar reduce the economic and social costs of transport?
The Government of the Republic of the Union of Myanmar is committed to addressing these questions, and the underlying issues. Toward this end, the Government has commissioned from the Asian Development Bank (ADB) the preparation of a Transport Sector Policy Note. The Transport Sector Policy Note takes stock of the transport sector challenges, provides a strategic framework for reforms that could assist Myanmar’s policymaking, and identifies the areas where international financial and technical assistance could make the highest contribution to the development of Myanmar’s transport sector.
The Transport Sector Policy Note is composed of nine reports, including this one, and a summary for decision-makers. The first two—How to Reform Transport Institutions, and How to Reduce Transport Costs—provide an overview and framework for policy reform, institutional restructuring, and investments. These are accompanied by separate reviews of key subsectors of transport: Railways, River Transport, Rural Roads and Access, Trunk Roads, and Urban Transport. These reports summarize and interpret trends on each transport sector to propose new initiatives to develop them. The thematic report Road Safety builds a first assessment of road safety in Myanmar. The thematic report How to Improve Road User Charges is a stand-alone study of cost-recovery in the road sector.
The research was organized by ADB and the then Ministry of Transport, with the active participation of the Ministry of Construction and the then Ministry of Railway Transportation. A working group comprising senior staff from these government ministries guided preparation. The work stretched over the period of 24 months, and was timed such that the final results could be presented to the new government that assumed office in April 2016, as a contribution to its policy making in the transport sector.
Foreword

Foreword�vii
As the Transport Sector Policy Note demonstrates, Myanmar can, and should, develop a modern transport system that provides low-cost and safe services, is accessible to all including in rural areas and lagging regions, and connects Myanmar with its neighbors by 2030. The Government has the determination to doing so, and can tap the support from development partners, the private sector and other stakeholders. It can take inspiration from good practices in the region and globally.
The Transport Sector Policy Note provides a rich set of sector data, is meant to be thought-provoking, presents strategic directions, and makes concrete reform recommendations. It stresses the need to strengthen the role of planning and policy-making to make the best use of scarce resources in the transport sector. It highlights the need to reexamine the roles of the state—and particularly state enterprises—and the private sector in terms of regulation, management, and delivery of services in the sector. It identifies private sector investment, based on principles of cost-recovery and competitive bidding, as a driver for accelerated change. Finally, it aims at a safe, accessible, and environmentally friendly transport system, in which all modes of transport play the role for which they are the most suited.
We are confident that the Transport Sector Policy Note will provide value and a meaningful contribution to Myanmar’s policymakers and other key stakeholders in the transport sector.
James Nugent H.E. Thant Sin MaungDirector General Union MinisterSoutheast Asia Department Ministry of TransportAsian Development Bank and Communications
James NugentDirector General
HH.HHHH E. Thant Sin M

viii
Acknowledgments
The Transport Sector Policy Note was prepared at the initiative of Hideaki Iwasaki, director of the Transport and Communications Division of the Southeast Asia Department of the Asian Development Bank (ADB). It was prepared by ADB staff and consultants. Adrien Véron-Okamoto (ADB) coordinated
the study, prepared the notes How to Reduce Transport Costs, How to Improve Road User Charges and the overall Summary for Decision-Makers, drafted the executive summaries, and contributed substantially to the notes How to Reform Transport Institutions, River Transport, Trunk Roads, and Urban Transport. Gregory Wood prepared the note How to Reform Transport Institutions. The Railways note was prepared by Paul Power. It also benefited from analytical research and suggestions by Richard Bullock. Eric Howard prepared the Road Safety note. Kek Chung Choo prepared the River Transport note. Paul Starkey and Serge Cartier van Dissel prepared the Rural Roads and Access note. Serge Cartier van Dissel also prepared the Trunk Roads note. Colin Brader (of Integrated Transport Planning) prepared the Urban Transport note.
The notes benefited from advice and suggestions from ADB peer reviewers and colleagues including James Leather, Steve Lewis-Workman, Masahiro Nishimura, Markus Roesner, David Salter, Nana Soetantri, and Fergal Trace. Angelica Luz Fernando coordinated the publication of the reports. The editing and typesetting team, comprising Hammed Bolotaolo, Corazon Desuasido, Joanne Gerber, Joseph Manglicmot, Larson Moth, Principe Nicdao, Kate Tighe-Pigott, Maricris Tobias, and Alvin Tubio greatly enhanced the reports.
Assistance from the Government of Myanmar, especially of the Ministry of Transport and Communications, the Ministry of Construction, and the Ministry of Agriculture, Livestock and Irrigation, is gratefully acknowledged. A first draft of these notes was presented and reviewed by government’s study counterparts in 2015. This final version benefited from the comments and suggestions received.

ix
Abbreviations
ADB – Asian Development BankDMU – diesel multiple unitFBU – Freight Business UnitFY – fiscal yearGMS – Greater Mekong SubregionICD – inland container depotJICA – Japan International Cooperation AgencyMIS – management information systemMK – Myanmar kyatMR – Myanma RailwaysPBU – Passenger Business UnitPPP – public–private partnershipPSO – public service obligationUIC – Union International RailwaysYCR – Yangon Circular Railway
Weights and Measures
km – kilometerkph – kilometers per hourmph – miles per hour
Currency Equivalents(as of December 2014)
$1.00 = MK1,000MK1.0000�=�$0.001

x
Executive Summary
This note analyzes the current and future performance and competitiveness of Myanma Railways (MR), examines options for its modernization and improvement, and recommends strategic directions for the modernization and reform of MR in the medium term.
Myanma Railways Is at a Crossroads
The Myanmar transport services market is expanding rapidly, but MR—the sole railway service provider—is not in good shape to meet the demands. Twenty years ago, MR commanded a 44% share of the passenger market and 14% share of the freight market. As of 2015, its market share is only 10% for passengers and 1.5% for commercial freight. MR could disappear by 2025, hence critical decisions on MR’s future should be made.
The MR market situation has suddenly deteriorated. In 2015, MR is operating in a very different market environment to that of 2005 or even 2010. Liberalization of vehicle imports is rapidly changing the transport market and these trends are likely to continue. Between 2009 and 2014, MR lost one-third of both its passenger and freight customers.
MR’s revenues cover only about half its operational costs, which threatens even its medium-term sustainability. The market pricing of fuel has been a major shock to MR finances with many services now failing to cover even fuel costs, and annual operating subsidies are required. MR’s shortage of funds will inevitably worsen the existing deferred maintenance backlog, with knock-off effects on train performance.
Although plans are proceeding to upgrade the Mandalay-Yangon corridor, implementation will take several years, possibly a decade. This corridor is just one of many corridors that need improvement for the railways to compete with other transport modes. In the interim, MR is at risk of losing a large part of its existing market as service levels continue to stagnate or decline and from which it will be extremely difficult to recover.
The immediate priority must be to implement policies that will enable MR to retain as much of its current market as is economically justified over the next 5–10 years, while ensuring its finances are robust enough to allow infrastructure maintenance, in particular, to be vigorously undertaken to permit a steady improvement in service levels and operating efficiency.
The continuation of the current institutional and operational structures will not achieve this, nor will a policy exclusively centered on investing in new civil works.

Executive Summary�xi
How to Revive the Railways in Myanmar?
An important first step is to provide MR management with more freedom and allow them to deploy operating resources to services (such as mainline freight) which are profitable. In addition, most lines and services other than the Yangon–Mandalay–Myitkina corridor are uneconomic as of 2015, and need explicit financial support. This should be allied with a reorienting of the investment budget to overcome the maintenance backlog and allow MR to operate services efficiently and reliably.
Restructuring of MR is a medium-term necessity. Any revival strategy will likely involve the following:
Better investments. Investment levels should be maintained but they should directed toward trunk line maintenance, rolling stock, signaling and information systems, and intermodal freight facilities—in effect ceasing further investments in tertiary lines and most secondary lines until the overall MR situation has improved.Rationalizing assets and services. Lines and services will need to be scrutinized for their viability. Nonviable lines or services should be financed by the central government under public service obligations (PSOs), transferred to local governments, or abandoned. Financial restructuring. This involves the government recapitalizing MR, taking over its debt—particularly pension liabilities—and potentially converting MR’s land into equity.New governance for the rail sector. MR should be fully separated from the government and given managerial autonomy. The government would need to create a new railway department, and eventually, a railway regulator. New management tools, such as a corporate plan with full government policy support, is also required.Reorganizing Myanma Railways along commercial principles. MR should be corporatized and function as a commercial enterprise. Freight should be established as a separate business unit and separating infrastructure and services should be considered.
To implement revival, a phased approach is recommended starting early in 2015.
Phase 1 (2015–2016): Planning. The government should create an interministerial restructuring committee and propose a time-bound restructuring plan for the railways. During this phase, MR could review the profitability of its lines, prepare a rationalization plan, develop a modernization investment program, form a freight business unit, and potentially launch a containerization pilot program. The government could also create a precursor of the future railway department during this phase.
Figure A: Proposed Restructuring Phases
Phase 3Second phase of restructuring
(2020–2025)
Phase 2Start of restructuring
(2017–2019)
Phase 1Planning
(2015–2016)
Source: Asian Development Bank.
xii�Executive Summary
Phase 2 (2017–2019): Start of Restructuring. During this phase, MR would be corporatized and restructured, and MR would commence its modernization investment program.
Phase 3 (2020-2025): Second Phase of Restructuring. This phase would see the full implementation of the modernization investment program. Public service obligation programs and network rationalization would commence. Private sector involvement would be sought. Potentially, the freight market would be liberalized and MR’s business units corporatized. A regulator could begin exercising its functions.

1
1.1 �Passenger ServicesDeclining trend in use. The number of people using Myanma Railways’ (MR) passenger services has been declining since the peak of 76 million passengers in FY2007. Overall passenger travel by rail has declined by 21% since FY2010. In FY2013, MR carried 53 million passengers—22 million travelled on intercity1 passenger trains and 31 million used the Yangon Circular Railway (YCR), which is a suburban and commuter rail line. The decline in ridership has largely been in intercity passengers which has seen a 36% decline since FY2010, the year road vehicle imports were liberalized (Figure 1).
Concentration of passengers in a few markets. In FY2013, MR operated intercity trains on 34 routes. About 35% of intercity passengers travelled on the Yangon–Mandalay route. Six of the 34 routes operated by MR handled 74% of all intercity passengers (Figures 2 and 3).
1 In this report, ‘intercity’ trains refer to all services outside the Yangon metropolitan area. They consist of express trains, main trains (slower long-distance trains) and local trains on both the main lines and branches.
1 Rail Markets and Competitiveness
Key Findings
Myanma Railways’ core passenger transport business is at risk of disappearing. As Myanma Railways (MR) offers cheaper and lower quality services than buses, MR attracts only the low-income population. The low-income market’s share is bound to decrease as Myanmar grows. MR’s share is estimated to fall from 12% to 2%–4% in the coming 15 years.
There is also considerable opportunity for growth. Myanmar’s passenger transport business is growing fast. If MR was able to improve its services, it could triple its market share and multiply passenger volume by seven times.
Government has prioritized passenger operations over freight, so that resources to develop the latter have been limited. MR transported 2.5 million tons of freight in FY2013, one-third less than 2 years before. Since 60% of freight is moved on government account, “commercial” freight is less than 1 million tons per year, putting MR’s market share at 1.5%.
Freight transport could equally disappear or become a large viable business. MR is at risk of losing its entire freight business to road and river transport. However, if it could seize the opportunity, its market share could rise to 7%–15% and its commercial volume could rise 12–25 times.

2�Myanmar Transport Sector Policy Note: Railways
Figure 2: Passengers by Train Service—Main Groups (million passengers)
milli
on p
asse
nger
s
Yangon–Circular Yangon–Mandalay Amarapura–Myitkyina Other intercity
0
5
10
15
20
25
30
35
40
FY2009 FY2010 FY2011 FY2012 FY2013
FY = fiscal year.Source: Myanma Railways.
Figure 1: Myanma Railways Passenger Transport Trends
–
500,000
1,000,000
1,500,000
2,000,000
2,500,000
3,000,000
3,500,000
4,000,000
–
10,000
20,000
30,000
40,000
50,000
60,000
70,000
80,000
Thou
sand
pas
seng
er-m
iles
Thou
sand
pas
seng
ers
–36%
FY1990
FY1995
FY2000
FY2004
FY2005
FY2006
FY2007
FY2008
FY2009
FY2010FY2011
FY2012
FY2013
Intercity Yangon Circular Railway Passenger-miles
FY = fiscal year.Source: Myanma Railways.

Rail Markets and Competitiveness�3
Figure 3: Passenger Volumes—Main Intercity Passenger Lines (2009/10 and 2013/14) (million passengers)
11.9
5.3
3.2
1.3 1.6 1.4
7.7
2.1
Yangon-Mandalay
Amarapura-Myitk
yina
Kemmendine-Pyay
Pathein-Henthata-K
yangin
Pyudwin-Chauk
Naungpattaya-M
awlamyine
2.0 1.8 1.5 1.1
0
2
4
6
8
10
12
14
milli
on p
asse
nger
s
FY2009 FY2013
FY = fiscal year.Source: Myanma Railways.
Figure 4: Average Railway Passenger Revenues (constant MK per passenger mile)
0
5
10
15
20
+130%
FY1990 FY1995 FY2000 FY2004 FY2005 FY2006 FY2007 FY2008 FY2009 FY2010 FY2011 FY2012 FY2013cons
tant
MK
per p
asse
nger
mile
FY = fiscal year.Sources: Myanma Railways and ADB.
Cheap, low-quality service. Despite a very significant increase in passenger fares since FY2010 (Figure 4), intercity travel by rail is still cheaper than travel by bus or car (Table 1). So, why are fewer people traveling by train?

4�Myanmar Transport Sector Policy Note: Railways
Table 1: Train and Bus Fares (Yangon–Mandalay) (MK)
Train BusOrdinary class 4,650 10,600Upper class or deluxe 9,300 16,000
Sources: Myanma Railways and ADB estimates, as of 2014.
Figure 5: Passenger Transport Production Forecasts—Without Improvements(million passenger-kilometer per year)
3.5 3.4 3.0
2.7
2.610%
8%
5%
3%2%
0%
2%
4%
6%
8%
10%
12%
0
20
40
60
80
100
120
140
2013 2015 2020 2025 2030
Air
River
Rail
Bus
Car
Rail Modal Share
Note: Railway volumes forecasts are in bold.Source: ADB estimates.
Better road conditions and increased ownership of private vehicles have certainly contributed to the decline in the use of rail. However, the main problem is the poor quality of MR’s passenger train services. Trips on MR’s intercity trains are generally short (about 75% are less than 100 miles), and MR is unable to compete with buses and private vehicles in this market. MR passenger trains are slow,2 crowded, and uncomfortable (no air-conditioning) and experience frequent delays due to equipment failures and track restrictions. Trains on the Mandalay–Myitkyina route experience serious delays due to bottlenecks where track capacity is restricted and track and operating conditions are difficult.
MR’s market share could be smaller if the declining trend continues. MR currently holds about 12% of the intercity market (10% by passenger-kilometer) and 1.1% of the urban transport market in Yangon.3 If the natural (declining) trend in the use of MR’s passenger services continues, MR’s share of a growing market for passenger travel could be 2%–4% or lower by 2030 (Figure 5).4
2 From Yangon to Mandalay, it takes on average 9 hours by bus and 14–25 hours by train depending on train type.3 JICA. 2014. Project for Comprehensive Transport Plan of the Greater Yangon (YUTRA). Yangon. 4 A full discussion of MR’s competitiveness and potential market is in the Thematic Note: Economic Review of the Transport Sector.
Rail Markets and Competitiveness�5
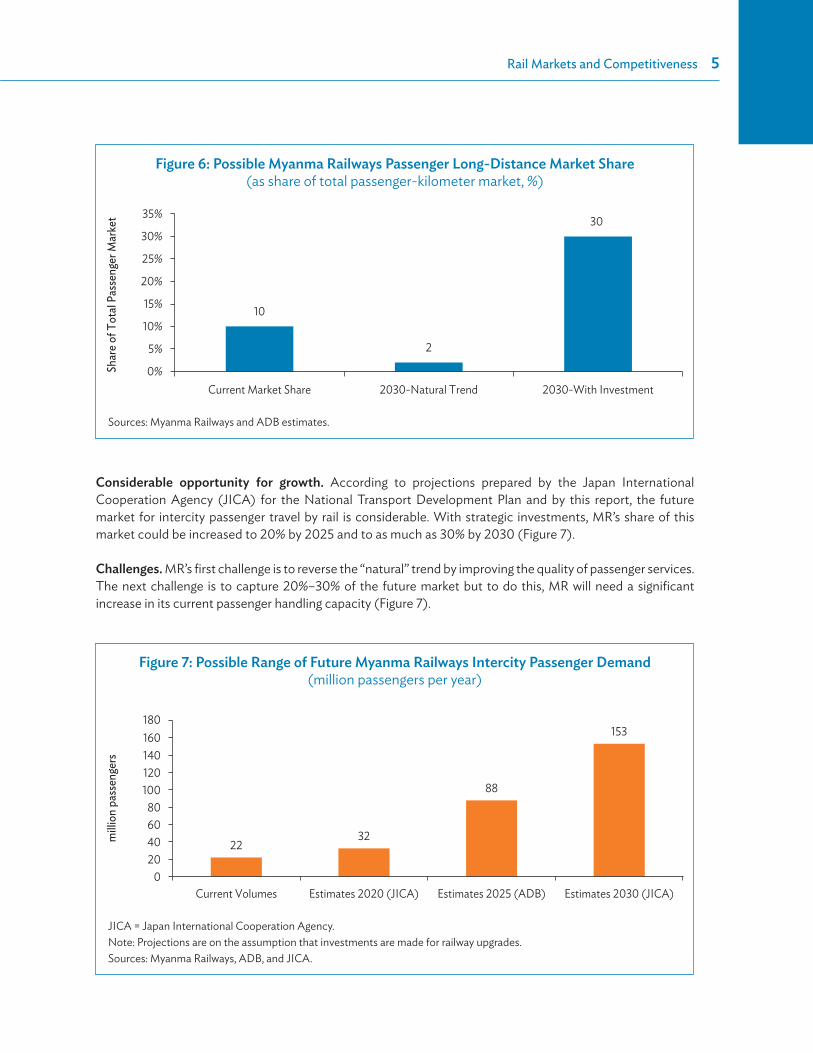
Considerable opportunity for growth. According to projections prepared by the Japan International Cooperation Agency (JICA) for the National Transport Development Plan and by this report, the future market for intercity passenger travel by rail is considerable. With strategic investments, MR’s share of this market could be increased to 20% by 2025 and to as much as 30% by 2030 (Figure 7).
Challenges. MR’s first challenge is to reverse the “natural” trend by improving the quality of passenger services. The next challenge is to capture 20%–30% of the future market but to do this, MR will need a significant increase in its current passenger handling capacity (Figure 7).
Figure 6: Possible Myanma Railways Passenger Long-Distance Market Share (as share of total passenger-kilometer market, %)
10
2
30
0%
5%
10%
15%
20%
25%
30%
35%
Current Market Share 2030-Natural Trend 2030-With Investment
Shar
e of T
otal
Pas
seng
er M
arke
t
Sources: Myanma Railways and ADB estimates.
Figure 7: Possible Range of Future Myanma Railways Intercity Passenger Demand (million passengers per year)
2232
88
153
020406080
100120140
milli
on p
asse
nger
s
160180
Current Volumes Estimates 2020 (JICA) Estimates 2025 (ADB) Estimates 2030 (JICA)
JICA = Japan International Cooperation Agency. Note: Projections are on the assumption that investments are made for railway upgrades. Sources: Myanma Railways, ADB, and JICA.

6�Myanmar Transport Sector Policy Note: Railways
1.2 �Freight TransportMR’s share of the freight market is low and decreasing. MR currently holds about 5% of the freight transport market. This overstates MR’s real position in the freight transport market because commercial freight traffic accounts for less than 50% of MR’s overall traffic base. For commercial freight alone, MR’s market share is only 1.5%. Twenty to 25% of MR freight traffic is ballast for both new and existing lines. Freight statistics also include about the same volume of parcels traffic which is wholly handled on passenger trains. Commercial freight traffic has declined by 28% since FY2012 (Figure 8).
Figure 8: Trends in Myanma Railways Freight Transport
Thou
sand
ton-
mile
s
Thou
sand
tons
Commercial Departmental and Parcels Freight ton-miles
–
1,000,000
2,000,000
3,000,000
4,000,000
5,000,000
6,000,000
7,000,000
8,000,000
–
500
1,000
1,500
2,000
2,500
3,000
3,500
4,000
–28%
FY1990
FY1995
FY2000
FY2004
FY2005
FY2006
FY2007
FY2008
FY2009
FY2010FY2011
FY2012
FY2013
FY = fiscal year.Source: Myanma Railways.
Concentration of freight traffic in two corridors. MR’s freight market is concentrated in the Yangon–Mandalay and Mandalay (Myohaung)–Myitkyina corridors, which accounted for about 87% of MR’s commercial freight traffic in FY2013. About 92% of the freight in these corridors was transported on conventional freight trains; the rest was transported in brake vans on passenger trains (i.e., on “mixed” trains). About 5%–10% of MR’s traffic is through mixed trains (Figures 9 and 10).
The main factor limiting rail freight development has been the lack of traction power. Locomotives used for freight services have been increasingly diverted to run passenger services, so that their number has been reduced.
Also, MR does not operate container trains. MR is now working to establish a container train service between Yangon and Mandalay. A tender was issued in 2014 to select an investment partner that will initially assess the feasibility of establishing dry ports near the two centers and the operation of a container train service.

Rail Markets and Competitiveness�7
Figure 10: Composition of Myanma Railways Freight by Commodity, FY2013 (%)
Parcels23%
Departmental29% Others
25%
Forest products8%
Rice4%
Oil and fuel4%
Stone7%
Source: Myanma Railways.
Figure 9: Distribution of Myanma Railways Freight Services by Lines (%)
Others13%
Myohaung–Myitkyina25%
Yangon–Mandalay
62%
Source: Based on an analysis of FY2014 waybills using data provided by Myanma Railways.
MR’s freight tariffs have increased significantly since FY2011. When commercial traffic declined by 21%, MR’s freight tariffs increased by 183%. Despite the increases, MR’s tariffs are still lower than road freight tariffs; still, MR has been unable to secure more of the freight transport market due to lack of resources for locomotives (Figure 11).
Some of the problems are the following:
low availability of locomotives and rolling stock, limited freedom to negotiate tariffs with customers, minimal marketing of services,one-way traffic and limited backhauls,5
lack of modern bulk handling equipment (bulk handling and transfer is done manually), andno container train services.
5 MR charges a round-trip tariff to most shippers where there is no backhaul.
Figure 11: Average Railway Freight Revenues (constant MK per ton mile)
cons
tant
MK
per t
on m
ile
01020
3040
5060
+183%
FY1990 FY1995 FY2000 FY2004 FY2005 FY2006 FY2007 FY2008 FY2009 FY2010 FY2011 FY2012 FY2013
FY = fiscal year.Sources: Myanma Railways and ADB.

8�Myanmar Transport Sector Policy Note: Railways
MR’s freight services could become irrelevant to commercial shippers. If MR’s problems are not addressed and the “natural” trend in the decline of freight tonnage continues, MR’s share of the freight market will be negligible by 2030 or even earlier (Figure 12).
As is the case with passenger transport, the freight transport market is projected to grow. Railways could capture a large share of this market. It is projected that 12–25 million tons could be carried on the railway by 2025.6 MR’s freight capacity is underutilized, and there is scope to capture a larger market through better asset management, service improvements, containerization, and investment in equipment (Figure 13).
6 ADB. 2016. Myanmar: Transport Sector Policy Note: How to Reduce Transport Costs. Manila.
Figure 12: Myanma Railways Freight Market Share Potential (%)
02468
10121416
Current Market Share Range Natural Trend-2025 Potential Market Share Range
Shar
e of T
otal
Fre
ight M
arke
t
1.5–5
1.5
7–15
Note: Myanma Railways’ current market share is 5% including departmental and parcels, and 1.5% including only commercial freight. Potential share is 7%–15% depending on the intensity of competition with other modes.Sources: Myanma Railways and ADB estimates.
Figure 13: Possible Range of Future Freight Traffic Available to Myanma Railways (million tons)
2
17
40
0
5
10
15
20
25
30
35
40
45
Current Volumes Estimates 2020(JICA)
Estimates 2025(ADB)
Estimates 2030(JICA)
12–25
JICA = Japan International Cooperation Agency. Sources: Myanma Railways, ADB, and JICA.

9
2 Railway Assets and Staff
Key Findings
Myanma Railways’ (MR) track, rolling stock, and signalling systems are outdated and in critical condition:
About half of locomotives, rolling stock, and coaches need to be replaced. Locomotives with high fuel consumption should be replaced or retired.Most tracks were originally designed to very low axle bearing standards, and have not been renewed since. Ballast is absent in many sections. At least 30% of bridges need major repair or replacement.Signalling systems are over 60 years old.
These constraints severely limit MR’s efficiency and service quality:
limiting operational speed and causing frequent delays and accidents,limiting line capacity and freight quantity, andrequiring very high fuel consumption and other operational expenses.
MR has a very dedicated staff but is limited in its ability to attract skilled workers and managers or to train them in-house. This is because MR offers low wages and has limited training resources.
MR’s capacity to address these challenges is limited by its status as a state-owned enterprise and its complex organizational structure.
2.1 �TrackMyanma Railways (MR) has 6,106 route km in 2014 (3,795 route miles), of which 705 km (438 miles) are double-tracked between Yangon and Mandalay. About 50% of the routes were constructed during 1988–2010, and another 116 route miles were added since 2011. The total length of tracks (including yards and stations) is 7,937 km (4,933 miles).
Tracks have an axle load capacity of 12.5 tons, which restricts wagon loading (and is not consistent with neighboring countries that are reconstructing their networks to allow axle loads of 15–20 tons). MR is developing plans to increase axle load capacity to 20 tons to be consistent with other countries

10�Myanmar Transport Sector Policy Note: Railways
in the Greater Mekong Subregion (GMS). MR has been progressively upgrading its rail from 60 pounds to 75 pounds and replacing wooden sleepers with concrete sleepers produced in plants constructed under build–operate–transfer (BOT) arrangements with MR. As of 2014, about 50% of sleepers are concrete.
MR spent about $1,650 per track kilometer on maintenance in FY2014. This is very low by international comparison, which reflects the low standards used by MR. But this should be viewed with caution as track maintenance requirements are a function of the extent of mechanization, traffic volume (gross tonnage), train speed, and geographic conditions.
Poor track conditions are a problem for MR and are a major cause of accidents and train delays. The major track problems to be addressed are the following:
Most track work is manual. Track maintenance is not mechanized, and there is a shortage of skilled labor to maintain track primarily due to MR’s low wages.Track ballast is a major problem. In many locations, track ballast is either absent or of insufficient depth, which severely affects ride comfort. MR has since 2011 moderately increased its renewal efforts (Figure 14). Facilities for producing ballast of appropriate size and hardness are however insufficient.Longer crossing loops are needed on the Mandalay–Myitkyina track sections to increase capacity. There are many old rail bridges that need rehabilitation or replacement. Up to 30% of the 11,818 bridges may need major repair, based on a sample of bridge inspections undertaken by JICA from Yangon to Taungoo.
MR has already started track upgrading on the Yangon–Mandalay corridor. The corridor is now double-tracked, and welded and concrete sleepers have been installed. Further upgrading is under consideration consistent with the national transport development master plan and other investment requirements.
Figure 14: Sleeper and Ballast Renewal
0 100,000 200,000 300,000 400,000 500,000 600,000 700,000
FY19
87FY
1988
FY19
89FY
1990
FY19
91FY
1992
FY19
93FY
1994
FY19
95FY
1996
FY19
97FY
1998
FY19
99FY
2000
FY20
01FY
2002
FY20
03FY
2004
FY20
05FY
2006
FY20
07FY
2008
FY20
09FY
2010
FY20
11FY
2012
FY20
13
Wood sleepers replacement (No.) Ballast replenishment (m3)Concrete sleepers replacement (No.)
FY = fiscal year, m3 = cubic meter, No. = number.Source: Myanma Railways Performance Indicators (FY1988 to FY2013).
Railway Assets and Staff�11
Between 2013 and 2015, MR completed tenders to the private sector to provide track maintenance services (mechanized) on the Yangon–Mandalay–Myitkyina track sections. Tenders have also been completed for the welding of track between Mandalay and Myitkyina. Evaluation of proposals was underway at the time of writing. Discussions with the Government of the Republic of Korea on funding for these works were also ongoing.
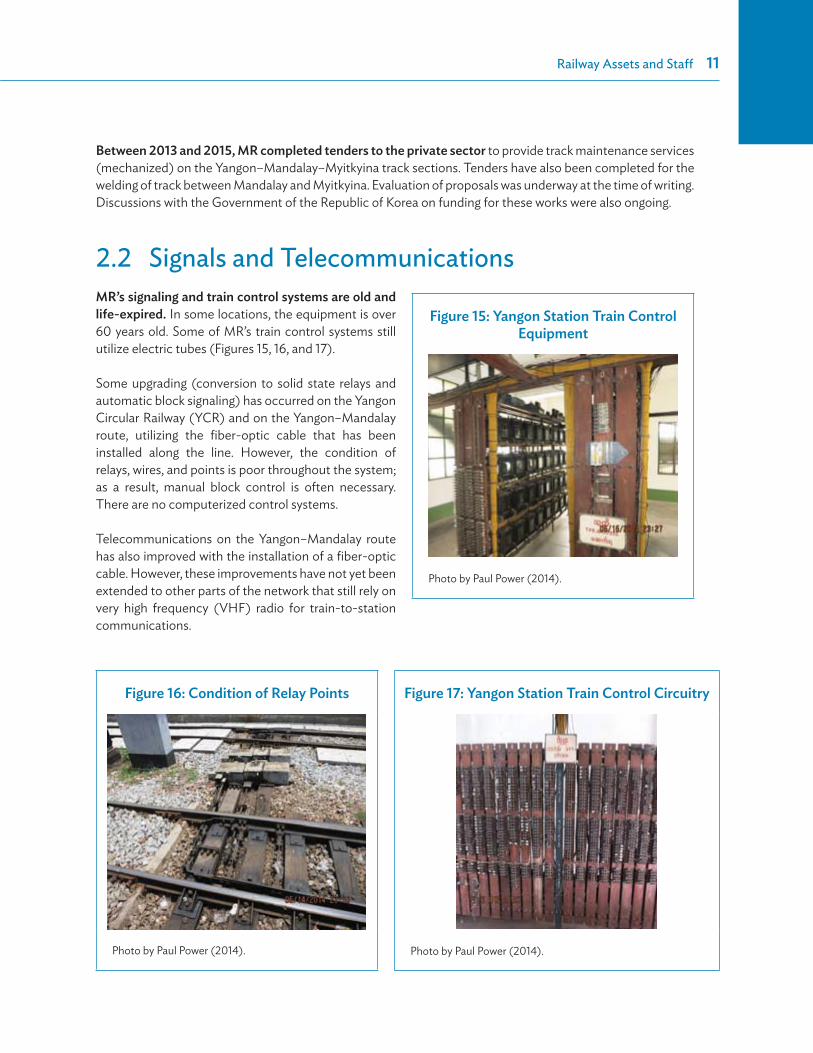
2.2 �Signals and TelecommunicationsMR’s signaling and train control systems are old and life-expired. In some locations, the equipment is over 60 years old. Some of MR’s train control systems still utilize electric tubes (Figures 15, 16, and 17).
Some upgrading (conversion to solid state relays and automatic block signaling) has occurred on the Yangon Circular Railway (YCR) and on the Yangon–Mandalay route, utilizing the fiber-optic cable that has been installed along the line. However, the condition of relays, wires, and points is poor throughout the system; as a result, manual block control is often necessary. There are no computerized control systems.
Telecommunications on the Yangon–Mandalay route has also improved with the installation of a fiber-optic cable. However, these improvements have not yet been extended to other parts of the network that still rely on very high frequency (VHF) radio for train-to-station communications.
Figure 15: Yangon Station Train Control Equipment
Photo by Paul Power (2014).
Figure 16: Condition of Relay Points
Photo by Paul Power (2014).
Figure 17: Yangon Station Train Control Circuitry
Photo by Paul Power (2014).

12�Myanmar Transport Sector Policy Note: Railways
MR has tendered in 2014 for fiber-optic cable upgrade on the Yangon–Mandalay section, for the extension of fiber-optic cabling throughout the system, and for communications towers. These facilities will be used as shared resources to generate revenue. These planned developments will provide the backbone for improved train control, signaling, and telecommunications.
2.3 �Locomotives and Rolling StockMuch of MR’s rolling stock is old and needs replacement or upgrade. The problems are described in the following paragraphs.
The locomotives and rolling stock are old:
56% of diesel locomotives are over 30 years old (Table 2).74% of hydraulic locomotives are over 30 years old.48% of wagons are over 40 years old (Figure 19).30% of coaches are over 30 years old (Figure 20).Old locomotive units and rail buses breakdown frequently: on average, there are 325 failures per year, or almost 1 failure per day.The overall availability of rolling stock is less than 70%. Because of the age of the units, parts are difficult to obtain as they may no longer be in stock or available.Old locomotives are not fuel-efficient and contribute to MR’s increasingly high fuel usage (Figure 18). Old wagons and coaches are basically worn out, and most are unsuitable for rehabilitation.
MR has assessed some options to address the problem of old locomotives, including
repowering 30 locomotives (with new engines and modern control systems),purchasing new locomotive units, anddeveloping a plant to manufacture diesel multiple unit (DMU) in Myanmar.
Table 2: Overview of Myanma Railways Rolling Stock (as of 2014)
Rolling Stock On Book Operating StoppedaNumber of Rolling Stock
over 30 Years OldDiesel electric locomotives 268 182 86 149 (55.6%)
Diesel hydraulic locomotives 137 68 69 101 (73.7%)
Total 405 250 155 250 (61.7%) Rail buses 166 79 87 166 (100%)b
Passenger coaches 1,331 1,091 240 404 (30.4%)Freight wagons 3,374 2,673 701 1,611 (47.7%)c
a These are awaiting heavy repair or already scrapped. b In 2015, MR was expecting to receive 27 second-hand diesel multiple units from Japan. c The freight wagons are over 40 years old.Source: Myanma Railways.

Railway Assets and Staff�13
MR has the capacity to manufacture new coaches, and its capacity is sufficient to meet current market requirements. Market development would require purchasing new coaches, rail buses, or DMU.
MR is progressively introducing rail buses on the YCR and a range of services outside of Yangon. Many are air-conditioned and thus provide a significant improvement in level of service compared to the locomotive-hauled stock which they are replacing.
Figure 18: Freight Train Fuel Consumption
liter
/1,0
00 to
n-km
6789
10
FY2001 FY2002 FY2003 FY2004 FY2005 FY2006 FY2007 FY2008 FY2009 FY2010 FY2011 FY2012 FY2013
111213141516
FY = fiscal year, km = kilometer.Source: Myanma Railways.
Figure 19: Age Distribution of Wagons (%)
Over 40 years(48%)
Under 10 years(19%)
11–20 years(13%)
21–30 years(14%)
31–40 years(6%)
Source: Myanma Railways.
Figure 20: Age Distribution of Coaches (%)
Over 30 years(30%)
21–30 years(17%)
Under 10 years(29%)
11–20 years(24%)
Source: Myanma Railways.

14�Myanmar Transport Sector Policy Note: Railways
Nonstandardization of rolling stock requires MR to stock a multiplicity of parts for maintenance and repair. It also affects the scheduling of periodic repair.
Locomotives are a mix of Chinese, French, and Indian units.MR operates four different types of diesel locomotives and five different types of hydraulic locomotives.There are four different coach bogie types and eight different wagon bogie types.MR uses two different coupler systems; the systems are incompatible, and as a result trains must be composed based on coupler systems (Table 3).
Another problem is the old maintenance facilities and equipment:
MR has two facilities for major and heavy locomotive repair and periodic overhaul. Insein near Yangon was built in 1875 and Ywataung near Mandalay was built from 1969 to 1975. Wagon and coach repairs (and coach manufacturing) are done at a facility near Myitnge that was built in 1911. (The construction workshop was built in 1973.) The equipment in these facilities is also old and inadequate. For example;
MR has one wagon wheel lathe at Insein (circa 1988). A new one is needed as well as an under floor wheel lathe unit.
Load testing equipment at Insein is 56 years old and needs to be replaced with computerized testing equipment.
Traction motor and generator overhauling shops need to be modernized. Hand tools are scarce and small machinery is old and needs to be replaced.
2.4 � Myanma Railways Organization and Human Resources
MR’s organizational structure is shown in Appendix 1.
MR is a state-owned enterprise, not a corporation. Therefore, it takes instructions from the government and is not held to any performance objectives like corporation (or corporatized state-owned company).
Table 3: Coupler Systems in Use
Rolling StockAAR
ABC Grand TotalHigh Low SubtotalDiesel electric locomotives 61 0 61 207 268Diesel hydraulic locomotives 6 35 41 96 137Total 67 35 102 303 405Passenger coaches 222 150 372 959 1,331Freight wagons 700 232 932 2,442 3,374
AAR = Association of American Railways couplers, ABC = Automatic Buffing Contact coupler.Source: Myanma Railways.

Railway Assets and Staff�15
Railways that are state-owned enterprises often lose sight of the overall objective of a railway, which is to transport passengers and move freight for customers. Instead, the primary objectives often become meeting government directives and delivering railway inputs, such as track maintenance or equipment repair.
MR’s organizational structure is organized by function rather than by line of business. It has possibly too many layers of management. Overall, managers (officers) comprise less than 1.6% of overall staff, but there are also deputy general managers and assistant general managers. As not all officers are trained managers, this structure is particularly bureaucratic and unresponsive in practice.
MR has over 20,000 staff. This is less than the sanctioned level of 32,000; but given the current traffic levels, MR employs more people than most railways of a comparable size. It may be possible—with modernization of management systems, upgrading of rolling stock and equipment, and mechanization of track maintenance—to reduce the number of employees over time. However, given the large potential markets available to MR, it may not be necessary to reduce staff as long as productivity is improved (Figure 21).
Low wages are a problem. The average salary of MR staff is about 70,000 kyats (MK) per month, plus an additional MK30,000 per month contribution to employee welfare—approximately $100 per month overall. These low levels of wages are not sufficient to attract skilled workers and managers (or even unskilled labor) within Myanmar’s growing economy.
Training and capacity development needs attention. MR needs to modernize employee skills in all technical fields to operate and maintain new technology, rolling stock, and equipment.
Figure 21: Myanma Railways Employees by Department
Medical226 (1%)
Finance and controller of stores475 (2%)
Commercial1,467 (7%)
Traffic6,440 (32%)
Civil4,997 (25%)
Managing director office214 (1%)
Mechanical6,357 (32%)
Source: Myanma Railways.

16�Myanmar Transport Sector Policy Note: Railways
MR has two technical training facilities:
Central Institute of Transport and Communication (Railways Technical Training Center) at Meikhtila for general training of staff, station masters, and locomotive drivers; andTechnical Training Center for mechanical and electrical staff at Ywataung.
Both facilities need to be completely upgraded and equipped with modern tools and training aids to provide better training services.
In addition to technical training needs, MR lacks the capacity to undertake financial and operational analysis needed to prioritize and evaluate investment options. Similarly, MR lacks an internal costing capacity that would enable it to evaluate the extent to which operating costs would change with investments. MR’s capacity is also limited in the following areas: marketing, computers and networking, and management information systems (MIS).
2.5 �Information SystemsMR’s data collection is entirely paper-based. Ticketing, freight way billing, and train recording are not computerized. There are no electronic systems to exchange train information from station to station. All operating and financial data are collected and compiled manually. There are no management information systems (MIS) and no centralized asset databases.
Manual compilation of data is tedious, and the lack of automation restricts MR managers’ ability to access timely information and to share information easily.

17
Key Findings
Myanma Railways runs an impressive number of services, but it is forced to limit speed and cannot ensure on-time performance. MR maximizes the use of its main tracks despite the poor quality of its assets. However, systematic track and rolling stock failures force MR to halve potential speed and constrain reliability to 60% on average.
Train derailments and other accidents are very frequent. The accident rate is about 50 times that of a modern rail system. Track condition is a lead issue.
MR’s asset productivity is very low. MR’s assets are generally underutilized; they must be rehabilitated before they can be used more productively. Staff productivity is low, and there may be scope for downsizing. Compounding the operational constraints, most of MR’s network has little traffic and, in many cases, little potential market. Network rationalization would improve productivity.
MR revenues cover only half of MR’s costs. MR has been making operational deficits since 2006. It is estimated estimate that MR’s passenger revenues cover only 66% of operational costs excluding infrastructure (37% of full costs). MR loses money each time it runs a passenger train, with the exception of some express trains. To the contrary, freight revenues cover 120% of operational costs excluding infrastructure (65% of total costs).
Despite the critical need for asset renewal, MR mainly invests in new lines with little market potential. The government’s average annual investments reached $100 million during FY2008. However, 88% of investments have been for new railway lines (FY2009 data).
3 Railway Performance
This section looks at MR’s performance in the context of its market results and the condition of MR assets.
3.1 �Operational3.1.1 �Train Performance
MR operated 443 trains per day in FY2013, which is consistent with its operations since FY2009. The quantity of MR’s services is impressive, given that these trains are operated with outdated train control systems, signaling equipment, and rolling stock (Table 4).

18�Myanmar Transport Sector Policy Note: Railways
3.1.2 �Freight Trains
MR freight trains are short (often less than 20 wagons) and transport 500–600 net tons of freight on average. On the Yangon–Mandalay and Mandalay–Myitkyina services, freight trains are usually powered by two locomotive units.7 On most other routes, freight is carried in mixed passenger and freight trains, and trains are usually powered by one unit.
Freight traffic management is complicated by several problems:
a high system-wide empty return ratio (no backhaul on most of MR’s shipments),long train (and wagon or coach) turnaround due to low average train speed (average turnaround per wagon is 7.5 days),low equipment availability,different coupler systems, andmanual loading and unloading.
Train speed is constrained overall by the poor quality of train control and signaling systems (which increase station dwell times) and by the age of rolling stock.
The speed of express trains is generally higher because there is no loading and unloading at stations, as is the case with ordinary and local freight trains.
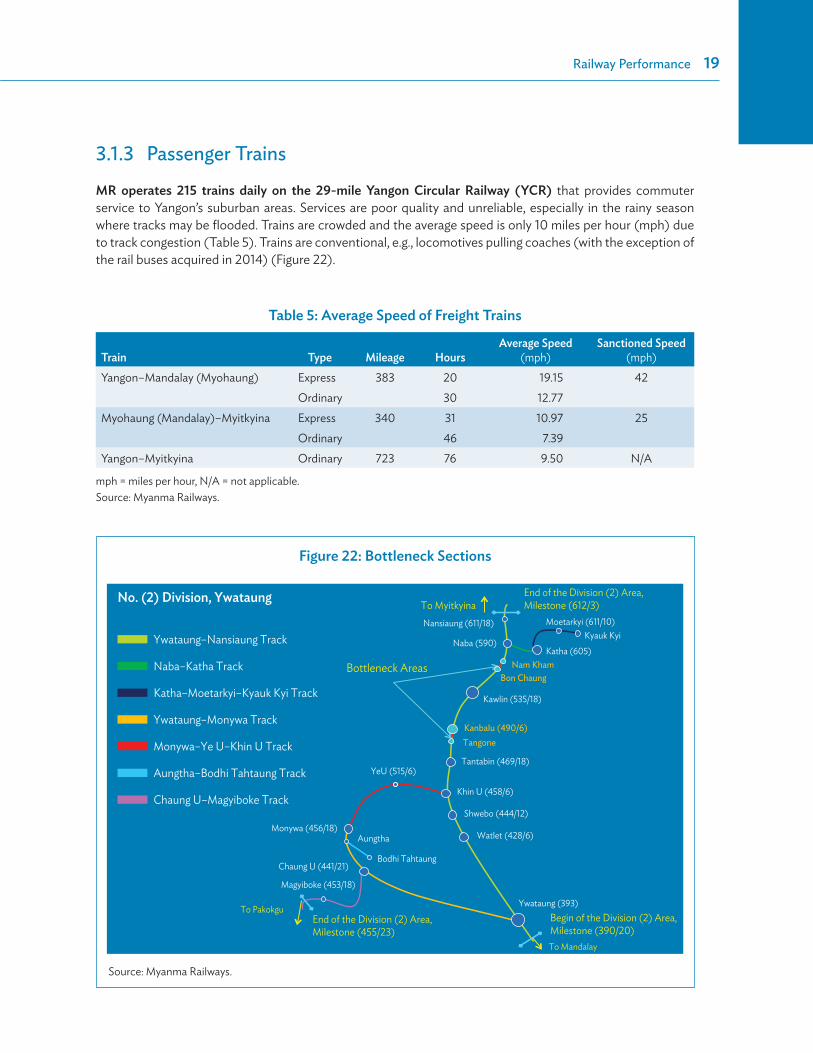
Train speed on Mandalay–Myitkyina is severely restricted by physical track capacity. MR operates more than 30 trains (including passenger trains) per day on this section, which has a single track in poor condition (minimal ballast and poor platform) and no passing loops. Block signaling is also old (circa 1949) and unreliable. It is manually activated and paper line clearance is required for track possession in bottleneck sections where operations are even more severely restricted due to the narrow width of the right of way.
7 Yangon–Mandalay express freight trains are 1,200 gross tons.
Table 4: Myanma Railways Daily Train Runs
Train Type Number of Trains per DayIntercity passenger 198�Express 42�Mail and others 66�Mixed 62�Rail bus 28Yangon Circular (suburban) 215Freight 30Total 443
Source: Myanma Railways.
Railway Performance�19
3.1.3 �Passenger Trains
MR operates 215 trains daily on the 29-mile Yangon Circular Railway (YCR) that provides commuter service to Yangon’s suburban areas. Services are poor quality and unreliable, especially in the rainy season where tracks may be flooded. Trains are crowded and the average speed is only 10 miles per hour (mph) due to track congestion (Table 5). Trains are conventional, e.g., locomotives pulling coaches (with the exception of the rail buses acquired in 2014) (Figure 22).
Table 5: Average Speed of Freight Trains
Train Type Mileage HoursAverage Speed
(mph)Sanctioned Speed
(mph)Yangon–Mandalay (Myohaung) Express 383 20 19.15 42
Ordinary 30 12.77Myohaung (Mandalay)–Myitkyina Express 340 31 10.97 25
Ordinary 46 7.39Yangon–Myitkyina Ordinary 723 76 9.50 N/A
mph = miles per hour, N/A = not applicable.Source: Myanma Railways.
Figure 22: Bottleneck Sections
Begin of the Division (2) Area,Milestone (390/20)
Kawlin (535/18)
Tantabin (469/18)
Khin U (458/6)
Shwebo (444/12)
Watlet (428/6)
Naba (590) Katha (605)
Moetarkyi (611/10) Kyauk Kyi
Nansiaung (611/18)
Monywa (456/18)
Chaung U (441/21)
Magyiboke (453/18)
Bodhi Tahtaung
Aungtha
Ywataung (393)
End of the Division (2) Area,Milestone (612/3)
End of the Division (2) Area,Milestone (455/23)
To Myitkyina
To Mandalay
To Pakokgu
Tangone
Nam KhamBon Chaung
Kanbalu (490/6)
Bottleneck Areas
YeU (515/6)
No. (2) Division, Ywataung
Ywataung–Nansiaung Track
Naba–Katha Track
Katha–Moetarkyi–Kyauk Kyi Track
Ywataung–Monywa Track
Monywa–Ye U–Khin U Track
Aungtha–Bodhi Tahtaung Track
Chaung U–Magyiboke Track
Source: Myanma Railways.

20�Myanmar Transport Sector Policy Note: Railways
There has been much discussion within MR about changes to the YCR. Operating commuter rail services requires a considerable portion of MR’s resources and dedication. At the time of writing, MR was introducing diesel multiple units (DMU) to replace conventional trains. MR was also considering a public–private partnership arrangement for YCR operation, which would include service improvements, investment in equipment, rehabilitation of stations, and redevelopment of the Yangon station and lands.
MR operated 198 intercity passenger trains per day in 2013–204. Intercity trains are both conventional and rail buses. As noted earlier, intercity passenger train fares are cheaper than highway buses, but slower and much less comfortable (Table 6).
Coaches are old, seats are worn out, and there is no air conditioning. Water and toilet facilities are poor. Services are often unreliable due to breakdowns.
A train on the Yangon to Mandalay route typically comprises eight to nine ordinary coaches, two to five upper coaches, plus a brake van. Sleepers are added on overnight services. On average, there are 90 persons per coach in ordinary class on the Yangon–Mandalay and Mandalay–Myitkyina trains.
The average speed of intercity trains is low, and travel by train generally takes much longer than by bus (Table 7). The main exception is the link between Mandalay and Myitkina, where roads are not well developed. The low speed is due to the track condition and to the practice of many nonexpress services stopping at many, if not all, stations.
Table 6: Number of Intercity Trains Operated by Myanma Railways
Route Express Mail Local Rail Bus TotalYangon–Mandalay 6 4 8 8 26Yangon–Naypyitaw 4 4Mandalay–Myitkyina 8 4 12 2 26Yangon–Bagan–Pakokku 4 2 2 8Pathein–Hinthada–Kyangin 2 16 6 24Bagan–Mandalay 2 2Yangon–Mawlammyine–Dawe 10 2 4 16Others 6 34 36 16 92Total 42 62 66 28 198
Note: Not all trains operate the full length of the route.Source: Myanma Railways.
Table 7: Average Speed of Passenger Trains in Main Corridors
Train Type Mileage Hours Average Speed (kph) Sanctioned Speed (kph)Yangon–Mandalay Express 383 14.5 42 68
Mail 25.0 24Mandalay–Myitkyina Express 340 19.0 29 40
Mail 26.5 21Local 30.0 18
kph = kilometers per hour.Source: Myanma Railways.

Railway Performance�21
Poor punctuality is another issue. The reasons for poor punctuality vary according to the train operation, but generally they are attributable to
locomotive failures,brake failures,track caution orders,wagon (wheel) failures,delays at crossings, delays at stations due to signaling failures, and on the congested Mandalay-Myitkyina section, a delayed train delays all other trains.
In general, about 60% of MR intercity trains arrive or depart on schedule (Table 8). MR has set a target of 80%. Many express trains meet it, but not the local trains and “mail” trains.
Table 8: On-Time Performance of Trains (as of 2013)
Train Target (%) Achievement (%) Difference Train Target (%) Achievement (%) Difference1 Up 70 61 –9 2 Dn 70 80 103 Up 80 19 –61 4 Dn 80 80 05 Up 80 19 –61 6 Dn 80 80 0
11 Up 80 64 –16 12 Dn 80 77 –333 Up 80 23 –57 34 Dn 80 7 –7337 Up 80 24 –56 38 Dn 80 3 –7755 Up 80 61 –19 56 Dn 80 32 –4857 Up 80 13 –67 58 Dn 80 77 –3
119 Up 80 93 13 120 Dn 80 90 1041 Up 70 22 –48 42 Dn 70 26 –4447 Up 70 12 –58 48 Dn 70 4 –66131 Up 70 93 23 132 Dn 70 90 20135 Up 70 48 –22 136 Dn 70 35 –35117 Up 70 97 27 118 Dn 70 93 23123 Up 70 81 11 124 Dn 70 81 11
M-41 70 93 23 R-46 70 87 1723 Up 70 93 23 24 Dn 70 90 20115 Up 70 100 30 116 Dn 70 100 30
Dn = Down. Source: Myanma Railways.
3.2 �SafetyMR has experienced a high number of derailments and other accidents over the years. MR’s accident rate is 0.852 accidents per million traffic units. This is about 50 times the level in modern railways. Most of these accidents are simple derailments (Figure 23), linked to poor track condition.

22�Myanmar Transport Sector Policy Note: Railways
Figure 23: Number of Rail Accidents
Derailment between sections Train parting OthersDerailment within station yard Accident on level crossing
0
100
200
300
400
500
600
700
800
FY2001FY1999 FY2000 FY2002 FY2003 FY2004 FY2005 FY2006 FY2007 FY2008 FY2009 FY2010 FY2011 FY2012 FY2013
FY = fiscal year.Source: Myanma Railways.
There is no central entity (office) within MR responsible for ensuring the safety of operations. MR operates according to a set of general rules that specify safety requirements and regulations, and MR trains staff on these rules periodically.
Station masters manage safety at the station level, and the Mechanical Department inspects the trains prior to departure. Assistant permanent way inspectors, who routinely examine track for defects, manage safety on track sections.
The train controller manages track possession, and often radio communication (or paper authorization or manual unlocking) is required to ensure the protection of work gangs. Guards operate road crossings. Most crossing barriers are manually operated, except for some sections on the YCR.
3.3 �ProductivityMR’s asset and staff productivity is low when compared to similar countries. Table 9 shows some operating performance indicators for MR in comparison with other Southeast or South Asian countries. MR’s performance indicators are lower than most other benchmarks, with the exception of the traffic units per locomotive. For instance, with a shorter network and about as many staff, Indonesia’s railways move 10 times more freight and 4 times as many passengers.
Overall, MR physical assets (track and rolling stock) are underutilized, which means that there is extra capacity to handle additional passengers and freight. However, because of the condition of the assets, they must be rehabilitated or replaced if they are to be used more productively to handle higher traffic volumes.
Railway Performance�23
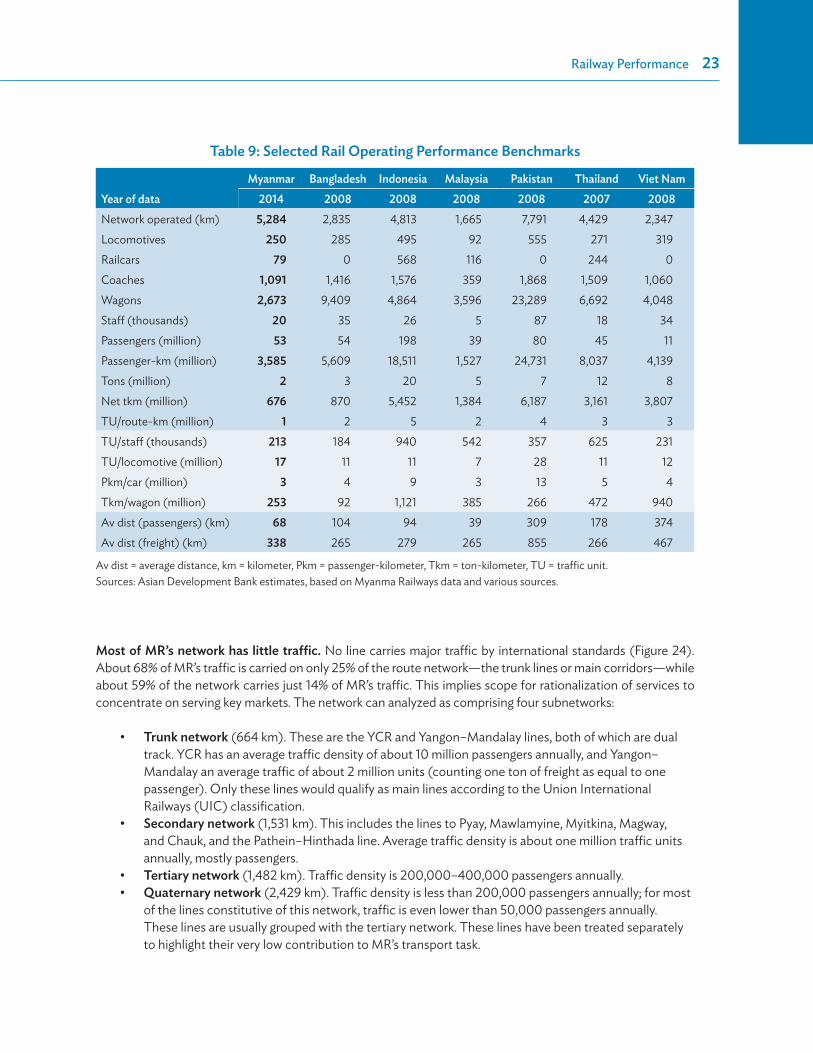
Most of MR’s network has little traffic. No line carries major traffic by international standards (Figure 24). About 68% of MR’s traffic is carried on only 25% of the route network—the trunk lines or main corridors—while about 59% of the network carries just 14% of MR’s traffic. This implies scope for rationalization of services to concentrate on serving key markets. The network can analyzed as comprising four subnetworks:
Trunk network (664 km). These are the YCR and Yangon–Mandalay lines, both of which are dual track. YCR has an average traffic density of about 10 million passengers annually, and Yangon–Mandalay an average traffic of about 2 million units (counting one ton of freight as equal to one passenger). Only these lines would qualify as main lines according to the Union International Railways (UIC) classification.Secondary network (1,531 km). This includes the lines to Pyay, Mawlamyine, Myitkina, Magway, and Chauk, and the Pathein–Hinthada line. Average traffic density is about one million traffic units annually, mostly passengers.Tertiary network (1,482 km). Traffic density is 200,000–400,000 passengers annually.Quaternary network (2,429 km). Traffic density is less than 200,000 passengers annually; for most of the lines constitutive of this network, traffic is even lower than 50,000 passengers annually. These lines are usually grouped with the tertiary network. These lines have been treated separately to highlight their very low contribution to MR’s transport task.
Table 9: Selected Rail Operating Performance Benchmarks
Year of data
Myanmar Bangladesh Indonesia Malaysia Pakistan Thailand Viet Nam2014 2008 2008 2008 2008 2007 2008
Network operated (km) 5,284 2,835 4,813 1,665 7,791 4,429 2,347Locomotives 250 285 495 92 555 271 319Railcars 79 0 568 116 0 244 0Coaches 1,091 1,416 1,576 359 1,868 1,509 1,060Wagons 2,673 9,409 4,864 3,596 23,289 6,692 4,048Staff (thousands) 20 35 26 5 87 18 34Passengers (million) 53 54 198 39 80 45 11Passenger-km (million) 3,585 5,609 18,511 1,527 24,731 8,037 4,139Tons (million) 2 3 20 5 7 12 8Net tkm (million) 676 870 5,452 1,384 6,187 3,161 3,807TU/route-km (million) 1 2 5 2 4 3 3TU/staff (thousands) 213 184 940 542 357 625 231TU/locomotive (million) 17 11 11 7 28 11 12Pkm/car (million) 3 4 9 3 13 5 4Tkm/wagon (million) 253 92 1,121 385 266 472 940Av dist (passengers) (km) 68 104 94 39 309 178 374Av dist (freight) (km) 338 265 279 265 855 266 467
Av dist = average distance, km = kilometer, Pkm = passenger-kilometer, Tkm = ton-kilometer, TU = traffic unit.Sources: Asian Development Bank estimates, based on Myanma Railways data and various sources.

24�Myanmar Transport Sector Policy Note: Railways
3.4 �Financial PerformanceThe increasing level of expenditure is not sustainable. MR had in FY2014 a working ratio (i.e., cash costs excluding depreciation compared to cash revenues) of 140%. Its operating ratio, if computing depreciation at replacement value, may be 180% or higher. Modern railways have much lower operating ratios (75%–100%). In Northern America, this is achieved without direct subsidy. In Europe and Japan, this is achieved only after direct payments from the government for public service obligations and/or infrastructure capital or maintenance subsidies.
An analysis of MR’s cost structure indicates that MR’s freight operation is covering its direct costs (fixed and variable). Freight revenues do not cover all capital costs. Freight revenues do not cover all capital costs, but are close to covering all above rail costs, so that a private operator may be able to invest (Table 10).
In contrast, passenger services only cover 67% of their direct above rail costs, and only 37% of total costs (Table 11).
Figure 24: Distribution of Myanma Railways Network by Traffic Density
1
0
2
3
4
5
6
7
8
9
10
11
0 1,000 2,000 3,000 4,000 5,000
UIC7
UIC8
Trunk network:–11% of length–50% of traffic
Secondary network:–25% length–37% traffic Tertiary network:
–24% of length–9% of traffic
Network length (km)
Quaternary network:–40% of length–4% of traffic
UIC5
UIC9
Traffi
c den
sity (
milli
on p
asse
nger
and
ton
per k
m p
er ye
ar)
km = kilometer, UIC = Union International Railways.Note: UIC1–9 is an international scale for railway traffic density, UIC1 includes lines with the highest traffic.Source: Asian Development Bank analysis of Myanma Railways data.

Railway Performance�25
Figure 25: Myanma Railways Revenue and Expenditures per Unit of Traffic (constant 2013 MK per unit of traffic)
Revenues per traffic unit
05
1015
202530354045
Expenditures per traffic unit
FY1990 FY1995 FY2000 FY2004 FY2005 FY2006 FY2007 FY2008 FY2009 FY2010 FY2011 FY2012 FY2013
cons
tant
MK
per u
nit o
f tra
ffic
FY = fiscal year.Sources: Asian Development Bank analysis of Myanma Railways data.
Table 10: Analysis of Freight Cost Coverage Ratio, FY2014 (MK per ton-km)
Item All costs Above Rail Costsa
Fixed costs 6.8 0Variable costs 24.9 24.9Capital costs 14.9 10.4Total Costs 46.6 35.4
Average revenues 30.5 30.5Revenues in % of direct costs (fixed + variable) 96 122Revenues in % of total costs 65 86
Notes: Infrastructure costs distributed on basis of train-miles. Capital charges based on a mixture of new and secondhand equipment at a 4% real interest rate per annum.a Above rail costs do not include track costs.Source: Asian Development Bank estimates based on a costing model developed under ADB. 2014. Technical Assistance to Myanmar for Transport Sector Reform and Modernization. Manila.
Table 11: Analysis of Passenger Cost Coverage Ratio, FY2014 (MK per passenger-km)
All costs Above Rail Costsa
Fixed costs 4.4 0Variable costs 14.5 14.5Capital costs 7.3 4.6Total Costs 26.2 19.1
Average revenues 9.7 9.7Revenues in % of direct costs 51 67Revenues in % of total costs 37 51
Notes: Infrastructure costs distributed on the basis of train-miles. Capital charges based on a mixture of new and secondhand equipment at a 4% real interest rate per annum.a Above rail costs do not include track costs.Source: Asian Development Bank estimates based on a costing model developed under ADB. 2014. Technical Assistance to Myanmar for Transport Sector Reform and Modernization. Manila.

26�Myanmar Transport Sector Policy Note: Railways
Raising fares and tariffs cannot help reduce MR’s high working ratio. MR has little scope to increase tariffs and fares, given the large increases since 2010–2011 and MR’s lack of competitiveness with buses and trucks. The focus will need to be on
rationalizing services,significantly reducing operating expenses, andeliminating financial burdens.
About 40% of MR’s costs is attributable to fuel and materials used by the Mechanical Department. Replacing or repowering many of MR’s old (and not fuel-efficient) locomotives and standardization of rolling stock could significantly reduce operating costs. Similarly, MR incurs significant expenses to keep old wagons and coaches in running order.
MR operates many light density lines and services. As noted in the section on productivity, 64% of MR’s route network (tertiary and quaternary lines) generates only 13% of MR’s traffic. Cost reductions could be achieved by reducing or stopping services on part of these lines. Beyond this, a detailed analysis shows that express trains cover about their direct operating costs, but that mail and local trains cover just half of them. MR could rationalize its supply considering the extent to which each service covers direct operating costs (Table 12).
Table 12: Revenues and Costs by Type of Service, FY2014(MK billion)
PassengersFreight Infrastructure TotalExpress Mail Local YCR Total
Costs OPEX excluding track 23.4 12.0 9.7 7.1 52.1 14.8 66.9Rolling stock CAPEX 7.2 3.5 3.3 2.4 16.4 6.2 22.6Track OPEX 6.7 3.7 3.3 1.9 15.6 4.0 19.6Track CAPEX 4.7 2.3 1.7 0.8 9.6 2.6 12.2Total costs 42.0 21.5 18.0 12.2 93.8 27.6 121.3
Revenues 20.4 6.0 5.7 2.6 34.7 18.0 9.1 61.8
CAPEX = capital expenditures, FY = fiscal year, OPEX = operating expenditures, YCR = Yangon Circular Railway.Source: Asian Development Bank estimates based on a costing model developed under ADB. 2014. Technical Assistance to Myanmar for Transport Sector Reform and Modernization. Manila.
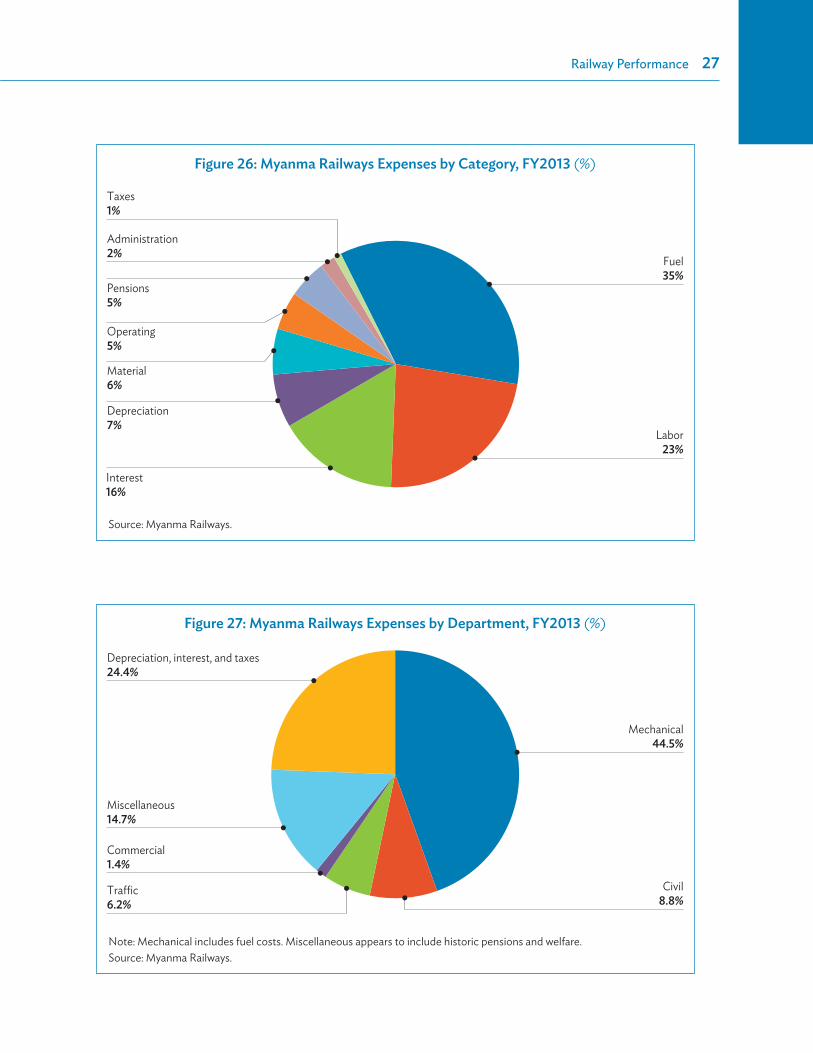
Cost reductions could also be achieved by eliminating MR’s responsibility for historic pensions for the provision of medical, and welfare services to employees. These two items account for MK12 billion or 11% of MR’s operating expenses in FY2013. A part of welfare costs is reportedly bonuses paid to staff on a standard basis, which should be considered as salaries and unlikely to lead to cost reductions (Figures 26 and 27).
Railway Performance�27
Figure 26: Myanma Railways Expenses by Category, FY2013 (%)
Taxes1%
Administration2%
Pensions5%
Operating5%
Material6%
Depreciation7%
Interest16%
Fuel35%
Labor23%
Source: Myanma Railways.
Figure 27: Myanma Railways Expenses by Department, FY2013 (%)
Depreciation, interest, and taxes24.4%
Miscellaneous14.7%
Commercial1.4%
Traffic 6.2%
Mechanical44.5%
Civil8.8%
Note: Mechanical includes fuel costs. Miscellaneous appears to include historic pensions and welfare.Source: Myanma Railways.

28�Myanmar Transport Sector Policy Note: Railways
3.5 � Myanma Railways Management PerformanceThe government’s excessive involvement in MR management hampers strategic and business management. The Ministry of Transport and Communications (Ministry of Railway Transportation until April 2016) is practically responsible for any budgeting, planning, procurement, staff, and services decision. During the year, deviations from previously approved budgets and plans require new approvals. This process stifles initiative and slows down decisions, not least because the ministry allocates few staff to meet this important responsibility. Also, in practice, political motivations have prevailed over business needs (e.g., to invest into new lines rather than maintain the trunk network).
MR management is complacent. MR managers are accustomed to responding to the government’s wishes and to being told what to do rather than managing the company and innovating. There has been a lack of management focus on building the railway business, which includes marketing, customer service, and introducing systems to aid in the management of assets and operations.
As a result, there is an unwillingness to take initiative to address MR’s problems. Some leaders in MR have strategic leadership capacity, but they do not have the power to introduce change.
A change in management style can only be achieved through a change in governance. In order to meet the challenges of the transport market and to restore MR’s assets, a change in focus is necessary and this will require separation of the Ministry of Transport and Communications from MR, changes in MR’s governance (i.e., corporatization) and possibly changes to MR’s internal structure.
The first step would involve allowing MR management to radically overhaul policies and procedures in line with business needs. But this alone will not solve MR’s economic problems, and the government will need to provide significant financial support for many years.
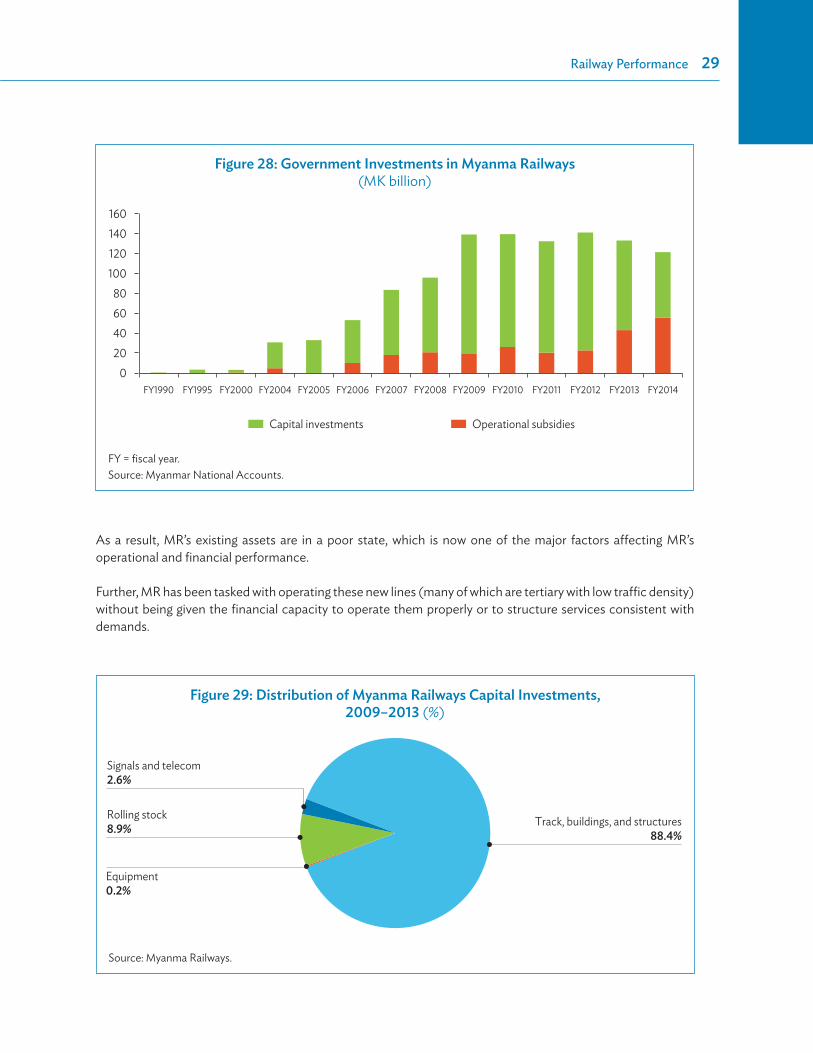
3.6 �Government InvestmentsThe Myanmar government has invested more than MK800 billion ($800 million) into MR between 2009 and 2014. This includes MK186 billion in operational subsidies and MK620 billion in capital investments. The figure below shows the trend and extent of Myanmar’s investment in its railway system (Figure 28).
Almost 88% of capital investment in MR since FY2009 has been into track, a large share of which has been for the construction of new (mainly tertiary) lines. Although historically, capital investment in transport infrastructure has been only about 1% of GDP, roughly 30% of investment has been in railways, mostly in the construction of new railway lines. The size of MR’s railway trackage has increased by almost 100% since 1988. There is no evidence that a serious feasibility study of the new lines was undertaken (Figure 29).
Investing in the construction of new trackage has led to the neglect and deterioration of other railway assets. Investment in other railway assets (track, rolling stock, equipment, signaling, and automation) has been negligible relative to the massive amounts invested in line construction.
Railway Performance�29
As a result, MR’s existing assets are in a poor state, which is now one of the major factors affecting MR’s operational and financial performance.
Further, MR has been tasked with operating these new lines (many of which are tertiary with low traffic density) without being given the financial capacity to operate them properly or to structure services consistent with demands.
Figure 29: Distribution of Myanma Railways Capital Investments, 2009–2013 (%)
Track, buildings, and structures88.4%
Signals and telecom2.6%
Rolling stock8.9%
Equipment0.2%
Source: Myanma Railways.
Figure 28: Government Investments in Myanma Railways (MK billion)
020406080
100120140160
FY1990 FY1995 FY2000 FY2004 FY2005 FY2006 FY2007 FY2008 FY2009 FY2010 FY2011 FY2012 FY2013 FY2014
Capital investments Operational subsidies
FY = fiscal year.Source: Myanmar National Accounts.

30
4 Options for Improving Myanma Railways Performance
MR is charged with being “all things to all people,” and this is a difficult task. MR operates freight trains, mixed trains, intercity passenger trains, and commuter trains. It employs over 20,000 people directly (and even more indirectly). It maintains and operates a large rail network, and it must operate services even where such operations are not economically justified. It is required to operate and maintain many new railway lines without the financial and operating capacity to do so. It operates trains with nonstandardized and aged rolling stock under the control of ancient signaling.
It is commendable that MR’s staff has managed to hold the railway together for so long, with most capital investment going to the construction of new lines. But despite this effort, MR is now at a crossroads. If the declining trend in the use of MR’s services continues, MR risks becoming irrelevant in the freight transport market and losing more of its share of the passenger market. If service quality is not improved soon, fewer people will want to take the train regardless of cheap fares.
Key Findings and Suggestions
Myanma Railways (MR) is at a crossroads. Three scenarios can be conceived:
Business as usual. If things keep going as they are, MR’s market share would dwindle until the Yangon–Mandalay track is fully rehabilitated. Despite this investment, MR would require permanent subsidies in order to remain financially viable.Extensive growth. Alternatively, the government could choose to lower rail rates, increase volumes, and invest massively in track and rolling stock. Such strategy would require a lasting government commitment to subsidize up to $300 million a year most of the rail investments as well as operational expenditures.Revival. A strategy to revive the railways ensures MR’s market share in the long term and makes MR financially sustainable. It requires reorienting MR on a commercial basis, rationalizing its assets, changing its investment strategy, developing freight services, recapitalizing, debt restructuring, reorganizing the MR, and revising its relationship with the government. This strategy requires significant initial financial and political commitment from the government as well as donor assistance. In the long term, this support could be reduced, particularly if the government cuts back on uneconomic services.
Only the revival strategy can ensure the long-term sustainability of the railways in Myanmar.

Options for Improving Myanma Railways Performance�31
Despite this dismal diagnosis, there are considerable opportunities for MR to thrive within a rapidly growing market for transport services. These opportunities are accessible to MR provided that the government makes some changes in its railway policy. MR’s problems, potential solutions, and operating constraints are summarized in Tables 13 and 14.
Table 13: Summary Diagnostic
Factor Observations ConstraintsCompetitiveness MR has lost significant market share to the
road sector in a short time span.MR passenger service is cheap but uncomfortable, unreliable, and slow. MR’s share of the freight transport market is insignificant.MR does not operate container transport services.
MR assets need significant upgrading if MR is to sustain its current market share and adequately serve future markets.MR has limited freedom to structure and price services.MR’s organization is not market responsive and is focused on keeping the railway running.
Assets Perhaps 50% of locomotive, rolling stock, and coaches need to be replaced.Locomotive, rolling stock, and maintenance facilities are outdated and poorly equipped.Track conditions are poor and a major cause of derailments and speed restrictions.Signaling and train control systems are 60 years old.Capacity bottlenecks on Mandalay–Myitkyina are significant.There is no automation of information processing.Staff technical skills need to be upgraded.
Government has invested heavily in the construction of new lines, leaving little money to rehabilitate or upgrade existing physical assets or to upgrade human resources and management systems.Investment decisions will be complex, and MR lacks capacity in financial and cost analysis.
Operational performance
Asset productivity is low.Train performance is restricted by the condition of the tracks and rolling stock and by unreliable signaling.MR operates many uneconomic services in the public interest.
Investment is lacking.There is no framework to rationalize services.
Financial performance
Current working ratio is near 140%.Expenses are increasing faster than revenues.Freight recovers most of its costs, and its market share could be increased.Passenger services recover about 50% of direct costs and are not viable without restructuring.
There is little scope for increasing tariffs and fares.MR funds historic staff pensions.Locomotives are old and not fuel-efficient.
MR = Myanma Railways.Source: Asian Development Bank.

32�Myanmar Transport Sector Policy Note: Railways
Table 14: Potential Solutions and Constraints
Main Problems Possible Solutions ConstraintsFreight Services MR is not consumer
responsive.Major decisions are outside of MR’s control. MR has little freedom to ° enter into joint venture
with private sector, ° price freight and
passenger services, ° structure freight and
passenger services consistent with demand, and
° rationalize services.MR must deliver many loss-making passenger services in public interest.Investments are required to upgrade and modernize assets.MR is responsible for providing nonrailway (social) services and for paying pensions.MR lacks capacity in marketing, costing, and pricing.MR has limited capacity to analyze and prioritize investments.Organization lacks focus on commercial freight business.MR lacks capacity to implement and manage change.MR management is complacent.There are no performance targets.
Small market share in growing marketNo strong demand for services High tariffs High empty return ratio
Modernize handling facilities to increase share of bulk transport market Implement container services and develop intermodal terminals and facilitiesDevelop new markets and expand customer base through active marketing Develop reliable train services in tune with customer requirementsRationalize services to reduce operating costs and focus on core markets Form joint ventures with private sector for train operations and for operation of handling facilities and intermodal terminalsSecure reliable rolling stock and improve management of assets Develop effective pricing for servicesSeparate freight from passenger services Develop automated data processing systems
Passenger Services Maintain and increase market share in an expanding marketUncompetitive services (cheap, slow, uncomfortable trains)Large operating losses
Reduce travel times Reduce breakdowns and delaysImprove traveler comfort and services ° Acquire new coaches or DMU ° Improve on-board services
Rationalize services to reduce operating cost and focus on core markets ° Develop PSO contract arrangements on
tertiary lines and YCRSecure reliable rolling stock and improve management of assetsDevelop new services to meet market demands Separate freight from passenger servicesSeparate YCR from intercity passenger services Introduce electronic ticketing Install automated trains to track control and communication systems Develop automated data processing systems
InfrastructurePoor track conditions a major cause of breakdowns and delaysNetwork too large to maintain properly within operating budget Old signaling and communications
Bring track into a “fit-for-purpose” conditionMechanize maintenance (once track condition enables use of equipment)Privatize maintenance Separate infrastructure from operationsRationalize lines operated (consolidate network) Improve asset management Acquire new signaling, train control, and communications systems Increase the use of expanded fiber-optic backbone
DMU = Diesel Multiple Unit, MR = Myanma Railways, PSO = Public Service Obligation, YCR = Yangon Circular Railway.Source: Asian Development Bank.
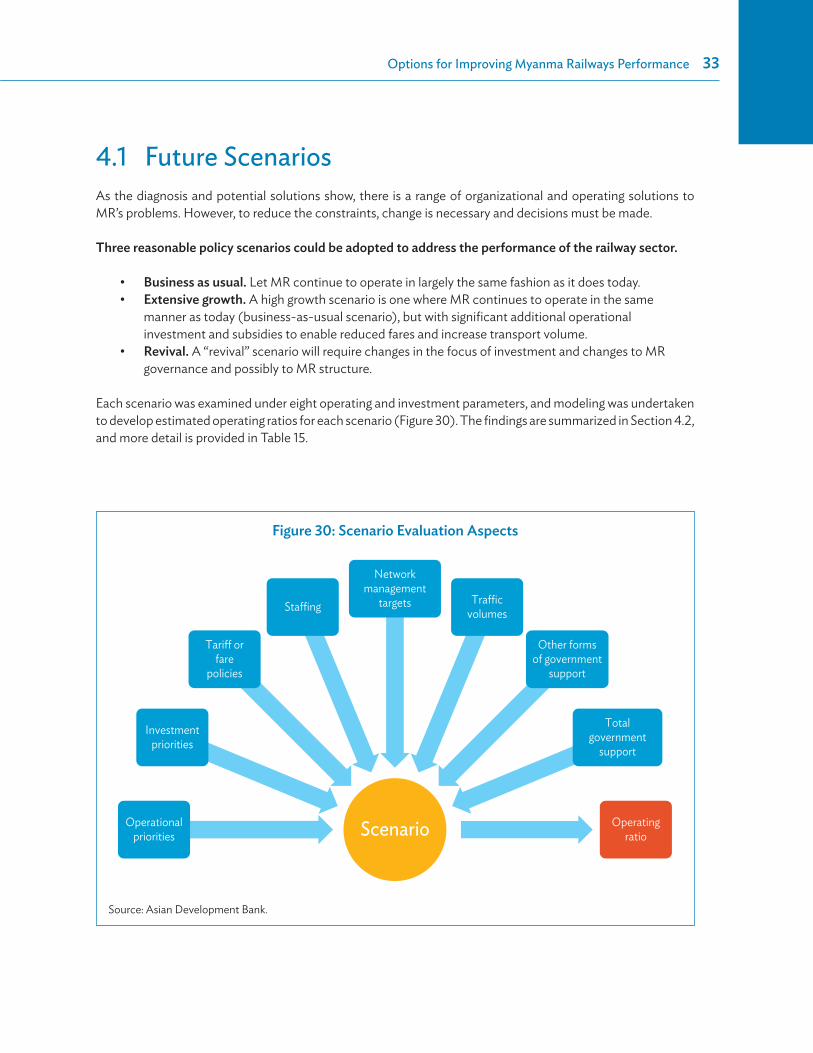
Options for Improving Myanma Railways Performance�33
4.1 �Future ScenariosAs the diagnosis and potential solutions show, there is a range of organizational and operating solutions to MR’s problems. However, to reduce the constraints, change is necessary and decisions must be made.
Three reasonable policy scenarios could be adopted to address the performance of the railway sector.
Business as usual. Let MR continue to operate in largely the same fashion as it does today. Extensive growth. A high growth scenario is one where MR continues to operate in the same manner as today (business-as-usual scenario), but with significant additional operational investment and subsidies to enable reduced fares and increase transport volume.Revival. A “revival” scenario will require changes in the focus of investment and changes to MR governance and possibly to MR structure.
Each scenario was examined under eight operating and investment parameters, and modeling was undertaken to develop estimated operating ratios for each scenario (Figure 30). The findings are summarized in Section 4.2, and more detail is provided in Table 15.
Figure 30: Scenario Evaluation Aspects
ScenarioOperationalpriorities
Investmentpriorities
Tariff orfare
policies
Staffing
Networkmanagement
targets Trafficvolumes
Other formsof government
support
Totalgovernment
support
Operatingratio
Source: Asian Development Bank.

34�Myanmar Transport Sector Policy Note: RailwaysTa
ble
15: S
cena
rio A
naly
sis
Item
Busin
ess a
s Usu
alEx
tens
ive G
row
thRe
viva
lO
pera
tiona
l pr
iorit
ies
Prio
rity:
pass
enge
rs o
ver f
reig
htM
aint
ain
curre
nt le
vel o
f ser
vice
sIn
crea
se fr
eque
ncy o
f pas
seng
er se
rvic
esCo
nsol
idat
e se
rvic
es o
n tru
nk n
etw
ork
Sepa
rate
pas
seng
er fr
om fr
eigh
t ope
ratio
ns
(pos
sibly
sepa
rate
infra
stru
ctur
e)Re
duce
or r
atio
naliz
e se
rvic
es o
n se
cond
ary o
r te
rtiar
y net
wor
kIn
vest
men
t pr
iorit
ies
Gov
ernm
ent:
new
lines
and
defi
cit
finan
cing
Don
ors:
Yang
on–M
anda
lay a
nd Y
CRM
R: ro
lling s
tock
Gov
ernm
ent:
(i) n
ew lin
es, (
ii) M
R de
ficit
finan
cing
, (ii
i) tra
ck re
new
al a
nd ro
lling s
tock
Don
ors:
Yang
on–M
anda
lay a
nd Y
CRM
R: ro
lling s
tock
Gov
ernm
ent:
(i) ro
lling s
tock
(fre
ight
) and
trac
k re
new
al, (
ii) M
R de
ficit
finan
cing
D
evel
opm
ent p
artn
ers:
(i) Y
ango
n–M
anda
lay a
nd
YCR,
(ii)
pass
enge
r rol
ling s
tock
and
trac
k ren
ewal
MR:
rollin
g sto
ckTa
riff o
r far
e po
licie
sN
o ch
ange
Dec
reas
e to
attr
act g
reat
er tr
affic
volu
mes
and
m
aint
ain
com
petit
iven
ess
Flex
ibilit
y: in
crea
se o
r dec
reas
e de
pend
ing o
n m
arke
t con
ditio
ns
Staffi
ngN
o ch
ange
Poss
ibly
incr
ease
Flex
ibilit
y, po
ssib
ly d
ecre
ase
Net
wor
k m
anag
emen
t ta
rget
s
Mod
erni
ze tr
unk l
ines
Exte
nd te
rtiar
y net
wor
kM
inim
al m
aint
enan
ce a
nd re
new
al
Mod
erni
ze tr
unk l
ines
Reha
bilit
ate
seco
ndar
y net
wor
kEx
tend
terti
ary n
etw
ork
Reha
bilit
ate
then
mod
erni
ze tr
unk l
ines
Reha
bilit
ate
seco
ndar
y net
wor
kM
inim
um m
aint
enan
ce o
n te
rtiar
y net
wor
kN
o ex
pans
ion
Inte
rnat
iona
l con
nect
ions
Tr
affic
volu
mes
Dec
reas
e at
5%
–10%
per
year
on
seco
ndar
y or t
ertia
ry n
etw
ork
Dec
reas
e un
til 2
023
then
maj
or
incr
ease
on
Yang
on–M
anda
lay
Frei
ght c
onst
ant a
t mar
gina
l leve
l
Incr
ease
by 1
0% p
er ye
ar o
n se
cond
ary n
etw
ork,
incr
ease
by 5
% p
er ye
ar o
n te
rtiar
y net
wor
kIn
crea
se o
n Ya
ngon
–Man
dala
y (30
milli
on
pass
enge
rs p
er ye
ar) a
nd Y
CRFr
eigh
t con
stan
t at m
argi
nal le
vel
Mod
erat
e in
crea
se o
n se
cond
ary o
r ter
tiary
ne
twor
kSt
able
unt
il 202
3, th
en si
gnifi
cant
incr
ease
on
Yang
on–M
anda
lay b
ut lo
wer
than
“bus
ines
s as
usua
l” sc
enar
io b
ecau
se o
f pos
sible
fare
incr
ease
sFr
eigh
t gro
ws m
oder
atel
y the
n po
ssib
ly to
20
milli
on to
ns a
fter Y
ango
n–M
anda
lay i
mpr
ovem
ent.
Oth
er fo
rms
of go
vern
men
t su
ppor
t
Deb
t on
inve
stm
ent i
n ne
w lin
es
cove
red
by go
vern
men
t (no
t by M
R)N
one
In e
xcha
nge
for l
and
valu
e tra
nsfe
r, th
e go
vern
men
t (i)
cle
ars M
R sh
ort-
term
deb
t, (ii
) tak
es o
ver
pens
ion
cost
s, an
d (ii
i) ta
kes o
ver p
rovi
sion
of
wel
fare
ben
efits
.YC
R an
d te
rtiar
y lin
es c
over
ed b
y PSO
s fro
m
loca
l gov
ernm
ents
Tota
l go
vern
men
t su
ppor
t
Inve
stm
ent:
terti
ary n
etw
ork
exte
nsio
n: $
100
milli
on a
nnua
lM
R de
ficit
finan
cing
: $30
milli
on p
er
year
grow
ing t
o $1
00 m
illion
Gov
ernm
ent t
akes
ove
r deb
t JI
CA lo
ans
Inve
stm
ent:
terti
ary n
etw
ork e
xten
sion:
$10
0 m
illion
per
year
Seco
ndar
y net
wor
k reh
abilit
atio
n: $
100
milli
on p
er
year
MR
debt
take
n ov
er b
y gov
ernm
ent
JICA
loan
s
Equi
ty in
vest
men
t (fir
st 5
year
s)Ro
lling s
tock
: $50
milli
on p
er ye
arTr
ack r
enew
al: $
50 m
illion
per
year
YCR
and
terti
ary l
ines
PSO
con
tract
sEx
istin
g rai
lway
deb
t tak
en o
ver b
y gov
ernm
ent
JICA
/oth
er d
evel
opm
ent p
artn
er lo
ans
Ope
ratin
g rat
io2.
3–2.
53.
0In
itial
ly, 1.
0–1.3
(afte
r PSO
pay
men
ts)
Late
r, 0.
9–1.0
(afte
r PSO
pay
men
ts)
JICA
= Ja
pan
Inte
rnat
iona
l Coo
pera
tion
Age
ncy,
MR
= M
yanm
a Ra
ilway
s, PS
O =
Pub
lic S
ervi
ce O
blig
atio
n, Y
CR =
Yan
gon
Circ
ular
Rai
lway
.So
urce
: Asia
n D
evel
opm
ent B
ank.
Options for Improving Myanma Railways Performance�35
4.2 �Key Scenario Findings
Business-as-Usual Scenario
MR’s market shares continue to decline.Passenger traffic volumes are higher with little improvement in quality of service, except in the upgraded Yangon–Mandalay corridor.Existing assets deteriorate further as investment goes into more construction of tertiary lines.Operating losses increase, and MR’s operating ratio approaches 2.0.
Extensive Growth Scenario
It requires huge capital investment by government.Passenger traffic volumes are very high.Freight traffic is marginal.Operating losses are large, and operating ratio approaches 3.0.
Revival Scenario
Service quality improves due to redirection of investment into upgrading and replacing existing assets.Passenger and freight market shares stabilize with MR business units focusing on separate freight and passenger markets.Passenger volumes increase in Yangon–Mandalay corridor.Operating losses decrease as a result of
rationalization, public service obligation (PSO) contract arrangements, better asset management and automation of activities, management performance targets, and increased revenue.
An operating ratio of 0.9–1.0 is achievable (after PSO payments).
A revival strategy is the only way to put MR on a sound financial basis for sustainable growth.
Increasing the level of investment alone will not improve MR’s financial and operating performance. Simply “throwing more money” does not address MR’s organizational problems and the problems related to railway sector governance, such as those that hinder sector development and constrain MR’s financial and operating performance.
A revival scenario could ultimately achieve an operating ratio of 0.9–1.0 after PSO payments, whereas the other scenarios could yield ratios in excess of 2.0, which means that the state will need to cover more significant operating losses in addition to making much larger capital investments. However, even in the revival scenario, the government will need to make significant PSO payments if it wishes to maintain a large network.

36�Myanmar Transport Sector Policy Note: Railways
Table 16 shows preliminary estimates of financial results under each of the scenarios. Note that there are at least three phases for revival scenario because it requires consideration of changes to government policy, which will require further analysis and time for implementation.8
Implementation of the revival strategy requires a change in the relationship between MR and the government. Implementation will require
agreement with the government to change the current railway investment strategy and to avoid investments that would further deteriorate the economic viability of the railway;development of an agreed program to reform railway sector governance—new powers for MR, new institutions, and new support frameworks; andpossible changes to MR’s internal organization, including separation of operating units and/or separation of infrastructure from operations.
8 Cost and financial modeling results are preliminary because they are based on estimates of the cost of services, which are not separated in MR’s accounts. Cost variability factors applicable to MR also need further analysis and development.
Table 16: Preliminary Results of Cost and Financial Modeling—Operating Ratios
Service Currenta
SceneBusiness as Usual
Revival (Phase 1 and 2)
Revival (Phase 3) Extensive Growth
Freight 1.11 1.54 0.85 0.80 1.74Passenger 1.78 2.32 1.35 1.07 2.92Combined 1.73 2.27 1.32 1.05 2.84
Net Annual Loss (MK million) (31,936) (51,026) (9,466) 933 (76,694)a Model results differ from actual Myanma Railways (MR) data. MR reports an operating ratio of 1.69 in 2013–2104.Source: Asian Development Bank estimates.

37
5.1 �Changing Investment StrategiesA shift in the direction of the national railway investment strategy is needed. The railway network has increased in size by 100% since 1988. Past investment in railways (which has averaged about $100 million annually since 2009/10) was directed primarily at building new railway lines to extend the network. However, new railway line construction was ill conceived and has only added to the tertiary light density component of the network, which now comprises 58% of the route network yet generates only 7% of MR’s overall traffic.
As a result of neglect and of the past investment strategy, most of MR’s assets have deteriorated to the extent that MR is not able to properly serve even its existing markets. The requirement to operate many low traffic density lines has diverted MR’s scarce resources away from core trunk line services.
The current level of capital investment in MR by the government ($100 million per year) needs be maintained. The focus of this capital investment must shift to rehabilitating and modernizing existing assets.
5 Key Requirements for Railway Revival
Key Findings and Suggestions
Reviving the railways in Myanmar is possible but requires the following:
Better investments. Investment levels should be maintained but should be used for rolling stock, signaling and information systems, intermodal freight facilities, and trunk lines—in effect abandoning investments in tertiary lines until the situation of the railways has improved.Rationalizing assets and services. Lines and services will need to be scrutinized for their viability. Nonviable lines or services should be financed by the central government under public service obligations (PSOs), transferred to local governments, or abandoned. Financial restructuring. This involves the government recapitalizing Myanma Railways (MR), taking over its historic debt particularly pension liabilities, and potentially converting MR’s land into equity.A new governance of the rail sector. MR should be fully separated from the government and given managerial autonomy. From the government side, a new railway department and in the long term, a railway regulator would need to be created. A new management tool is required—a corporate plan with full government policy backing.Reorganizing Myanma Railways along commercial principles. MR should be corporatized and function as a commercial enterprise. Freight should be established as a separate business unit, and separating infrastructure and services should be considered.

38�Myanmar Transport Sector Policy Note: Railways
Broadly, investment priorities are the following:
upgrade and modernization of locomotives, wagons, coaches, maintenance facilities, and depots;modernization of signaling and train control systems;development of intermodal facilities such as inland container depot (ICD) and container train services;modernization and rehabilitation of infrastructure in the Yangon–Mandalay corridor; improvement of track infrastructure and expansion of physical track capacity where needed (e.g., Mandalay–Myitkyina);installation of electronic data processing systems, e.g., automation of ticketing, billing, and integrated information processing to enable timely management information system (MIS) reporting; and upgrade of technical capacity of MR’s human resources.
A detailed evaluation of investments requirements must be undertaken and a comprehensive investment plan developed. Table 17 shows the capital investments identified by Japan International Cooperation Agency (JICA), and Table 18 shows capital investments proposed by MR. The investments listed in the tables do not show the full extent of investment needed to upgrade locomotives, coaches, and rolling stock and do not include estimates for installation of electronic data processing systems and for training or capacity development.
MR will require technical assistance to undertake evaluation and prioritization of investments. MR lacks capacity to undertake financial analysis of investments and to analyze the impact of investments on operating costs. With ADB technical assistance, MR has developed a costing model, which will enable it to analyze losses on specific train services and railway lines and evaluate the impact of operational changes on operating costs.
Table 17: Investments Identified in the National Transport Development Plan
Project 2015 2016–2020 2021–2030 TotalYangon–Mandalay rehabilitation and modernization 219 1,097 439 1,755Myohaung–Myitkyina rehabilitation and modernization 91 456 365 912Yangon ICD 2 8 0 10Mandalay ICD 2 8 0 10New Line Yangon–Hanthawaddy 0 100 399 499New Line Bago–Hanthawaddy 11 17 0 28Total 325 1,686 1,203 3,214
ICD = inland container depot.Source: Japan International Cooperation Agency. 2014. The Survey Program for the National Transport Development Plan in the Republic of the Union of Myanmar. Naypyitaw.
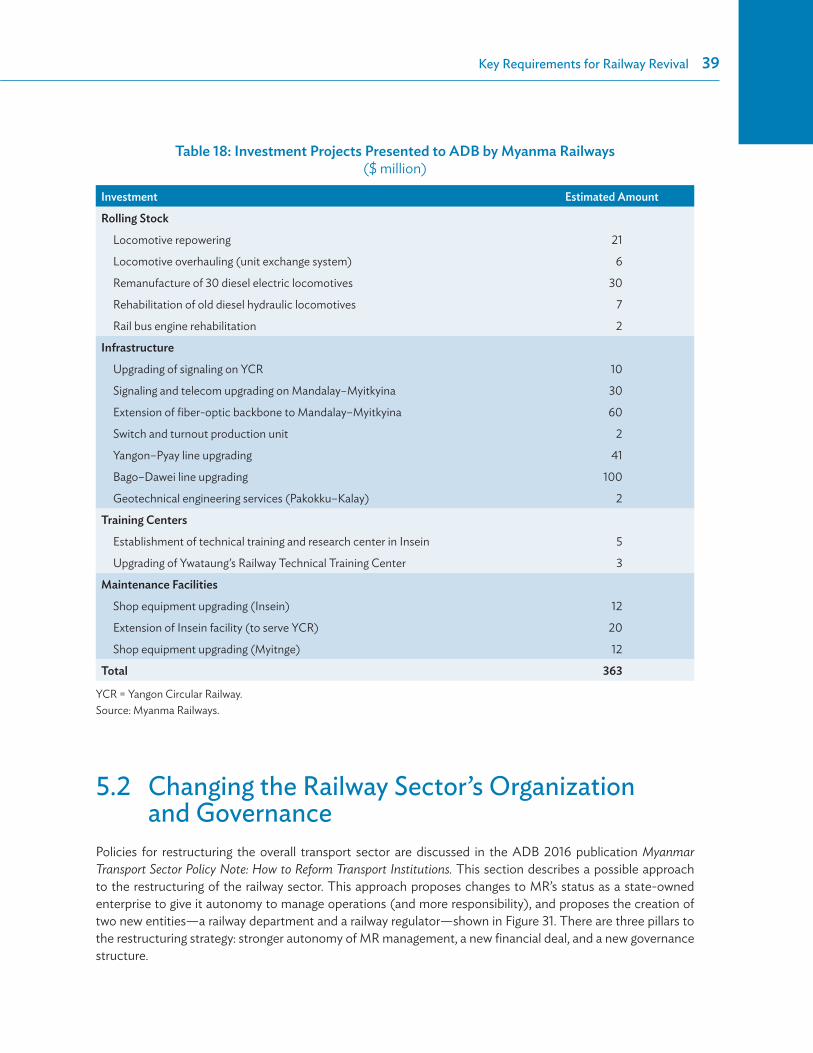
Key Requirements for Railway Revival�39
Table 18: Investment Projects Presented to ADB by Myanma Railways ($ million)
Investment Estimated Amount
Rolling Stock
�Locomotive repowering 21
�Locomotive overhauling (unit exchange system) 6
�Remanufacture of 30 diesel electric locomotives 30
�Rehabilitation of old diesel hydraulic locomotives 7
�Rail bus engine rehabilitation 2
Infrastructure
�Upgrading of signaling on YCR 10
�Signaling and telecom upgrading on Mandalay–Myitkyina 30
�Extension of fiber-optic backbone to Mandalay–Myitkyina 60
�Switch and turnout production unit 2
�Yangon–Pyay line upgrading 41
�Bago–Dawei line upgrading 100
�Geotechnical engineering services (Pakokku–Kalay) 2
Training Centers
�Establishment of technical training and research center in Insein 5
�Upgrading of Ywataung’s Railway Technical Training Center 3
Maintenance Facilities
�Shop equipment upgrading (Insein) 12
�Extension of Insein facility (to serve YCR) 20
�Shop equipment upgrading (Myitnge) 12
Total 363
YCR = Yangon Circular Railway.Source: Myanma Railways.
5.2 � Changing the Railway Sector’s Organization and Governance
Policies for restructuring the overall transport sector are discussed in the ADB 2016 publication Myanmar Transport Sector Policy Note: How to Reform Transport Institutions. This section describes a possible approach to the restructuring of the railway sector. This approach proposes changes to MR’s status as a state-owned enterprise to give it autonomy to manage operations (and more responsibility), and proposes the creation of two new entities—a railway department and a railway regulator—shown in Figure 31. There are three pillars to the restructuring strategy: stronger autonomy of MR management, a new financial deal, and a new governance structure.
40�Myanmar Transport Sector Policy Note: Railways
Pillar 1: Autonomy of MR Management
MR needs to be given the freedom to manage its operations. Ideally, this means corporatization, i.e., transforming MR’s status from a state-owned enterprise to a state-owned corporation. MR is reestablished as a corporate entity at arm’s length from the new Ministry of Transport, with an independent board of directors.
With or without formal corporatization, MR needs to be given the freedom to operate and make decisions without need to obtain government approval. Decisions would be made by MR management based on sound commercial or business information and subject to oversight by the board of directors.
For example, MR would need to be granted the freedom to do the following:
Price its services in competitive markets. Setting of tariffs and fares would be MR’s responsibility, subject to some review by a regulator.Modify (rationalize) operations. MR could discontinue uneconomic services or make alternate arrangements with the private and public sector for its operation. Propose Public Service Obligations (PSOs). Nonviable investments and services imposed by the government—where railways are required to maintain low fares or to serve remote areas to satisfy national development objectives—should be compensated through a subsidy program. This process would also be subject to review by the regulator.Manage staff. MR would manage salaries, recruitment, and downsizing. Establish new services. An example would be container trains.Form joint ventures with the private sector. This is valuable in operating terminals and services.Contract with the private sector for services. Provision of rolling stock is an example. Manage its finances. This includes making decisions on investments.
Pillar 2: A New Financial Deal
A corporatized MR would need to start on sound financial footing. The government should eliminate its existing debt and provide working capital (as an equity contribution) to properly capitalize the new MR and to give it financial sustainability. The government would also need to maintain its current level of capital investment and support additional capital investments, especially the rehabilitation and modernization of the Yangon–Mandalay corridor.
Pension obligations and the responsibility for social services should be transferred to the government, which manages these obligations for other government employees. MR should not be directly responsible for providing medical services, schools, and other social services. If required to provide these services, MR should be compensated appropriately, similar to the operation of uneconomic railway lines. In return for the elimination of pension and social responsibilities, surplus railway land could be transferred to the government.
A corporate plan would set the operational and pricing strategy, management reforms, demand, costs, financial performance and productivity targets, planned program of rationalization and investments, and intended changes to staff levels and employment policies. Initially, this could be short-term (2–4 years).
This corporate plan would need to backed by a clear government policy with regards to financial support, and governance reform.

Key Requirements for Railway Revival�41
A New Role for the Government
Figure 31 gives a possible new governance structure.
Forming a railway department within the Ministry of Transport and Communications. This department would have an integral role in overseeing the development of the railway sector. The department’s key roles would be the following:
Coordinate the implementation of new national railway policies and plans. This role is in regard to MR as agreed with the government or as defined in legislation (e.g., by developing a new “Railway Act” or a component of a National Transport Act governing all sectors). Monitor and evaluate the performance of the railway sector. This must be based on the objectives defined by approved policies or by legislation. The department must develop proposals for changes to legislation, policies, regulations, and institutions. Supervise the railway corporation. The department must represent the ministry at the board of the company, and negotiate and supervise the implementation of the performance contract.Establish national railway safety standards. The department must develop safety rules and regulations and establish a framework to enforce them. Consistent with good industry practice in railways, this function must not reside within MR. This does not mean that the government should continuously inspect railway operations and equipment. MR must develop internal safety procedures that tells the government that MR management has implemented systems to ensure that safety rules and regulations are followed. Manage the development of the railway network infrastructure. This role would involve working with MR to develop the infrastructure component of investments plans. The government must make significant investment in the rehabilitation and modernization of track, especially in the Yangon–Mandalay corridor; the railway department would coordinate such large government investments.
Figure 31: Outline of a Possible Structure of the Railway Sector
Ministry ofTransport and
Communications
RailwayDepartment
Standards
EnforcementPolicy andplanning
Monitoring
MyanmaRailways
RailwayRegulator
Complaints anddisputes
Servicerationalization
Subsidyadministration
Networkdevelopment
Safety
Source: Asian Development Bank.

42�Myanmar Transport Sector Policy Note: Railways
Forming in the long-term a railway regulatory entity. The focus of the regulator would be to establish processes and procedures for the (i) rationalization of the railway network; and (ii) resolution of public complaints concerning passenger fares, and disputes between MR and shippers over tariffs, where competitive options are not present. It is not suggested that the regulator be an economic regulator, i.e., set rail tariffs and fares.
The roles of the regulator would be the following:
Make decisions on the rationalization of the railway network. Each case would need to be examined carefully and decisions made after appropriate economic and financial analysis. Decisions could result in a discontinued service or abandoned railway line. If the regulator decided that a loss-making service should be retained in the public interest, then it would review the needed subsidy and the terms of the associated public service obligation (PSO) contract. This approach could apply to the operation of services in remote communities, light density lines, and the Yangon Circular Railway (YCR). Alternatively, the process could allow for regional governments to take over operations or for an uneconomic line to be sold. Consultation with the public would be required to support the decision process. Canada established a similar process that enabled it to successfully rationalize its railway network (Box 1).Establish a system of railway accounting and costing. With the participation of MR, this is to enable an agreed determination of the extent of losses and amounts of subsidies to be paid, or the review of fares, tariffs, and access charges. Review public complaints in regard to passenger fares, service quality, and tariffs. This would require procedures for establishing complaints and a transparent decision-making process. As noted above, review of tariffs should only be undertaken in exceptional cases, such as when shippers have no viable options. Tariffs should be a business decision between MR and its customers. Hence, freight tariffs should be confidential between the parties and not public.
The regulator could have a future role in managing access to infrastructure, which is not shown in Figure 31. If infrastructure management is separated from train operations (see Section 5.3) and infrastructure access is opened to private carriers (or to a joint venture with MR), the regulator would review access charges and establish nondiscriminatory conditions for infrastructure access (i.e., not in favor of MR) and issue licenses to carriers.
Establishing a new railway environment that defines a new relationship between the government and MR is best achieved by a new law or by amendments to existing legislation. New or amended legislation support and legitimize restructuring and create an environment that would serve the railway sector over the long term (20 years).
5.3 � Changing the Organization of Myanma RailwaysA corporatized MR would need to be accountable for results. It would need to develop realistic business and investment plans for board approval and to establish realistic performance targets to enable judgments concerning the effectiveness of its decisions and investments. It would need to develop the capacity to identify services that cannot be delivered on commercial terms and their costs, and propose to the government to either abandon them or to provide compensation (within a framework described in Section 5.2).

Key Requirements for Railway Revival�43
Box 1: Canada’s Experience in Rationalizing its Railway System
In the 1960s and early 1970s, Canada’s railway sector was similar to Myanma Railways. The Canadian National Railway (CN) was government-owned, inefficient, and carried high levels of debt. The Canadian Pacific Railway (CP), although privately owned, had similar problems. The railways were losing significant shares of their markets to trucking. Railways were slow to react. They were not market-focused, and assets were not in good shape because profitability had been constrained by many years of tariff regulation and requirements to operate loss-making services in the public interest. Neither railway covered its cost of capital.
In the late 1980s, the Government of Canada successfully implemented a new railway environment. Most economic regulation of railways was eliminated, and railways were allowed to develop commercial relationships through confidential contracts with their customers. This was the culmination of a service rationalization process that began in the late 1970s.
Stepwise Transition to a New Railway Environment
Canada developed a program to subsidize railway lines and services operated in the public interest. Before approving a subsidy, public hearings were held to determine if a line or service should be abandoned or subsidized. This allowed railways to rationalize their networks. The government separated passenger services from freight services and established a national passenger carrier (VIA Rail Canada). VIA operates over freight lines and negotiates track access agreements with the freight carriers. The government provides some capital investment support, but generally VIA must cover its costs through fares. Regional and remote services operated by VIA are subsidized. Intercity travel is not subsidized. The government encouraged the sale of branch lines to small private feeder railways (short line railways). They now originate over 20% of the business of the main line carriers. The government took over CN’s debt and then moved to privatize CN through a public share offering. Today, CN is a successful publicly traded shareholding company.The government implemented a subsidy program for the transport of grain by rail to export position. Previously, railways carried about 30 million tons of grain at rates that were below cost.
In 1987, Canada eliminated freight tariff regulation, except for measures to ensure that freight shippers captive to rail transport will have competitive access to rail transport.
Source: Canadian Association of Railways.
MR managers lack experience in implementing this type of change. MR managers are used to taking instructions and lack experience as “business” managers. Recruitment of managers with appropriate experience and talents is necessary to implement changes to the organization.
The difference in operational requirements between passenger services and moving bulk freight and containers is considerable. The public is the passenger market; businesses are the freight market. Each market requires a different degree of market intelligence, different approaches to marketing, and different train services.

44�Myanmar Transport Sector Policy Note: Railways
The model for restructuring proposed here is to create a new Freight Business Unit. This unit may also be corporatized at some point in the future; for now, just forming business units is a complex task. Separating freight and passenger operations would allow each MR unit to focus on the specific requirements of each market segment and to tailor operations to the needs of their customers. Appendix 2 describes the concept behind separation and the scope of the freight business unit.
The freight business unit would initially provide only bulk freight and container trains in the Yangon–Mandalay and Mandalay–Myitkyina corridors. Freight services on other routes and lines would be provided in mixed trains operated by the passenger business unit (as they are today).
YCR is a special case. Commuter rail services and intercity passenger services also require vastly different operations. It is recommended that commuter train services not be part of the passenger business unit, which would only be responsible for intercity passenger trains. YCR could be operated as a separate business unit or only by the passenger business unit under a PSO arrangement. The YCR business unit could either be established as a public–private partnership (PPP) between a private operator and MR, or be taken over and operated by the Yangon City Government alone. In any event, YCR would likely need to be subsidized. Funds from the development of urban railway land holdings could be used for capital investments.
The concept of separation of operations from infrastructure management is also raised in Appendix 3. Separation would essentially involve breaking up a vertically integrated MR. There is no consensus on the merits of the approach, unless multiple operators compete for the use of infrastructure, if access to infrastructure is opened to private railway service providers in addition to MR. However, the concept has been adopted as a policy throughout the European Union (EU). Box 2 summarizes some of the viewpoints on these matters.
The problem with this approach is that MR’s operating business units could not be viable if MR is required to support the full cost of the significant investment in required infrastructure. Some degree of government support for infrastructure would always be required. Essentially, an infrastructure business unit would always require a subsidy or direct investment by government. This is another reason for supporting the formation of a unit with the proposed railway department responsible for network development.

Key Requirements for Railway Revival�45
Box 2: Perspectives on the Separation of Railway Operations from Infrastructure Management
Arguments for Arguments againstA rail service provider will be better able to focus on serving shippers or passengers or a specific market segment because the issues related to infrastructure are the responsibility of another body. Rail service providers no longer have to invest in and maintain infrastructure, so they can more easily adjust freight rates and fares to market conditions. Barriers to entry and exit of new railway service providers are reduced because the high fixed costs associated with the provision of infrastructure are the responsibility of a separate body.Separating rail service providers from infrastructure management (if it is publicly funded) makes them comparable to trucking service providers that operate on a publicly funded road network. Infrastructure investment and maintenance becomes a “public good” and can be funded or subsidized transparently. Infrastructure can be more easily rationalized by railway service providers based on demands. Government can decide to offer subsidies for certain services where no railway service providers emerge (e.g., remote services) or where public interest dictates such intervention. Technological advances in train control and communications make the separation of track from the provision of railway services feasible.
Separation is most beneficial where several railway service providers emerge to compete on the market. In theory, this should promote greater efficiency and lead to lower costs and more competitive rates and fares and more choices for users. However, public railway service providers (i.e., formerly MR) may retain considerable market power, making it difficult for new railway service providers to be formed; thus, benefits from competition will not be realized. Railway economics are such that efficiencies are achieved by transporting large volumes of traffic over long distances. Under a separated structure, operations may actually be less efficient because multiple transportation service providers could be competing for the same traffic, which could result in smaller (less efficient) trains. If a separated structure means equal access to infrastructure, the pricing mechanism should be based on cost sharing and this will not help identify inefficiencies in the network; thus, rationalizing unproductive tracks may be more difficult.The interface between the track and running of trains is too complex to separate (e.g., track design standards and maintenance strategies affect train speeds and axleloads, which in turn affect customer service parameters such as reliability, transit time, and safety.
Source: Asian Development Bank.

46
6 Proposed Implementation Strategy
The revival scenario should not be rejected for its complexity. It is a necessary strategy, but it cannot be implemented without careful planning and consideration of options. It is proposed that change be implemented over three phases.
6.1 �Phase 1 (2015–2016): PlanningDuring the planning phase, activities would include the following:
Preparation of a medium-term rehabilitation and modernization investment strategy that would involve prioritizing investment needs and developing an investment plan to be agreed upon by MR and the government. The plan would require agreement from the government to change its investment strategy and to redirect investment to core network development, rolling stock, and other priorities. Cost analysis of lines and services to develop more precise measurements of financial performance and to determine the scope for rationalizationFormation of a freight business unit to immediately address the need to develop container train services
Key Suggestion
Phase 1 (2015–2016): Planning. The government should task an interministerial restructuring committee and propose a time-bound restructuring plan for the railways. During this phase, MR could review the profitability of its lines, prepare a modernization investment program, form a freight business unit, and potentially launch a containerization pilot; and the government could create an embryo of the future railway department.
Phase 2 (2017–2019): Start of Restructuring. During this phase, MR would be corporatized and restructured, a railway regulator would start functioning, and MR would commence its modernization investment program.
Phase 3 (2020–2025): Second Phase of Restructuring. This third phase would see the full implementation of the modernization investment program. Public service obligation (PSO) programs and network rationalization would commence. Private sector involvement would be sought. Potentially, the freight market would be liberalized and MR’s business units corporatized.
Proposed Implementation Strategy�47
Creation of marketing departments within the freight business unit and in the remaining MR that would be responsible for all other servicesCreation of a railway department in the Ministry of Transport and Communications Assessment of the legal requirements for implementing change, whether there is a requirement for new legislation or to amend existing legislation Examination of the scope for private participation in the provision of rolling stock and in the operation of servicesPreparation of a detailed time-bound restructuring plan for government approval
For the first phase to be implemented successfully, the government needs to form an interministerial MR restructuring steering committee with the power to implement changes and to approve plans and strategies prior to presentation to government. This committee would need to be constituted under the authority of the President’s Office. ADB is financing a technical assistance to advise the government during this phase.9
6.2 � Phase 2 (2017–2019): Start of the Restructuring
The first phase of the restructuring would involve the following activities:
Full internal reorganization of MR, including formalizing the separation of freight into a business unit, and hiring of people to fill key posts in the new business unitsFull set up of the Railway Department. This would include preparing enabling legislation and legal frameworks as required for implementation.Establishment of YCR as a separate unitGovernment’s commitment to grant MR control over fares and services and introduction of market-based pricing by MR business unitsGovernment’s agreement to a process for rationalization of the network and for PSO subsidy arrangements as necessaryPreparation and approval of first corporate plans and performance contractsConsideration of the merits of separating train operations from infrastructure management, including examination of possible mechanisms for access regulation. Development of revisions to the restructuring plan as necessary. Commencement of an approved investment program for the rehabilitation and modernization of MR assets. The investment program (and capacity building assistance) could be supported by ADB and other development partners.Possible start of first private sector participation in the provision of rolling stock, inland container depot (ICD) operation, and tertiary lines operationDevelopment of the scope and roles of a railway regulator
This phase should be led by the interministerial committee constituted in Phase 1.
9 ADB. 2014. Technical Assistance to Myanmar for Transport Sector Reform and Modernization. Manila.

48�Myanmar Transport Sector Policy Note: Railways
6.3 � Phase 3 (2020–2025): Second Phase of Restructuring
The second phase of the restructuring would involve the following activities:
Completion of the separation of freight and passenger operations, including possible corporatization of these units Commencement of the separation of train operations from the management of infrastructure (if confirmed)Introduction of new rolling stock, signaling systems, and automated data processing Completion of the rehabilitation and modernization of the Yangon–Mandalay corridorImplementation of PSO programs and commencement of network rationalizationLiberalization of the freight transport marketSet up of railway regulator (if confirmed)

49
APPENDIX 1
Organization Chart of Myanma Railways (2015)
430 31469
Managing Director
Senior General Manager(Technical and Administration)
GeneralManager
Upper RegionAdministration
1 10 10
Lower RegionAdministration
1 6 17947 14
InspectionCommercial
andMarketing
Planning andAdministration
13 181
LocomotiveWorkshop
(Insein)Medical
33 367
Finance
19 490
Mechanicaland
Electrical
5414
Store
22 327 9 1438
Carriage andWagon Workshop
(Myitnge)
15 2490
LocomotiveWorkshop
(Ywataung)
11 782
GeneralManager
GeneralManager
GeneralManager
GeneralManager
Manager Manager
Deputy GeneralManager
(3)
Manager(4)
Manager(10)
Manager(9)
Manager(7)
Manager(5)
Engineer(18)
Manager(3)
GeneralManager
GeneralManager
GeneralManager
GeneralManager
GeneralManager
GeneralManager
Senior General Manager(Inspection)
Engineer(2)
Engineer(2)
Engineer(2)
Engineer(19)
DeputyGeneralManager
DeputyGeneralManager
DeputyGeneralManager
DeputyGeneralManager
(Medical)
AssistantGeneralManager
AssistantGeneralManager
(2)
AssistantGeneralManager
(5)
AssistantGeneralManager
AssistantGeneralManager
AssistantGeneralManager
(3)
AssistantGeneralManager
(3)
AssistantGeneralManager
(14)
AssistantGeneralManager
(2)
1. Traffic2. Mechanical3. Signal and Telecom
Deputy GeneralManager
(3)
1. Passenger2. Freight3. Commercial
Deputy GeneralManager
(3)
1. Locomotion2. Carriage and Wagon3. Electric
Workshopin charge
Deputy GeneralManager
(2)
1. Administration2. Planning
Deputy GeneralManager
(2)
1. Finance2. Costing
DeputyGeneral
Manager (2)
(Store)
Deputy GeneralManager
(6)
1. Administration2. Project3. Works4. Bridge & Store5. Rail & Store6. Building & Store
Manager(5)
DeputyGeneralManager
35 8428
Operation
AssistantGeneralManager
(3)
Specialist(6)
DivisionalMedicalOfficer
(6)
CivilEngineering
972452
Note: Sanctioned staff is indicated in the boxes below the units. Left side numbers indicate officer positions, right side numbers are other staff positions. The numbers in the parenthesis refer to the number of managers. Source: Myanma Railways.
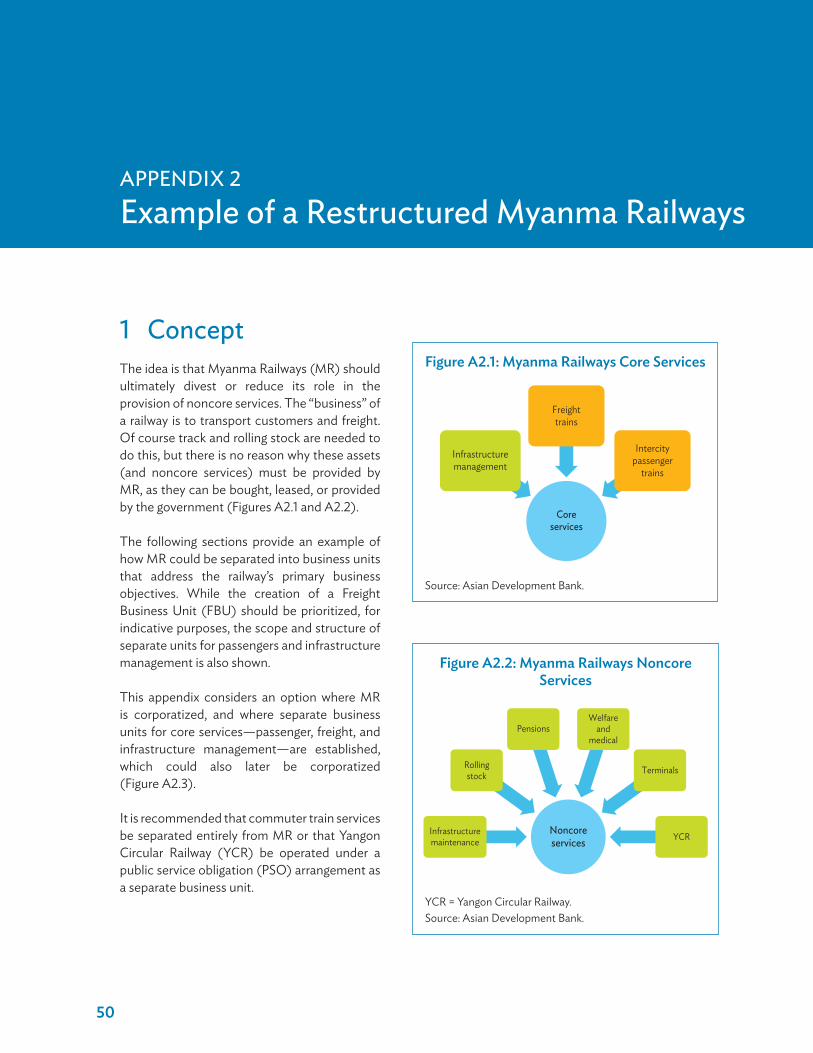
50
APPENDIX 2
Example of a Restructured Myanma Railways
1 �ConceptThe idea is that Myanma Railways (MR) should ultimately divest or reduce its role in the provision of noncore services. The “business” of a railway is to transport customers and freight. Of course track and rolling stock are needed to do this, but there is no reason why these assets (and noncore services) must be provided by MR, as they can be bought, leased, or provided by the government (Figures A2.1 and A2.2).
The following sections provide an example of how MR could be separated into business units that address the railway’s primary business objectives. While the creation of a Freight Business Unit (FBU) should be prioritized, for indicative purposes, the scope and structure of separate units for passengers and infrastructure management is also shown.
This appendix considers an option where MR is corporatized, and where separate business units for core services—passenger, freight, and infrastructure management—are established, which could also later be corporatized (Figure A2.3).
It is recommended that commuter train services be separated entirely from MR or that Yangon Circular Railway (YCR) be operated under a public service obligation (PSO) arrangement as a separate business unit.
Figure A2.1: Myanma Railways Core Services
Coreservices
Infrastructuremanagement
Freighttrains
Intercitypassenger
trains
Source: Asian Development Bank.
Figure A2.2: Myanma Railways Noncore Services
Noncoreservices
Infrastructuremaintenance
Rollingstock
PensionsWelfare
andmedical
Terminals
YCR
YCR = Yangon Circular Railway.Source: Asian Development Bank.

Example of a Restructured Myanma Railways�51
MR corporatization would have the following consequences:
MR is reestablished as a state-owned corporation, with an independent board of directors. Initially, it will not be burdened by debt and will be provided with equity by the government. MR will no longer have responsibility for pension obligations, and social services will be divested to the private sector or to other public entities. MR management will be accountable for specific performance objectives for each business unit.MR will employ internationally recognized commercial accounting and auditing standards. MR will have the freedom to price and structure (and rationalize) its services. Government subsidy agreements will be established where MR is required to continue operating unprofitable services in the name of public interest.An independent regulatory entity will be established to determine whether (i) a service should be discontinued, (ii) a railway line should be abandoned, or (iii) a subsidy should be provided by the government. Safety standards and rules will be set and enforced by a government entity.
2 �Scope of Passenger Business UnitThe main features of the Passenger Business Unit would be as follows (Figure A2.4):
Operates intercity passenger trains and provides services to passengers (ticketing and onboard services)Operates mixed trains (delivers freight to communities not served by the freight business unit)Is allocated a specific number of locomotives, shunters, wagons, and “running” depots Operates rolling stock maintenance and repair facilities (initially provides rolling stock to the FBU and to Yangon commuter services, until these units make their own new arrangements, if any) Has the freedom to price services and to discontinue or amend services (subject to regulatory oversight) Has the freedom to reduce staffing levels Manages rolling stock assets and may enter into contracts with private suppliers for maintenance and repair and supply Has authority to purchase equipment, materials, and rolling stock, and to enter into contracts with service providers and to form a joint venture with the private sector
Figure A2.3: Model of a Restructured Myanma Railways
Myanma Railways(State Corporation)
Freight Business Unit Passenger Business Unit InfrastructureManagement Unit
Source: Asian Development Bank.
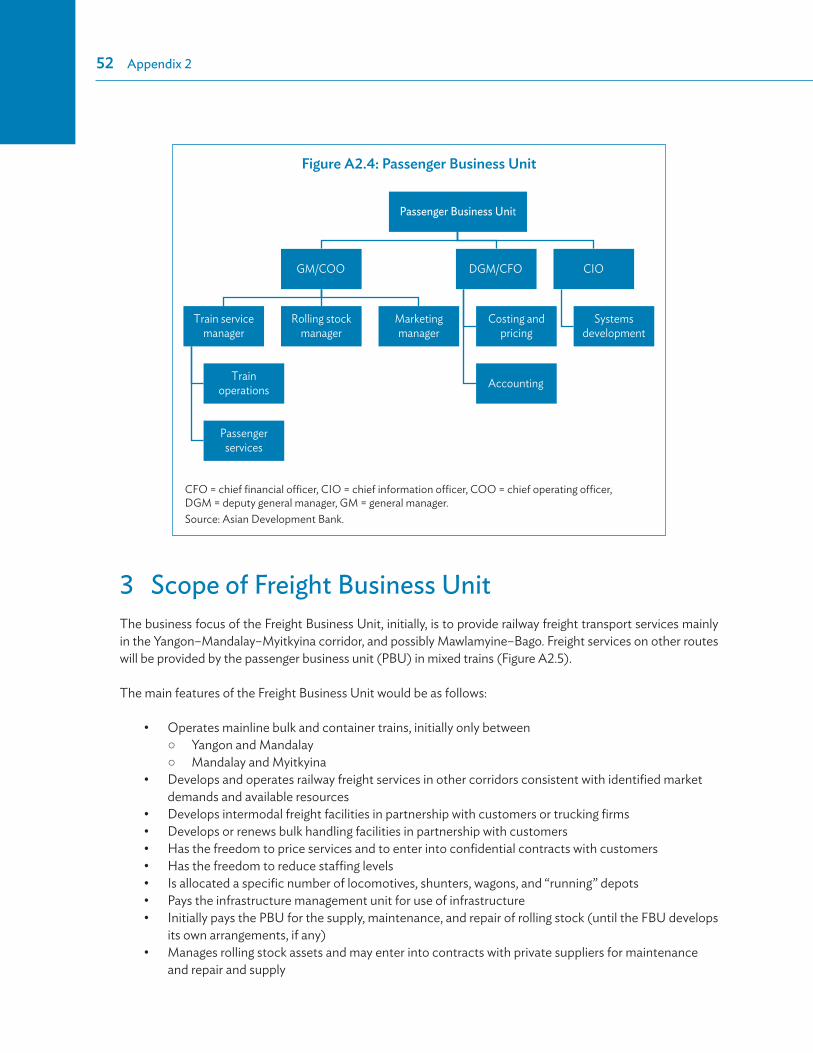
52�Appendix 2
3 �Scope of Freight Business UnitThe business focus of the Freight Business Unit, initially, is to provide railway freight transport services mainly in the Yangon–Mandalay–Myitkyina corridor, and possibly Mawlamyine–Bago. Freight services on other routes will be provided by the passenger business unit (PBU) in mixed trains (Figure A2.5).
The main features of the Freight Business Unit would be as follows:
Operates mainline bulk and container trains, initially only between Yangon and Mandalay Mandalay and Myitkyina
Develops and operates railway freight services in other corridors consistent with identified market demands and available resources Develops intermodal freight facilities in partnership with customers or trucking firmsDevelops or renews bulk handling facilities in partnership with customers Has the freedom to price services and to enter into confidential contracts with customersHas the freedom to reduce staffing levels Is allocated a specific number of locomotives, shunters, wagons, and “running” depotsPays the infrastructure management unit for use of infrastructure Initially pays the PBU for the supply, maintenance, and repair of rolling stock (until the FBU develops its own arrangements, if any)Manages rolling stock assets and may enter into contracts with private suppliers for maintenance and repair and supply
Figure A2.4: Passenger Business Unit
Passenger Business Unit
GM/COO
Train servicemanager
Trainoperations
Passengerservices
Rolling stockmanager
Marketingmanager
DGM/CFO
Costing andpricing
Accounting
CIO
Systemsdevelopment
CFO = chief financial officer, CIO = chief information officer, COO = chief operating officer, DGM = deputy general manager, GM = general manager.Source: Asian Development Bank.

Example of a Restructured Myanma Railways�53
Maintains separate accounting recordsHas authority to purchase equipment, materials, and rolling stock, and to enter into contracts with service providers and to form joint ventureMust be profitable without subsidies.
Figure A2.5: Freight Business Unit
Freight Business Unit
GM/COO
Freight trainmanager
Bulk
Container
Depots
Contractmanagement
Rolling stockmanager
Marketingmanager
DGM/CFO
Costing andpricing
Accounting
CIO
Systemsdevelopment
CFO = chief financial officer, CIO = chief information officer, COO = chief operating officer, DGM = deputy general manager, GM = general manager. Source: Asian Development Bank.
4 � Scope of an Infrastructure Management UnitThe main features of the Infrastructure Business Unit would be as follows (Figure A2.6):
Manages all government-owned track infrastructure, related structures, stations, and inland container depot (ICD) terminals Charges the PBU and FBU for using the infrastructure (under the assumption that these units cannot bear the full cost of infrastructure) Contracts for infrastructure maintenance Invests in infrastructure rehabilitation and modernization Sets targets for infrastructure delivery to customers Maintains separate accounting recordsHas authority to purchase equipment and materials, and to enter into contracts with service providers
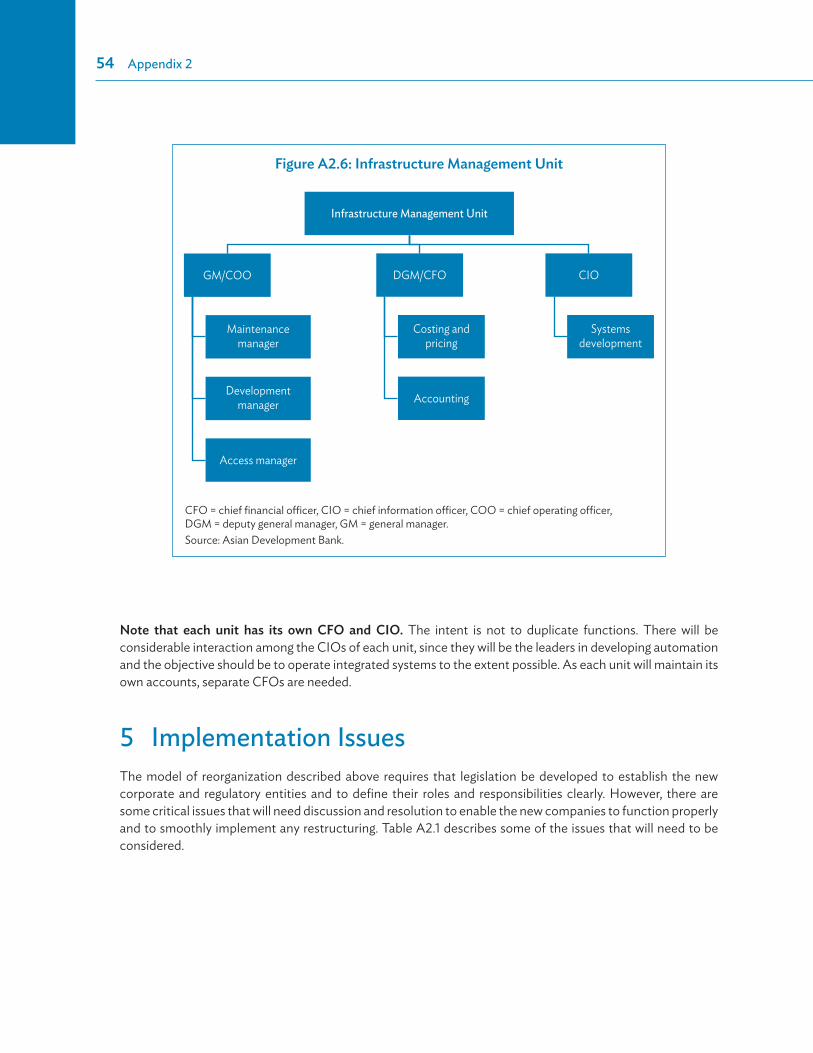
54�Appendix 2
Figure A2.6: Infrastructure Management Unit
Infrastructure Management Unit
GM/COO
Maintenancemanager
Developmentmanager
Access manager
DGM/CFO
Costing andpricing
Accounting
CIO
Systemsdevelopment
CFO = chief financial officer, CIO = chief information officer, COO = chief operating officer, DGM = deputy general manager, GM = general manager.Source: Asian Development Bank.
Note that each unit has its own CFO and CIO. The intent is not to duplicate functions. There will be considerable interaction among the CIOs of each unit, since they will be the leaders in developing automation and the objective should be to operate integrated systems to the extent possible. As each unit will maintain its own accounts, separate CFOs are needed.
5 �Implementation IssuesThe model of reorganization described above requires that legislation be developed to establish the new corporate and regulatory entities and to define their roles and responsibilities clearly. However, there are some critical issues that will need discussion and resolution to enable the new companies to function properly and to smoothly implement any restructuring. Table A2.1 describes some of the issues that will need to be considered.

Example of a Restructured Myanma Railways�55
Table A2.1: Issues to be Addressed in Separating Myanma Railways into Business Units
Issue Considerations or OptionsAllocation of locomotives Initial allocation should be in accordance with the number of trains currently
operated.Each unit (including YCR) could then make its case based on projected requirements.
Allocation of coaches PBU and YCR could make its case based on projected requirements.Allocation of wagons FBU should receive most wagons.
PBU should receive some wagons for mixed trains.IMU will need wagons for transporting ballast and track material.
Allocation of employees Each unit would prepare a business plan and identify human resource requirements. This bottom-up approach is likely to lead to staff reduction proposals.
Allocation of stations Generally should be allocated to IMU, but this may be an issue with the PBU.Track access charges for FBU and PBU
Initially, FBU and PBU would pay a fixed percentage of infrastructure costs.Units could not bear full infrastructure costs (government subsidy).Over the long term, the regulator would set or review charges.Standards for track quality and responsibilities in the event of accidents and breakdowns would need to be established.
Access charges or conditions for private trains
These regulations would be established by regulator and should be transparent.There should be no discrimination between MR and private railway service providers.
Division of infrastructure between IMU and YCR
The division could be based on the existing limits of the circular railway.A distribution of common assets (stations, signaling, and train control) would need to be agreed upon between IMU and YCR.
Maintenance of rolling stock PBU would need to establish a price to be charged per unit.FBU could decide to elect a private supply option based on PBU price and performance.
Allocation of depots Each company needs running repair (depot) facilities sufficient for its needs.Staffing Staffing levels to be established by business plans.
Each company will need to engage professional railway managers or mentors to manage initial operations.It is important to attract people with the skills to perform new railway functions (marketing, pricing, customer service, etc.).
FBU = freight business unit, IMU = infrastructure management unit, MR = Myanma Railways, PBU = passenger business unit, YCR = Yangon Circular Railway.Source: Asian Development Bank.

ASIAN DEVELOPMENT BANK6 ADB Avenue, Mandaluyong City1550 Metro Manila, Philippineswww.adb.org
Myanmar Transport Sector Policy NoteRailways
Better transport is essential to Myanmar’s development. After decades of underinvestment, Myanmar’s transport infrastructure lags behind other regional countries. Sixty percent of trunk highways and most of the railways need maintenance or rehabilitation. River infrastructure does not exist, while 20 million people lack basic road access. Can the transport sector deliver upon the master plan’s objectives? What is needed to improve the quality of the infrastructure and services for the industry? How can basic transport services be provided to all? How can Myanmar reduce the economic and social cost of transport? This report is an attempt to answer these questions.
About the Asian Development Bank
ADB’s vision is an Asia and Pacific region free of poverty. Its mission is to help its developing member countries reduce poverty and improve the quality of life of their people. Despite the region’s many successes, it remains home to the majority of the world’s poor. ADB is committed to reducing poverty through inclusive economic growth, environmentally sustainable growth, and regional integration.
Based in Manila, ADB is owned by 67 members, including 48 from the region. Its main instruments for helping its developing member countries are policy dialogue, loans, equity investments, guarantees, grants, and technical assistance.