Mutual Funds in India: A Comparative Study of Select ...
13
IJEMR – December 2017 - Vol 7 Issue 12 - Online - ISSN 2249–2585 Print - ISSN 2249-8672 1 www.ijemr.in Mutual Funds in India: A Comparative Study of Select Public Sector and Private Sector Companies *DR. (Mrs.) Prashanta Athma **Mrs. K.Suchitra *Professor in Commerce, Principal, Osmania University College for Women, Koti, Hyderabad **Research Scholar, Osmania University, Hyderabad, H.No. 1-5-16/B, Musheerabad, Hyderabad-500020 Abstract Mutual Fund is a company that pools money from a group of people with common investment goals to buy securities such as stocks, bonds, money market instruments, a combination of these instruments, or even other funds in order to reap the benefit of diversification and professionally managed basket of securities at a relatively low cost. The survey of literature indicates that not much work has been emphasized on the quantitative growth of Mutual Funds. Hence, the study is undertaken to reflect upon the growth of Mutual funds and the performance of select Mutual Funds during 2014-17 to analyse the growth and progress of the Mutual Funds in India during 2014-17 and to judge the relative performance of the select Mutual Funds during 2014-17. The study covers the Indian scenario of Mutual Funds in terms of Gross Mobilisation, Gross Redemption and Net Inflows by the Mutual Funds, Number of Mutual Funds and Assets under Management (AUM) over the study period and Performance Evaluation of select Companies. Year-wise and Sector-wise Analysis of Mutual Funds in India has also been made. Among the Income Funds, Dynamic Bond Fund- Direct-Growth, which is common to all the select companies which are operating during the years 2014-17, is selected for the study for the purpose of performance evaluation. The tools used for the analysis of the data are Percentages, Averages, CAGR, and Standard Deviation. The Performance evaluation has been done by the application of Sharpe ratio. „t- test‟ is used to test the hypothesis that there is no significant difference in the returns for the select scheme between the Select Public Sector and Private Sector Mutual Funds. Keywords: Mutual Funds, Gross Mobilisation, Gross Redemption, Net Inflows, AUM. Introduction Mutual funds have become invaluable tool for a wide range of investors, from individuals seeking to save for retirement to sophisticated socialites focused on preserving their assets and businessmen to create wealth 1 . Mutual Fund is a trust that pools the savings of a number of investors who share a common financial goal. Anybody with an investible surplus of as little as a few thousand rupees can invest in mutual fund units according to their stated investment objective and strategy 2 . In other words, Mutual fund is a company that pools money from a group of people with common investment goals to buy securities such as stocks, bonds, money market instruments, a combination of these instruments, or even other funds in order to reap the benefit of diversification and professionally managed basket of securities at a relatively low cost. The origin of the Indian mutual fund industry can be traced back to 1964 when the Indian government, with a view to augment small savings within the country and to channelize these savings to the capital markets, set up the Unit Trust of India (UTI). Mutual fund Companies conforming to the SEBI Mutual Fund Regulations, and with recent mergers taking place among different private sector Funds, the Mutual Fund industry has entered its current phase of consolidation and growth. During 2000-2016 India grew rapidly and Mutual Fund industry has emerged as a tool for ensuring one„s financial interests. They have not only contributed to the Indian economy but have also helped to the retail investors to accumulate wealth. As at
Transcript of Mutual Funds in India: A Comparative Study of Select ...

IJEMR – December 2017 - Vol 7 Issue 12 - Online - ISSN 2249–2585 Print - ISSN 2249-8672
1 www.ijemr.in
Mutual Funds in India: A Comparative Study of Select Public Sector and Private Sector
Companies
*DR. (Mrs.) Prashanta Athma **Mrs. K.Suchitra
*Professor in Commerce, Principal, Osmania University College for Women, Koti, Hyderabad
**Research Scholar, Osmania University, Hyderabad, H.No. 1-5-16/B, Musheerabad, Hyderabad-500020
Abstract
Mutual Fund is a company that pools money from a group of people with common investment goals to buy securities such as stocks, bonds, money market instruments, a combination of these instruments, or even other funds in order to reap the benefit of diversification and professionally managed basket of securities at a relatively low cost.
The survey of literature indicates that not much work has been emphasized on the quantitative growth of Mutual Funds. Hence, the study is undertaken to reflect upon the growth of Mutual funds and the performance of select Mutual Funds during 2014-17 to analyse the growth and progress of the Mutual Funds in India during 2014-17 and to judge the relative performance of the select Mutual Funds during 2014-17.
The study covers the Indian scenario of Mutual Funds in terms of Gross Mobilisation, Gross Redemption and Net Inflows by the Mutual Funds, Number of Mutual Funds and Assets under Management (AUM) over the study period and Performance Evaluation of select Companies. Year-wise and Sector-wise Analysis of Mutual Funds in India has also been made.
Among the Income Funds, Dynamic Bond Fund- Direct-Growth, which is common to all the select companies which are operating during the years 2014-17, is selected for the study for the purpose of performance evaluation. The tools used for the analysis of the data are Percentages, Averages, CAGR, and Standard Deviation. The Performance evaluation has been done by the application of Sharpe ratio. „t- test‟ is used to test the hypothesis that there is no significant difference in the returns for the select scheme between the Select Public Sector and Private Sector Mutual Funds.
Keywords: Mutual Funds, Gross Mobilisation, Gross Redemption, Net Inflows, AUM.
Introduction
Mutual funds have become invaluable tool for a wide range of investors, from individuals seeking to save for retirement to sophisticated socialites focused on preserving their assets and businessmen to create wealth1. Mutual Fund is a trust that pools the savings of a number of investors who share a common financial goal. Anybody with an investible surplus of as little as a few thousand rupees can invest in mutual fund units according to their stated investment objective and strategy 2. In other words, Mutual fund is a company that pools money from a group of people with common investment goals to buy securities such as stocks, bonds, money market instruments, a combination of these instruments, or even other funds in order to reap the benefit of diversification and professionally managed basket of securities at a relatively low cost.
The origin of the Indian mutual fund industry can be traced back to 1964 when the Indian government, with a view to augment small savings within the country and to channelize these savings to the capital markets, set up the Unit Trust of India (UTI). Mutual fund Companies conforming to the SEBI Mutual Fund Regulations, and with recent mergers taking place among different private sector Funds, the Mutual Fund industry has entered its current phase of consolidation and growth. During 2000-2016 India grew rapidly and Mutual Fund industry has emerged as a tool for ensuring one„s financial interests. They have not only contributed to the Indian economy but have also helped to the retail investors to accumulate wealth. As at

IJEMR – December 2017 - Vol 7 Issue 12 - Online - ISSN 2249–2585 Print - ISSN 2249-8672
2 www.ijemr.in
the end of 31st March 2017, there are 41Mutual Fund Asset Management Companies operating in India, managing assets of Rs. 17,54,619 Crores under 2281schemes.
In this context, the study is undertaken to assess the growth and progress Mutual Funds in India and also examine the performance of select Mutual Funds during 2014-17.
Review of Literature
Megharaja B and Dr. Chalawadi CI (2017)3, in their study selected sectors equity mutual fund to measure their performance in terms of risk and returns base as compared with benchmark return in the market along with risk free rate of return 364 day T-bill. The study revealed that majority of selected schemes performed better than the market.
RBI (2017)4, in its Preliminary Assessment on Macroeconomic Impact of Demonetisation, revealed that reduction in deposit interest rates by banks after demonetisation enhanced the relative attractiveness of debt oriented mutual funds (MFs). As a result, there were net inflows in income/debt schemes during November 2016-January 2017 in contrast to net outflows during November 2015-January 2016. This was reflected in a sharp increase in the overall resources mobilised by mutual funds during November 2016-Janauary 2017 in contrast to outflows in the same period of last year.
M. Gowri and Malabika Deo (2016)5, in their study attempted to evaluate the performance of fund of funds on the basis of risk-adjusted methods. An analysis performed on the sample of equity oriented fund of mutual funds showed that all the fund of funds in the sample earned negative returns in excess of the risk free rate of return offered by 91 days treasury bill. The comparison of rates of return of the benchmark index and the sample of fund of funds indicated that majority of the equity fund of funds included in the sample had underperformed the benchmark. Such results might be because of double layer of fees. The results revealed that the performance of fund of funds had posted a negative Sharpe, Treynor, and Jensen alpha. The underperformance of fund of mutual funds strongly explained the double layer of fees.
Priyanka G. Bhatt and Prof. (Dr.) Vijay H.Vyas (2014)6 , in their article made performance analysis of the six selected equity funds and concluded that all the funds have performed well during the study period. They also pointed out that the fall in the CNX NIFTY during the year 2011 has impacted the performance of all the selected funds. In the eventual analysis, they concluded that it is fundamental for investors and prospective investors to consider these parameters like Sharpe ratio & treynor ratio along with beta and standard deviation as have given specific performance evaluations from various dimension to make certain steady performance of mutual funds in India.
Syed Husain Ashraf and Dhanraj Sharma(2014)7 , in his article made the risk return analysis and point out that out of 10 schemes 3 have underperform the market, 7 are found to have lower total risk than the market and all the schemes have given returns higher than risk free rates. The Treynor ratio of all the mutual funds scheme have over performed the
benchmark market index and Sharpe ratio of 3 mutual funds scheme underperformed the benchmark market index. They also concluded that the result of regression analysis suggests that benchmark market return index has statistically significant impact on mutual fund return at 5% level of significance.
Shilpi Pal and Arti Chandani (2014)8, concluded in their article that popularity of income schemes has only increased in the last decade. Income mutual funds they have seen tremendous growth in their number of schemes from 91 on 31st march 2001 to 330 on 31st march 2010. 506 in 2008 was the maximum ever in terms of total schemes floating in the market. This category has seen a decline only twice in the last decade. First fall was posted in the year 2003 and the second fall was reported in the year 2010. One striking fact which comes to light is the huge percentage contribution of income schemes towards the total AUM of the Indian mutual funds industry.

IJEMR – December 2017 - Vol 7 Issue 12 - Online - ISSN 2249–2585 Print - ISSN 2249-8672
3 www.ijemr.in
Research Gap
The survey of literature indicates that not much work has been emphasized on the quantitative growth of Mutual Funds. Hence, the study is undertaken to reflect upon the growth of Mutual funds and the performance of select Mutual Funds during 2014-17.
Objectives of the Study
The objectives of the study are
To analyse the growth and progress of the Mutual Funds in India during 2014-17. To judge the relative performance of the select Mutual Funds during 2014-17.
Methodology
The methodology of the study is as follows:
Period of the Study
The period of the study is from the year April 2013 to March 2017.
Scope of the Study
The study covers the Indian scenario of Mutual Funds in terms of Gross Mobilisation, Gross Redemption and Net Inflows by the Mutual Funds, Number of Mutual Funds and Assets under Management (AUM) over the study period and Performance Evaluation of select Companies. Year-wise and Sector-wise Analysis of Mutual Funds in India has also been made.
Sample
The selection of the sample from the total Companies and available schemes is discussed below.
a. Selection of Companies
There are 41 Mutual Fund Companies functioning in India; out of which, 6 are in Public Sector and 35 Mutual Fund Companies in the Private Sector. The selection of the Private companies is made by using the Finite Population Correction (FPC) Factor Model9.
n0 = Sample Size without finite population correction Factor - : Public Sector Mutual Fund Company & Private Sector Mutual Fund Company
n = Actual Sample Size to be taken
N = Finite Population (41)
A sample of 20 Percent is selected from Private Sector Mutual Fund Companies, thus, totaling 6 companies out of 35 Mutual Fund Companies functioning in India. The selection of 6 Private Mutual Fund Companies is done on the basis of Average Assets under Management for the quarter ending March 2017.
b. Selection of the Schemes
The total number of schemes offered by the Mutual Fund Companies is 2281, whereas the number of companies in India offering these schemes is 41. There are various categories of schemes which are offered by these Mutual Fund Companies like Income Funds, Infrastructure Funds, Equity Funds, Balanced, Liquid, Gilt, etc. Among these Categories, Income Funds are selected for the purpose of the study as they are highest in terms of the number (1575) and also in terms of Assets under Management. (Rs.7,43,783 Crores). Among the Income Funds, Dynamic Bond Fund- Direct-Growth, which is common to all the select
0
0 ( 1)
n Nn
n N

IJEMR – December 2017 - Vol 7 Issue 12 - Online - ISSN 2249–2585 Print - ISSN 2249-8672
4 www.ijemr.in
companies which are operating during the years 2014-17, is selected for the study for the purpose of performance evaluation.
Sources of Data
The study is based on secondary data. The sources include SEBI Handbook, RBI Publications, Websites, Journals and Reports.
Hypothesis:
Ho: There is no significant difference in the returns for the select scheme between the Public Sector and Private Sector.
H1: There is a significant difference in the returns for the select scheme between the Public Sector and Private Sector.
Tools for Analysis
The tools used for the analysis of the data are Percentages, Averages, CAGR, and Standard Deviation. The Performance evaluation has been done by the application of Sharpe ratio. „t- test‟ is used to test the hypothesis.
Growth of Mutual Fund Industry in India During 2014-17
The history of Mutual Funds in India can be broadly divided into four distinct phases.
The first phase experienced the monopoly of UTI. The second phase witnessed the entry of Mutual Fund Companies sponsored by Nationalized Banks and Insurance Companies. The third phase was a new era started in the Indian Mutual Fund Industry giving the Indian investors a wider choice of Fund families with the entry of Private Sector Funds in 1993. Also, 1993 was the year in which the first Mutual Fund Regulations came into being. The fourth phase started since 2003. UTI was bifurcated into two separate entities. One is the Specified Undertaking of the Unit Trust of India functioning under an administrator and under the rules framed by Government of India, does not come under the purview of the Mutual Fund Regulations. The second is the UTI Mutual Fund Ltd, sponsored by SBI, PNB, BOB and LIC. It is registered with SEBI and functions under the Mutual Fund Regulations. With recent mergers taking place among different private sector Funds, the Mutual Fund industry has entered its current phase of consolidation and growth.
The growth of Indian Mutual Fund Industry can be ascertained in terms Gross Mobilization of Mutual Funds, Gross Redemption of Mutual Funds, Net Inflows of Mutual Funds, Number of Mutual Fund Houses, Number of Schemes and Assets under Management.
Gross Resources Mobilization of Mutual Funds: Sector-Wise Analysis
Mutual Funds have become a hot favorite of millions of people all over the world. The driving force of Mutual Funds is the „safety of the principal‟ guaranteed, plus the added advantages of
capital appreciation together with the income earned in the form of interest or dividend. Mutual Funds act as a gateway to enter into big companies to inaccessible to an ordinary investor with his small investment. The table below shows the details relating to gross mobilization of Mutual Funds in India from the period 2014-17.

IJEMR – December 2017 - Vol 7 Issue 12 - Online - ISSN 2249–2585 Print - ISSN 2249-8672
5 www.ijemr.in
Table 1
Gross Mobilization by Mutual Funds in India: Sector Wise Analysis
(Rs. in Crores)
Year Public Sector Private Sector Total
2013-14 9,16,351 88,51,749 97,68,100
2014-15 19,42,297 91,43,962 1,10,86,260
2015-16 26,39,279 1,11,26,277 1,37,65,555
2016-17 33,67,612 1,42,47,937 1,76,15,549
Total 88,65,539
(16.97%)
4,33,69,925
(83.03%)
5,22,35,464
No. of Mutual Fund Companies 6 35
Average Gross Mobilisation per fund 14,77,590 12,39,141
CAGR 54.32% 17.19% 21.72%
Source: Yearly Hand book of SEBI
It is evident from the above table that the total Gross Mobilization by Mutual Funds is increasing every year and the same trend can also seen in both Public Sector and Private Sector Mutual Funds. The above analysis points to the fact that the maximum Gross Mobilisation by the Mutual Funds in all years during the study period is from the Private Sector, which accounts to 83.03% of the total Gross Mobilised by the Mutual Funds. However, it should be noted here that the number of Mutual Fund Companies under Public Sector are 6 and the number of Mutual Fund Companies under Private Sector are 35. Therefore, Average Gross Mobilisation per Public Sector and Private Sector Mutual Fund for the study period is calculated to see which sector has mobilised more funds per fund. It can be observed from the above table that the Average Gross Mobilisation per Public Sector Mutual Fund is more than Average Gross Mobilisation per Private Sector. The Growth rate of Public Sector Mutual Funds in terms of Gross Mobilisation of funds during the study period is much higher i.e., 54.32% as compared to the Gross Mobilisation of funds by Private Sector i.e., 17.19%. The overall growth rate of Gross Mobilization by Mutual Funds in India during the study period is 21.72%.
Gross Redemption of Mutual Funds in India: Sector Wise Analysis
The redemptions were started from the year 1998-99. The redemptions were in an increasing trend and it was very high in private sector Mutual Funds. The following table shows the Gross Redemption of Mutual Funds in India: Sector Wise Analysis during 2014-17.

IJEMR – December 2017 - Vol 7 Issue 12 - Online - ISSN 2249–2585 Print - ISSN 2249-8672
6 www.ijemr.in
Table 2
Gross Redemption of Mutual Funds in India: Sector Wise Analysis
(Rs. in Crores)
Year Public Sector Private Sector Total
2013-14 9,11,808 88,02,510 97,14,318
2014-15 19,42,710 90,40,262 1,09,82,972
2015-16 25,96,492 1,10,34,883 1,36,31,375
2016-17 33,03,951 1,39,68,549 1,72,72,500
Total 87,54,961
(16.97%)
4,28,46,204
(83.03%)
5,16,01,165
No. of Mutual Fund Companies 6 35
Average Gross Redemption per fund 14,59,160 12,24,177
CAGR 53.59% 16.64% 21.15%
Source: Yearly Hand book of SEBI
The above table points out the fact that the total Gross Redemptions of Mutual Funds also increased every year during our period of study. It can also be observed that the same trend is also seen in both Public Sector and Private Sector Mutual Funds. It is clear from the above table that, Similar to Gross Mobilisation by the Mutual Funds, the maximum Gross Redemption of the Mutual Funds in all years during the study period is from the Private Sector, which accounts to 83.03% of the total Gross Redemption of the Mutual Funds. However, it should be noted here that the number of Mutual Fund Companies under Public Sector are 6 and the number of Mutual Fund Companies under Private Sector are 35. Therefore, Average Gross Redemption per Public Sector and Private Sector Mutual Fund for the study period is calculated to see which sector has redeemed more funds per fund. It can be observed from the above table that the Public Sector Mutual Funds have redeemed more funds per fund as compared to Private Sector. The growth rate in terms of Gross Redemption during the study period is also more in Public sector i.e., 53.59% as compared to the Private Sector i.e., 16.64%. The overall growth rate of Gross Redemption of Mutual Funds in India during the study period is 21.15%.
Net Inflows of Mutual Funds in India: Sector Wise Analysis
The net inflow is the difference between the gross mobilization and gross redemptions. The net inflows of all Mutual Funds have increased over the years. The table below gives the net inflows of Mutual Funds in India during the study period from 2013-14 to 2016-17.

IJEMR – December 2017 - Vol 7 Issue 12 - Online - ISSN 2249–2585 Print - ISSN 2249-8672
7 www.ijemr.in
Table 3
Net Inflows of Mutual Funds in India: Sector Wise Analysis
(Rs. in Crores)
Year Public Sector Private Sector Total
2013-14 4543 49239 53,782
2014-15 -413 1,03,700 1,03,288
2015-16 42,787 91,394 1,34,181
2016-17 63,661 2,79,388 3,43,049
Total 1,10,578
(17.43%)
5,23,721
(82.57%)
6,34,300
No. of Mutual Fund Companies 6 35
Average Net Inflows per fund 18,430 14,964
CAGR 141.09% 78.36% 85.46%
Source: Yearly Hand book of SEBI
It is observed from the above the table that the total Net Inflows of Mutual Funds increased every year due to increase in Gross Mobilisation and Gross Redemption of Mutual Funds and the same trend is seen by and large in both the sectors. It can also be pointed out that the Private Sector Mutual Funds have maximum Net Inflows of Mutual funds compared to Public Sector Mutual Funds during the period of study. In the year 2014-15, Public Sector Mutual Funds had negative inflows as the redemptions were more compared to the funds mobilized during that year and in the same period Private Sector Mutual Funds had 110% growth in Net Inflows compared to their Net Inflows during 2013-14. However, the Average Net inflows of Mutual Funds per fund is more in Public Sector Mutual Funds as compared to Private Sector Mutual Funds as the number of companies in Private Sector are more compared to Public Sector. It is interesting to note here that the growth rate of Net inflows of Public Sector Mutual Funds during the study period is 141.09% as compared to 78.36% in Private Sector Mutual Funds leading to an overall growth rate of Net inflows by Mutual Funds is 85.46%.
Assets under Management (AUM) of Mutual Funds
In the past decade, Indian Mutual Fund industry had seen dramatic improvements, both quality-wise as well as quantity-wise. Asset under Management includes:
Capital raised from investors;
Capital belonging to the principals of the fund management firm.
The growth of Mutual Funds in India in terms of Number of Mutual Fund Houses, Number of Schemes, and Assets under Management (AUM) are shown in the Table 4

IJEMR – December 2017 - Vol 7 Issue 12 - Online - ISSN 2249–2585 Print - ISSN 2249-8672
8 www.ijemr.in
Table 4
AUM of Mutual Funds: Year wise Analysis
Year No. of Schemes
AUM
(Rs. In Crores)
No. of Mutual Fund Companies
2014 1638 8,25,240 46
2015 1884 10,82,757 43
2016 2420 12,32,824 42
2017 2281 17,54,619 41
CAGR 11.67% 28.59%
Source: Compiled from www.amfiindia.com
The above analysis indicates that year by year, the number of schemes and the Assets under management of the Mutual Funds are increasing due to the many reasons like the benefits provided by the Mutual Fund Companies, increase in the level of awareness among the people, change in the investment pattern of the investors etc. The growth rate as per the number of schemes launched during the study period is 11.67% and the growth rate in Assets under Management is 28.59%. However, the number of Mutual Fund Companies is decreasing due to merging of the schemes with other Companies.
Assets under Management: Category-Wise
Mutual Funds offer variety of schemes which fall into 10 categories as presented in the Table 5. The Assets under Management of these schemes are presented in the below table
Table 5
AUM: Category-Wise
(Rs. in Crs.)
@-less than 1% Source: compiled from www.amfiindia.com
Category 31.03.’14 31.03.’15 31.03.’16 31.03.’17
Income 4,60,671 5,15,773 5,65,459 7,43,783
Infrastructure Debt Fund 879 1,178 1,730 1,908
Equity 165,560 3,05,669 3,44,707 4,82,138
Balanced 16,793 26,368 39,146 84,763
Liquid 133,280 1,62,562 1,99,404 3,14,086
GILT 6,115 14,614 16,306 14,875
ELSS- Equity 25,547 39,470 41,696 61,403
Gold ETFs 8,676 6,655 6,346 5,480
Other ETFs 4,528 8,060 16,063 44,436
Fund of Funds Investing Overseas 3,191 2,408 1,967 1,747
Total 8,25,240 10,82,757 12,32,824 17,54,619

IJEMR – December 2017 - Vol 7 Issue 12 - Online - ISSN 2249–2585 Print - ISSN 2249-8672
9 www.ijemr.in
The above analysis of the table clearly points out that Income Funds have maximum Assets under Management as compared to all other schemes and the Assets under Management under this category is increasing year on year. The next popular category is Equity Funds, whose Assets under Management are also increasing year on year. Under Income Fund Category, a variety of Schemes are offered, of which the common scheme for all the select Companies under the study is found to be Dynamic Bond Fund.
Performance Evaluation of Dynamic Bond Fund –Direct –Growth of Select Companies
There are various Income Fund schemes available for investors, such as Short-term income funds, Credit opportunities funds, corporate bond funds, Income funds, Gilt funds and Dynamic bond funds. These funds are categorized as per their average maturity of the bonds or debentures they are holding. There are Money Market/Ultra Short Term Fund ( below 6 months), Short Term Debt Funds ( 1-3 years), Medium Term Bond Funds ( 4-7 years), and Gilt Funds ( 10 years or more) etc. These funds clearly define their investment objective and the
investors always have an option to choose amongst them as per their understanding on interest rate scenario. Generally investors lack proper knowledge in taking an informed decision on these funds and as such investing in debt funds was never been the first preference for most of the mutual fund investors. But the recent drop in markets which followed the reduction of interest rate by RBI may have an impact on the investor behavior. It may induce them to consider investing in debt funds as part of their investment strategy.
When an investor is not able to take a call on the future course of interest rates, investing in Dynamic Bond Funds would be an ideal option. In Dynamic Bond Funds, the decision on the allocation of the funds largely depends on the fund manager‟s perspective on the interest rate markets. Fund managers would change allocation towards different debt instruments as per their future prediction on change in interest rates. Therefore, while planning to invest into Dynamic bond fund, the investors should select AMCs with pedigree, a track record and proven research capabilities.
In this Context, the study has been undertaken to evaluate the performance of select Public sector Companies and Private Sector Companies during 2014-17.
Return Analysis of Select Public and Private Mutual Fund Companies
The return is the major parameter for the evaluation of the performance of any Company as the investors make investment with the hope of earning higher return. Whenever the schemes are launched the Mutual Fund Companies disclose the various aspects relating to the schemes like investment objective, Liquidity, Benchmark Index, NAV, Entry and Exit Loads etc., to enable the investor to make an informed investment decisions. The Return for the Dynamic Bond Fund offered by both Public Sector Mutual Fund Companies and Private Sector Mutual Fund Companies are calculated on the basis of opening and closing NAVs for each period.
Return Analysis: Public Sector Mutual Funds
There are 6 Public Sector Mutual Fund Companies operating in India as on 31st March 2017. All the 6 Public Sector Funds have been taken for the study. The returns and the mean return are presented for the Public Sector Mutual Funds in the below table.
IJEMR – December 2017 - Vol 7 Issue 12 - Online - ISSN 2249–2585 Print - ISSN 2249-8672
10 www.ijemr.in
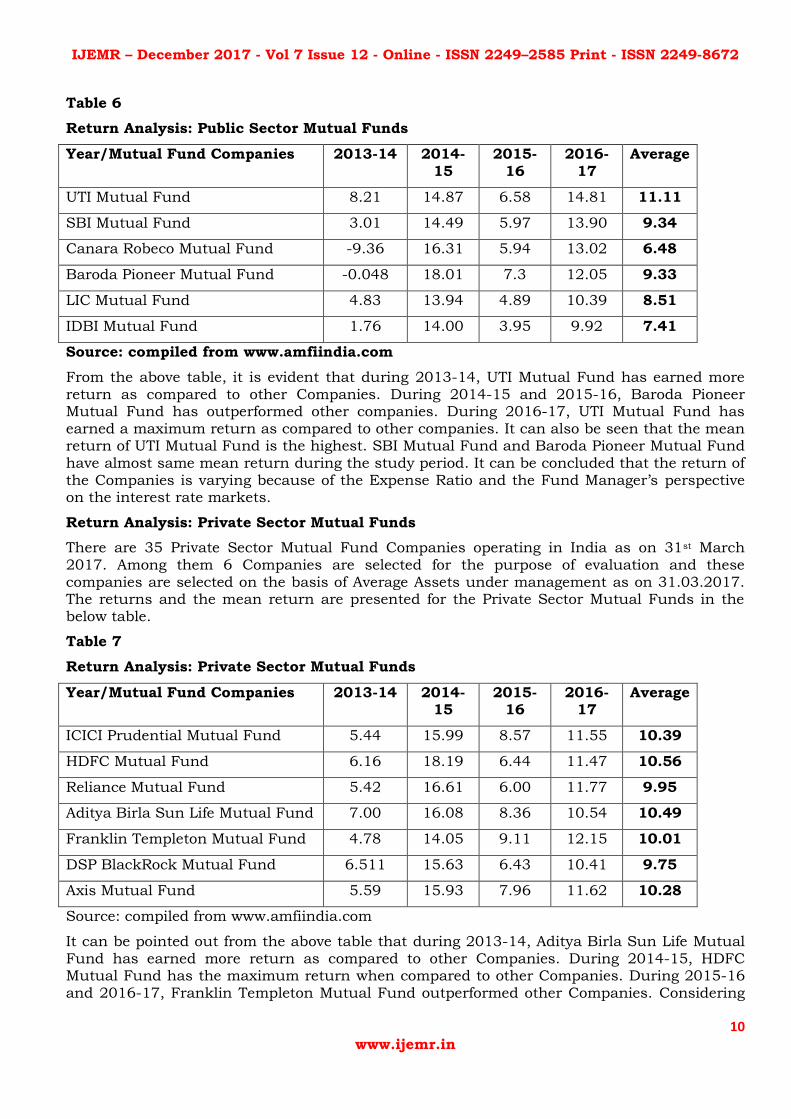
Table 6
Return Analysis: Public Sector Mutual Funds
Year/Mutual Fund Companies 2013-14 2014-15
2015-16
2016-17
Average
UTI Mutual Fund 8.21 14.87 6.58 14.81 11.11
SBI Mutual Fund 3.01 14.49 5.97 13.90 9.34
Canara Robeco Mutual Fund -9.36 16.31 5.94 13.02 6.48
Baroda Pioneer Mutual Fund -0.048 18.01 7.3 12.05 9.33
LIC Mutual Fund 4.83 13.94 4.89 10.39 8.51
IDBI Mutual Fund 1.76 14.00 3.95 9.92 7.41
Source: compiled from www.amfiindia.com
From the above table, it is evident that during 2013-14, UTI Mutual Fund has earned more return as compared to other Companies. During 2014-15 and 2015-16, Baroda Pioneer Mutual Fund has outperformed other companies. During 2016-17, UTI Mutual Fund has earned a maximum return as compared to other companies. It can also be seen that the mean return of UTI Mutual Fund is the highest. SBI Mutual Fund and Baroda Pioneer Mutual Fund have almost same mean return during the study period. It can be concluded that the return of the Companies is varying because of the Expense Ratio and the Fund Manager‟s perspective on the interest rate markets.
Return Analysis: Private Sector Mutual Funds
There are 35 Private Sector Mutual Fund Companies operating in India as on 31st March 2017. Among them 6 Companies are selected for the purpose of evaluation and these companies are selected on the basis of Average Assets under management as on 31.03.2017. The returns and the mean return are presented for the Private Sector Mutual Funds in the below table.
Table 7
Return Analysis: Private Sector Mutual Funds
Year/Mutual Fund Companies 2013-14 2014-15
2015-16
2016-17
Average
ICICI Prudential Mutual Fund 5.44 15.99 8.57 11.55 10.39
HDFC Mutual Fund 6.16 18.19 6.44 11.47 10.56
Reliance Mutual Fund 5.42 16.61 6.00 11.77 9.95
Aditya Birla Sun Life Mutual Fund 7.00 16.08 8.36 10.54 10.49
Franklin Templeton Mutual Fund 4.78 14.05 9.11 12.15 10.01
DSP BlackRock Mutual Fund 6.511 15.63 6.43 10.41 9.75
Axis Mutual Fund 5.59 15.93 7.96 11.62 10.28
Source: compiled from www.amfiindia.com
It can be pointed out from the above table that during 2013-14, Aditya Birla Sun Life Mutual Fund has earned more return as compared to other Companies. During 2014-15, HDFC Mutual Fund has the maximum return when compared to other Companies. During 2015-16 and 2016-17, Franklin Templeton Mutual Fund outperformed other Companies. Considering

IJEMR – December 2017 - Vol 7 Issue 12 - Online - ISSN 2249–2585 Print - ISSN 2249-8672
11 www.ijemr.in
the Average return for the study period HDFC Mutual Fund has the highest return, followed by Aditya Birla Sun Life Mutual Fund. The reasons for varying returns among the Companies are many and very important are the Expense Ratio and Fund Manager‟s perspective on the interest rate markets.
Performance Analysis of Public Sector Mutual Funds
Any rational Investor, before investing his or her investible wealth in the Mutual Funds, analyses the risk associated with a particular scheme. The actual return he receives from the scheme may vary from his expected return and the risk is expressed in terms of variability of return. Any investor would evaluate the scheme not just on the basis of the returns but also take into consideration the risk aspect. Risk is analyzed with the help of Standard Deviation. The performance analysis of Public Sector Mutual Funds in terms of Risk, Return and Sharpe Performance Index is made. Sharpe Performance Index measures the risk premium of the portfolio relative to the total amount of risk in the portfolio. The 91 Day T-bill rate of 5.86% as
on 27th March 2017 is taken as the risk free rate of return for calculating the Sharpe Ratio. The Sharpe Ratio has been calculated using the below formula and the results are presented in the below table.
f
p
pR RSharpe Ratio
Table 8
Performance Analysis of Public Sector Mutual Funds
Mutual Fund Companies Mean Return
Standard Deviation
Sharpe Ratio
UTI Mutual Fund 11.11 4.35 1.21
SBI Mutual Fund 9.34 5.73 0.61
Canara Robeco Mutual Fund 6.48 11.41 0.05
Baroda Pioneer Mutual Fund 9.33 7.64 0.45
LIC Mutual Fund 8.51 4.46 0.59
IDBI Mutual Fund 7.41 5.59 0.28
Source: compiled from www.amfiindia.com
The performance of a Mutual Fund is considered to be better when compared to other Mutual Fund Companies when its returns are high. In case of Risk, lower the risk, better the performance. The Return Analysis shows that among the Public Sector Mutual Funds, UTI Mutual Fund ranked first, followed by SBI Mutual Fund, Baroda Pioneer Mutual Fund, LIC Mutual Fund, IDBI Mutual Fund and Canara Robeco Mutual Fund. On the basis of Risk, it is
the UTI Mutual Fund which ranks first with the lowest risk, followed by LIC Mutual Fund, IDBI Mutual Fund, SBI Mutual Fund, Baroda Pioneer Mutual Fund and Canara Robeco Mutual Fund.
When returns are same, Mutual Funds performance can be evaluated on the basis of risk and when risk is same, performance can be evaluated with the help of return. In the above case, neither the risk nor the return is same for all the Mutual Funds. Hence, Sharpe Performance Index is made. Based on Sharpe Index, it is found that UTI Mutual Fund topped the list followed by SBI Mutual Fund, LIC Mutual fund and Baroda Pioneer Mutual Fund.
Performance Analysis of Private Sector Mutual Funds
The performance analysis of Private Sector Mutual Funds in terms of Risk, Return and Sharpe Performance Index is also made and presented in the below table.

IJEMR – December 2017 - Vol 7 Issue 12 - Online - ISSN 2249–2585 Print - ISSN 2249-8672
12 www.ijemr.in
Table 9
Performance Analysis of Private Sector Mutual Funds
Mutual Fund Companies Mean Return
Standard Deviation
Sharpe Ratio
ICICI Prudential Mutual Fund 10.39 4.49 1.01
HDFC Mutual Fund 10.56 5.64 0.83
Reliance Mutual Fund 9.95 5.28 0.77
Aditya Birla Sun Life Mutual Fund 10.49 4.00 1.16
Franklin Templeton Mutual Fund 10.01 4.07 1.02
DSP BlackRock Mutual Fund 9.75 4.34 0.89
Source: compiled from www.amfiindia.com
The Return analysis shows that among Private Sector Mutual funds, HDFC Mutual Fund
topped the list followed by Aditya Birla Sun Life Mutual Fund, ICICI Prudential Mutual Fund and so on. On the basis of risk, it is the Aditya Birla Sun Life Mutual Fund that topped the list with the least risk followed by Franklin Templeton Mutual Fund, DSP BlackRock Mutual Fund and so on.
Considering Sharpe Index, Aditya Birla Sun Life Mutual Fund has topped the list among all the select private Sector Mutual Funds followed by Franklin Templeton Mutual Fund and ICICI Prudential Mutual Fund.
Results of Independent Sample T-Test for Testing the Returns of Dynamic Bond Fund Scheme of Select Public Sector and Private Sector Mutual Funds
The t stat value of -2.225 is less than t critical two tail value of 2.57 and the p value of 0.039 is than 0.05, indicating that there is a significant difference in the returns for Dynamic Bond Fund scheme between the Public Sector and Private Sector. Therefore, the null hypothesis is rejected and the alternate hypothesis is accepted.
From the Sharpe Ratio, it is clear that the most of the Private Sector Mutual Funds are performing better than the Public Sector Mutual Funds except for UTI Mutual Fund because of the better management of Funds reflecting the efficiency of the Fund Manager.
Findings of the Study
The maximum Gross Mobilization and Gross Redemption by the Mutual Funds are from the Private Sector, which accounts to 83.03% of the total Gross Mobilized and Gross Redemptions by the Mutual Funds. The Growth rate of Public Sector Mutual Funds in terms of Gross Mobilisation and Gross Redemption of funds during the study period is much higher in Public Sector as compared to the Private Sector. The Private Sector Mutual Funds have maximum Net Inflows of Mutual funds compared to Public Sector Mutual Funds during the period of study. However, the growth rate of Net
inflows of Public Sector Mutual Funds during the study period is more i.e., 141.09% as compared to 78.36% in Private Sector Mutual Funds. The Assets under Management of the Mutual Fund Industry is increasing every year and the schemes offered by the Mutual Fund Companies are also increasing. Among the different schemes offered by the Mutual Fund Companies, the percentage of Income Funds to the total AUM is more. In case of Public Sector Mutual Funds, the mean return is maximum in UTI Mutual Fund and SBI Mutual Fund. From Risk point of view, UTI Mutual Fund has the lowest risk. As per Sharpe Ratio, UTI Mutual Fund topped the list with the highest ratio. In case of Private Sector Mutual Funds, the mean return is the highest in HDFC Mutual Fund. From Risk point of view, Aditya Birla Sun Life Mutual Fund has the lowest risk. As per Sharpe Ratio, Aditya birla Sun Life Mutual Fund topped the list with the highest ratio.

IJEMR – December 2017 - Vol 7 Issue 12 - Online - ISSN 2249–2585 Print - ISSN 2249-8672
13 www.ijemr.in
The result of t-test is that there is a significant difference in the returns for the select scheme between the Public Sector and Private Sector.
Suggestion
Public Sector Mutual Fund Companies growth rate is more in terms of Gross Mobilisation, Gross Redemption and Net Inflows by the Mutual Funds. However, the performance of most of the Public Sector Mutual Funds (except UTI Mutual Fund) is low as compared to Private Sector Mutual Fund Companies. Therefore, the fund managers of the most of the Public Sector Mutual Funds have to the manage allocation of Funds to different debt instruments efficiently keeping in view the interest rates.
Conclusion
Mutual Funds are being preferred by the investors to safeguard their Principal and also to create wealth. The Indian Mutual Fund Industry started with the set up of UTI, and then the entry of Mutual Fund Companies sponsored by Nationalized Banks and Insurance Companies. With the entry of Private Sector Funds, the Mutual Fund Industry is offering wide range of fund families to the investors. There are various Categories of schemes offered by the Mutual Funds and among them the most popular one is Income Funds. The performance of the most of the Private Sector Mutual Funds is better compared to the Public Sector Mutual Funds.
References
1. Mark Mobius, “Mutual Funds: An Introduction to the Core Concepts”, John Wiley and Sons(Asia) Pvt. Ltd., 2007 pg.1 2. S R Vishwanath,”Corporate Finance: Theory and Practice”, Sage Publications, Second Edition, 2007, pg.639 3. Megharaja B and Dr. Chalawadi CI, “Performance evaluation of equity mutual fund in India with special reference to sector funds”, International Journal of Commerce and Management Research, Volume 3, Issue 2 (2017), Pg 152-157, http://www.managejournal.com/archives/2017/vol3/issue2/2-12-67 4. RBI, “Macroeconomic Impact of Demonetisation”, A Preliminary Assessment, Mar 10 2017, https://rbidocs.rbi.org.in/rdocs/Publications/PDFs/MID10031760E85BDAFEFD497193995BB1B6DBE602.PDF 5. M. Gowri and Malabika Deo , “Performance Evaluation of Equity Oriented Growth and Dividend Funds of Mutual Funds in India : An Application of Risk – Adjusted Theoretical Parameters”, Indian Journal of Finance, Volume 10, Issue 8, August 2016, http://www.indianjournaloffinance.co.in/index.php/IJF/article/view/99319 6. Priyanka G. Bhatt and Prof. (Dr.) Vijay H.Vyas, “A Study on Performance Evaluation of Selected Equity Mutual Funds In India”, International Journal For Research In Management and Pharmacy Vol. 3, Issue 6, August 2014 (Ijrmp) Issn: 2320-0901, Https://Raijmronlineresearch.Files.Wordpress.Com/2017/08/5_34-88-Priyanka-G-Bhatt-Et-Al1.Pdf
7. Syed Husain Ashraf* and Dhanraj Sharma, “Performance Evaluation of Indian Equity Mutual Funds against Established Benchmarks Index”, International Journal of Accounting Research, February 07, 2014, ISSN: 2472-114X, https://www.omicsonline.org/open-access/performance-evaluation-of-indian-equity-mutual-funds-against-established-benchmarks-index-IJAR-2-113.php?aid=33622 8. Shilpi Pal and Arti Chandani Prof.(2014), “A Critical Analysis of Selected Mutual Funds in India”, Procedia Economics and Finance, vol 11 2014 pg481-494, http://www.sciencedirect.com/science/article/pii/S2212567114002147
9. Mark Bernson, David Levin, Katherine A Szabat, “Basic Business Statistics: Concepts & Applications”, pg-CD-8-1, 2015.