Mutitjulu remote towns jobs profile - nt.gov.au · Web viewPark Ranger. 4 Community and Personal...
49
Remote Towns Jobs Profile MUTITJULU JOBS PROFILE MUTITJULU 1
Transcript of Mutitjulu remote towns jobs profile - nt.gov.au · Web viewPark Ranger. 4 Community and Personal...

Remote Towns Jobs Profile
MUTITJULU
JOBS PROFILE MUTITJULU1

© Northern Territory of Australia 2018
Preferred Reference: Department of Trade, Business and Innovation, 2017 Remote Towns Jobs Profiles, Northern Territory Government, June 2018, Darwin.
Disclaimer
The data in this publication were predominantly collected by conducting a face-to-face survey of businesses within town boundaries during mid-2017. The collection methodology was created in accordance with Australian Bureau of Statistics data quality framework principles. Data in this publication are only reflective of those businesses reported on as operating in the town at the time of data collection (see table at the end of publication for list of businesses reported on).
To comply with privacy legislation or where appropriate, some data in this publication may have been adjusted and will not reflect the actual data reported by businesses. As a result of this, combined with certain data not being reported by some businesses, some components may not add to totals. Changes over time may also reflect business' change in propensity to report on certain data items rather than actual changes over time. Total figures have generally not been adjusted.
Notes for each table and chart are alphabetically ordered and listed at the end of the publication.
Any use of this report for commercial purposes is not endorsed by the Department of Trade, Business and Innovation.
JOBS PROFILE MUTITJULU2

Contents
Mutitjulu......................................................................................................................... 4Introduction.................................................................................................................... 5Summary........................................................................................................................ 6Jobs Overview................................................................................................................. 7Jobs by Aboriginal Status................................................................................................8Jobs by Sector: Private and Public................................................................................10Job Status: Permanent and Temporary.........................................................................13Job Vacancies............................................................................................................... 15Jobs by Industry............................................................................................................16Jobs by Occupation.......................................................................................................19Jobs by Industry by Occupation....................................................................................21Jobs by Gender.............................................................................................................22Jobs by Age...................................................................................................................25Vocational Education and Training...............................................................................28Population..................................................................................................................... 30Community Development Programme.........................................................................32Businesses....................................................................................................................33Notes............................................................................................................................ 34Abbreviations and Acronyms........................................................................................35
JOBS PROFILE MUTITJULU3

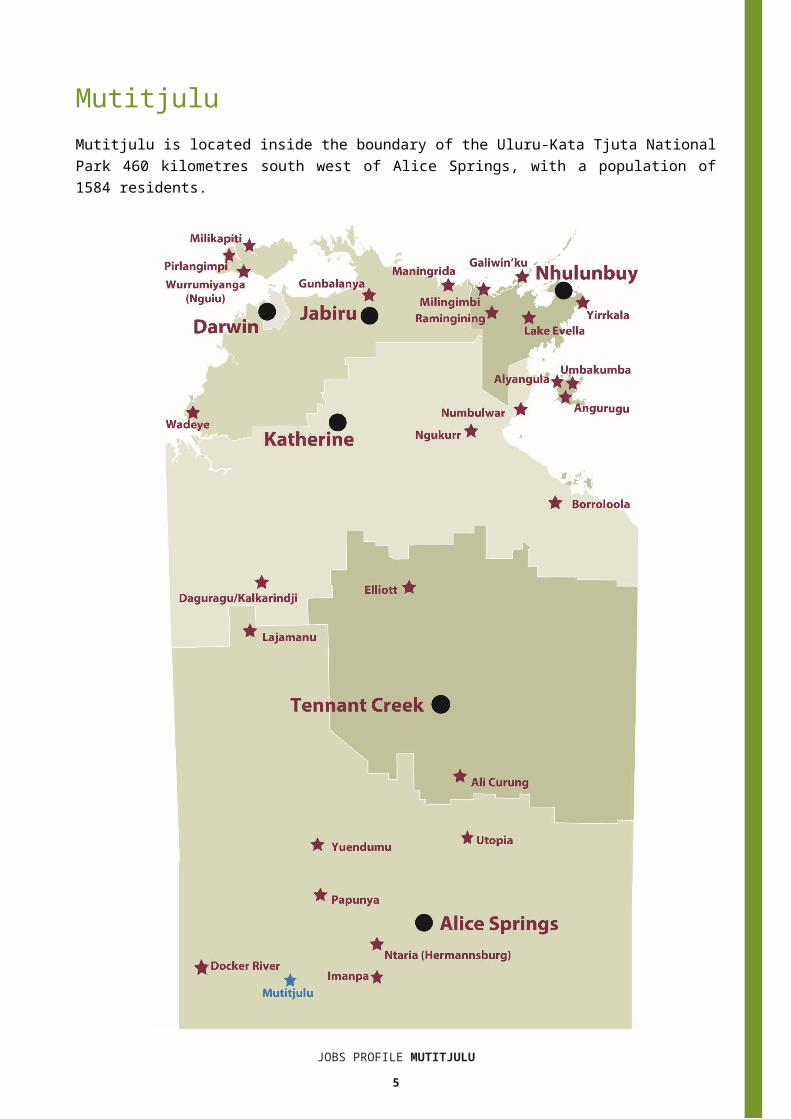
MutitjuluMutitjulu is located inside the boundary of the Uluru-Kata Tjuta National Park 460 kilometres south west of Alice Springs, with a population of 1584 residents.
Source: Department of Trade, Business and Innovation
JOBS PROFILE MUTITJULU4
IntroductionThis jobs profile provides a snapshot of jobs and the characteristics of job holders in Mutitjulu as at July 2017.This job profile is one of 28 profiles developed for remote towns in the Northern Territory. It is anticipated these and subsequent profiles will contribute to a robust evidence base to inform decision making in and relating to these remote Territory towns. This profile contains information collected by the Northern Territory Department of Trade, Business and Innovation from businesses operating within the town and is supplemented by other administrative data sets and information.Each profile provides up-to-date information that is intended to inform the planning and design of current and future government programs and as an evidence base to inform decision making relating to workforce development and enterprise and job opportunities.The data collection methodology and corresponding questionnaire were created in partnership with the Australian Bureau of Statistics (ABS) and in accordance with ABS data quality framework and survey principles.The surveys were predominantly conducted by the Department’s Small Business Champions and Workforce Training Coordinators, on a face-to-face basis with business representatives.The information collected and reported on represents a significant goodwill investment by those businesses and organisations that participated. Each business is listed at the end of this publication.
JOBS PROFILE MUTITJULU5

SummaryThe 2017 jobs profile was developed based on responses from 14 businesses providing jobs to Mutitjulu people. Of these, there were: 10 businesses from the private sector, accounting for 121 filled jobs or 67% of
total filled jobs 4 businesses from the public sector, accounting for 60 filled jobs or 33% of total
filled jobsNote: Yulara Jobs are directly or indirectly related to Mutitjulu and Docker River - directly employing Aboriginal Persons within Yulara and indirectly providing services of Health and Education to the remote towns.
A total of 195 filled and vacant jobs in Mutitjulu were reported.1 The 2017 profile highlights: there were 181 filled jobs of which:
o 78 jobs (43%) were filled by Aboriginal personso 103 jobs (57%) were filled by non-Aboriginal personso 70% of employed Aboriginal people are working in the private sectoro Aboriginal females made up 42% of total Aboriginal filled jobs
there were 14 vacant jobs, of which:o job vacancies as a percentage of jobs is 8%o job vacancies equate to 1 in 14 jobso 5 vacancies were in the Professional areas
Arts and Recreation Services was the largest industry employer in 2017 with 62 filled jobs followed by Health Care and Social Assistance with 49
Business and Clerical was the largest training activity sector in 2016, with 39 students followed by Arts, Entertainment, Sports and Recreation with 30.
The overall population in Mutitjulu increased by 163 persons (11%) between 2006 and 2016 to 1584 persons. In comparison, the overall Northern Territory population increased by 16.5% between 2006 and 2016.In 2016, the working age population (15 years and over) in Mutitjulu was an estimated 1448 persons compared to 1256 in 2006 an increase by 15%.There were 0.1 jobs in Mutitjulu per working age person compared to 0.4 jobs per working age person across the 28 remote towns in the Northern Territory.
1 The number of filled jobs does not represent numbers of persons as a person may have several jobs or one job may be shared by more than one person.
JOBS PROFILE MUTITJULU6

Jobs OverviewTable 1: Count of filled jobs and vacancies, 2017 (a)(b)
2017Total All Jobs 195Vacancies 14Vacancies as % of Total All Jobs 7.73%Filled Jobs 181Full-time 146Part-time 35
Source: Department of Trade, Business and Innovation
Chart 1: Count of vacant jobs and filled jobs by full-time/part-time status, 2017 (a)(b)
Source: Department of Trade, Business and Innovation
In 2017 in Mutitjulu: there were a total of 181 filled jobs. Of these:
o 146 were full-time jobso 35 were part-time jobs
there were 14 total job vacancies.
JOBS PROFILE MUTITJULU7

Jobs by Aboriginal StatusChart 2: Count of filled jobs by Aboriginal status, 2017 (a)(c)
Source: Department of Trade, Business and Innovation
In 2017 in Mutitjulu: of the 181 filled jobs:
o 78 jobs were filled by Aboriginal personso 103 jobs were filled by non-Aboriginal persons
Aboriginal persons accounted for 43% of job holders.
Table 2: Count of filled jobs by full-time/part-time status and Aboriginal status of person in job, 2017 (a)(b)(c)
Indicator2017
Aboriginal Non-Aboriginal Total
Full-time 57 89 146Part-time 21 14 35Total 78 103 181
Source: Department of Trade, Business and Innovation
JOBS PROFILE MUTITJULU8

Chart 3: Count of filled jobs by full-time/part-time status and Aboriginal status of person in job, 2017 (a)(b)(c)
Source: Department of Trade, Business and Innovation
In 2017 in Mutitjulu: of the 181 filled jobs:
o 57 were full-time jobs filled by Aboriginal personso 21 were part-time jobs filled by Aboriginal personso 89 were full-time jobs filled by non-Aboriginal personso 14 were part-time jobs filled by non-Aboriginal persons.
JOBS PROFILE MUTITJULU9

Jobs by Sector: Private and PublicTable 3: Count of filled jobs by sector and Aboriginal status of person in job, 2017 (a)(c)(d)
Indicator2017
Aboriginal Non-Aboriginal Total
Public Sector 24 36 60
Australian Government 21 25 46Territory Government 3 11 14Local Government 0 0 0Private Sector 54 67 121Total 78 103 181
Source: Department of Trade, Business and Innovation
Chart 4: Count of filled jobs by sector of business, 2017 (a)(d)
Source: Department of Trade, Business and Innovation
In 2017 in Mutitjulu: of the 60 jobs in the public sector:
o 46 jobs were in the Commonwealth Governmento 14 jobs were in the Territory Governmento none were in the Local Government
there were 121 jobs in the private sector.
JOBS PROFILE MUTITJULU10

Chart 5: Count of filled jobs by sector and Aboriginal status of person in job, 2017 (a)(c)(d)
Source: Department of Trade, Business and Innovation
In 2017 in Mutitjulu: of the 60 jobs in the public sector:
o 24 jobs were filled by Aboriginal personso 36 jobs were filled by non-Aboriginal persons
of the 121 jobs in the private sector:o 54 jobs were filled by Aboriginal personso 67 jobs were filled by non-Aboriginal persons.
Chart 6: Count of filled jobs by sector and full-time/part-time status of person in job, 2017 (a)(b)(d)
JOBS PROFILE MUTITJULU11

Source: Department of Trade, Business and Innovation
In 2017 in Mutitjulu: of the 60 jobs in the public sector:
o 53 were full-time jobs o 7 were part-time jobs
of the 121 jobs in the private sector:o 93 were full-time jobs o 28 were part-time jobs.
Table 4: Count of filled jobs by full-time/part-time status and Aboriginal status of person in job by sector, 2017 (a)(b)(c)(d)
Indicator
2017Aboriginal Non-Aboriginal Total
Full-time
Part-time Total Full-
timePart-time Total Full-
timePart-time Total
Public Sector 19 5 24 34 2 36 53 7 60Private Sector 38 16 54 55 12 67 93 28 121Total 57 21 78 89 14 103 146 35 181
Source: Department of Trade, Business and Innovation
In 2017 in Mutitjulu of the: 24 jobs in the public sector filled by Aboriginal persons:
o 19 were full-time jobs o 5 were part-time jobs
54 jobs in the private sector filled by Aboriginal persons:
JOBS PROFILE MUTITJULU12

o 38 were full-time jobso 16 were part-time jobs
36 jobs in the public sector filled by non-Aboriginal persons:o 34 were full-time jobs o 2 were part-time jobs
67 jobs in the private sector filled by non-Aboriginal persons:o 55 were full-time jobs o 12 were part-time jobs.
JOBS PROFILE MUTITJULU13

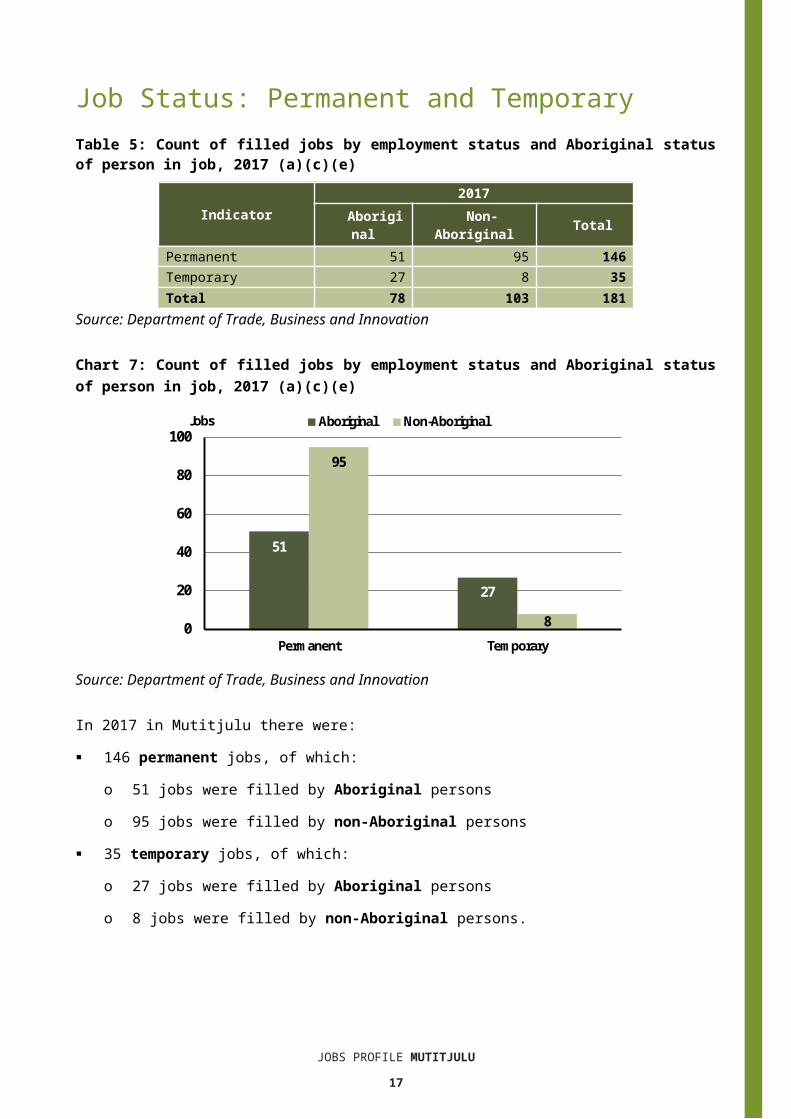
Job Status: Permanent and TemporaryTable 5: Count of filled jobs by employment status and Aboriginal status of person in job, 2017 (a)(c)(e)
Indicator2017
Aboriginal
Non-Aboriginal Total
Permanent 51 95 146Temporary 27 8 35Total 78 103 181
Source: Department of Trade, Business and Innovation
Chart 7: Count of filled jobs by employment status and Aboriginal status of person in job, 2017 (a)(c)(e)
51
27
95
80
20
40
60
80
100
Permanent Temporary
Aboriginal Non-AboriginalJobs
Source: Department of Trade, Business and Innovation
In 2017 in Mutitjulu there were: 146 permanent jobs, of which:
o 51 jobs were filled by Aboriginal personso 95 jobs were filled by non-Aboriginal persons
35 temporary jobs, of which:o 27 jobs were filled by Aboriginal personso 8 jobs were filled by non-Aboriginal persons.
JOBS PROFILE MUTITJULU14

Table 6: Count of filled jobs by sector, Aboriginal status and employment status of person in job, 2017 (a)(c)(d)(e)
Indicator2017
Aboriginal Non-Aboriginal TotalPerm Temp Total Perm Temp Total Perm Temp Total
Public Sector 22 2 24 36 0 36 58 2 60Private Sector 29 25 54 59 8 67 88 33 121Total 51 27 78 95 8 103 146 35 181Source: Department of Trade, Business and Innovation
In 2017 in Mutitjulu: of the 60 jobs in the public sector:
o 58 jobs were permanent, of which: 22 jobs were filled by Aboriginal persons 36 jobs were filled by non-Aboriginal persons
o 2 jobs were temporary, of which: 2 jobs were filled by Aboriginal persons
of the 121 jobs in the private sector:o 88 jobs were permanent, of which:
29 jobs were filled by Aboriginal persons 59 jobs were filled by non-Aboriginal persons
o 33 jobs were temporary, of which: 25 jobs were filled by Aboriginal persons 8 jobs were filled by non-Aboriginal persons.
JOBS PROFILE MUTITJULU15

Job VacanciesTable 7: Job vacancies, 2017
Indicator 2017Job vacancies 14
Source: Department of Trade, Business and Innovation
Table 8: Job vacancies by occupation, 2017 (f)(g)Occupation (ANZSCO major group) 2017
Professionals 5Clerical and Administrative Workers 3Community and Personal Service Workers 4Labourers 1Managers 1Total 14
Source: Department of Trade, Business and Innovation
Table 9: Job vacancies by job title, July 2017 (f)Job Vacancy No.
Program or Project Administrator 2Park Ranger 2Hospitality Workers nec 2General Clerk 1Registered Nurses nec 1Special Needs Teacher 1Teachers' Aide 1Café or Restaurant Manager 1Fast Food Cook 1Human Resource Adviser 1Family Support Worker 1Total 14
Source: Department of Trade, Business and Innovation
In 2017 in Mutitjulu: there were 14 vacancies reported of the 14 reported vacancies, the largest requirements were for:
o 5 Professionals, the majority of which is in the following job: Park Ranger
o 4 Community and Personal Service Workers, the majority of which is in the following job: Hospitality Workers nec
o 3 Clerical and Administrative Workers, the majority of which is in the following job:
JOBS PROFILE MUTITJULU16
Program or Project Administrator.
JOBS PROFILE MUTITJULU17

Jobs by IndustryTable 10: Count of filled jobs by industry of business, 2017 (a)(h)
Industry (ANZSIC Division) 2017Total % of Total
Accommodation and Food Services 14 7.7%Administrative and Support Services 11 6.1%Arts and Recreation Services 62 34.3%Education and Training 24 13.3%Health Care and Social Assistance 49 27.1%Public Administration and Safety 12 6.6%Retail Trade 9 5.0%Total 181 100.0%
Source: Department of Trade, Business and Innovation
In 2017 in Mutitjulu: the Arts and Recreation Services industry was the largest industry employer,
with 62 filled jobs or 34.3% of filled jobs other significant industry employers were:
o Health Care and Social Assistance with 49 jobs (or 27.1% of filled jobs)o Education and Training with 24 jobs (or 13.3% of filled jobs)o Accommodation and Food Services with 14 jobs (or 7.7% of filled jobs).
Table 11: Count of filled jobs by industry of business and Aboriginal status of person in job, 2017 (a)(c)(h)
Industry (ANZSIC division)
2017
Aboriginal
Non-Aboriginal Total
Accommodation and Food Services 14 0 14Administrative and Support Services 9 2 11Arts and Recreation Services 21 41 62Education and Training 8 16 24Health Care and Social Assistance 18 31 49Public Administration and Safety 7 5 12Retail Trade 1 8 9Total 78 103 181
Source: Department of Trade, Business and Innovation
JOBS PROFILE MUTITJULU18

Chart 8: Count of filled jobs by top 5 industries of business and Aboriginal status of person in job, 2017 (a)(c)(h)
Source: Department of Trade, Business and Innovation
In 2017 in Mutitjulu of the: 78 jobs filled by Aboriginal persons, there were:
o 21 jobs in Arts and Recreation Serviceso 18 jobs in Health Care and Social Assistanceo 8 jobs in Education and Training
103 jobs filled by non-Aboriginal persons, there were:o 41 jobs in Arts and Recreation Serviceso 31 jobs in Health Care and Social Assistanceo 16 jobs in Education and Training.
JOBS PROFILE MUTITJULU19
Table 12: Count of filled jobs by industry, employment status and Aboriginal status of person in job, 2017 (a)(c)(e)(h)
Industry (ANZSIC division)
2017Aboriginal Non-Aboriginal Total
Perm
Temp
Total
Perm
Temp
Total
Perm
Temp
Total
Accommodation and Food Services 2 12 14 0 0 0 2 12 14Administrative and Support Services 6 3 9 1 1 2 7 4 11Arts and Recreation Services 21 0 21 40 1 41 61 1 62Education and Training 1 7 8 14 2 16 15 9 24Health Care and Social Assistance 18 0 18 31 0 31 49 0 49Public Administration and Safety 3 4 7 4 1 5 7 5 12Retail Trade 0 1 1 5 3 8 5 4 9Total 51 27 78 95 8 103 146 35 181
Source: Department of Trade, Business and Innovation
In 2017 in Mutitjulu of the: 146 permanent jobs, there were:
o 61 jobs in Arts and Recreation Services, including: 21 jobs filled by Aboriginal persons 40 jobs filled by non-Aboriginal persons
o 49 jobs in Health Care and Social Assistance, including: 18 jobs filled by Aboriginal persons 31 jobs filled by non-Aboriginal persons
o 15 jobs in Education and Training, including: 1 job was filled by an Aboriginal person 14 jobs filled by non-Aboriginal persons
35 temporary jobs, there were:o 12 jobs in Accommodation and Food Services, including:
12 jobs filled by Aboriginal personso 9 jobs in Education and Training, including:
7 jobs filled by Aboriginal persons 2 jobs filled by non-Aboriginal persons
o 5 jobs in Public Administration and Safety, including: 4 jobs filled by Aboriginal persons 1 job was filled by a non-Aboriginal person.
JOBS PROFILE MUTITJULU20

Jobs by OccupationTable 13: Count of filled jobs by occupation, 2017 (a)(f)(g)
Occupation (ANZSCO major group)2017
Total % of Total
Clerical and Administrative Workers 18 9.9%Community and Personal Service Workers 65 35.9%Labourers 17 9.4%Machinery Operators and Drivers 1 0.6%Managers 19 10.5%Professionals 49 27.1%Sales Workers 9 5.0%Technicians and Trades Workers 3 1.7%Total 181 100.0%
Source: Department of Trade, Business and Innovation
Chart 9: Count of filled jobs by occupation, 2017 (a)(f)(g)
Source: Department of Trade, Business and Innovation
In 2017 in Mutitjulu: Community and Personal Service Workers was the largest occupation
classification in terms of filled jobs, accounting for 65 jobs (35.9% of total filled jobs)
other significant occupation classifications were:o Professionals (49 jobs or 27.1%) o Managers (19 jobs or 10.5%)
JOBS PROFILE MUTITJULU21

o Clerical and Administrative Workers (18 jobs or 9.9%).Table 14: Count of filled jobs by ANZSCO occupation by Aboriginal status of person employed in job, 2017 (a)(c)(f)(g)
Occupation (ANZSCO major group)
2017
Aboriginal
Non-Aboriginal Total
Clerical and Administrative Workers 5 13 18Community and Personal Service Workers 33 32 65
Labourers 10 7 17Machinery Operators and Drivers 1 0 1Managers 2 17 19Professionals 23 26 49Sales Workers 3 6 9Technicians and Trades Workers 1 2 3Total 78 103 181
Source: Department of Trade, Business and Innovation
In 2017 in Mutitjulu of the: 78 jobs filled by Aboriginal persons, there were:
o 33 Community and Personal Service Workerso 23 Professionalso 10 Labourerso 5 Clerical and Administrative Workers
103 jobs filled by non-Aboriginal persons, there were:o 32 Community and Personal Service Workerso 26 Professionalso 17 Managerso 13 Clerical and Administrative Workers.
JOBS PROFILE MUTITJULU22

Jobs by Industry by OccupationTable 15: Count of filled jobs by occupation and by industry, 2017 (a)(f)(g)(h)
2017
Industry (ANZSIC Division)
Occupation (ANZSCO major group)
Cl
eric
al a
nd A
dmin
istr
ativ
e W
orke
rs
Co
mm
unit
y an
d Pe
rson
al
Serv
ice
Wor
kers
La
bour
ers
M
achi
nery
Ope
rato
rs a
nd
Dri
vers
M
anag
ers
Pr
ofes
sion
als
Sa
les
Wor
kers
Te
chni
cian
s an
d Tr
ades
W
orke
rs
O
ther
occ
upat
ions
To
tal
Accommodation and Food Services 0 5 5 0 0 0 3 1 0 14Administrative and Support Services 4 3 0 0 2 2 0 0 0 11Arts and Recreation Services 5 13 1 0 7 34 2 0 0 62Education and Training 4 6 3 0 3 7 0 1 0 24Health Care and Social Assistance 4 33 1 0 4 6 0 1 0 49Public Administration and Safety 1 5 5 0 1 0 0 0 0 12Retail Trade 0 0 2 1 2 0 4 0 0 9Total 18 65 17 1 19 49 9 3 0 181Source: Department of Trade, Business and Innovation
In 2017 in Mutitjulu: the majority of Community and Personal Service Workers (65) jobs (the largest
occupation group) were shared across the Health Care and Social Assistance (33) and Arts and Recreation Services (13) industries
Arts and Recreation Services provided 62 filled jobs within an industry group.
JOBS PROFILE MUTITJULU23

Jobs by GenderTable 16: Count of filled jobs by gender and Aboriginal status of person employed in job, 2017 (a)(c)(i)
Indicator2017
Aboriginal Non-Aboriginal Total
Male 44 34 78Female 33 69 102Total 77 103 180
Source: Department of Trade, Business and Innovation
Chart 10: Count of filled jobs by gender and Aboriginal status of person in job, 2017 (a)(c)(i)
Source: Department of Trade, Business and Innovation
In 2017 in Mutitjulu of the: 78 jobs filled by males there were:
o 44 were Aboriginal
o 34 were non-Aboriginal
102 jobs filled by females there were:o 33 were Aboriginal
o 69 were non-Aboriginal.
JOBS PROFILE MUTITJULU24

Table 17: Count of filled jobs by gender, by Aboriginal status of person in the job, by full-time/part-time status, by job permanency and by sector, 2017 (a)(b)(c)(d)(e)(i)
2017
Indicator
Male Female Total
Ab
orig
inal
Non
-Ab
orig
inal
Tot
al
Ab
orig
inal
Non
-Ab
orig
inal
Tot
al
Ab
orig
inal
Non
-Ab
orig
inal
Tot
al
Full-time 37 31 68 19 58 77 57 89 146Part-time 7 3 10 14 11 25 21 14 35Total 44 34 78 33 69 102 78 103 181
Permanent 29 30 59 21 65 86 51 95 146Temporary 15 4 19 12 4 16 27 8 35Total 44 34 78 33 69 102 78 103 181
Public Sector 17 14 31 6 22 28 24 36 60Private Sector 27 20 47 27 47 74 54 67 121Total 44 34 78 33 69 102 78 103 181
Source: Department of Trade, Business and Innovation
In 2017 in Mutitjulu of: of the 78 jobs filled by males, there were:
o 44 jobs filled by Aboriginal males, including: 37 full-time jobs and 7 part-time jobs 29 permanent jobs and 15 temporary jobs 17 public sector jobs and 27 private sector jobs
o 34 jobs filled by non-Aboriginal males, including: 31 full-time jobs and 3 part-time jobs 30 permanent jobs and 4 temporary jobs 14 public sector jobs and 20 private sector jobs
of the 102 jobs filled by females, there were:o 33 jobs filled by Aboriginal females, including:
19 full-time jobs and 14 part-time jobs 21 permanent jobs and 12 temporary jobs 6 public sector jobs and 27 private sector jobs
JOBS PROFILE MUTITJULU25

o 69 jobs filled by non-Aboriginal females, including: 58 full-time jobs and 11 part-time jobs 65 permanent jobs and 4 temporary jobs 22 public sector jobs and 47 private sector jobs.
JOBS PROFILE MUTITJULU26

Jobs by AgeTable 18: Count of filled jobs by age and Aboriginal status of person employed in job, 2017 (a)(c)(j)
Indicator2017
Aboriginal Non-Aboriginal Total
15-24 years 16 6 2225-44 years 43 54 9745+ years 18 43 61Total 78 103 181
Source: Department of Trade, Business and Innovation
Chart 11: Count of filled jobs by age and Aboriginal status of person in job, 2017 (a)(c)(j)
Source: Department of Trade, Business and Innovation
In 2017 in Mutitjulu there were: 22 jobs filled by persons aged 15-24 years. Of these:
o 16 jobs were filled by Aboriginal personso 6 jobs were filled by non-Aboriginal persons
97 jobs filled by persons aged 25-44 years. Of these:o 43 jobs were filled by Aboriginal personso 54 jobs were filled by non-Aboriginal persons
61 jobs filled by persons aged 45+ years. Of these:o 18 jobs were filled by Aboriginal personso 43 jobs were filled by non-Aboriginal persons.
JOBS PROFILE MUTITJULU27

Table 19: Count of filled jobs by age, by Aboriginal status of person in the job, by full-time/part-time status, by job permanency and by sector, July 2017 (a)(b)(c)(d)(e)(i)
2017
Indicator
15-24 years 25-44 years 45+ years Total
Ab
orig
inal
Non
-Ab
orig
inal
Tot
al
Ab
orig
inal
Non
-Ab
orig
inal
Tot
al
Ab
orig
inal
Non
-Ab
orig
inal
Tot
al
Ab
orig
inal
Non
-Ab
orig
inal
Tot
al
Full-time 15 6 21 32 47 79 9 36 45 57 89 146Part-time 1 0 1 11 7 18 9 7 16 21 14 35Total 16 6 22 43 54 97 18 43 61 78 103 181
Permanent 7 3 10 31 53 84 12 39 51 51 95 146Temporary 9 3 12 12 1 13 6 4 10 27 8 35Total 16 6 22 43 54 97 18 43 61 78 103 181
Public Sector 4 0 4 16 23 39 3 13 16 24 36 60Private Sector 12 6 18 27 31 58 15 30 45 54 67 121Total 16 6 22 43 54 97 18 43 61 78 103 181
Source: Department of Trade, Business and Innovation
In 2017 in Mutitjulu of the: 22 jobs filled by persons aged 15-24 years, there were:
o 16 jobs filled by Aboriginal persons, of which: 15 were full-time jobs and 1 was a part-time 7 were permanent jobs and 9 were temporary jobs 4 were public sector jobs and 12 were private sector jobs
o 6 jobs filled by non-Aboriginal persons, of which: 6 were full-time jobs and none were part-time jobs 3 were permanent jobs and 3 were temporary jobs none were public sector jobs and 6 were private sector jobs
97 jobs filled by persons aged 25-44 years, there were:o 43 jobs filled by Aboriginal persons, of which:
32 were full-time jobs and 11 were part-time jobs 31 were permanent jobs and 12 were temporary jobs 16 were public sector jobs and 27 were private sector jobs
JOBS PROFILE MUTITJULU28

o 54 jobs filled by non-Aboriginal persons, of which: 47 were full-time jobs and 7 were part-time jobs 53 were permanent jobs and 1 was a temporary job 23 were public sector jobs and 31 were private sector jobs
61 jobs filled by persons aged 45+ years, there were:o 18 jobs filled by Aboriginal persons, of which:
9 were full-time jobs and 9 were part-time jobs 12 were permanent jobs and 6 were temporary jobs 3 were public sector jobs and 15 were private sector jobs
o 43 jobs filled by non-Aboriginal persons, of which: 36 were full-time jobs and 7 were part-time jobs 39 were permanent jobs and 4 were temporary jobs 13 were public sector jobs and 30 were private sector jobs.
JOBS PROFILE MUTITJULU29

Vocational Education and TrainingTable 20: Northern Territory Vocational Education and Training (VET) students, 2016 (k)
VET Funding Group2016
No. % of Total
Arts, Entertainment, Sports and Recreation 30 37Business and Clerical 39 48Community Services, Health and Education 11 13Tourism and Hospitality 2 2Total 8
2 100Source: Department of Trade, Business and Innovation
In Mutitjulu in 2016: there were 82 VET students the areas of VET activity with the most students were Business and Clerical (39),
Arts, Entertainment, Sports and Recreation (30), and Community Services, Health and Education (11).
Table 21: Northern Territory Vocational Education and Training (VET) unit enrolments, 2016 (l)
VET Funding Group2016
No. % of Total
Arts, Entertainment, Sports and Recreation 27 42Business and Clerical 37 57Community Services, Health and Education 1 2Total 6
5 100Source: Department of Trade, Business and Innovation
In Mutitjulu in 2016: there were 65 VET unit enrolments the areas of VET activity with the most unit enrolments were Business and Clerical
(37), Arts, Entertainment, Sports and Recreation (27), and Community Services, Health and Education (1).
JOBS PROFILE MUTITJULU30

Table 22: Northern Territory Vocational Education and Training (VET) nominal hours, 2017 (m)
VET Funding Group2016
No. % of Total
Arts, Entertainment, Sports and Recreation 1650 54Business and Clerical 1415 46Total 3065 100
Source: Department of Trade, Business and Innovation
In Mutitjulu in 2016: there were 3065 VET nominal hours delivered the areas of VET activity with the most nominal hours delivered were Arts,
Entertainment, Sports and Recreation (1650) and Business and Clerical (1415).Caveat: Nominal hours are based on the hours funded through Department of Trade Business and
Innovation contracts; students and units includes delivery that has been funded in a previous year, fee for service or training that did not meet the funding requirements. Because of this a direct match cannot be made between hours and student/units.
Table 23: Northern Territory Vocational Education and Training (VET) unit completions, 2016 (n)
VET Funding Group2016
No. % of Total
Arts, Entertainment, Sports and Recreation 59 38Business and Clerical 76 49Community Services, Health and Education 17 11Tourism and Hospitality 2 1Total 15
4 100Source: Department of Trade, Business and Innovation
In Mutitjulu in 2016: there were 154 VET unit completions the areas of VET activity with the most unit completions were Business and
Clerical (76), Arts, Entertainment, Sports and Recreation (59), and Community Services, Health and Education (17).
JOBS PROFILE MUTITJULU31

PopulationTable 24: Population distribution by gender and age (p)(r)
Indicator2006 2016 Change
Male Female Total Male Fema
le Total Male Female Total
0-4 years 25 40 65 36 30 66 11 -10 15-14 years 51 49 100 37 33 70 -14 -16 -3015-24 years 122 212 334 164 156 320 42 -56 -1425-44 years 319 295 614 404 335 739 85 40 12545-64 years 156 107 263 195 143 338 39 36 7565+ years 29 16 45 31 20 51 2 4 6TOTAL 702 719 1421 867 717 1584 165 -2 163
Source: Department of Trade, Business and Innovation
In 2016 in Mutitjulu: there were an estimated 1584 persons, of which:
o 867 (54.7%) were maleo 717 (45.3%) were female
between 2006 and 2016, the overall population in Mutitjulu increased by 163 persons from 2006, or an average of 1.1% per year compared to 0.7% across the 28 remote towns and 1.5% Territory wide
the male population increased by 165 persons from 2006 the female population decreased by 2 persons from 2006 in 2016, the working age population (15 years and over) in Mutitjulu was an
estimated 1448 persons (91.4% of the total population) compared with 1256 persons (88.4% of the total population) in 2006. Of these:o 320 (20.2%) were between 15 and 24 years of ageo 739 (46.7%) were between 25 and 44 years of ageo 338 (21.3%) were between 45 and 64 years of ageo 51 (3.2%) were over 65 years of age
of the 1448 persons of working age:o 794 (54.8%) were maleo 654 (45.2%) were female.
There were 0.1 jobs in Mutitjulu per working age person compared to 0.4 jobs per working age person across the 28 remote towns in the Northern Territory.
JOBS PROFILE MUTITJULU32
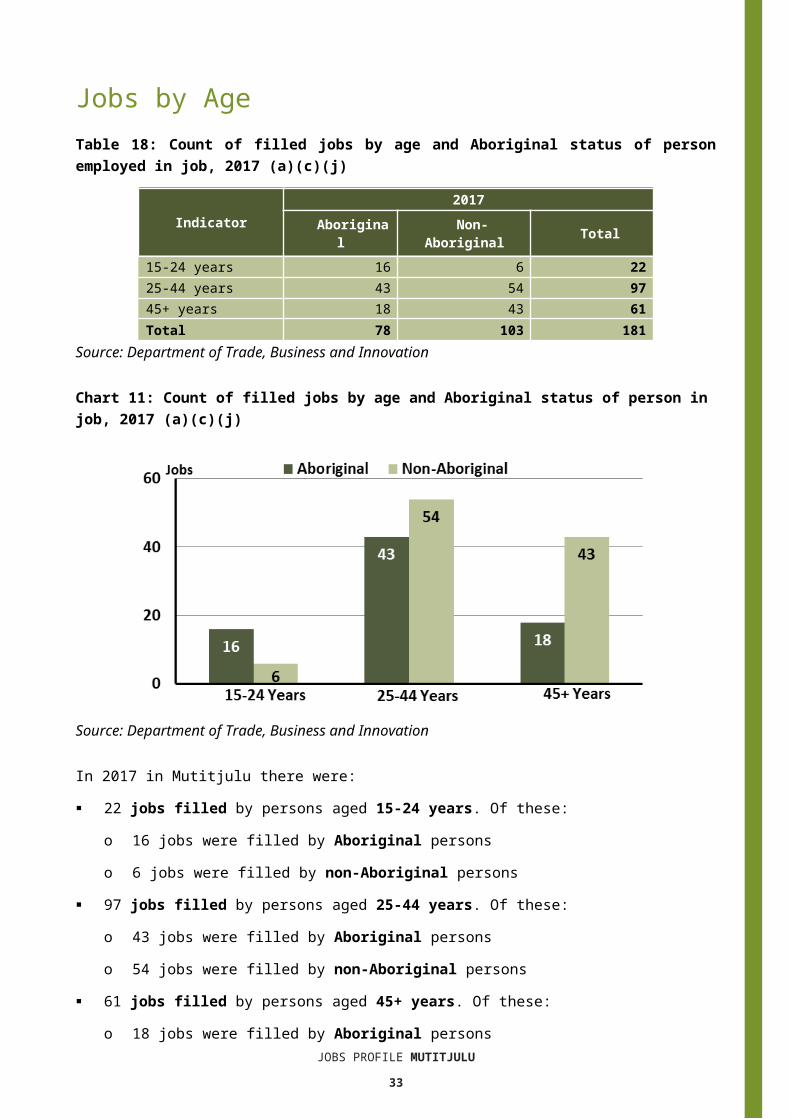
Chart 12: Population by Aboriginal status, 28 remote towns and the NT (p)(q)
Source: Department of Trade, Business and Innovation
In 2016 in Mutitjulu: 34.3% of the population in Mutitjulu were Aboriginal, compared to 80% in 2006 89.4% of the population across all 28 remote towns were Aboriginal 28.3% of the Northern Territory population were Aboriginal.
Table 25: Unemployment and participation rates by Aboriginal status compared to the NT (q)
Mutitjulu Northern Territory
Aboriginal
Non-Aborigin
alTotal Aborigin
alNon-
Aboriginal
Total
Unemployment rate 10.7% 0.9% 2.9% 26.7% 3.8% 7.0%Participation rate 69.9% 95.8% 87.6% 41.0% 79.9% 70.6%
Source: Department of Trade, Business and Innovation
In 2016 in Mutitjulu the: total unemployment rate was 2.9% compared to 7% for the total Northern
Territory Aboriginal unemployment rate was 10.7% compared to 26.7% for the total
Northern Territory non-Aboriginal unemployment rate was 0.9% compared to 3.8% for the total
Northern Territory total participation rate was 87.6% compared to 70.6% for the total Northern
Territory
JOBS PROFILE MUTITJULU33

Aboriginal participation rate was 69.9% compared to 41% for the total Northern Territory
non-Aboriginal participation rate was 95.8% compared to 79.9% for the total Northern Territory.
JOBS PROFILE MUTITJULU34

Community Development ProgrammeTable 26: Community Development Programme Aboriginal Job Seekers, 30 April 2018 (o)
Indicator AboriginalNo. %
Total Aboriginal Job Seekers 86 N/AAge (years)
19 and under < 20 N/A20-24 < 20 N/A25-44 41 N/A45+ < 20 N/A
Total 86 N/AGender
Male 42 48.8Female 44 51.2
Total 86 100.0Employment Outcome - 1 July 2015 to 30 April 2018
13 Weeks < 20 N/A26 Weeks < 20 N/A
Currently in Activities 73 Source: Department of Prime Minister and Cabinet
Chart 13: Community Development Programme Aboriginal Job Seekers by Gender, 30 April 2018 (o)
4248.8%44
51.2%
Gender
Male Female
Source: Department of Prime Minister and Cabinet
As at 30 April 2018, in Mutitjulu, there were 86 CDP Aboriginal job seekers, of these: 42 (48.8%) were male and 44 (51.2%) were female less than 20 were aged 19 years and under, less than 20 were aged 20-24 years,
41 were aged 25-44 years, and less than 20 were aged 45+ years between 1 July 2015 and 30 April 2018, less than 20 had reached the 13 week
reporting milestone and less than 20 had reached the 26 week reporting milestoneJOBS PROFILE MUTITJULU
35

73 were currently in activities.
JOBS PROFILE MUTITJULU36

BusinessesTable 27 Businesses by sector (d)(s)
Business Name
PUBLIC SECTORDepartment of EducationDepartment of HealthDirector National Parks trading as Uluru Kata Tjura National ParkNorthern Territory Police, Fire Emergency ServicesPRIVATE SECTORAnangu Uwankaraku Punu Aboriginal Corporation trading as Maruku ArtsAustralian Regional and Remote Community Services trading as Tjilpi Pampaku Ngura Flexible Aged Care and Community CareMutitjulu Community Aboriginal CorporationMutitjulu Community Aboriginal Corporation trading as Ininti caféMutitjulu Community Health Service (Aboriginal Corporation)Nyangatjatjara Aboriginal CorporationThe Trustee for The Ininti Store Trust trading as Ininti StoreThe Trustee for The Walkatjara Trust - Walkatjara Art The Trustee for Wana Ungkunytja Trust trading as Anangu JobsVoyages Aboriginal Tourism Australia Pty Ltd trading as Voyages Ayers Rock Resort
Source: Department of Trade, Business and Innovation
Note: Business names captured have been identified by the current 2017 Business ABN name listed.
In 2017 in Mutitjulu: there were 14 businesses reported on, of which:
o 4 businesses were from the public sector (27%)o 10 businesses were from the private sector (73%).
JOBS PROFILE MUTITJULU37

Notes(a) These counts represent numbers of filled jobs and not numbers of persons. As such the
totals represent the total number of filled jobs, not the total number of employees. This count is not directly comparable to the total number of employed persons as a person may have several jobs or one job may be shared by more than one person.
(b) Full-time is defined as a job usually requiring 35 hours or more per week or that required 35 hours or more work during the reference week. Part-time is defined as a job usually requiring less than 35 hours per week or that required less than 35 hours work during the reference week. The reference week refers to the period that respondents were asked to provide information about. In most instances it would be the week prior to the week the questionnaire was completed. Questionnaires were predominantly conducted in June and July.
(c) Care needs to be taken when analysing the counts of filled jobs by the Aboriginal status of persons in the jobs. The Aboriginal status of the person employed in a job was reported by the business representative completing the questionnaire.
(d) Sector was classified using the Standard Economic Sector of Classifications of Australia (SESCA), 2008.
(e) Job permanency is classified according to what the business believes the level of job permanency is based on guidelines provided by data collectors. Those guidelines state a permanent job has paid annual and/or sick leave entitlements while a temporary job includes casual and fixed-term contract jobs.
(f) Classified according to the Australian and New Zealand Standard Classification of Occupations (ANZSCO), 2006, major occupation level.
(g) Other occupations include jobs where occupation was not stated, not known or inadequately described.
(h) Classified using the Australian and New Zealand Standard Industrial Classification (ANZSIC), 2006, division level.
(i) Care needs to be taken when analysing the counts of filled jobs by the gender of persons in the jobs. The gender of the person employed in a job is reported by the business representative completing the questionnaire.
(j) Care needs to be taken when analysing the counts of filled jobs by the age of persons in the jobs. The age of the person employed in a job is reported by the business representative completing the questionnaire.
(k) Students represent the number of individual clients that enrolled in a Vocational Education and Training unit during the calendar year.
(l) Unit enrolments represent the count of individual units that students enrolled in during the calendar year.
(m)Nominal hours delivered is the sum of the nominal hours of the units commenced during the calendar year regardless of when the course enrolment commenced.
(n) Unit completions are the count of all successfully completed units reported in the calendar year regardless of the year of commencement of the units.
(o) The Community Development Programme (CDP) supports job seekers in remote Australia to build skills, address barriers and contribute to their communities through a range of flexible activities. Under the CDP, job seekers with activity requirements are expected to do up to 25 hours per week of work-like activities that benefit their community. It should be noted that some CDP participants may be reported on within the profile if they are attached to a filled position with an employer captured in the survey. Due to confidentiality issues, data below 20 people is not published.
(p) Population estimates for both 2006 and 2016 are taken from the estimated resident population (ERP) data produced by the Australian Bureau of Statistics (ABS) and based on Australian Statistical Geography Standard (ASGS) Statistical Area Level 1 (SA1) regions. ERP are official estimates of the Australian population, which link people to a place of usual residence with Australia. All ERP data sources, including the Census of Population and Housing (Census), are subject to error (including inaccuracies in collection, recording and processing data) and should be used with caution.
(q) Indigenous population proportions, unemployment and workforce participation rates are based on ABS Census counts at ASGS Indigenous Locations (ILOCs) for each remote town.
(r) Working-age population includes all residents aged 15 years and over (commonly referred to as the civilian population) and consists of persons that are employed, unemployed or not in the labour force.
JOBS PROFILE MUTITJULU38

(s) A ‘business’ has been defined as any organisation that has undertaken productive activities in the last year, including companies, non-profit organisations, government departments and enterprises operating within the designated remote geography (town), and has one or more employees in paid employment and an Australian Business Number (ABN).
JOBS PROFILE MUTITJULU39

Abbreviations and AcronymsABN Australian Business NumberABS Australian Bureau of StatisticsANZSCO Australian and New Zealand Standard Classification of OccupationsANZSIC Australian and New Zealand Standard Industrial ClassificationASGS Australian Statistical Geography StandardCDP Community Development ProgrammeERP Estimated Resident PopulationILOC Indigenous Locations nec Not Elsewhere ClassifiedNo. NumberPerm Permanentppt Percentage pointRJCP Remote Jobs and Communities ProgramTemp TemporarySA1 Statistical Area Level 1VET Vocational Education and Training
JOBS PROFILE MUTITJULU40