Mutations in DONSON disrupt replication fork stability and ... · PDF fileRS4819274 48Mb BB BB...
30
Supplementary Information Mutations in DONSON disrupt replication fork stability and cause microcephalic dwarfism. Nature Genetics: doi:10.1038/ng.3790
Transcript of Mutations in DONSON disrupt replication fork stability and ... · PDF fileRS4819274 48Mb BB BB...

Supplementary Information
Mutations in DONSON disrupt replication fork stability and cause
microcephalic dwarfism.
Nature Genetics: doi:10.1038/ng.3790

DONSON mutation: S28R
HUMAN 1-MALSVPGYSPGFRKPPEVVRLRRKRARSRGAAASPPRELTEPAARRAALVAGLPLRPFPA 60
CHIMP 1-MALSVPGYSPGFRKPPEVVRLRRKRARSRGAAASPPRELTEPAARRAALVAGLPLRPFPA 60
PIG 1-MALSVPGYSPSFKRPPETLRLRRKRGRSLGAAP-PPKERPEQTTRRAALAAGLPLRPFPA 59
COW 1-MDLSVPGYSPSFKRPPETLRLRRKRGRSLGAA-----ERPEPATRRAARAAGLPLRPFPA 55
DOG 1-MAVSVPGYSPGFRKPPATLRLRRKRARSHGSAA-APGEQPEPAPRRAALAAGLLLRPFPA 59
MOUSE 1-MAVSVPGYSPSFKRPPETVRLRRKRSRDHGAAV--PASLPEPAPRRAALAAGLPLRPFPT 58
DONSON mutations: C278R, Y282C, F292L
HUMAN 235-IGADRKMAGKTSPWSNDATLQHVLMSDWSVSFTSLYNLLKTKLCPYFYVCTYQFTVLFRA 294
CHIMP 235-IGADRKMAGKTSPWSNDATLQHVLMSDWSVSFTSLYNLLKTKLCPYFYVCTYQFTVLFRA 294
PIG 231-IGADRKMAGKANPWSNDETLQHNLLSDWSVSLTSLYNLLKTKLCPYFYVCTYQFTILFRA 290
COW 227-IGADRKMAGKTTPWSNDETLQHVLMSDWSVSFTSLYNLLKTKLCPYFYVCTYQFTILFRA 286
DOG 240-IGADRKMAGKISPWSNDETLQHILMSDWSVSFTSLYNLLKTKLCPYFYVCTYQFTILFRA 299
MOUSE 239-IGADRKMAAKTSPWSADETLQHALMSDWSVSFTSLYNLLKTKLCPYFYVCSYQFTVLFRA 289
DONSON mutation: M446T
HUMAN 421-LVATSGPQAGLPPTLLSPVAFRGATMQMLKARSVNVKTQALSGYRDQFSLEITGPIMPHS-480
CHIMP 421-LVATSGPQAGLPPTLLSPVAFRGATMQMLKARSVNVKTQALSGYRDQFSLEITGPIMPHS-480
PIG 417-LVASSGPQAGLPPTLLSPIAFRGATMQMLKARSVNVKTQALSGYKDQFSLEITGPVMPHS-476
COW 413-LIATSGPQAGLPPTLLSPVAFRGATMQMLKARSVNVKTQALSGYRNQFSLEITGPIMPHS-472
DOG 426-LIASSGPQAGLPPTLLSPVAFRGATMQMLKARSVNVKTQAVSGYKDQFSLEITGPIMPHS-485
MOUSE 415-LVATSGAQAGLPPTLLSPIAFRGASMQMLKARSSNVKTQALSGYRDKFSLDITGPVMPHA-474
DONSON mutations: ΔN417-S418, P433S
HUMAN 375-KKPDILSIKLRKEKHEVQMDHRPESVVLVKGINTFTLLNFLINSKSLVATSGPQAGLPPT-434
CHIMP 375-KKPDILSIKLRKEKHEVQMDHRPESVVLVKGINTFTLLNFLINSKSLVATSGPQAGLPPT-434
PIG 371-KKPDVLSIKLRKEKHEVQMDHRPESVVLVKGMNTFTLLNFLINCKSLVASSGPQAGLPPT-430 COW 367-KKPDVLSIKLRKEIHEVQMDHRPESVVLVKGMNTFTLLNFLINCKSLIATSGPQAGLPPT-426
DOG 500-KKPDILSIKLRKEKHEVQMDHRPESVVLVKGMNTLTLLNFLINSKSLIASSGPQAGLPPT-551
MOUSE 369-KKPDVISIKLRKEKHEVQMDHRPESVVLVKGLNTFKLLNFLINCKSLVATSGAQAGLPPT-428
DONSON mutation: K489T, E504K
HUMAN 468-FSLEITGPIMPHSLHSLTMLLKSSQSGSFSAVLYPHEPTAVFNICLQMDKVLDMEVVHKE-527
CHIMP 468-FSLEITGPIMPHSLHSLTMLLKSSQSGSFSAVLYPHEPTAVFNICLQMDKVLDMEVVHKE-527
PIG 464-FSLEITGPVMPHSLHSVTMLLKSSQSGSFSAGLYTHEPTAVFNTCLPTDKVLDREAVLEE-523
COW 460-FSLEITGPIMPHSLHSVTMLLQSSQNGSFSAGLYTHEPTAVFNICPPKDNVLDKEAVHEE-519
DOG 593-FSLEITGPIMPHSLHSVTMLLRSSQNGSFSAGLYTHEPTAVFNICLPVNKVLDKETVLEE-652
MOUSE 462-FSLDITGPVMPHALHSMSMLLRSSQRGSFSAGLYAHEPTAVFNVGLSLDKELDRKVARED-511
Supplementary Figure 1: Conservation of DONSON amino acids mutated in MD patients.
Amino acid alignment of DONSON protein from different species showing the degree of evolutionary
conservation of disease causing DONSON point mutations, generated using Clustal Omega. Red
arrows indicate the amino acid residues of DONSON mutated in MD patients. The K489T and S28R
missense variants associated with the haplotype present in patients P1-7 are coloured red. All other
mutations are coloured blue.
Nature Genetics: doi:10.1038/ng.3790

Supplementary Figure 2: Cerebral cortical size is markedly reduced with simplification of
gyral folding in patients with DONSON mutations.
Magnetic resonance imaging T1-weighted sagittal and axial FLAIR images of patient P5, and T2-
weighted sagittal and axial images of patients P6 and P7, compared with age-matched control
scans of healthy individuals. Scale bars, 10 cm.
Nature Genetics: doi:10.1038/ng.3790

Supplementary Figure 3: Clinical and genetic characterisation of affected individuals from
family P21.
(a) and (b) are clinical photographs of dead fetuses (P21-1 and P21-2). (c) Pedigree of family P21.
(d) IBDelphi image of chromosome 21. (e) Chromatograms indicating the presence of the c.1047-
9A>G mutation within both affected fetuses, and a parent, from family P21.
DONSON
(chr21:34,949,859-34,959,908) c.1047-9A>G
Contr
ol
Pare
nt
Aff
ecte
d
a b
c
d e
P21-1 P21-2
Aff
ecte
d
Nature Genetics: doi:10.1038/ng.3790
SNPs Distance Mb P14 P15 P16 P17 P18-1 P18-2 P18-3
RS7279441 24.1Mb AA AA AA ab AA AA AA
RS1118467 24.2Mb ab ab BB AA ab ab ab
1332 markers
RS171487 29Mb ab BB BB BB ab ab ab
RS2831134 29Mb AA AA AA AA ab ab ab
142 markers
RS2831813 29.8Mb BB BB ab BB BB BB BB
RS4420778 29.8Mb BB BB BB BB BB BB BB
519 markers
RS2255507 32.4Mb BB AA AA BB ab ab ab
RS2833282 32.4Mb AA AA AA AA AA AA AA
440 markers
RS17632819 34.4Mb BB ab BB AA BB BB BB
RS2409469 34.4Mb BB BB BB BB BB BB BB
67 markers
RS17860260 34.6Mb BB BB BB BB AA AA AA
RS2834167 34.6Mb BB BB BB BB BB BB BB
RS2515716 34.6Mb AA AA AA AA AA AA AA
33 markers
RS2834236 34.9Mb AA AA AA AA AA AA AA
DONSON 34.9Mb AA AA AA AA AA AA AA
DONSON 34.9Mb BB BB BB BB BB BB BB
RS2070392 35Mb BB BB BB BB BB BB BB
280 markers
RS2834657 36.2Mb AA AA AA AA AA AA AA
RS2834658 36.2Mb BB BB BB BB BB BB BB
RS2298352 36.2Mb BB BB AA BB BB BB BB
280 markers
RS2835192 37.3Mb AA AA AA AA AA AA AA
RS11910121 37.3Mb ab BB BB BB BB BB BB
326 markers
RS2211845 39.1Mb AA AA AA BB BB BB BB
RS8133218 39.1Mb BB BB BB BB ab ab ab
1253 markers
RS150792 43.4Mb BB BB BB BB BB BB BB
RS150796 43.4Mb ab AA ab BB BB BB BB
436 markers
RS4819274 48Mb BB BB BB AA BB ab BB
RS9637 231 48Mb AA AA ab BB AA ab AA
-
-
-
- - -
Schematic of high density SNP genotyping of the DONSON locus in P14, P15, P16, P17, P18-1, P18-2 and P18-3 (Color Shading). Heterozygous SNP markers delineating regions of homozygosity are shown in red. An identical haplotype of 321 SNPs is evident in the six patients within ~1.6Mb shared
region of homozygosity consistent with a shared common ancestor (Grey shading). 313 homozygous SNP markers within the 1.6 Mb regions are omitted for clarity.
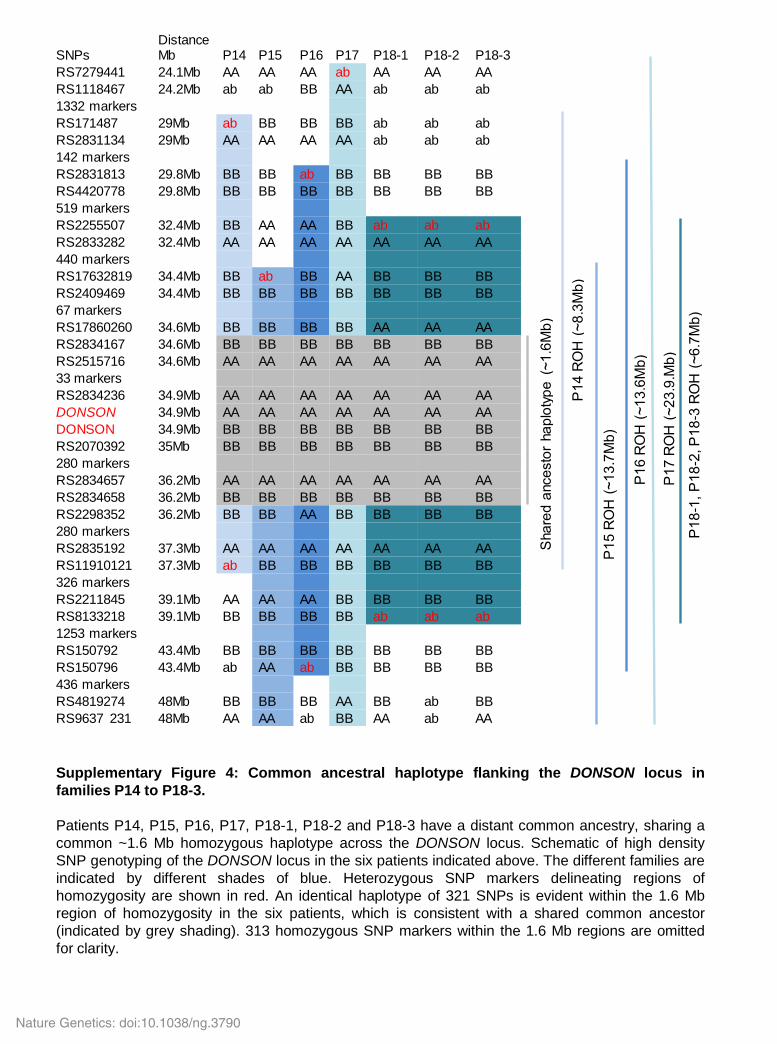
Supplementary Figure 4: Common ancestral haplotype flanking the DONSON locus in
families P14 to P18-3.
Patients P14, P15, P16, P17, P18-1, P18-2 and P18-3 have a distant common ancestry, sharing a
common ~1.6 Mb homozygous haplotype across the DONSON locus. Schematic of high density
SNP genotyping of the DONSON locus in the six patients indicated above. The different families are
indicated by different shades of blue. Heterozygous SNP markers delineating regions of
homozygosity are shown in red. An identical haplotype of 321 SNPs is evident within the 1.6 Mb
region of homozygosity in the six patients, which is consistent with a shared common ancestor
(indicated by grey shading). 313 homozygous SNP markers within the 1.6 Mb regions are omitted
for clarity.
Nature Genetics: doi:10.1038/ng.3790

Exon4 Exon 5
Patient P18-1 (c.786-22A>G)
Exon4 Exon 6
a b
F R
Ex4 Ex5 Ex6 Ex7
500bp
400bp
300bp
200bp
100bp
P18-1 P18-2 WT
GA
PD
H
DO
NS
ON
0
0.2
0.4
0.6
0.8
1
1.2Mutant
Wild Type
Rela
tive
DO
NS
ON
tra
nscri
pt le
ve
ls
DONSON c.786-22A>G
WT DONSON
c
WT
Supplementary Figure 5: The patient-associated DONSON intronic mutation c.786-22A>G
affects mRNA splicing.
(a) Top: a schematic of DONSON mRNA with the position of the PCR primers (F = forward primer;
R = reverse primer) indicated relative to the exons. Bottom: PCR amplification of DONSON exons 4-
7 from cDNA derived from a heathy normal WT individual or patients 18-1 and 18-2. PCR
amplification of GAPDH was used as a control. (b) Sequencing electropherogram of the PCR
products highlighted in (a). The red box indicates the WT sequence. The green box indicates
skipping of exon 5 of DONSON. (c) Quantification of the relative amounts of the WT DONSON
mRNA as compared to the levels of GAPDH by RT-qPCR from three heathy normal individuals and
four DONSON patients (n = 3 independent experiments). P values were determined by a ’
t-test (c).
P = 3.2E-22
Nature Genetics: doi:10.1038/ng.3790

200 bp
300 bp
500 bp
800 bp c.7
86-3
3A
>G
(P
2)
c.7
86-3
3A
>G
(P
6)
c.7
86-2
2A
>G
(P
12)
c.7
86-1
G>
A
WT
Untr
ansfe
cte
d
5’ Ex4 Ex5 3’
F-primer
R-primer
RSV promoter
c.786-33A>G
c.786-22A>G
c.786-1G>A
Intron 3 Intron 4 Intron 5
Exon 4 Exon 5 5’ 3’
Exon 4 5’ 3’
5’ 3’
a
b
Supplementary Figure 6: The patient-associated DONSON intronic mutation c.786-33A>G
does not affect mRNA splicing.
(a) A schematic of DONSON mRNA splicing mini gene reporter construct with the relative positions
of the PCR primers, RSV promoter, two artificial vector-associated exons (labelled as 5’ and 3’ and
DONSON exons/introns indicated. The location of the two DONSON intronic variants (c.786-22A>G
and c.786-33A>G) relative to the intron/exon boundaries are shown. An essential splice site c.786-
1G>A mutation was generated as a positive control that disrupts splicing. The position of the PCR
primers (F-primer = forward primer; R-primer = reverse primer) is indicated relative to the exons. (b)
PCR amplification of DONSON exons 4-5 from cDNA derived from the splicing reporter construct
containing WT or the individual DONSON mutations. The exon content of each PCR product was
verified by sequencing (indicated).
Nature Genetics: doi:10.1038/ng.3790

WT
S2
8R
M4
46
T
K4
89
T
-DOX
WT
DONSON Con siRNA:
DONSON
CHK2
HeLa
Supplementary Figure 7: Depletion of endogenous DONSON in HeLa Flp-In/T-Rex
cells
Endogenous DONSON was depleted using siRNA from HeLa Flp-In/T-Rex cells
expressing doxycycline-inducible GFP-tagged siRNA-resistant WT or mutant DONSON.
Endogenous DONSON were detected using an anti-DONSON antibody. CHK2 was
used as a loading control.
Nature Genetics: doi:10.1038/ng.3790

Supplementary Figure 8: Alterations in the protein level of the K489T GFP-DONSON variant
are not due to reduced levels of mRNA
(a) Immunoblotting using an anti-GFP antibody demonstrates reduced protein levels of the K489T
GFP-DONSON variant compared to WT GFP-DONSON (same cell lines as Fig 2d). ‘+T ’
expression induced by treatment with 1 ug/ml tetracycline for 24 h; ‘-T ’ uninduced. α-Tubulin was
used as a loading control. (b) qRT-PCR analysis of GFP-DONSON transcript levels from RNA
isolated from the same cell pellets as in (a). Transcript levels are expressed relative to the
housekeeping gene PBGD. Data in (a) and (b) are representative of three technical replicates from
two independent experiments. P values were determined by a ’ t-test (b).
0
0.1
0.2
0.3
0.4
0.5
GF
P-D
ON
SO
N T
ranscrip
t re
lative e
xpre
ssio
n
K489T
WT
-Tet +Tet
K489T
WT
a b
α-Tubulin
GFP-Donson K
489T
WT
-Tet +Tet
K489T
WT
P = 0.53
Nature Genetics: doi:10.1038/ng.3790
N417_S418del S28R
GF
P
DA
PI
Merg
e
GFP
Vector K489T F292L Y282C Q543_I544insK M446T
WT
DONSON
a
b
0%
20%
40%
60%
80%
100%
Diffuse
Nuclear
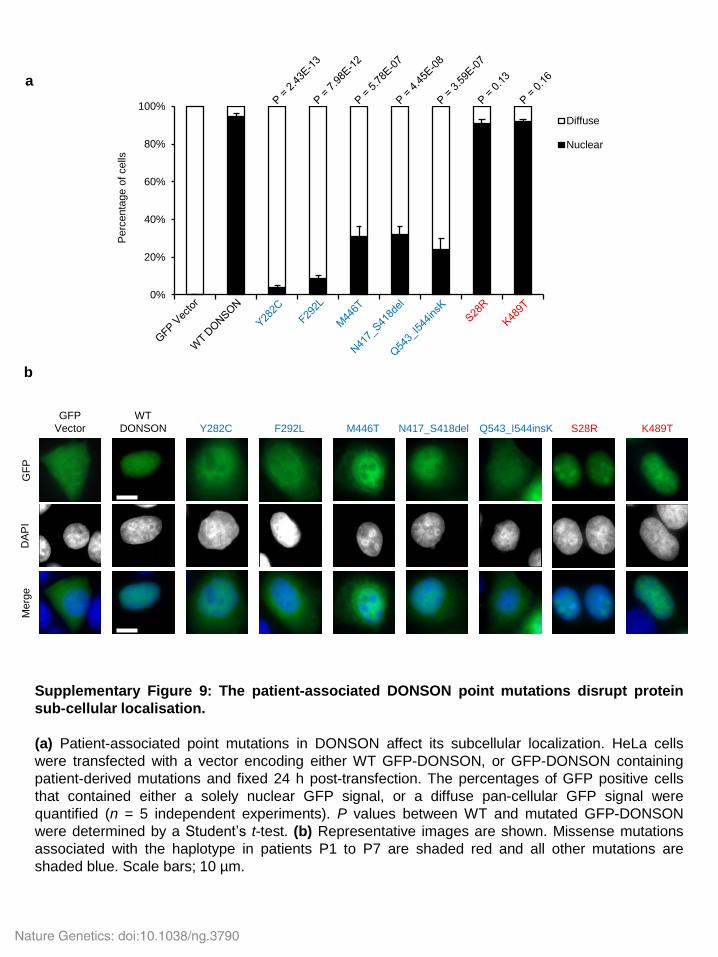
Supplementary Figure 9: The patient-associated DONSON point mutations disrupt protein
sub-cellular localisation.
(a) Patient-associated point mutations in DONSON affect its subcellular localization. HeLa cells
were transfected with a vector encoding either WT GFP-DONSON, or GFP-DONSON containing
patient-derived mutations and fixed 24 h post-transfection. The percentages of GFP positive cells
that contained either a solely nuclear GFP signal, or a diffuse pan-cellular GFP signal were
quantified (n = 5 independent experiments). P values between WT and mutated GFP-DONSON
were determined by a ’ t-test. (b) Representative images are shown. Missense mutations
associated with the haplotype in patients P1 to P7 are shaded red and all other mutations are
shaded blue. Scale bars; 10 µm.
Perc
enta
ge o
f cells
Nature Genetics: doi:10.1038/ng.3790

Supplementary Figure 10: The patient-associated DONSON intronic mutation c.1047-9A>G
affects mRNA abundance.
(a) Schematic presentation of exon and intron boundaries of a region of DONSON. Arrows indicates
primers (F; forward: and R; reverse) used for semi-quantitative RT-PCR and qRT-PCR. (b) Semi-
quantitative RT-PCR analysis of DONSON transcript levels in P21-1 and P21-2 and three normal
controls (NC-1, NC-2 and NC-3). Red star indicates retention of intronic region in patient amplicon.
(c) qRT-PCR analysis of DONSON transcript levels, normalised to GAPDH, in patients P21-1, P21-
2 and three healthy normal controls (NC) (n = 3 independent experiments). Error bars indicate s.d.
(a.u. = arbitary units).
a
b
F: CAACTCGAGGTTTAAGAGAAGC R: CATCCTCATCACTGATGGC
P21-2 P21-1 NC-1 NC-2 NC-3 P21-2 P21-1 NC-1 NC-2 NC-3
DONSON GAPDH
*
100 bp
200 bp 300 bp
109 bp
Exon-5 Exon-6 Exon-7
-9A>G
F R
c
NC P21-1 P21-2
DONSON transcript expression 1.2
1.0
0.8
0.6
0
Rela
tive e
xpre
ssio
n (
a.u
.)
0.4
0.2
Nature Genetics: doi:10.1038/ng.3790

H2A
DONSON
1 mM HU (h)
WT1
0 8 24
P12
0 8 24
P2
0 8 24
P9
0 8 24
WT2
0 8 24
P6
0 8 24
P10-2
0 8 24
H2A
DONSON
1 mM HU (h)
Supplementary Figure 11: Patient derived fibroblasts retain residual levels of DONSON
protein.
Immunoblotting of cell extracts from patient derived fibroblast cell lines treated with HU for the
indicated times. WT1 and WT2 indicate unrelated healthy normal individuals. H2A was used as a
loading control.
Nature Genetics: doi:10.1038/ng.3790

0
10
20
30
40
50
60
70
80
90
EdU +ve EdU -ve
Perc
enta
ge o
f cells
with >
10 5
3B
P1 foci
Control DONSON
DONSON
γ-H2AX
H2A
siRNA:
a
d
DO
NS
ON
siR
NA
C
ontr
ol siR
NA
53BP1
DAPI 53BP1
DAPI EdU
EdU
b
Supplementary Figure 12: Depletion of DONSON gives rise to increased spontaneous DNA
damage in replicating cells.
(a) Knockdown of DONSON results in increased levels of phosphorylated H2AX. HeLa cells were
transfected with control or DONSON siRNA, harvested 72 h post-transfection and extracts subjected to
SDS-PAGE and immunoblotting using the antibodies indicated (n = 3 independent experiments). (b-e)
DONSON depletion causes DNA double strand breaks in replicating cells. (b) DONSON-depleted cells
were seeded onto coverslips and incubated with 10 μ EdU for 10 min before harvesting. Cells were
then pre-extracted, fixed and stained with an antibody to γ 2AX. EdU was visualised using the Click-iT-
Alexa-488 Imaging Kit. The intensity of γ 2AX immunostaining in >100 EdU positive cells and >50 EdU
negative cells were quantified per cell line per condition per experiment (n = 2 independent
experiments). (c) Quantification of the percentage of EdU positive and negative cells with >10 53BP1
foci in cells without DONSON. A minimum of 300 cells were counted per sample per experiment (n = 3
independent experiments). (d) Representative images for (c) Scale bars; 10 µm. (e) Pulsed-field gel
electrophoresis was used to detect the presence of DNA double strand breaks (DSBs) in cells from (a).
As a positive control, HeLa cells were irradiated with 30 Gy of ionising radiation (IR) and harvested 1
later. Throughout, P values were determined by a Mann–Whitney U test (b), or a ’ t-test (c).
Control
siRNA
DONSON
siRNA
Control
siRNA
DONSON
siRNA
EdU negative EdU positive
0
2x10⁷
4x10⁷
6x10⁷
8x10⁷
1x10⁸
ɣ AX
c
Control
siRNA
DONSON
siRNA IR (30Gy)
DSBs
e
P = 0.0020
P < 0.001
Nature Genetics: doi:10.1038/ng.3790
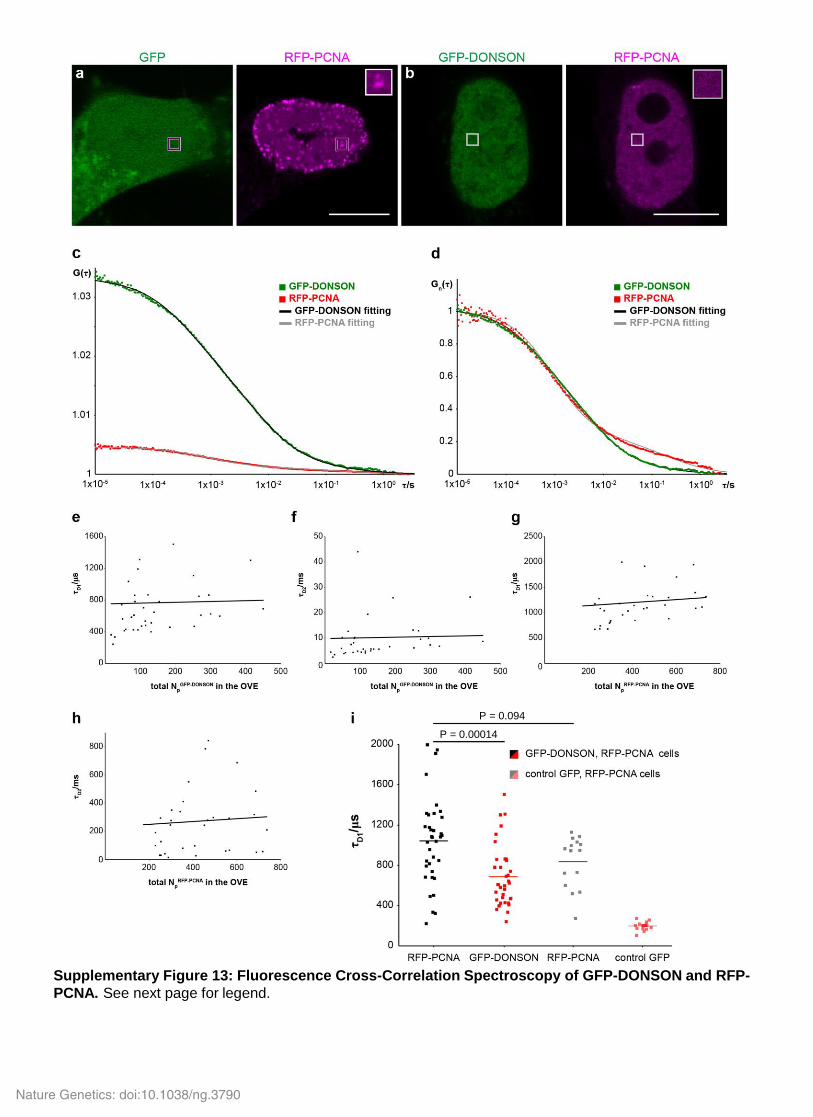
Supplementary Figure 13: Fluorescence Cross-Correlation Spectroscopy of GFP-DONSON and RFP-
PCNA. See next page for legend.
P = 0.00014
P = 0.094
Nature Genetics: doi:10.1038/ng.3790

Nature Genetics: doi:10.1038/ng.3790
Time (h) after
250ng/ml MMC
NBS1 S343-P
Control
siRNA
CHK1 S345-P
SMC1-S966-P
0
H2A
γ-H2AX
24
NBS1
CHK1
SMC1
RPA2-S4/8-P
RPA2
0 24
DONSON
siRNA
DONSON
FANCD2
a b
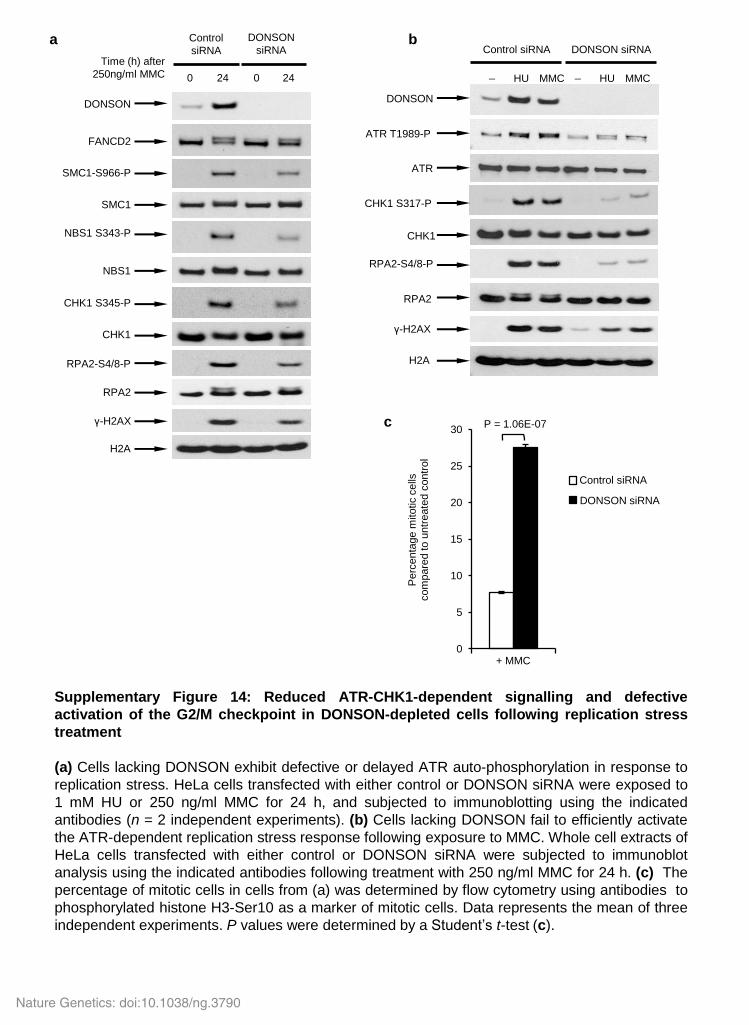
Supplementary Figure 14: Reduced ATR-CHK1-dependent signalling and defective
activation of the G2/M checkpoint in DONSON-depleted cells following replication stress
treatment
(a) Cells lacking DONSON exhibit defective or delayed ATR auto-phosphorylation in response to
replication stress. HeLa cells transfected with either control or DONSON siRNA were exposed to
1 mM HU or 250 ng/ml MMC for 24 h, and subjected to immunoblotting using the indicated
antibodies (n = 2 independent experiments). (b) Cells lacking DONSON fail to efficiently activate
the ATR-dependent replication stress response following exposure to MMC. Whole cell extracts of
HeLa cells transfected with either control or DONSON siRNA were subjected to immunoblot
analysis using the indicated antibodies following treatment with 250 ng/ml MMC for 24 h. (c) The
percentage of mitotic cells in cells from (a) was determined by flow cytometry using antibodies to
phosphorylated histone H3-Ser10 as a marker of mitotic cells. Data represents the mean of three
independent experiments. P values were determined by a ’ t-test (c).
CHK1 S317-P
Control siRNA
H2A
γ-H2AX
_
CHK1
RPA2-S4/8-P
RPA2
HU MMC
DONSON
DONSON siRNA
_ HU MMC
ATR T1989-P
ATR
c
0
5
10
15
20
25
30
Perc
enta
ge m
itotic c
ells
com
pare
d to u
ntr
eate
d c
ontr
ol
Con siRNA
Donson siRNADONSON siRNA
Control siRNA
+ MMC
P = 1.06E-07
Nature Genetics: doi:10.1038/ng.3790

RP
A flu
ore
scence in
tensty
(A
U)
Control
siRNA
DONSON
siRNA
Control
siRNA
DONSON
siRNA
0
20
40
60
80
+HU
a
RP
A
DA
PI
Control
siRNA
DONSON
siRNA
Control
siRNA
DONSON
siRNA
+HU
Supplementary Figure 15: Increased levels of RPA-coated ssDNA in DONSON-depleted cells
following treatment with HU
Exposure of cells lacking DONSON to HU induces increased levels of RPA coated ssDNA. (a-b) HeLa cells
transfected with either control or DONSON siRNA were exposed to 1 mM HU for 24 h, immunostained with
antibodies specific to RPA2 and analysed by fluorescence microscopy. Fluorescence intensity per nucleus
was quantified using ImageJ. Lines denote mean values from two independent experiments. Representative
images are shown in (b). (c-d) Native BrdU foci formation in HeLa cells transfected with the indicated
siRNAs was analysed by fluorescence microscopy. The cells were treated as detailed in the schematic
(top), and immunostained with antibodies to BrdU. Foci formation was quantified using ImageJ (n = 3
independent experiments). (d) Representative images are shown. As a control for BrdU incorporation, cells
were treated with 2 M HCl to denature DNA prior to addition of the BrdU antibody. Scale bars; 10 µm. P
values were determined by a Mann-Whitney U test (c).
60
0
20
40
Num
ber
of
native B
rdU
foci per
cell
Control
siRNA
DONSON
siRNA
Control
siRNA
DONSON
siRNA
+HU
b
c 6 h
Harvest 2 mM HU 10 µm BrdU
24 h Control
siRNA
DONSON
siRNA
Control
siRNA
DONSON
siRNA
+HU
Merg
e w
ith
DA
PI
Brd
U
d
Control
siRNA
DONSON
siRNA
Denatured with 2M HCl
Merg
e w
ith
DA
PI
Brd
U
P < 0.001
P < 0.001
P < 0.001
P < 0.001
Nature Genetics: doi:10.1038/ng.3790

0
2
4
6
8
10
12
14
16
Perc
enta
ge o
f m
eta
phases
siRNA: Control DONSON Control DONSON Control DONSON
MMC HU
a
d
0
0.2
0.4
0.6
0.8
1
Untr MMC HU
Control siRNA
DONSON siRNA
Avera
ge r
adia
l chro
mosom
es / c
hro
mosom
e
exchanges p
er
meta
phases
c
Highly Fragmented
Pulverised
0
1
2
3
4
5
6
7
Untr MMC HU
Avera
ge c
hro
matid
gaps/b
reaks p
er
meta
phase
Control siRNA
DONSON siRNA
Untreated MMC HU
Untreated MMC HU
b
0
5
10
15
20
25
30
35
40
Untreated MMC HU
Control siRNA
DONSON siRNA
Perc
enta
ge o
f cells
with m
icro
nucle
i
Supplementary Figure 16: Replication stress exacerbates genome instability in DONSON
deficient cells.
Exposure of cells lacking DONSON to HU or MMC exacerbates micronuclei formation and
chromosome breakage. (a) Micronuclei formation in HeLa cells transfected with either control or
DONSON siRNA following exposure to either 4mM HU for 6 h, followed by 24 h recovery, or
50ng/ml MMC for 24 h was assessed using fluorescence microscopy (n = 3 independent
experiments). (b) Quantification of the chromatid gaps/breaks in metaphases from control or
DONSON siRNA transfected HeLa cells following exposure to HU or MMC as in (a). At least 50
metaphases per experiment were counted (n = 3 independent experiments). (c) Quantification of
chromosome exchanges and radial chromosomes in metaphases from control or DONSON siRNA
transfected HeLa cells following exposure to HU or MMC as in (a). At least 50 metaphases per
experiment were counted (n = 3 independent experiments). (d) Quantification of metaphases from
control or DONSON siRNA transfected HeLa cells, containing highly fragmented or pulverised
metaphases following exposure to HU or MMC as in (a) (n = 3 independent experiments). P values
were determined by a ’ t-test (a,b,c), or a chi-squared test.
P = 0.00052
P = 0.038
P = 0.098
P = 0.01
P = 0.031
P = 0.095
P < 0.001
P < 0.001
P < 0.001
P = 1.8E-08
P = 0.00063 P = 2.23E-05
Nature Genetics: doi:10.1038/ng.3790

0
5
10
15
20
25
30
35
40
Perc
enta
ge
of C
ldU
la
belle
d f
ork
s
WT1WT2AJ602AJ1794AJ1795AJ1796AJ1884
Stalled forks
0
0.1
0.2
0.3
0.4
0.5
0.6
0.7
0.8
0.9
1
Untreated
Avera
ge n
um
ber
of
chro
mosom
al
aberr
atio
ns p
er
meta
phase
WT1
WT2
AJ602
AJ1794
AJ1795
AJ1796
AJ1884
WT1
WT2
P6
P12
P2
P9
P10-2
a
WT1
WT2
P6
P12
P2
P9
P10-2
0.0
5.0
10.0
15.0
20.0
25.0
Untreated
Perc
enta
ge o
f cells
with 5
3B
P1 a
nd
γ-H
2A
X f
oci
WT1
WT2
AJ602
AJ1794
AJ1795
AJ1796
AJ1884
WT1
WT2
P6
P12
P2
P9
P10-2
b
20 min 20 min
CldU IdU Harvest
Untreated
HU treated 20 min 20 min
Harvest
2 mM HU
2 h
CldU IdU
Supplementary Figure 17: Cells from patients with hypomorphic DONSON mutations exhibit genome
instability and replication fork abnormalities that are exacerbated by replication stress.
(a) Mutation of DONSON results in replication fork instability that is exacerbated by replication stress. Patient
derived fibroblasts were pulsed for 20 min with CldU, exposed to 2 mM HU for 2 h, and then pulsed with IdU for
20 min. DNA fibres were quantified, and the percentage of ongoing forks, new origin firing and stalled forks are
displayed (n = 3 independent experiments). Bottom right: Schematic of DNA fibre analysis. (b) DONSON patient
derived fibroblasts exhibit elevated levels of spontaneous 53BP1 and γ 2AX foci. Patient derived fibroblasts
were immunostained with antibodies to 53BP1 and γ 2AX, and the percentage of cells with 53BP1/γ 2AX foci
were quantified (n = 3 independent experiments). (c) Cells from DONSON patients exhibit spontaneous
chromosomal instability. Chromosomal aberrations in patient derived fibroblasts were quantified (n = 3
independent experiments). Throughout, P values were determined by a ’ t-test (a,b,c).
c
0
10
20
30
40
50
60
70
80
90P
erc
enta
ge o
f C
ldU
la
belle
d f
ork
s
Ongoing forks
0
2
4
6
8
10
12
Perc
enta
ge o
f C
ldU
la
belle
d f
ork
s
New origins + HU + HU
+ HU
Nature Genetics: doi:10.1038/ng.3790

0
2
4
6
WT1 P2 P9 WT2 P6 P12 P2
Left
fork
le
ngth
/rig
ht
fork
le
ngth
(ra
tio
)
P10-2 WT1 P9 P10-2 WT2 P6 P12
HU
Supplementary Figure 18: Cells from patients with hypomorphic DONSON mutations exhibit
increased replication fork instability
Quantification of DNA replication fork asymmetry in DONSON mutant patient-derived fibroblasts.
The plot indicates the ratio of left/right fork track lengths of bidirectional replication forks. The red
lines denote the median ratio (n = 3 independent experiments). Bottom: Schematic of DNA fibre
analysis.
20 min 20 min
CldU IdU Harvest
Untreated HU treated 20 min 20 min
Harvest
2 mM HU
2 h
CldU IdU
Nature Genetics: doi:10.1038/ng.3790

0
10
20
30
40
50
60
70
80
90
Perc
enta
ge
of C
ldU
la
belle
d f
ork
s
GFP-Donson WT + Con siRNA
GFP-Donson WT + Donson siRNA
GFP-Donson S28R + Donson siRNA
GFP-Donson M446T + Donson siRNA
GFP-Donson K489T + Donson siRNA
GFP-Donson WT + Donson siRNA + DOX
GFP-Donson S28R + Donson siRNA + DOX
GFP-Donson M446T + Donson siRNA +DOXGFP-Donson K489T + Donson siRNA +DOX
+ DOX
0
5
10
15
20
25
30
Perc
enta
ge o
f C
ldU
la
belle
d f
ork
s
GFP-DONSON WT + Control siRNA
GFP-DONSON WT + DONSON siRNA
GFP-DONSON S28R + DONSON siRNA
GFP-DONSON M446T+ DONSON siRNA
GFP-DONSON K489T+ DONSON siRNA
+ DOX
20 min 20 min
CldU IdU Harvest
+/- DOX
24 h
Stalled forks Ongoing forks
Supplementary Figure 19: The patient-derived M446T and K489T mutations fail to correct the
replication fork instability associated with DONSON depletion.
HeLa Flp-In/T-Rex cells from (Fig 2d) expressing GFP-tagged WT or mutant DONSON under the
control of a doxycycline-inducible promoter were transfected with DONSON siRNA. 48 h post-
transfection, 1 μ /ml doxycycline was added for 24 h. The cells were pulsed with CldU for 20 min,
followed by IdU for 20 min. DNA fibres were quantified, and the percentage of ongoing forks and
stalled forks are displayed (n = 2 independent experiments). ‘+ X’ indicates the addition of
doxycycline 24 h prior to incubation with the thymidine analogues. Bottom: Schematic of DNA fibre
analysis. P values were determined by a ’ t-test.
P = 0.01
P = 0.0002
P = 0.28
P = 0.39
P = 0.0007
P = 0.0003
P = 0.42
P = 0.10
Nature Genetics: doi:10.1038/ng.3790
0
5
10
15
20
25
30
35
40
Perc
enta
ge
of C
ldU
-la
belle
d fork
s
0
2
4
6
8
10
12
Perc
enta
ge
of C
ldU
-la
belle
d fork
s
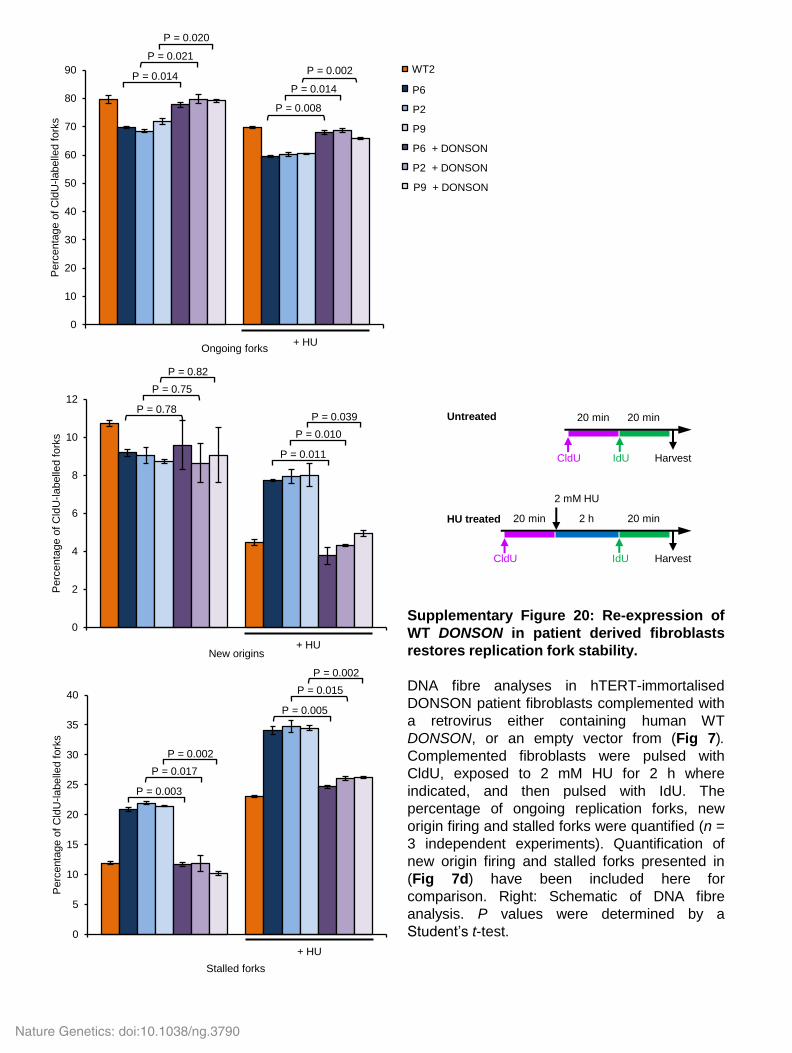
Supplementary Figure 20: Re-expression of
WT DONSON in patient derived fibroblasts
restores replication fork stability.
DNA fibre analyses in hTERT-immortalised
DONSON patient fibroblasts complemented with
a retrovirus either containing human WT
DONSON, or an empty vector from (Fig 7).
Complemented fibroblasts were pulsed with
CldU, exposed to 2 mM HU for 2 h where
indicated, and then pulsed with IdU. The
percentage of ongoing replication forks, new
origin firing and stalled forks were quantified (n =
3 independent experiments). Quantification of
new origin firing and stalled forks presented in
(Fig 7d) have been included here for
comparison. Right: Schematic of DNA fibre
analysis. P values were determined by a
’ t-test.
New origins
Stalled forks
20 min 20 min
CldU IdU Harvest
Untreated
HU treated 20 min 20 min
Harvest
2 mM HU
2 h
CldU IdU
0
10
20
30
40
50
60
70
80
90
Perc
enta
ge
of C
ldU
-la
belle
d fork
s
WT2
AJ602
AJ1795
AJ1796
AJ602 + Donson
AJ1795 + Donson
AJ1796 + Donson
WT2 + HU
AJ602 + HU
AJ1795 + HU
AJ1796 + HU
AJ602 + HU + Donson
AJ1795 + HU + Donson
AJ1796 + HU + Donson
WT2
P6
P2
P9
P6 + DONSON
P2 + DONSON
P9 + DONSON
Ongoing forks
P = 0.014
P = 0.021
P = 0.020
P = 0.008
P = 0.014
P = 0.002
P = 0.78
P = 0.75
P = 0.82
P = 0.011
P = 0.010
P = 0.039
P = 0.003
P = 0.017
P = 0.002
P = 0.005
P = 0.015
P = 0.002
+ HU
+ HU
+ HU
Nature Genetics: doi:10.1038/ng.3790

0
5
10
15
20
25
30
35
40
Perc
enta
ge o
f C
ldU
la
belle
d f
ork
s
+ATRi
0
10
20
30
40
50
60
70
80
90
AJ1795
AJ1795 + Donson
AJ1795 + HU
AJ1795 + Donson + HU
AJ1795 + ATRi
AJ1795 + Donson + ATRi
AJ1795 + HU + ATRi
AJ1795 + Donson + HU + ATRi
+ATRi
Perc
enta
ge o
f C
ldU
la
belle
d f
ork
s
P2
P2 + DONSON
P2
P2 + DONSON
P2
P2 + DONSON
P2 + DONSON
P2
0
2
4
6
8
10
12
Perc
enta
ge o
f C
ldU
la
belle
d f
ork
s
+ATRi
+ATRi
+HU
+HU
20 min 20 min
CldU IdU Harvest
Untreated
HU treated 20 min 20 min
Harvest
2 mM HU
2 h
CldU IdU
HU + ATRi 20 min 20 min
Harvest
2 mM HU + 5 µM ATRi
2 h
CldU IdU
20 min 20 min
CldU IdU Harvest
+ ATRi
5 µM ATRi
Supplementary Figure 21: The replication
abnormalities exhibited by DONSON mutant patient
cells are epistatic with ATR inhibition.
Replication fork analysis of fibroblasts derived from
DONSON patient P2 expressing either empty vector or
WT DONSON in the presence or absence of HU and/or
ATRi. Cells were pulsed with CldU, exposed to 2 mM
HU, +/- 5μ ATR inhibitor for 2 h, and then pulsed with
IdU. DNA fibres were quantified, and the percentage of
ongoing forks, new origin firing and stalled forks are
displayed (n = 2 independent experiments). Right:
Schematic of DNA fibre analysis. P values were
determined by a ’ t-test.
New origins
Stalled forks
Ongoing forks
P = 0.004
P = 0.034
P = 0.88
P = 0.22
P = 0.99
P = 0.029 P = 0.21
P = 0.45
P = 0.001
P = 0.002
P = 0.42
P = 0.006
Nature Genetics: doi:10.1038/ng.3790

Supplementary Figure 22: Model depicting how DONSON mutations may lead to genome instability
and microcephaly.
DONSON is a component of the replisome, a very large macromolecular complex of over two hundred
proteins, including key replication machinery, the CMG complex (CDC45, MCM2-7 and GINS), PCNA, and
the replicative polymerases (Pol). (a) Upon replication stress (red diamond) and replication fork stalling, the
presence of functional DONSON ensures maintenance of fork stability. The ATR-dependent replication
stress response also contributes to ensuring replication fork stability, and promotes activation of the intra-S
and G2/M phase checkpoints, preventing transmission of DNA damage through to mitosis, and ensuring
genome stability. (b) In the absence of functional DONSON, stalled replication forks are cleaved by
structure-specific nucleases, such as MUS81 and XPF, leading to the generation of DSBs in S-phase.
Impaired S-phase and G2/M checkpoint function in the absence of DONSON facilitates the transit of DNA
damage into subsequent phases of the cell cycle, resulting in elevated mitotic chromosome breaks that will
increase cell death. In patients with mutations in DONSON, such increased cell death would lead to reduced
numbers of cells being generated during development, resulting in the microcephaly and growth failure
observed.
Nature Genetics: doi:10.1038/ng.3790

Supplementary Table 2. Common ancestral haplotype (blue) flanking the DONSON locus in families P1, P2, P3 and P6.
SNP positionb gene coding Ref Alt P1-1 P1-2 P2 P3 P6 MAFc
rs121913215 34804930 IFNGR2 intronic A T AT AT AT AT AA 0.0010
rs75398504 34839530 TMEM50B intronic G A GA GA GA GA GG 0.0006
rs144266803 34861444 DNAJC28 T86I G A GA GA GA GA GA 0.0010
rs148155071 34876289 GART 3ʹUTR A T AT AT AT AT AT 0.0026
rs151206034 34889888 GART M577T A G AG AG AG AG AG 0.0010
rs139633075 34897281 GART L365V G C GC GC GC GC GC 0.0010
rs187476997 34902228 GART intronic T C TC TC TC TC TC 0.0016
rs142038738 34903861 GART E177D C A CA CA CA CA CA 0.0009
rs148794591 34924549 SON A1004A T C TC TC TC TC TC 0.0010
rs142751481 34925936 SON I1467V A G AG AG AG AG AG 0.0010
rs146664036 34951753 DONSON K489T T G TG TG TG TG TG 0.0010
rs192585552 34956005 DONSON c.786-33 T C TC TC TC TC TC 0.0005
no rsIDa 34960866 DONSON S28R T G TG TG TG TG TG -
rs190141427 34967690 CRYZL1 3ʹUTR T G TG TG TG TG TG 0.0006
rs184229251 34989145 CRYZL1 intronic T C TC TC TC TC TC 0.0006
rs570210988 36261887 RUNX1 intronic C C CC CC CT CC CC 0.0002
Analysis of rare variants identified through exome sequencing demonstrated a common ancestral haplotype extending 127.7 kb in DONSON patients heterozygous for the ‘haplotype’ disease allele. Parents of P2 and P3 were also exome sequenced, allowing phasing of alleles across this haplotype. No other variants were identified in trans in the genes within this region in any individuals apart from DONSON – the in trans variants in DONSON are omitted here for clarity. aThis variant lies within a GC rich region and therefore is not covered in many control population datasets. bGenomic position using hg19 coordinates. cMinor allele frequencies taken from ExAC or 1000 Genomes data.
Nature Genetics: doi:10.1038/ng.3790

Supplementary Note:
Fluorescence Cross-Correlation Spectroscopy (FCCS)
Fluorescence imaging and fluorescence (cross)-correlation
spectroscopy (FCCS) measurements were performed on a uniquely modified
confocal laser scanning microscopy system, the ConfoCor3 (Carl Zeiss, Jena,
Germany), consisting of the Zeiss LSM780 inverted setup and comprising
Diode 405 nm, Ar multiline 458, 488 and 514 nm, DPSS 561 nm and HeNe
633 nm lasers. It enables detection using silicon Avalanche Photo Detectors
(APDs) (SPCM-AQR-1X; PerkinElmer, USA) for imaging and FCS. Images
were recorded at a 1024X1024 pixel resolution. The C-Apochromat 40x/1.2 W
UV-VIS-IR objective was used throughout. Fluorescence intensity fluctuations
were recorded in arrays of 10 consecutive measurements, each measurement
lasting 10 s. Averaged curves were analyzed using the ZEN software for
online data analysis or exported and fitted offline. In either case, the nonlinear
least square fitting of the autocorrelation curve was performed using the
Levenberg–Marquardt algorithm. Quality of the fitting was evaluated by visual
inspection and by residuals analysis. Control FCS measurements to assess
the detection volume were routinely performed prior to data acquisition, using
dilute solutions (10 𝑛𝑀 ) of Alexa488 and CFTM568 dyes. Highly purified
double-stranded DNA, in which each strand carries one fluorophore of
Alexa488 and Atto565, was used as a cross-correlation standard. 85% cross-
correlation was measured using the FCCS standard, whereas 13% cross-
correlation (due to cross-talk) was measured with the two dyes in solution
(data not shown). The variation between independent measurements reflects
variations between cells, rather than imprecision of FCS measurements.
Nature Genetics: doi:10.1038/ng.3790

FCS/FCCS measurements of GFP-DONSON/RFP-PCNA and GFP/RFP-
PCNA expressing cells
HeLa cells stably expressing GFP-DONSON and mCherry-PCNA (construct
kindly provided by C. Lukas, Copenhagen; referred to as RFP-PCNA) were
grown under standard conditions overnight on chambered coverslips (μ-slide,
8 well, Ibidi) and the growth medium was replaced by L-15 medium (Leibovitz)
(Sigma) immediately prior to FCS/FCCS measurements. Cells expressing low
levels of RFP-PCNA/GFP-DONSON or RFP-PCNA/GFP were used for
FCS/FCCS measurements. Measurements were made in weakly expressing
cells only. As the concentration of RFP-PCNA in replication foci was observed
to be several-fold higher than that of DONSON-GFP and GFP, only cells with
similar GFP/RFP ratios were used for cross-correlation analysis and
comparable GFP-DONSON and GFP only concentrations used for
comparison.
Background on Fluorescence Microscopy Imaging and FCS
As described above, an individually modified instrument (Zeiss, LSM780,
ConfoCor 3) with fully integrated FCS/CLSM optical pathways was used for
imaging. The detection efficiency of CLSM imaging was significantly improved
by the introduction of APD detectors. As compared to PMTs, which are
normally used as detectors in conventional CLSM, the APDs are
characterized by higher quantum yield and collection efficiency – about 70 %
in APDs as compared to 15 – 25 % in PMTs, higher gain, negligible dark
Nature Genetics: doi:10.1038/ng.3790

current and better efficiency in the red part of the spectrum. Enhanced
fluorescence detection efficiency enabled image collection using fast scanning
(1 − 5 µ𝑠/𝑝𝑖𝑥𝑒𝑙). This enhances further the signal-to-noise-ratio by avoiding
fluorescence loss due to triplet state formation, enabling fluorescence imaging
with single-molecule sensitivity. In addition, low laser intensities
(150– 750 µ𝑊) could be applied for imaging, significantly reducing the photo-
toxicity.
FCS/FCCS measurements are performed by recording fluorescence
intensity fluctuations in a very small observation volume element (OVE) of a
prolate ellipsoid shape (about 200𝑛𝑚 wide and about 1µ𝑚 long) that is placed
in GFP-DONSON/RFP-PCNA or control GFP/RFP-PCNA HeLa cells by
focusing the laser light through the microscope objective and by collecting the
fluorescence light through the same objective using a pinhole in front of the
detector to block out-of-focus light. Boxed areas of 0.7𝜇𝑚2 in Fig. 4e indicate
z-projections of larger representative regions in which the Observation
Volume Element (OVE) of:
𝑉𝑂𝑉𝐸 = 𝜋32 ∙ 𝑤𝑥𝑦
2 ∙ 𝑧0 = 5.57 ∙ 0.1847𝟐 ∙ 1 = 0.223 ∙ 10−18 𝑚3 = 0.19 ∙ 10−15𝐿
was placed for FCCS measurements. We established that observed
fluorescence intensity fluctuations are caused by fluorescently labeled GFP-
DONSON or RFP-PCNA molecules passing through the OVE and that the
characteristic decay times of the autocorrelation functions do not depend on
the concentration of GFP-DONSON or RFP-PCNA (Supplementary Fig. 13).
Therefore, we analyzed the diffusion of the two proteins in the nucleus, using
temporal autocorrelation analysis.
Nature Genetics: doi:10.1038/ng.3790

In temporal autocorrelation analysis we first derive the autocorrelation
function G():
𝐺(𝜏) = 1 +⟨𝛿𝐼(𝑡)∙𝛿𝐼(𝑡+𝜏)⟩
⟨𝛪(𝑡)⟩2 ,
where 𝛿𝐼(𝑡) = 𝐼(𝑡)– ⟨𝛪(𝑡)⟩ is the deviation from the mean intensity at time t
and 𝛿𝐼(𝑡 + 𝜏) = 𝐼(𝑡 + 𝜏)– ⟨𝛪(𝑡)⟩ is the deviation from the mean intensity at
time 𝑡 + 𝜏. For further analysis, an autocorrelation curve (ACC) is derived by
plotting 𝐺(𝜏) as a function of the lag time, i.e. the autocorrelation time .
To derive information about molecular numbers and their
corresponding diffusion time, the experimentally obtained ACCs are
compared to autocorrelation functions derived for different model systems. A
model describing free three-dimensional diffusion of two components was
used for fitting Cross-Correlation Curves (CCCs) in this study, whereas a two-
component model with triplet correction was used for fitting ACCs:
𝐺(𝜏) = 1 +1
𝑁
(
1−𝑦
(1+𝜏
𝜏𝐷1)∙√1+
𝑤𝑥𝑦2 𝜏
𝑤𝑧2𝜏𝐷1
+𝑦
(1+𝜏
𝜏𝐷2)∙√1+
𝑤𝑥𝑦2 𝜏
𝑤𝑧2𝜏𝐷2)
Te
T
T
11
In the above equation, N is the average number of molecules in the
OVE; y is the fraction of the slowly moving GFP-DONSON and RFP-PCNA
molecules; 𝜏𝐷1 is the diffusion time of the free GFP-DONSON and RFP-PCNA
molecules; 𝜏𝐷2 is the diffusion time of GFP-DONSON and RFP-PCNA
molecules undergoing interactions; 𝑤𝑥𝑦 and 𝑤𝑧 are radial and axial
parameters, respectively, related to spatial properties of the OVE; T is the
average equilibrium fraction of molecules in the triplet state; and T the triplet
correlation time related to rate constants for intersystem crossing and the
Nature Genetics: doi:10.1038/ng.3790

triplet decay. Spatial properties of the detection volume, represented by the
square of the ratio of the axial and radial parameters ((𝑤𝑧
𝑤𝑥𝑦)2
), are determined
in calibration measurements performed using a 10 𝑛𝑀 solution of Alexa488
and CFTM568 for which the diffusion coefficient (D) is known. The diffusion
time, 𝜏𝐷, measured by FCS, is related to the translation diffusion coefficient D
by:
𝜏𝐷 =𝑤𝑥𝑦2
4𝐷.
Nature Genetics: doi:10.1038/ng.3790