mutants showed early senescence, a-c c d - Nature Supplementary Figure 1. Individually covered...
21
1 Supplementary Figure 1. Individually covered leaves of phyB mutants showed early senescence, while those of PHYB-OX plants stayed green. (a-c) Fourth or 5th rosette leaves of 3-week-old WT, phyB, and PHYB-OX plants grown in long days were covered with aluminum foil for 7 d (7 DDI). Visible phenotypes (a), total Chl levels (b), and ion leakage rates (c) before (0 DDI) and after 7 DDI were examined. Individually covered leaves are indicated by red arrowheads. (d) SEN4, SAG12, and Lhcb1 expression is regulated by phyB in light-deprived conditions. By qRT-PCR, relative expression levels of SEN4, SAG12 and Lhcb1 were determined by normalizing to the transcript levels of GAPDH. Data are means ± SD of at least 4 independent biological replicates. *P < 0.05, **P < 0.01 (Student’s t-test). DDI indicates day(s) of dark incubation.
Transcript of mutants showed early senescence, a-c c d - Nature Supplementary Figure 1. Individually covered...

1
Supplementary Figure 1. Individually covered leaves of phyB mutants showed early senescence,
while those of PHYB-OX plants stayed green. (a-c) Fourth or 5th rosette leaves of 3-week-old WT,
phyB, and PHYB-OX plants grown in long days were covered with aluminum foil for 7 d (7 DDI). Visible
phenotypes (a), total Chl levels (b), and ion leakage rates (c) before (0 DDI) and after 7 DDI were
examined. Individually covered leaves are indicated by red arrowheads. (d) SEN4, SAG12, and Lhcb1
expression is regulated by phyB in light-deprived conditions. By qRT-PCR, relative expression levels of
SEN4, SAG12 and Lhcb1 were determined by normalizing to the transcript levels of GAPDH. Data are
means ± SD of at least 4 independent biological replicates. *P < 0.05, **P < 0.01 (Student’s t-test). DDI
indicates day(s) of dark incubation.
2
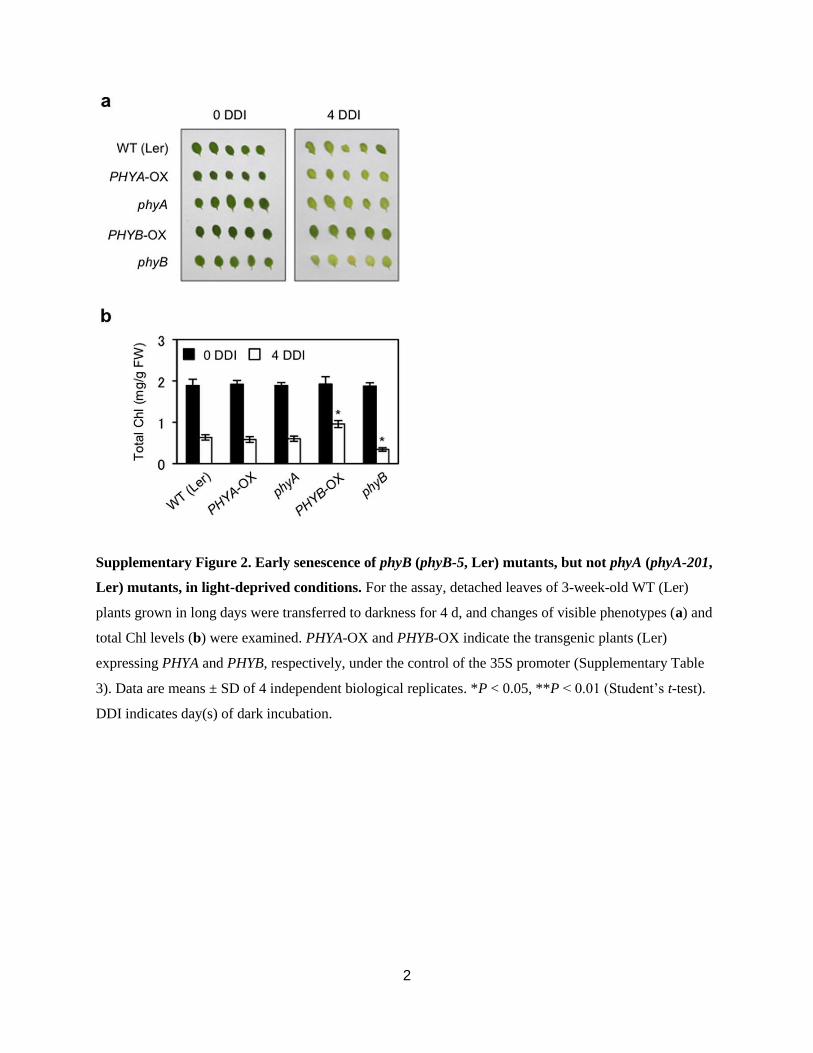
Supplementary Figure 2. Early senescence of phyB (phyB-5, Ler) mutants, but not phyA (phyA-201,
Ler) mutants, in light-deprived conditions. For the assay, detached leaves of 3-week-old WT (Ler)
plants grown in long days were transferred to darkness for 4 d, and changes of visible phenotypes (a) and
total Chl levels (b) were examined. PHYA-OX and PHYB-OX indicate the transgenic plants (Ler)
expressing PHYA and PHYB, respectively, under the control of the 35S promoter (Supplementary Table
3). Data are means ± SD of 4 independent biological replicates. *P < 0.05, **P < 0.01 (Student’s t-test).
DDI indicates day(s) of dark incubation.
3
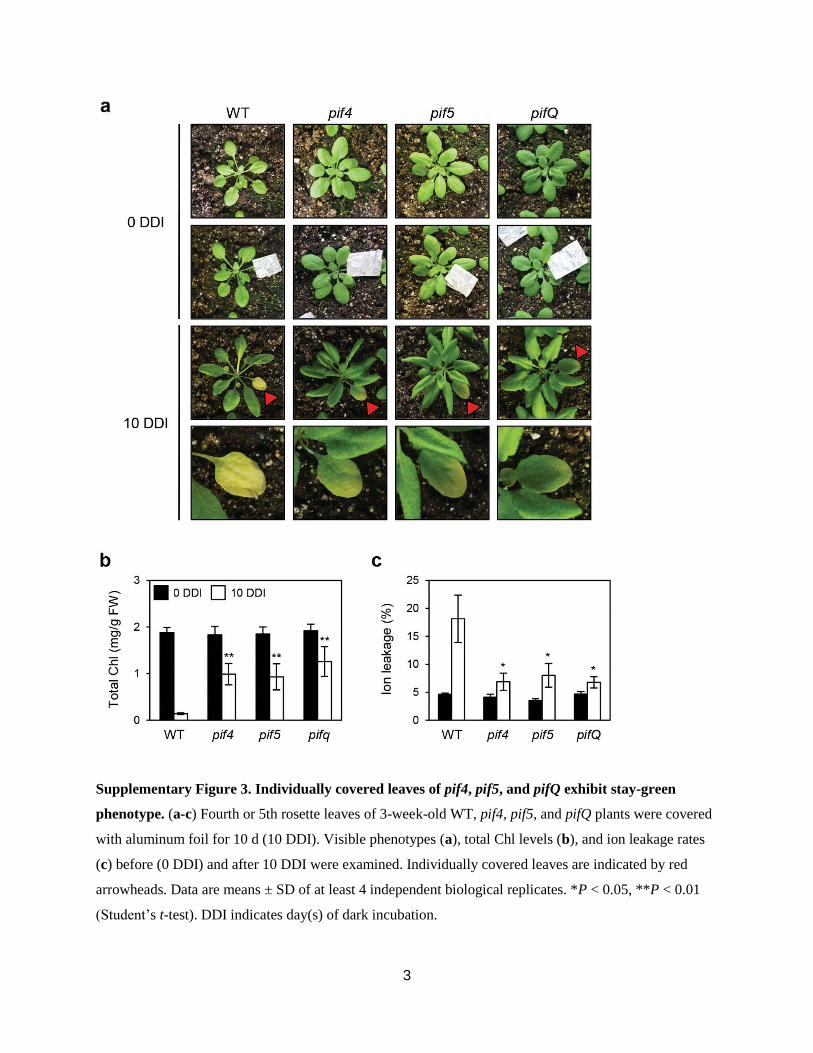
Supplementary Figure 3. Individually covered leaves of pif4, pif5, and pifQ exhibit stay-green
phenotype. (a-c) Fourth or 5th rosette leaves of 3-week-old WT, pif4, pif5, and pifQ plants were covered
with aluminum foil for 10 d (10 DDI). Visible phenotypes (a), total Chl levels (b), and ion leakage rates
(c) before (0 DDI) and after 10 DDI were examined. Individually covered leaves are indicated by red
arrowheads. Data are means ± SD of at least 4 independent biological replicates. *P < 0.05, **P < 0.01
(Student’s t-test). DDI indicates day(s) of dark incubation.
4
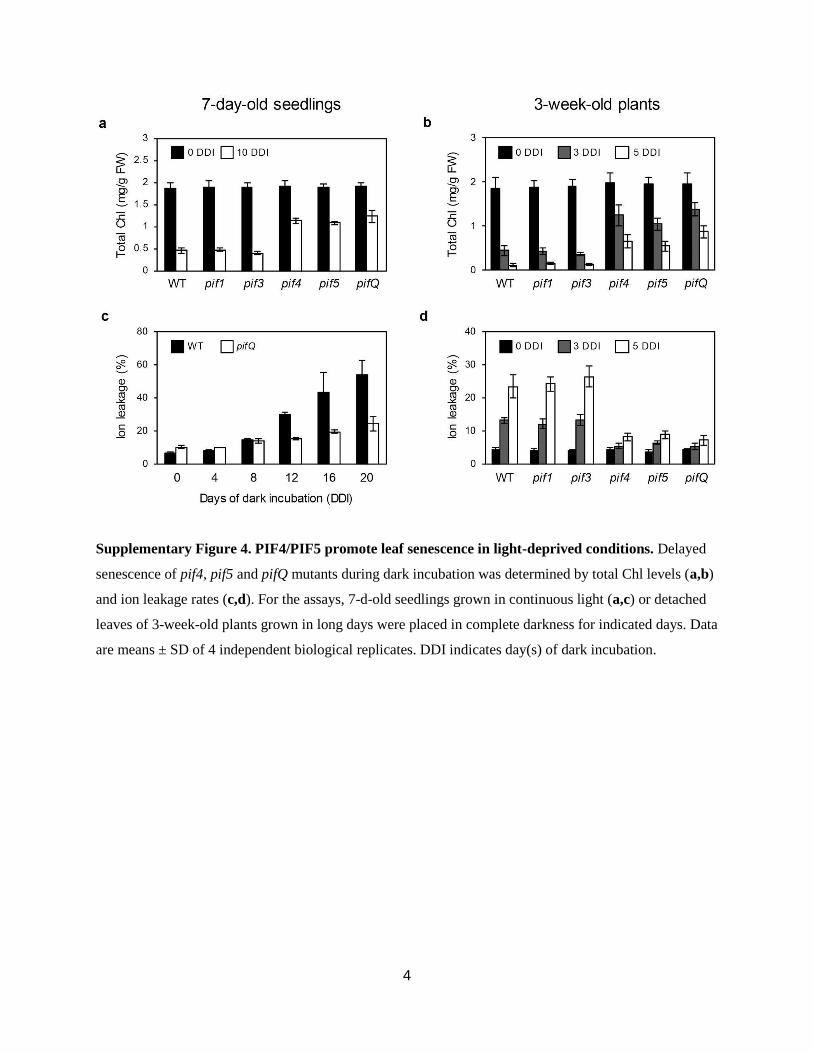
Supplementary Figure 4. PIF4/PIF5 promote leaf senescence in light-deprived conditions. Delayed
senescence of pif4, pif5 and pifQ mutants during dark incubation was determined by total Chl levels (a,b)
and ion leakage rates (c,d). For the assays, 7-d-old seedlings grown in continuous light (a,c) or detached
leaves of 3-week-old plants grown in long days were placed in complete darkness for indicated days. Data
are means ± SD of 4 independent biological replicates. DDI indicates day(s) of dark incubation.

5
Supplementary Figure 5. SEN4 and Lhcb1 are regulated by ELF3, PIF4, and PIF5 in light-deprived
conditions. Gene expression analysis of SEN4 and Lhcb1 in light-grown 7-d-old seedlings of WT (Col),
elf3 (elf3-8), ELF3-OX, pifQ, and PIF4-OX at 0 DDI (white bars), 2 DDI (grey bars), and 4 DDI (white
bars). By qRT-PCR, relative expression levels of SEN4 and Lhcb1 were determined by normalizing to the
transcript levels of GAPDH. Data are means ± SD of at least 4 independent biological replicates. *P <
0.05, **P < 0.01 (Student’s t-test).
6
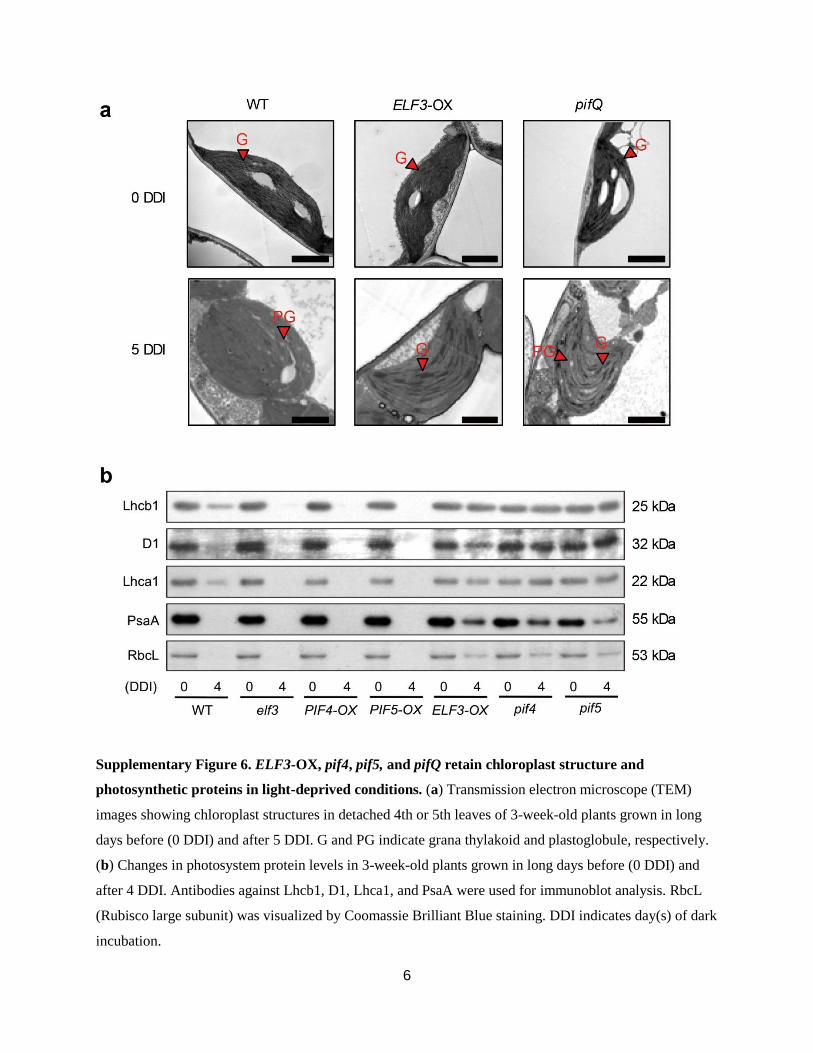
Supplementary Figure 6. ELF3-OX, pif4, pif5, and pifQ retain chloroplast structure and
photosynthetic proteins in light-deprived conditions. (a) Transmission electron microscope (TEM)
images showing chloroplast structures in detached 4th or 5th leaves of 3-week-old plants grown in long
days before (0 DDI) and after 5 DDI. G and PG indicate grana thylakoid and plastoglobule, respectively.
(b) Changes in photosystem protein levels in 3-week-old plants grown in long days before (0 DDI) and
after 4 DDI. Antibodies against Lhcb1, D1, Lhca1, and PsaA were used for immunoblot analysis. RbcL
(Rubisco large subunit) was visualized by Coomassie Brilliant Blue staining. DDI indicates day(s) of dark
incubation.
7
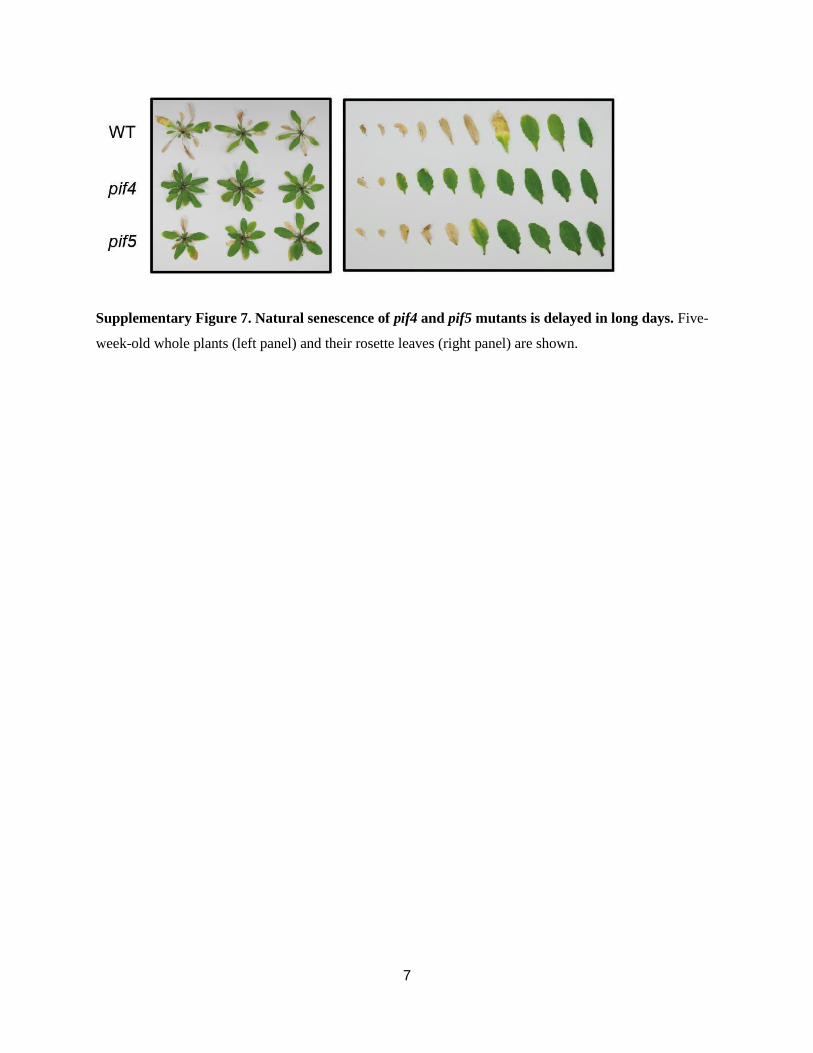
Supplementary Figure 7. Natural senescence of pif4 and pif5 mutants is delayed in long days. Five-
week-old whole plants (left panel) and their rosette leaves (right panel) are shown.

8
9
Supplementary Figure 8. ELF3 suppresses senescence in light-deprived conditions. (a) Early
senescence of three different elf3 alleles as shown by leaf yellowing and reduced total chlorophyll (Chl)
levels. Mutant alleles are listed in Supplementary Table 3. (b) Normal senescence phenotypes of circadian
rhythm- and flowering time-related mutants in light-deprived conditions. (c) Normal senescence
phenotypes of cry1, cry2, and cry1 cry2 mutants in light-deprived conditions. For these assays (a-c),
detached 4th or 5th leaves of 3-week-old plants grown in long days were incubated in darkness for 3 d
before total Chl measurement. Data are means ± SD of more than 4 independent biological replicates.
DDI indicates day(s) of dark incubation. *P < 0.05, **P < 0.01 (Student’s t-test).
10
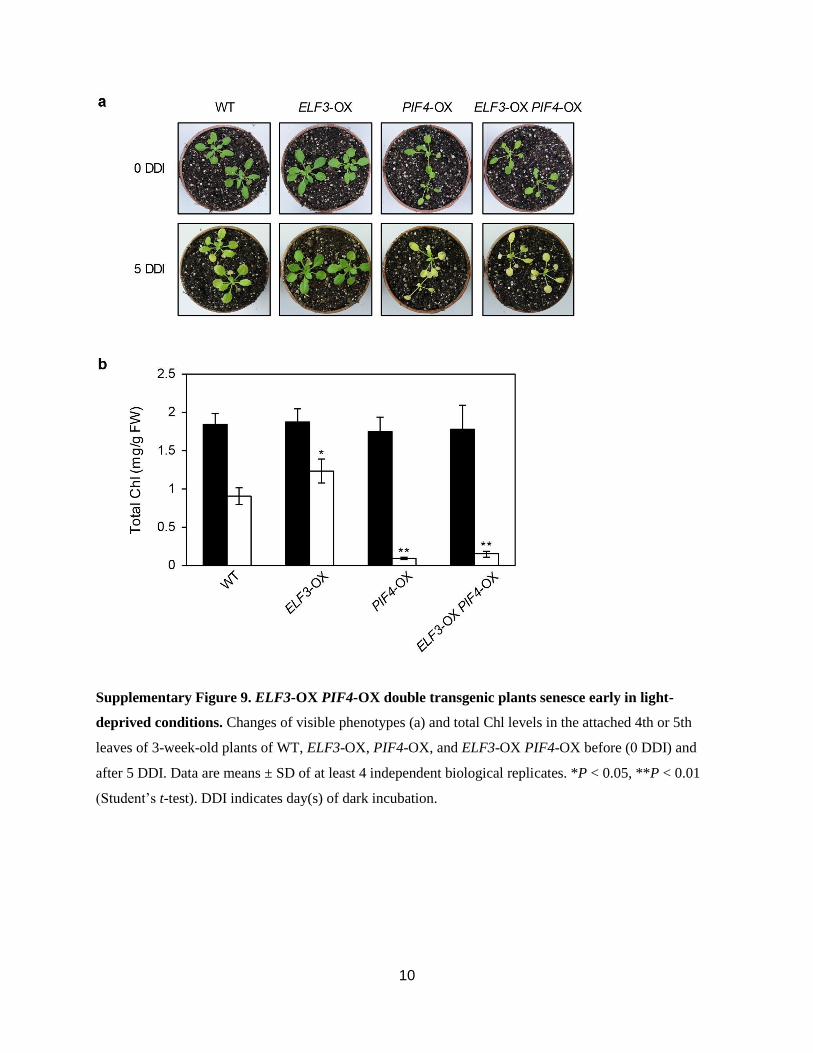
Supplementary Figure 9. ELF3-OX PIF4-OX double transgenic plants senesce early in light-
deprived conditions. Changes of visible phenotypes (a) and total Chl levels in the attached 4th or 5th
leaves of 3-week-old plants of WT, ELF3-OX, PIF4-OX, and ELF3-OX PIF4-OX before (0 DDI) and
after 5 DDI. Data are means ± SD of at least 4 independent biological replicates. *P < 0.05, **P < 0.01
(Student’s t-test). DDI indicates day(s) of dark incubation.
11
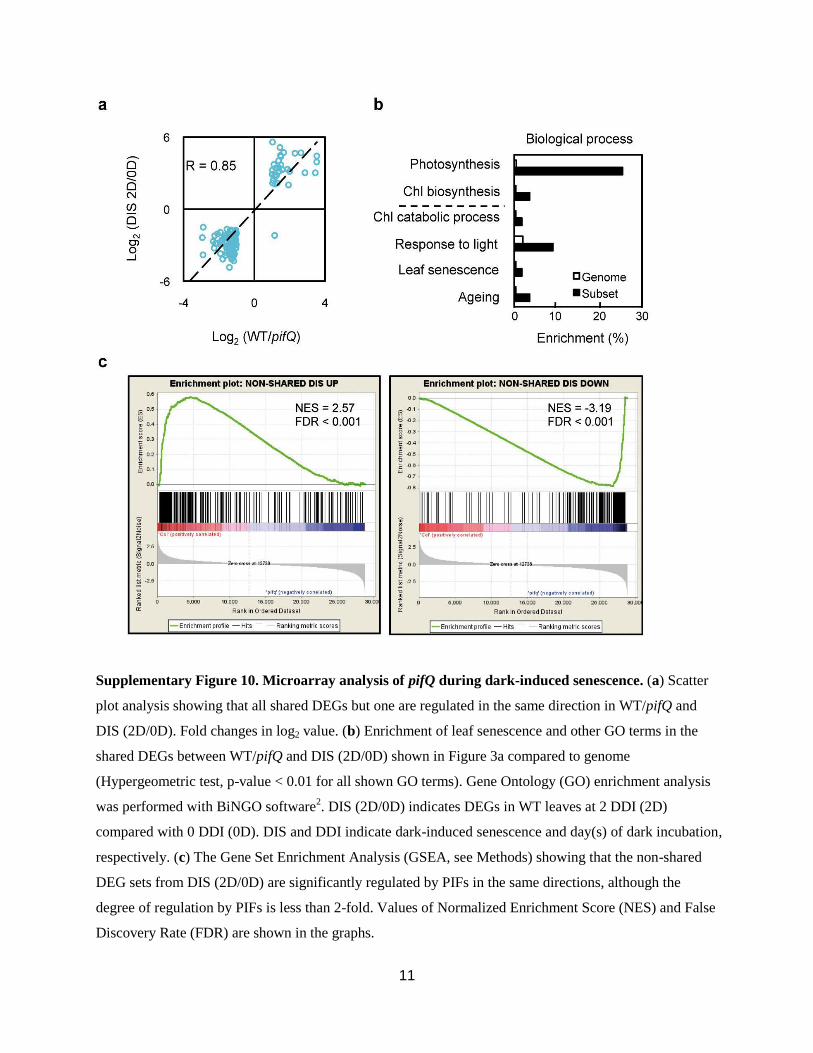
Supplementary Figure 10. Microarray analysis of pifQ during dark-induced senescence. (a) Scatter
plot analysis showing that all shared DEGs but one are regulated in the same direction in WT/pifQ and
DIS (2D/0D). Fold changes in log2 value. (b) Enrichment of leaf senescence and other GO terms in the
shared DEGs between WT/pifQ and DIS (2D/0D) shown in Figure 3a compared to genome
(Hypergeometric test, p-value < 0.01 for all shown GO terms). Gene Ontology (GO) enrichment analysis
was performed with BiNGO software2. DIS (2D/0D) indicates DEGs in WT leaves at 2 DDI (2D)
compared with 0 DDI (0D). DIS and DDI indicate dark-induced senescence and day(s) of dark incubation,
respectively. (c) The Gene Set Enrichment Analysis (GSEA, see Methods) showing that the non-shared
DEG sets from DIS (2D/0D) are significantly regulated by PIFs in the same directions, although the
degree of regulation by PIFs is less than 2-fold. Values of Normalized Enrichment Score (NES) and False
Discovery Rate (FDR) are shown in the graphs.
12
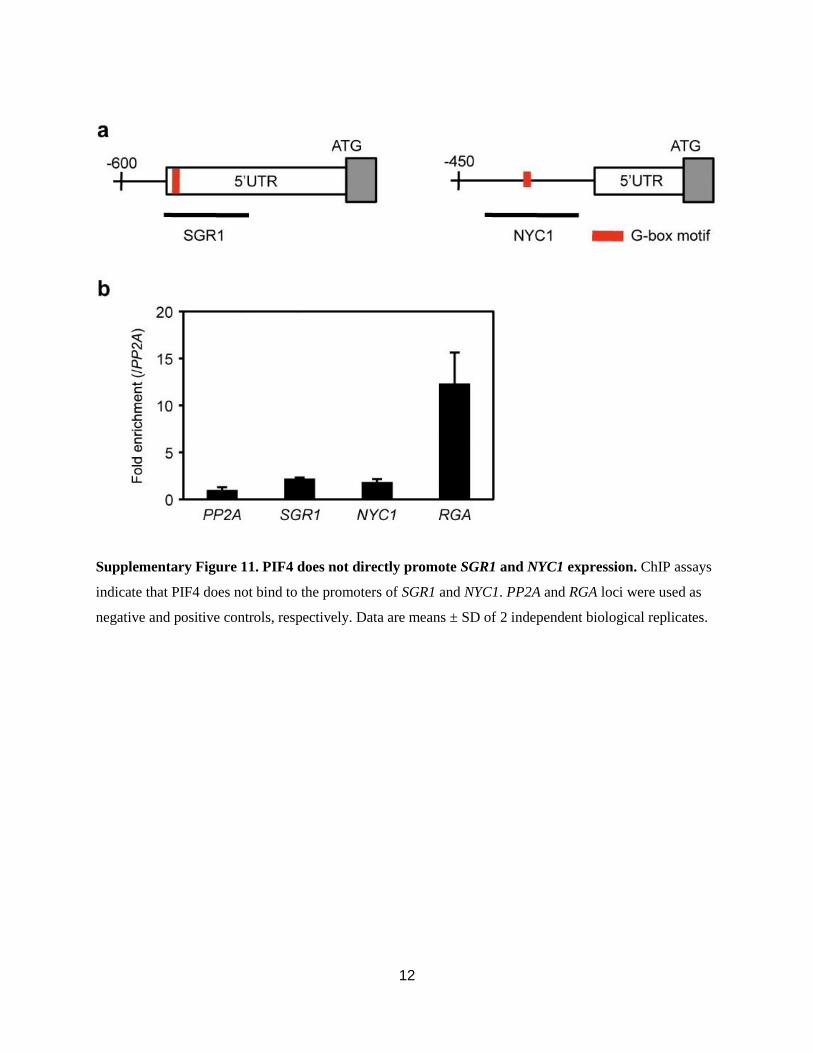
Supplementary Figure 11. PIF4 does not directly promote SGR1 and NYC1 expression. ChIP assays
indicate that PIF4 does not bind to the promoters of SGR1 and NYC1. PP2A and RGA loci were used as
negative and positive controls, respectively. Data are means ± SD of 2 independent biological replicates.
13
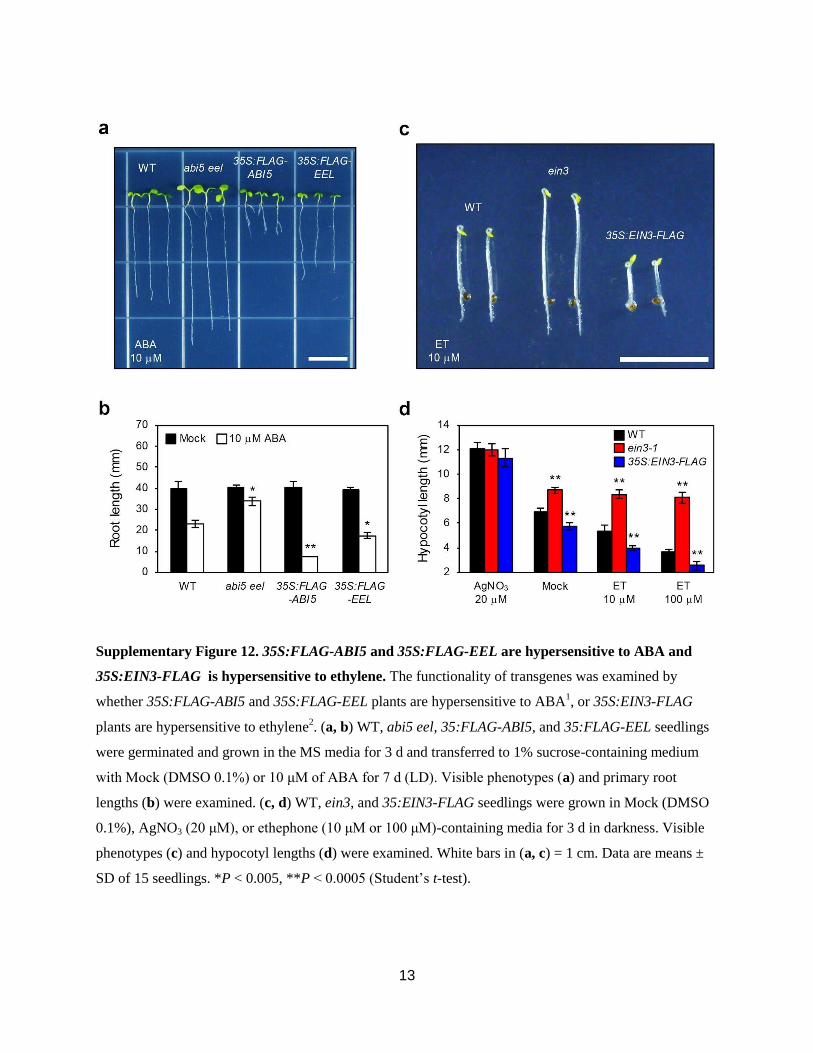
Supplementary Figure 12. 35S:FLAG-ABI5 and 35S:FLAG-EEL are hypersensitive to ABA and
35S:EIN3-FLAG is hypersensitive to ethylene. The functionality of transgenes was examined by
whether 35S:FLAG-ABI5 and 35S:FLAG-EEL plants are hypersensitive to ABA1, or 35S:EIN3-FLAG
plants are hypersensitive to ethylene2. (a, b) WT, abi5 eel, 35:FLAG-ABI5, and 35:FLAG-EEL seedlings
were germinated and grown in the MS media for 3 d and transferred to 1% sucrose-containing medium
with Mock (DMSO 0.1%) or 10 μM of ABA for 7 d (LD). Visible phenotypes (a) and primary root
lengths (b) were examined. (c, d) WT, ein3, and 35:EIN3-FLAG seedlings were grown in Mock (DMSO
0.1%), AgNO3 (20 μM), or ethephone (10 μM or 100 μM)-containing media for 3 d in darkness. Visible
phenotypes (c) and hypocotyl lengths (d) were examined. White bars in (a, c) = 1 cm. Data are means ±
SD of 15 seedlings. *P < 0.005, **P < 0.0005 (Student’s t-test).
14
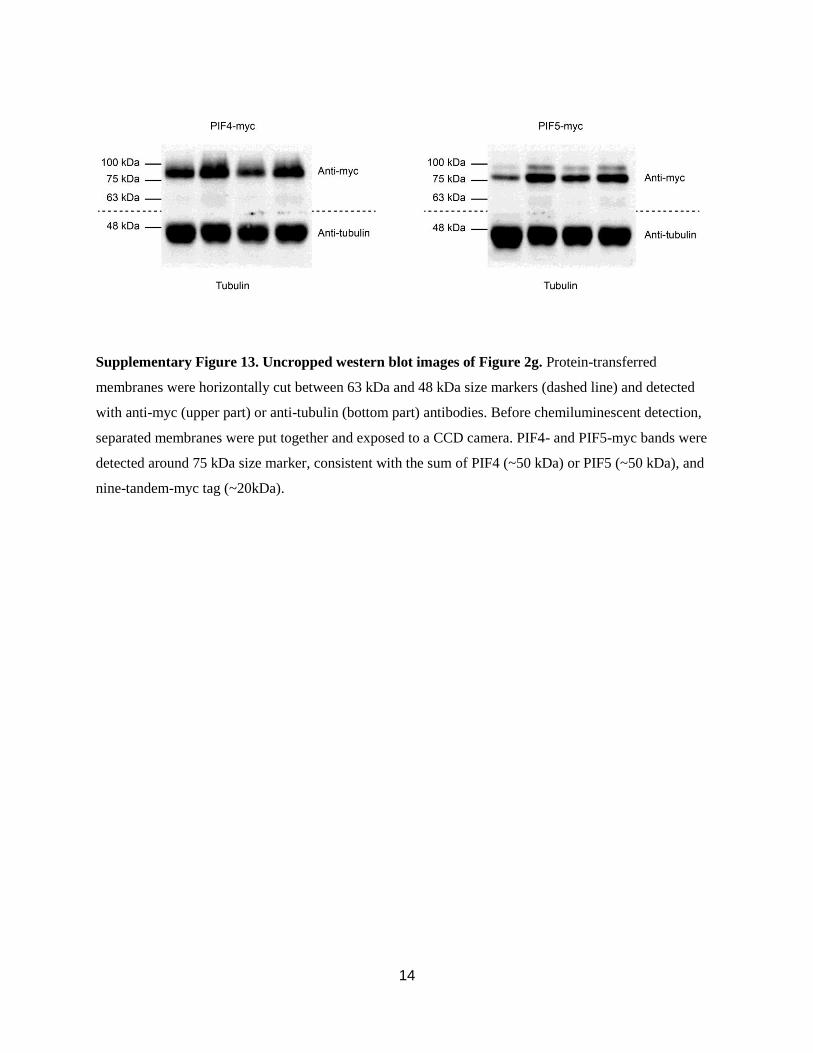
Supplementary Figure 13. Uncropped western blot images of Figure 2g. Protein-transferred
membranes were horizontally cut between 63 kDa and 48 kDa size markers (dashed line) and detected
with anti-myc (upper part) or anti-tubulin (bottom part) antibodies. Before chemiluminescent detection,
separated membranes were put together and exposed to a CCD camera. PIF4- and PIF5-myc bands were
detected around 75 kDa size marker, consistent with the sum of PIF4 (~50 kDa) or PIF5 (~50 kDa), and
nine-tandem-myc tag (~20kDa).
15
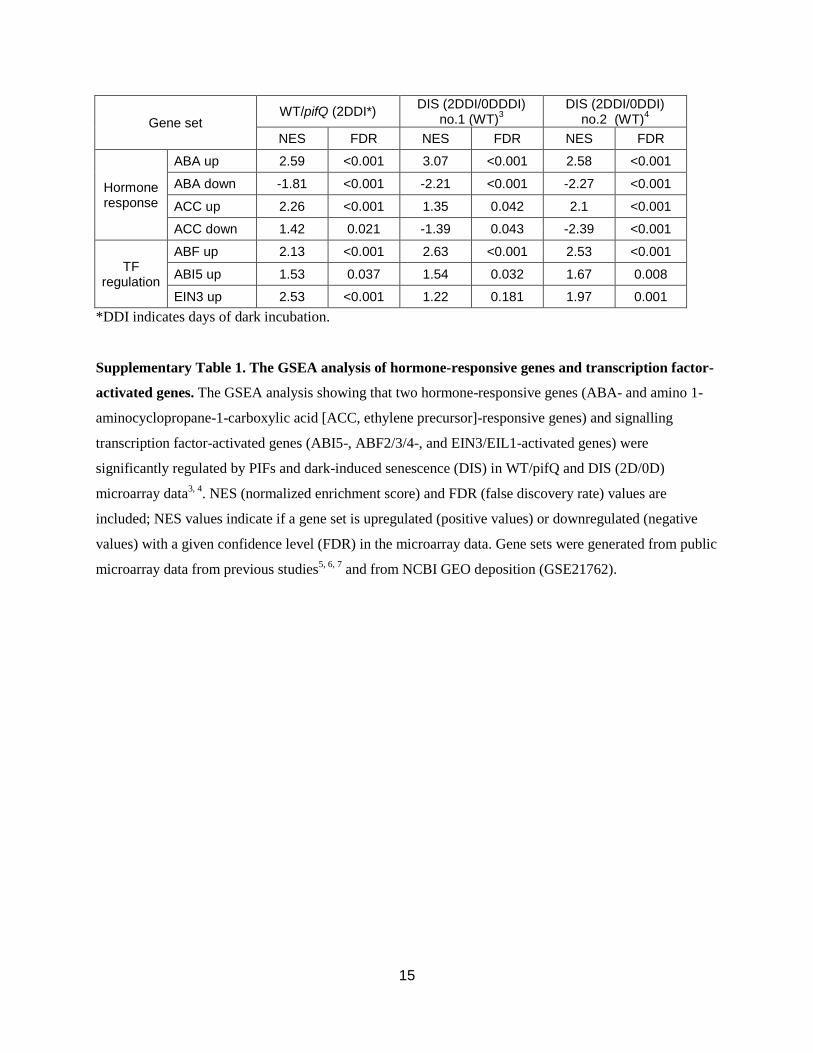
Gene set WT/pifQ (2DDI*)
DIS (2DDI/0DDDI) no.1 (WT)
3
DIS (2DDI/0DDI) no.2 (WT)
4
NES FDR NES FDR NES FDR
Hormone response
ABA up 2.59 <0.001 3.07 <0.001 2.58 <0.001
ABA down -1.81 <0.001 -2.21 <0.001 -2.27 <0.001
ACC up 2.26 <0.001 1.35 0.042 2.1 <0.001
ACC down 1.42 0.021 -1.39 0.043 -2.39 <0.001
TF regulation
ABF up 2.13 <0.001 2.63 <0.001 2.53 <0.001
ABI5 up 1.53 0.037 1.54 0.032 1.67 0.008
EIN3 up 2.53 <0.001 1.22 0.181 1.97 0.001
*DDI indicates days of dark incubation.
Supplementary Table 1. The GSEA analysis of hormone-responsive genes and transcription factor-
activated genes. The GSEA analysis showing that two hormone-responsive genes (ABA- and amino 1-
aminocyclopropane-1-carboxylic acid [ACC, ethylene precursor]-responsive genes) and signalling
transcription factor-activated genes (ABI5-, ABF2/3/4-, and EIN3/EIL1-activated genes) were
significantly regulated by PIFs and dark-induced senescence (DIS) in WT/pifQ and DIS (2D/0D)
microarray data3, 4
. NES (normalized enrichment score) and FDR (false discovery rate) values are
included; NES values indicate if a gene set is upregulated (positive values) or downregulated (negative
values) with a given confidence level (FDR) in the microarray data. Gene sets were generated from public
microarray data from previous studies5, 6, 7
and from NCBI GEO deposition (GSE21762).

16
AGI Gene name Function pifQ / WT FDR abf234* / WT FDR
AT3G44880 PAO Chlorophyll degradation -0.74 0.002 -0.6 0.003
AT4G13250 NYC1 Chlorophyll degradation -0.92 0.002 -0.3 0.014
AT4G22920 SGR1 Chlorophyll degradation -1.02 0.001 -0.73 0.001
AT5G13800 PPH Chlorophyll degradation -0.6 0.002 -0.4 0.042
AT1G69490 NAP NAC transcription factor -1.01 0.001 -0.92 0.003
AT5G39610 ORE1 NAC transcription factor -0.43 0.011 -0.78 0.009
AT2G36270 ABI5 ABA signaling -0.79 0.013 -0.23 0.029
AT5G59220 HAI1 ABA signaling -0.88 0.002 -1.76 <0.001
AT4G15530 PPDK Nitrogen remobilization -0.38 0.008 -0.32 0.03
AT1G73500 MKK9 MKK cascade signaling -0.3 0.038 -0.61 0.008
*abf234 refers to abf2 abf3 abf4 triple mutant.
Supplementary Table 2. List of senescence-promoting genes regulated by PIFs and ABFs in Figure
4a.
Fold changes in log2 value and false discovery rates (FDR) were from the microarray data of this paper
(pifQ / WT) and previous study (abf234 / WT)6.
17
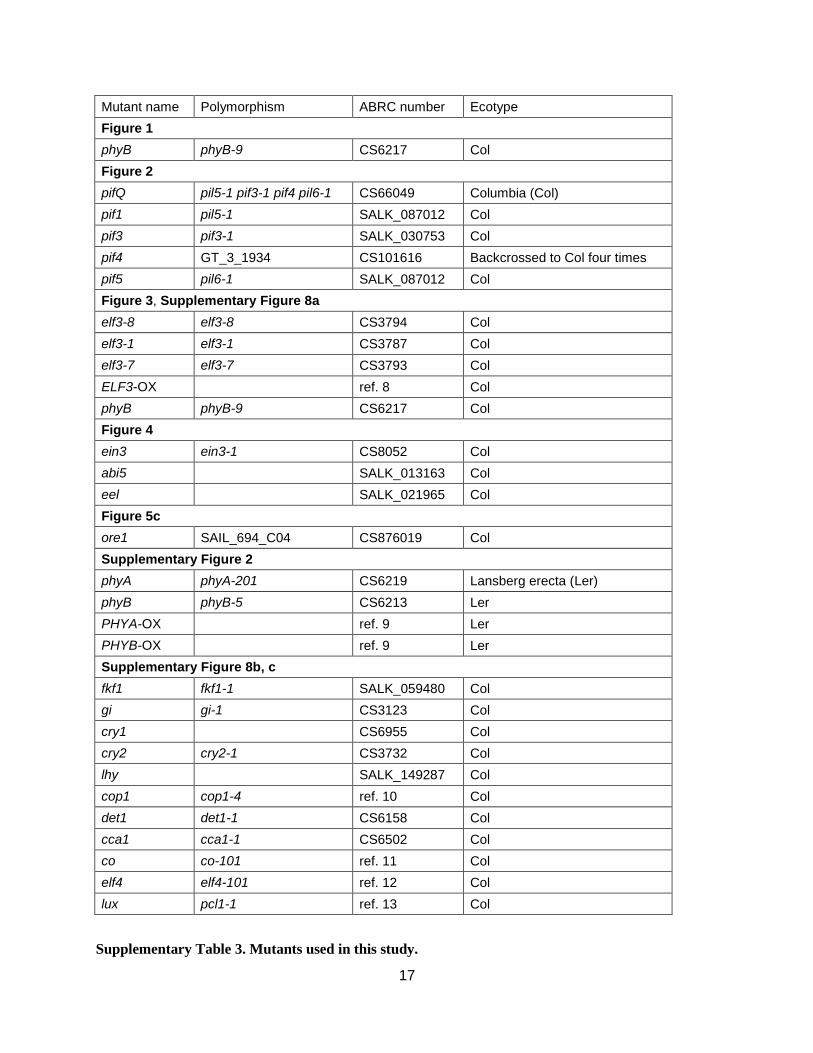
Mutant name Polymorphism ABRC number Ecotype
Figure 1
phyB phyB-9 CS6217 Col
Figure 2
pifQ pil5-1 pif3-1 pif4 pil6-1 CS66049 Columbia (Col)
pif1 pil5-1 SALK_087012 Col
pif3 pif3-1 SALK_030753 Col
pif4 GT_3_1934 CS101616 Backcrossed to Col four times
pif5 pil6-1 SALK_087012 Col
Figure 3, Supplementary Figure 8a
elf3-8 elf3-8 CS3794 Col
elf3-1 elf3-1 CS3787 Col
elf3-7 elf3-7 CS3793 Col
ELF3-OX ref. 8 Col
phyB phyB-9 CS6217 Col
Figure 4
ein3 ein3-1 CS8052 Col
abi5 SALK_013163 Col
eel SALK_021965 Col
Figure 5c
ore1 SAIL_694_C04 CS876019 Col
Supplementary Figure 2
phyA phyA-201 CS6219 Lansberg erecta (Ler)
phyB phyB-5 CS6213 Ler
PHYA-OX ref. 9 Ler
PHYB-OX ref. 9 Ler
Supplementary Figure 8b, c
fkf1 fkf1-1 SALK_059480 Col
gi gi-1 CS3123 Col
cry1 CS6955 Col
cry2 cry2-1 CS3732 Col
lhy
SALK_149287 Col
cop1 cop1-4 ref. 10 Col
det1 det1-1 CS6158 Col
cca1 cca1-1 CS6502 Col
co co-101 ref. 11 Col
elf4 elf4-101 ref. 12 Col
lux pcl1-1 ref. 13 Col
Supplementary Table 3. Mutants used in this study.
18
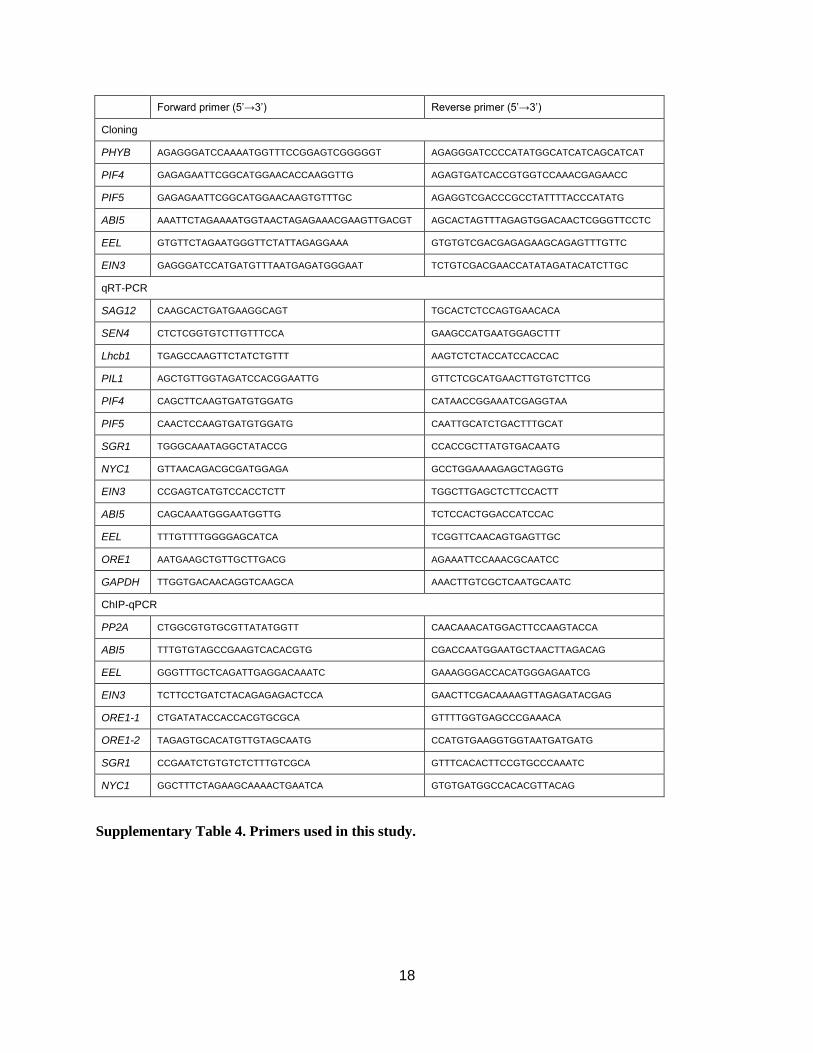
Forward primer (5’→3’) Reverse primer (5’→3’)
Cloning
PHYB AGAGGGATCCAAAATGGTTTCCGGAGTCGGGGGT AGAGGGATCCCCATATGGCATCATCAGCATCAT
PIF4 GAGAGAATTCGGCATGGAACACCAAGGTTG AGAGTGATCACCGTGGTCCAAACGAGAACC
PIF5 GAGAGAATTCGGCATGGAACAAGTGTTTGC AGAGGTCGACCCGCCTATTTTACCCATATG
ABI5 AAATTCTAGAAAATGGTAACTAGAGAAACGAAGTTGACGT AGCACTAGTTTAGAGTGGACAACTCGGGTTCCTC
EEL GTGTTCTAGAATGGGTTCTATTAGAGGAAA GTGTGTCGACGAGAGAAGCAGAGTTTGTTC
EIN3 GAGGGATCCATGATGTTTAATGAGATGGGAAT TCTGTCGACGAACCATATAGATACATCTTGC
qRT-PCR
SAG12 CAAGCACTGATGAAGGCAGT TGCACTCTCCAGTGAACACA
SEN4 CTCTCGGTGTCTTGTTTCCA GAAGCCATGAATGGAGCTTT
Lhcb1 TGAGCCAAGTTCTATCTGTTT AAGTCTCTACCATCCACCAC
PIL1 AGCTGTTGGTAGATCCACGGAATTG GTTCTCGCATGAACTTGTGTCTTCG
PIF4 CAGCTTCAAGTGATGTGGATG CATAACCGGAAATCGAGGTAA
PIF5 CAACTCCAAGTGATGTGGATG CAATTGCATCTGACTTTGCAT
SGR1 TGGGCAAATAGGCTATACCG CCACCGCTTATGTGACAATG
NYC1 GTTAACAGACGCGATGGAGA GCCTGGAAAAGAGCTAGGTG
EIN3 CCGAGTCATGTCCACCTCTT TGGCTTGAGCTCTTCCACTT
ABI5 CAGCAAATGGGAATGGTTG TCTCCACTGGACCATCCAC
EEL TTTGTTTTGGGGAGCATCA TCGGTTCAACAGTGAGTTGC
ORE1 AATGAAGCTGTTGCTTGACG AGAAATTCCAAACGCAATCC
GAPDH TTGGTGACAACAGGTCAAGCA AAACTTGTCGCTCAATGCAATC
ChIP-qPCR
PP2A CTGGCGTGTGCGTTATATGGTT CAACAAACATGGACTTCCAAGTACCA
ABI5 TTTGTGTAGCCGAAGTCACACGTG CGACCAATGGAATGCTAACTTAGACAG
EEL GGGTTTGCTCAGATTGAGGACAAATC GAAAGGGACCACATGGGAGAATCG
EIN3 TCTTCCTGATCTACAGAGAGACTCCA GAACTTCGACAAAAGTTAGAGATACGAG
ORE1-1 CTGATATACCACCACGTGCGCA GTTTTGGTGAGCCCGAAACA
ORE1-2 TAGAGTGCACATGTTGTAGCAATG CCATGTGAAGGTGGTAATGATGATG
SGR1 CCGAATCTGTGTCTCTTTGTCGCA GTTTCACACTTCCGTGCCCAAATC
NYC1 GGCTTTCTAGAAGCAAAACTGAATCA GTGTGATGGCCACACGTTACAG
Supplementary Table 4. Primers used in this study.
19
Supplementary Methods
Transmission electron microscope analysis. Transmission electron microscopy was conducted as
previously described14
with some modifications. Leaf tissues were fixed with modified Karnovsky’s
fixative (2% paraformaldehyde, 2% glutaraldehyde, and 50 mM sodium cacodylate buffer, pH 7.2).
Samples were then washed with 0.05M sodium cacodylate buffer, pH 7.2, three times at 4 °C for 10 min.
The samples were post-fixed at 4ºC for 2 h with 1% osmium tetroxide in 0.05 M sodium cacodylate
buffer, pH 7.2, and washed twice with distilled water at room temperature. Samples were stained in 0.5%
uranyl acetate at 4°C overnight and dehydrated in an ethanol gradient and propylene oxide, then finally
infiltrated with Spurr’s resin. Polymerization was performed at 70°C for 24 h and samples were sectioned
with an ultramicrotome (MT-X). The sections were mounted on copper grids and stained with 2% uranyl
acetate for 7 min and with Reynolds’ lead citrate for 7 min. Micrographs were made by using a LIBRA
120 transmission electron microscope (JEOL, Japan).
Immunobot analysis for photosystem proteins. Protein extracts were prepared from the rosette leaves
of Arabidopsis. A 10 mg aliquot of leaf tissue was ground in liquid nitrogen and homogenized with 100
μl of sample buffer [50 mM TRIS–HCl, pH 6.8, 2 mM EDTA, 10% (w/v) glycerol, 2% SDS, and 6% 2-
mercaptoethanol] was used to suspend the protein extracts. The protein samples were subjected to SDS-
PAGE. RbcL were visualized by staining of Coomassie Brilliant Blue R-250 (Sigma-Aldrich). Antibodies
against photosystem proteins, including Lhcb1, D1, Lhca1, PsaA (Agrisera, Sweden) were used for
immunoblot analysis, by diluting to 1/10000. Each protein was detected using an
electrochemiluminescence (ECL) system (WESTSAVE, AbFRONTIER, Seoul, Korea) according to the
manufacturer’s manual.
Analysis of dark treatmeant in individual leaves. For the senescence assay using individually darkened
leaves, 4th or 5th rosette leaves of 3-week-old plants grown in long days were covered with aluminum
foil for indicated days as described with minor modification15, 16
.
20
Supplementary References
1 Miura, K. et al. Sumoylation of ABI5 by the Arabidopsis SUMO E3 ligase SIZ1 negatively
regulates abscisic acid signaling. Proc. Natl. Acad. Sci. USA 106, 5418-5423 (2009).
2 Chao, Q. et al. Activation of the Ethylene Gas Response Pathway in Arabidopsis by the Nuclear
Protein ETHYLENE-INSENSITIVE3 and Related Proteins. Cell 89, 1133-1144 (1997).
3 van der Graaff, E. et al. Transcription analysis of Arabidopsis membrane transporters and
hormone pathways during developmental and induced leaf senescence. Plant Physiol. 141, 776-
792 (2006).
4 Usadel, B. et al. Global transcript levels respond to small changes of the carbon status during
progressive exhaustion of carbohydrates in Arabidopsis rosettes. Plant Physiol. 146, 1834-1861
(2008).
5 Nemhauser, J. L., Hong, F. & Chory, J. Different plant hormones regulate similar processes
through largely nonoverlapping transcriptional responses. Cell 126, 467-475 (2006).
6 Fujita, Y. et al. Three SnRK2 protein kinases are the main positive regulators of abscisic acid
signaling in response to water stress in Arabidopsis. Plant Cell Physiol. 50, 2123-2132 (2009).
7 Reeves, W. M., Lynch, T. J., Mobin, R. & Finkelstein, R. R. Direct targets of the transcription
factors ABA-Insensitive(ABI)4 and ABI5 reveal synergistic action by ABI4 and several bZIP
ABA response factors. Plant Mol. Biol. 75, 347-363 (2011).
8 Liu XL, Covington MF, Fankhauser C, Chory J, Wagner DR. ELF3 encodes a circadian clock-
regulated nuclear protein that functions in an Arabidopsis PHYB signal transduction pathway.
Plant Cell 13, 1293-1304 (2001).
9 Wagner D, Tepperman JM, Quail PH. Overexpression of phytochrome B induces a short
hypocotyl phenotype in transgenic Arabidopsis. Plant Cell 3, 1275-1288 (1991).
10 McNellis TW, von Arnim AG, Araki T, Komeda Y, Misera S, Deng XW. Genetic and molecular
analysis of an allelic series of cop1 mutants suggests functional roles for the multiple protein
domains. Plant Cell 6, 487-500 (1994).
11 Takada S, Goto K. Terminal flower2, an Arabidopsis homolog of heterochromatin protein1,
counteracts the activation of flowering locus T by constans in the vascular tissues of leaves to
regulate flowering time. Plant Cell 15, 2856-2865 (2003).
12 Kikis EA, Khanna R, Quail PH. ELF4 is a phytochrome-regulated component of a negative-
feedback loop involving the central oscillator components CCA1 and LHY. Plant J. 44, 300-313
(2005).

21
13 Onai K, Ishiura M. PHYTOCLOCK 1 encoding a novel GARP protein essential for the
Arabidopsis circadian clock. Genes Cells 10, 963-972 (2005).
14 Inada, N., Sakai, A., Kuroiwa, H., Kuroiwa, T. Three-dimensional analysis of the senescence
program in rice (Oryza sativa L.) coleoptile: investigations by fluorescence microscopy and
electron microscopy. Planta 206, 585–597 (1998).
15 Weaver, A. M., and Amasino, R. M. Senescence is induced in individual darkened Arabidopsis
leaves, but inhibited in whole darkened plants. Plant Physiol. 127, 876-886 (2001).
16 Keech, O. et al. The different fates of mitochondria and chloroplasts during dark-induced
senescence in Arabidopsis leaves. Plant, Cell Environ. 30, 1523-1534 (2007).