Mutalik QuantEstimation Supplement revised - Nature · p2 p5 p3 p4 p7 p6 p1 u4 u1 u7 u6 u5 u3 u2 u8...
25
1 Supplemental Information Quantitative Estimation of Activity and Quality for Collections of Functional Genetic Elements Vivek K. Mutalik 1,2,3,9 , Joao C. Guimaraes 1,3,4,9 , Guillaume Cambray 1,3,9 , Quynh-Anh Mai 1,3 , Marc Juul Christoffersen 1,3 , Lance Martin 1,3,8 , Ayumi Yu 1,3,8 , Colin Lam 1,3 , Cesar Rodriguez 1,3,8 , Gaymon Bennett 1,3,8 , Jay D. Keasling 1,2,3,6,7 , Drew Endy 1,5,9,* , Adam P. Arkin 1,2,3,9,* 1 BIOFAB International Open Facility Advancing Biotechnology (BIOFAB), 5885 Hollis Street, Emeryville, CA 94608, USA 2 Physical Biosciences Division, Lawrence Berkeley National Laboratory, Berkeley, CA, 94720, USA 3 Department of Bioengineering, University of California, Berkeley, CA, 94720, USA 4 Department of Informatics, Computer Science and Technology Center, University of Minho, Campus de Gualtar, Braga, Portugal 5 Department of Bioengineering, Stanford University, Stanford, CA 94305, USA 6 Department of Chemical & Biomolecular Engineering, University of California, Berkeley, CA, 94720, USA 7 Joint Bioenergy Institute, 5885 Hollis Street, Emeryville, CA 94608, USA 8 Present Addresses: Dept. of Bioengineering, Stanford University, Stanford, CA 94305, USA (L. M.); Philotic, Inc. 88 Kearny St, Suite 2100, San Francisco, CA 94108, USA (A. Y.); Autodesk, Inc. One Market Street, Suite 200, San Francisco, CA 94105 (C. R.); Center for Biological Futures, Fred Hutchinson Cancer Research Center, 1100 Fairview Ave. Seattle, WA 98109 (G. B.). 9 Equal contribution *Correspondence should be addressed to D.E. or A.P.A. ([email protected]; [email protected]) Nature Methods: doi:10.1038/nmeth.2403
-
Upload
truonghanh -
Category
Documents
-
view
223 -
download
0
Transcript of Mutalik QuantEstimation Supplement revised - Nature · p2 p5 p3 p4 p7 p6 p1 u4 u1 u7 u6 u5 u3 u2 u8...
1
Supplemental Information
Quantitative Estimation of Activity and Quality for Collections of Functional Genetic Elements
Vivek K. Mutalik1,2,3,9, Joao C. Guimaraes1,3,4,9, Guillaume Cambray1,3,9, Quynh-Anh Mai1,3,
Marc Juul Christoffersen1,3, Lance Martin1,3,8, Ayumi Yu1,3,8, Colin Lam1,3, Cesar Rodriguez1,3,8,
Gaymon Bennett1,3,8, Jay D. Keasling1,2,3,6,7, Drew Endy1,5,9,*, Adam P. Arkin1,2,3,9,*
1 BIOFAB International Open Facility Advancing Biotechnology (BIOFAB), 5885 Hollis Street,
Emeryville, CA 94608, USA
2 Physical Biosciences Division, Lawrence Berkeley National Laboratory, Berkeley, CA, 94720,
USA
3 Department of Bioengineering, University of California, Berkeley, CA, 94720, USA
4 Department of Informatics, Computer Science and Technology Center, University of Minho,
Campus de Gualtar, Braga, Portugal
5 Department of Bioengineering, Stanford University, Stanford, CA 94305, USA
6 Department of Chemical & Biomolecular Engineering, University of California, Berkeley, CA,
94720, USA
7Joint Bioenergy Institute, 5885 Hollis Street, Emeryville, CA 94608, USA
8 Present Addresses: Dept. of Bioengineering, Stanford University, Stanford, CA 94305,
USA (L. M.); Philotic, Inc. 88 Kearny St, Suite 2100, San Francisco, CA 94108, USA
(A. Y.); Autodesk, Inc. One Market Street, Suite 200, San Francisco, CA 94105 (C. R.);
Center for Biological Futures, Fred Hutchinson Cancer Research Center, 1100 Fairview
Ave. Seattle, WA 98109 (G. B.).
9 Equal contribution
*Correspondence should be addressed to D.E. or A.P.A. ([email protected]; [email protected])
Nature Methods: doi:10.1038/nmeth.2403
2
Table of Contents
Supplementary Figures
SF1. Combinatorial assembly of Promoters and 5’ UTRs 3
SF2. Quality and reproducibility of characterization pipeline 4
SF3. Comparison of plasmid-born vs chromosomally integrated
Promoter:5’ UTR combinatorial library driving gfp expression 5
SF4. Observed variation and correlation of mRNA abundance and
fluorescence from combinatorial library of expression elements 6
SF5. Estimation of expression element performance scores using transcript abundance
and translation efficiency datasets 7
SF6. Estimation of part activity with limited measurements 8
SF7. Genetic element performance scores at two different temperatures 9
SF8. Variability in 5’ UTR scores is correlated with RNA folded structure at the
UTR:GOI junction. 10
Supplementary Tables
ST1. Putative transcription and translational elements used in this work 11
ST2. ANOVA table for main expression elements and their interaction 13
ST3. Process Steps and Costs for BIOFAB Quant. Estimation Pilot Study 14
ST4. List of plasmids and strains used in this work 15
ST5. List of primers used in the present work 18
Supplementary Note 22
References 25
Nature Methods: doi:10.1038/nmeth.2403

3
Supplementary Figure 1: Combinatorial assembly of promoters and 5’ UTRs (A) The
vector backbone of pFABOUT2 (gfp) was PCR amplified using primers oFAB57 and oFAB58,
which introduces BsaI target sites (shown as green and purple boxes with arrow head) by
replacing the TetR coding region, Ptet and 5’ UTR driving the expression of gfp gene. The
terminators (symbol ‘T’) and promoters (line-arrow) on the vector backbone as shown in the
figure. The purified PCR products were then digested with enzyme BsaI and yield
pFABOUT2_cut with overhangs as shown in the figure. The cut vector backbone was then
ligated to phosphorylated-annealed oligos encoding the promoter and 5’ UTR to yield 84 (seven
promoters and eleven 5’ UTRs, and one Null-RBS 5’ UTR as a control) constructs that make up
the GFP library. (B) The vector backbone of pFABOUT18 (rfp) was PCR amplified using
primers oFAB58 and oFAB60 to introduce BsaI sites (shown as red and purple boxes with arrow
head) upstream of reporter. The cut vector pFABOUT18_cut was then ligated to phosphorylated-
annealed oligos encoding promoters and 5’ UTR to yield 84 constructs of RFP library. Note that
both GFP and RFP libraries have a common four nucleotide TTTG junction between promoters
and 5’ UTRs.
Nature Methods: doi:10.1038/nmeth.2403
4
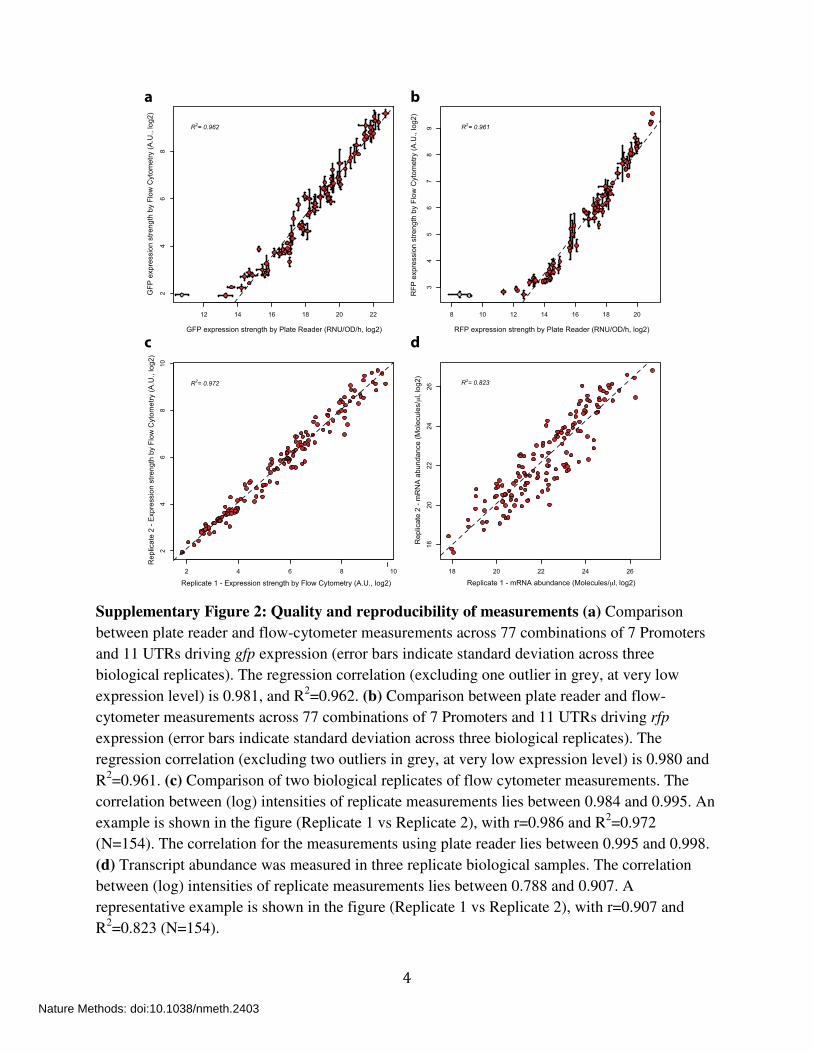
Supplementary Figure 2: Quality and reproducibility of measurements (a) Comparison
between plate reader and flow-cytometer measurements across 77 combinations of 7 Promoters
and 11 UTRs driving gfp expression (error bars indicate standard deviation across three
biological replicates). The regression correlation (excluding one outlier in grey, at very low
expression level) is 0.981, and R2=0.962. (b) Comparison between plate reader and flow-
cytometer measurements across 77 combinations of 7 Promoters and 11 UTRs driving rfp
expression (error bars indicate standard deviation across three biological replicates). The
regression correlation (excluding two outliers in grey, at very low expression level) is 0.980 and
R2=0.961. (c) Comparison of two biological replicates of flow cytometer measurements. The
correlation between (log) intensities of replicate measurements lies between 0.984 and 0.995. An
example is shown in the figure (Replicate 1 vs Replicate 2), with r=0.986 and R2=0.972
(N=154). The correlation for the measurements using plate reader lies between 0.995 and 0.998.
(d) Transcript abundance was measured in three replicate biological samples. The correlation
between (log) intensities of replicate measurements lies between 0.788 and 0.907. A
representative example is shown in the figure (Replicate 1 vs Replicate 2), with r=0.907 and
R2=0.823 (N=154).
a b
c
18 20 22 24 26
18
20
22
24
26
Replicate 1 - mRNA abundance (Molecules/μl, log2)
Re
plic
ate
2 -
mR
NA
ab
un
da
nce
(M
ole
cu
les/μ
l, lo
g2
)
R2= 0.823
2 4 6 8 10
24
68
10
Replicate 1 - Expression strength by Flow Cytometry (A.U., log2)
Re
plic
ate
2 -
Exp
ressio
n s
tre
ng
th b
y F
low
Cyto
me
try (
A.U
., lo
g2
)
R2= 0.972
d
12 14 16 18 20 22
24
68
GFP expression strength by Plate Reader (RNU/OD/h, log2)
GF
P e
xp
ressio
n s
tre
ng
th b
y F
low
Cyto
me
try (
A.U
., lo
g2
)
R2= 0.962
8 10 12 14 16 18 20
34
56
78
9
RFP expression strength by Plate Reader (RNU/OD/h, log2)
RF
P e
xp
ressio
n s
tre
ng
th b
y F
low
Cyto
me
try (
A.U
., lo
g2
)
R2= 0.961
Nature Methods: doi:10.1038/nmeth.2403

5
Supplementary Figure 3. Comparison of plasmid-born vs chromosomally integrated
Promoter:5’ UTR combinatorial library driving gfp expression. Scatter plots of fluorescence
(GFP) measurements from 63 pairs of plasmid-born versus chromosomally integrated Promoter-
5’ UTR combination. A linear regression on 60 points gives the following relationship: Fplasmid =
12.07 * Fchromosomal – 18.03 (R2 of 0.85). These data fit with the expected dosage difference
between a p15A-born and chromosomally integrated gene (~12-15 versus ~1 copy).
10 20 30 40 50 60
0100
200
300
400
500
600
Mean fluorescence on chromosome (A.U.)
Mean flu
ore
scence o
n p
lasm
id (
A.U
.) y = 12.07 * x - 18.03R2 = 0.85
Nature Methods: doi:10.1038/nmeth.2403
6
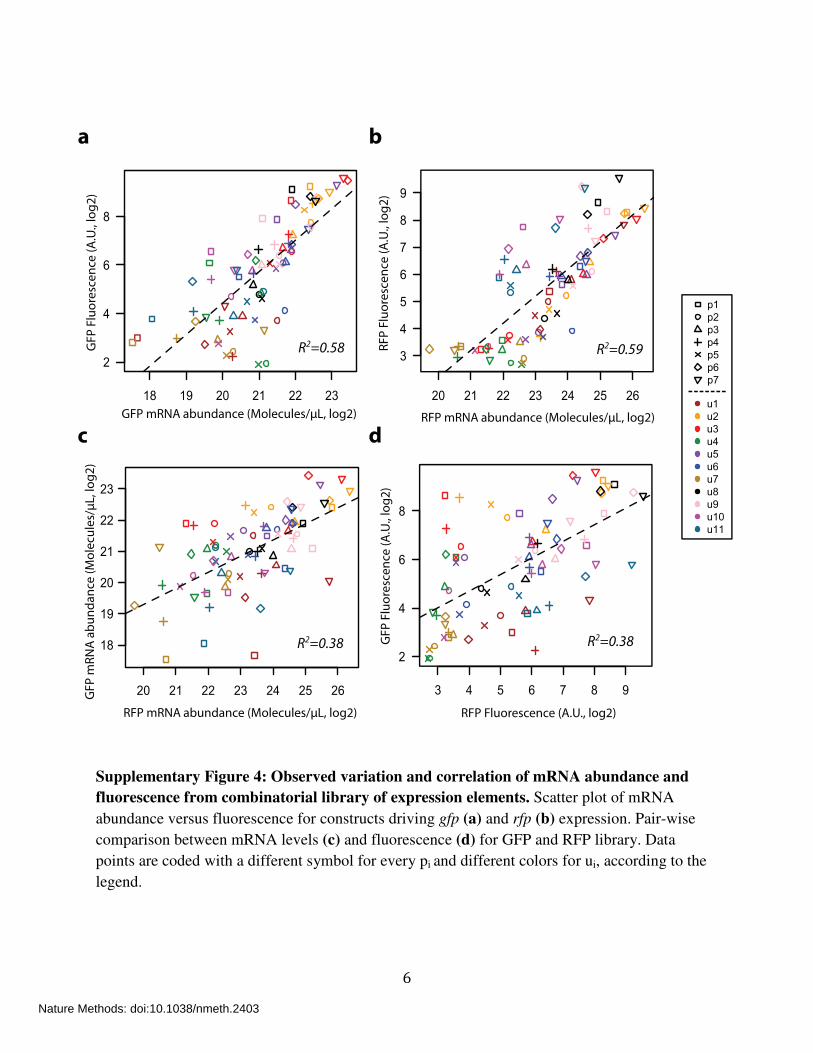
Supplementary Figure 4: Observed variation and correlation of mRNA abundance and
fluorescence from combinatorial library of expression elements. Scatter plot of mRNA
abundance versus fluorescence for constructs driving gfp (a) and rfp (b) expression. Pair-wise
comparison between mRNA levels (c) and fluorescence (d) for GFP and RFP library. Data
points are coded with a different symbol for every pi and different colors for ui, according to the
legend.
a b
GF
P F
luo
resc
en
ce (
A.U
., lo
g2
)
GFP mRNA abundance (Molecules/µL, log2) RFP mRNA abundance (Molecules/µL, log2)
RF
P F
luo
resc
en
ce (
A.U
., lo
g2
)
RFP Fluorescence (A.U., log2)
GF
P F
luo
resc
en
ce (
A.U
., lo
g2
)
3 4 5 6 7 8 9
2
4
6
8
R2=0.38
18 19 20 21 22 23
2
4
6
8
R2=0.58
20 21 22 23 24 25 26
3
4
5
6
7
8
9
R2=0.59
p1
p2
p3
p4
p5
p6
p7
u1
u2
u3
u4
u5
u6
u7
u8
u9
u10
u11
dc
20 21 22 23 24 25 26
18
19
20
21
22
23
RFP mRNA abundance (Molecules/µL, log2)
GF
P m
RN
A a
bu
nd
an
ce (
Mo
lecu
les/
µL
, lo
g2
)
R2=0.38
Nature Methods: doi:10.1038/nmeth.2403
7
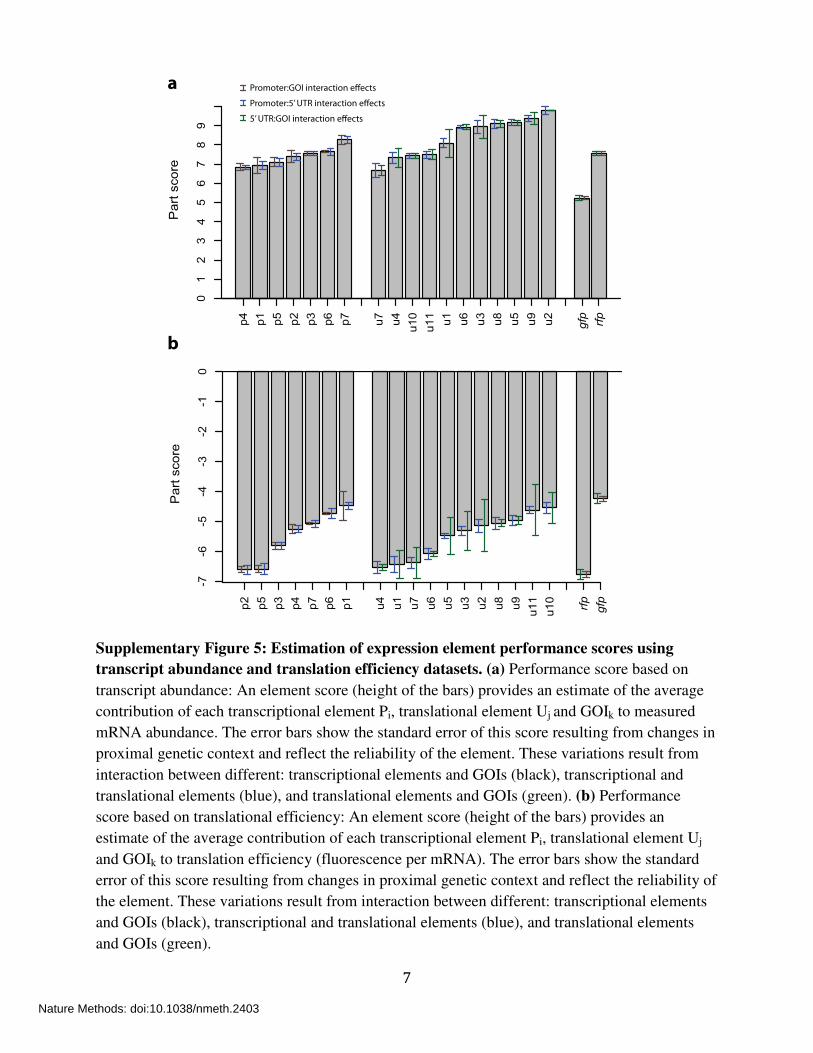
Supplementary Figure 5: Estimation of expression element performance scores using
transcript abundance and translation efficiency datasets. (a) Performance score based on
transcript abundance: An element score (height of the bars) provides an estimate of the average
contribution of each transcriptional element Pi, translational element Uj and GOIk to measured
mRNA abundance. The error bars show the standard error of this score resulting from changes in
proximal genetic context and reflect the reliability of the element. These variations result from
interaction between different: transcriptional elements and GOIs (black), transcriptional and
translational elements (blue), and translational elements and GOIs (green). (b) Performance
score based on translational efficiency: An element score (height of the bars) provides an
estimate of the average contribution of each transcriptional element Pi, translational element Uj
and GOIk to translation efficiency (fluorescence per mRNA). The error bars show the standard
error of this score resulting from changes in proximal genetic context and reflect the reliability of
the element. These variations result from interaction between different: transcriptional elements
and GOIs (black), transcriptional and translational elements (blue), and translational elements
and GOIs (green).
a
b
p2
p5
p3
p4
p7
p6
p1
u4
u1
u7
u6
u5
u3
u2
u8
u9
u11
u10
rfp
gfp
Part
score
-7-6
-5-4
-3-2
-10
p4
p1
p5
p2
p3
p6
p7
u7
u4
u10
u11
u1
u6
u3
u8
u5
u9
u2
gfp rfp
Part
score
01
23
45
67
89
Promoter:GOI interaction e�ects
Promoter:5’ UTR interaction e�ects
5’ UTR:GOI interaction e�ects
Nature Methods: doi:10.1038/nmeth.2403

8
Supplementary Figure 6: Estimation of part activity with limited measurements. (a)
Estimated activities of all promoters with increasing numbers of 5’ UTRs. (b) Estimated
activities of all 5' UTRs with increasing number of promoters. Each dot represents a unique
combination of elements and the single part with best accuracy is colored in red, whereas the pair
of parts with higher accuracy is colored in blue.
a-2
02
46
Number of UTRs used
Estim
ate
d s
core
for
p1
1 2 3 4 5 6 7 8 9 10 11
-20
24
6
Number of UTRs used
Estim
ate
d s
core
for
p2
1 2 3 4 5 6 7 8 9 10 11
-20
24
6
Number of UTRs used
Estim
ate
d s
core
for
p3
1 2 3 4 5 6 7 8 9 10 11
-20
24
6
Number of UTRs used
Estim
ate
d s
core
for
p4
1 2 3 4 5 6 7 8 9 10 11
-20
24
6
Number of UTRs used
Estim
ate
d s
core
for
p5
1 2 3 4 5 6 7 8 9 10 11
-20
24
6
Number of UTRs used
Estim
ate
d s
core
for
p6
1 2 3 4 5 6 7 8 9 10 11
-20
24
6
Number of UTRs used
Estim
ate
d s
core
for
p7
1 2 3 4 5 6 7 8 9 10 11
b
-20
24
6
Number of Promoters used
Estim
ate
d s
core
for
u4
1 2 3 4 5 6 7
-20
24
6
Number of Promoters used
Estim
ate
d s
core
for
u3
1 2 3 4 5 6 7
-20
24
6
Number of Promoters used
Estim
ate
d s
core
for
u2
1 2 3 4 5 6 7
-20
24
6
Number of Promoters used
Estim
ate
d s
core
for
u1
1 2 3 4 5 6 7
-20
24
6
Number of Promoters used
Estim
ate
d s
core
for
u8
1 2 3 4 5 6 7
-20
24
6
Number of Promoters used
Estim
ate
d s
core
for
u7
1 2 3 4 5 6 7
-20
24
6
Number of Promoters used
Estim
ate
d s
core
for
u6
1 2 3 4 5 6 7
-20
24
6
Number of Promoters used
Estim
ate
d s
core
for
u5
1 2 3 4 5 6 7
-20
24
6
Number of Promoters used
Estim
ate
d s
core
for
u11
1 2 3 4 5 6 7
-20
24
6
Number of Promoters used
Estim
ate
d s
core
for
u10
1 2 3 4 5 6 7
-20
24
6
Number of Promoters used
Estim
ate
d s
core
for
u9
1 2 3 4 5 6 7
Nature Methods: doi:10.1038/nmeth.2403

9
Supplementary Figure 7: Genetic elements performance across two temperatures. To assess the
effect of different temperatures on transcription and translational elements we grew and measured the
Promoter:5’ UTR combinatorial library driving a GFP reporter at 30C. We next employed ANOVA
analysis (as detailed in online Methods) to estimate the effect of temperature on overall gene expression
as well as its part-specific effect. (a) Fluorescence measured at two temperatures. Gene expression
measured at 30C and 37C are highly correlated. (b) ANOVA analysis indicates that temperature effect on
overall expression is very weak (0.01%). We also observed that temperature has a greater impact on
Promoters (0.21%) than on 5’ UTRs (0.12%), though both effects are also very weak. (c) Estimation of
parts scores and deviations across different temperature conditions (30C and 37C) indicate that the
promoter and 5’ UTR elements tested here appear insensitive to the given change in temperature (red and
green error bar); both p5 and u4 parts show higher variability in their performance at two different
temperature measured.
a b
c
Experimental Error (0.02%)
Promoter:UTR:Temperature (0.07%)
Promoter:Temperature (0.21%)
UTR:Temperature (0.12%)
Promoter:UTR (2.14%)
UTR (69.9%)
Promoter (27.53%)
Temperature (0.01%)
Promoter:Temperature interaction e�ects
Promoter:5’UTR interaction e�ects
5’UTR:Temperature interaction e�ects
2 4 6 8 10
02
46
81
0
GFP expression at 37C (A.U., log2)
GF
P e
xpre
ssio
n a
t 3
0C
(A
.U.,
log
2) R
2= 0.974
p5
p2
p3
p4
p1
p6
p7
u7
u1
u4
u1
1
u1
0
u6
u8
u9
u5
u3
u2
30
37
Pa
rt s
core
01
23
45
6
Nature Methods: doi:10.1038/nmeth.2403

10
Supplementary Figure 8: Variability in 5’ UTR scores is correlated with RNA folded structure at
the UTR:GOI junction. To evaluate the source of variability of 5’ UTR scores we used UNAfold
software1 to predict RNA structure formed at the junction between all the 11 5’UTRs and 2 GOI ([-19,31]
with respect to ATG). We observed that different RNA structures are formed when the same UTR is used
with different GOIs. (a) For a 5’ UTR, the weaker the structure formed the higher is expected to be its
activity. For example, if the structure formed with GFP is weaker than the one formed with RFP (space
above dashed line), the activity of the 5’ UTR fused with GFP is expected to be higher than when fused
with RFP and vice-versa. 5’ UTRs driving stronger GFP expression than RFP are colored in orange,
while those driving stronger RFP expression than GFP are colored in blue. Using this qualitative metric
we find that 9 out of the 11 UTRs in our dataset have the expected behavior. (b) The difference between
the folding energies of GFP and RFP (∆∆G) are well correlated (r=0.77) with the difference in UTR
performance between GFP and RFP (∆Score). When ∆Score > 0 it means that UTR performance is higher
with GFP than RFP (orange dots), conversely if ∆Score < 0 it means that UTR performance is higher with
RFP than GFP (blue dots). UTRs that have stronger structures when fused with GFP than with RFP have
∆∆G < 0 and UTRs that have stronger structures with RFP than GFP have ∆∆G > 0.
a
-10 -8 -6 -4
-10
-8-6
-4
MFE for RFP
MF
E for
GF
P
Ui(GFP) > Ui(RFP)
Ui(RFP) > Ui(GFP)
a a g a g g g
g
a
c
a
a
a
c
t
a
g
t
a
t
g
a
g
c
a
a
a
g
g
a
g
a a
g
a
a
c
t
t
t
t
c
a
c
t
g
g
a
g
t
t
g
t
c
c
1
10
20
30
40
50
55
a a g a g g
g
g
a
c a
a
a
c
t a g
t
a
t
g
g
c
g
a
g
t
a
g
c
g
a
a g
a
c
g
t
t
a
tc
a
a
a
g
ag
t
t
c
a
t
g
c
1
10
20
30
40
50
55
a a a g a g g
a
g
a a
a
t
t a a g
c
a
t g
a
g
c a a a g g
a
g
a
a
g
a a
c
t
t
t
t
c a c t g
g
a
g
t t
g
t
c
c
1
10 20
30
40
50
55
a a a g a g g
a
g
a a
a
t
t a a g
c
a
t
g
g
c
g
a
g
t
a
g
c
g
a
a g
a
c
g
t
t
a
tc
a
a
a
g
ag
t
t
c
a
t
g
c
1
1020
30
40
50
55
U1:GFP U1:RFP
U5:GFP U5:RFP
b
-6 -4 -2 0
-2-1
01
2
2
ΔΔG
ΔS
core
Ui(GFP)
higher
score
Ui(RFP)
higher
score
Ui:GFP
stronger
structure
Ui:RFP
stronger
structure
ΔG=-6.8 ΔG=-8.2
ΔG=-11.6 ΔG=-5.5
Nature Methods: doi:10.1038/nmeth.2403

11
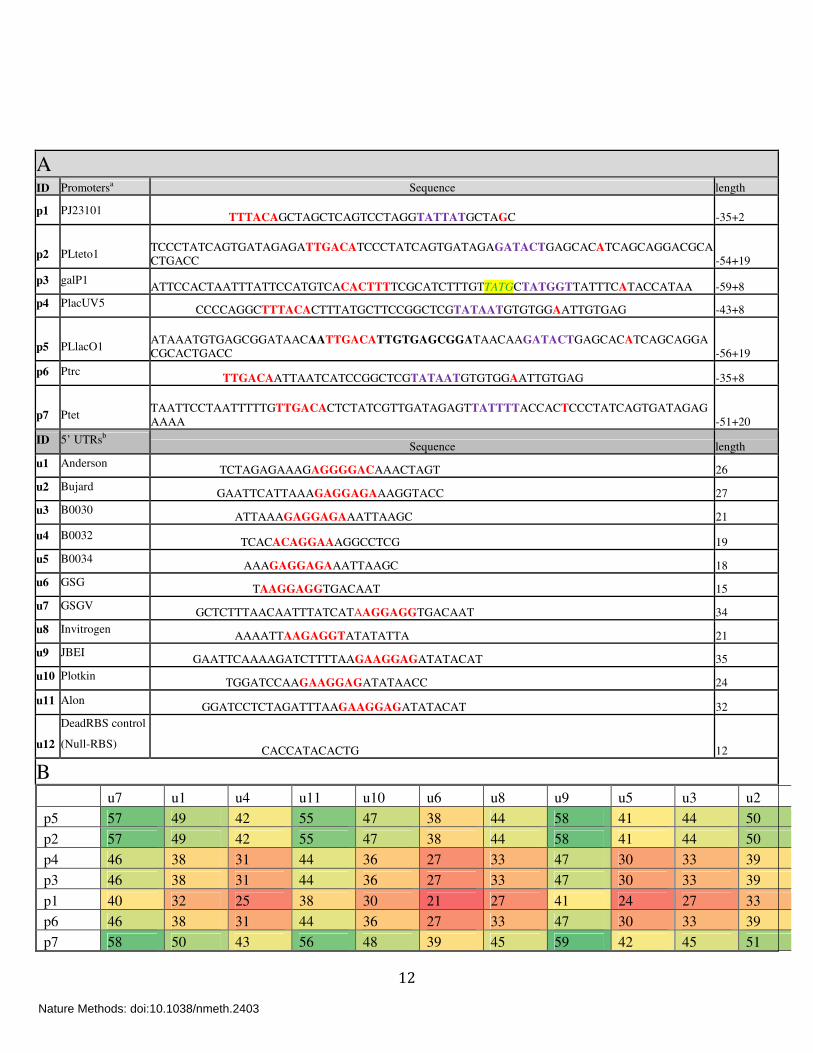
Supplementary Tables: Supplementary Table 1
A: Putative transcriptional and translational elements used in this work. List of promoter
and 5’ UTR sequences used in the present work with their corresponding lengths. Promoters are
highlighted with their transcription start sites (+1, red), promoter -35 and -10 motifs are indicated
in red and purple respectively, and an extended -10 motif is colored yellow. For 5’ UTRs,
putative Shine-Dalgarno sequences are highlighted in red.
aThe promoter names used in this work and their sources:
p1:J23101(http://partsregistry.org/Part:BBa_J23101), p2: pLTeto1 (ref 2), p3: galP1 (ref 3),
p4:placUV5 (ref 3), p5:pLlaco1 (ref 2), p6:Ptrc3, p7:Ptet4;
bThe 5’ UTRs and their sources:
u1:Anderson (http://partsregistry.org/wiki/index.php/Part:BBa_J61100), u2:Bujard2, u3:B0030
(http://partsregistry.org/Part:BBa_B0030), u4:B0032 (http://partsregistry.org/Part:BBa_B0032),
u5:B0034 (http://partsregistry.org/Part:BBa_B0034), u6:GSG5, u7:GSGV6, u8:Invitrogen®,
u9:JBEI4, u10:Plotkin7, u11:Alon8 , u12:DeadRBS (this work).
B: Total length of 5’ UTR range from 21 to 59 nucleotides. Note that both GFP and RFP
libraries have a common four nucleotide TTTG junction between promoters and 5’ UTRs
(Supplementary Fig. 1). The order of the elements in the matrices corresponds to a bidimensional
clustering performed on the data in panels a-d of Fig. 2.
Nature Methods: doi:10.1038/nmeth.2403
12
A
ID Promotersa Sequence length
p1 PJ23101 TTTACAGCTAGCTCAGTCCTAGGTATTATGCTAGC -35+2
p2 PLteto1
TCCCTATCAGTGATAGAGATTGACATCCCTATCAGTGATAGAGATACTGAGCACATCAGCAGGACGCACTGACC -54+19
p3 galP1 ATTCCACTAATTTATTCCATGTCACACTTTTCGCATCTTTGTTATGCTATGGTTATTTCATACCATAA -59+8
p4 PlacUV5 CCCCAGGCTTTACACTTTATGCTTCCGGCTCGTATAATGTGTGGAATTGTGAG -43+8
p5 PLlacO1
ATAAATGTGAGCGGATAACAATTGACATTGTGAGCGGATAACAAGATACTGAGCACATCAGCAGGACGCACTGACC -56+19
p6 Ptrc TTGACAATTAATCATCCGGCTCGTATAATGTGTGGAATTGTGAG -35+8
p7 Ptet
TAATTCCTAATTTTTGTTGACACTCTATCGTTGATAGAGTTATTTTACCACTCCCTATCAGTGATAGAGAAAA -51+20
ID 5’ UTRsb Sequence length
u1 Anderson TCTAGAGAAAGAGGGGACAAACTAGT 26
u2 Bujard GAATTCATTAAAGAGGAGAAAGGTACC 27
u3 B0030 ATTAAAGAGGAGAAATTAAGC 21
u4 B0032 TCACACAGGAAAGGCCTCG 19
u5 B0034 AAAGAGGAGAAATTAAGC 18
u6 GSG TAAGGAGGTGACAAT 15
u7 GSGV GCTCTTTAACAATTTATCATAAGGAGGTGACAAT 34
u8 Invitrogen AAAATTAAGAGGTATATATTA 21
u9 JBEI GAATTCAAAAGATCTTTTAAGAAGGAGATATACAT 35
u10 Plotkin TGGATCCAAGAAGGAGATATAACC 24
u11 Alon GGATCCTCTAGATTTAAGAAGGAGATATACAT 32
u12
DeadRBS control
(Null-RBS) CACCATACACTG 12
B
u7 u1 u4 u11 u10 u6 u8 u9 u5 u3 u2
p5 57 49 42 55 47 38 44 58 41 44 50
p2 57 49 42 55 47 38 44 58 41 44 50
p4 46 38 31 44 36 27 33 47 30 33 39
p3 46 38 31 44 36 27 33 47 30 33 39
p1 40 32 25 38 30 21 27 41 24 27 33
p6 46 38 31 44 36 27 33 47 30 33 39
p7 58 50 43 56 48 39 45 59 42 45 51
Nature Methods: doi:10.1038/nmeth.2403
13
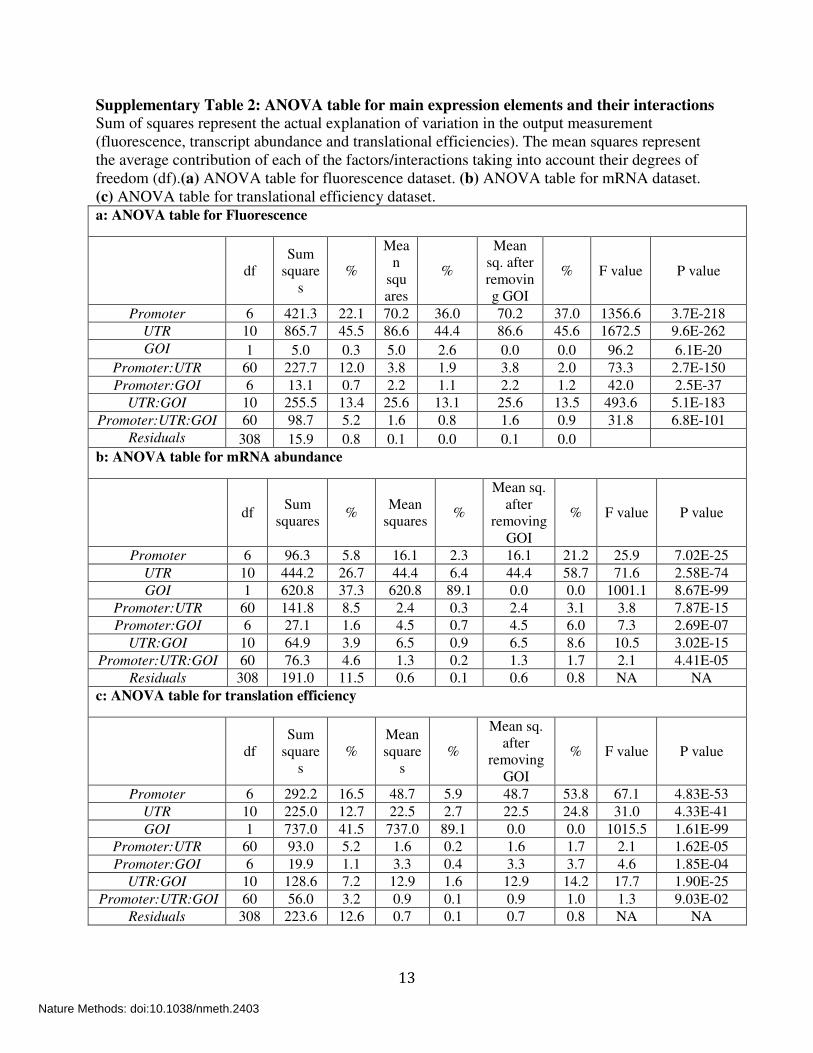
Supplementary Table 2: ANOVA table for main expression elements and their interactions Sum of squares represent the actual explanation of variation in the output measurement (fluorescence, transcript abundance and translational efficiencies). The mean squares represent the average contribution of each of the factors/interactions taking into account their degrees of freedom (df).(a) ANOVA table for fluorescence dataset. (b) ANOVA table for mRNA dataset. (c) ANOVA table for translational efficiency dataset. a: ANOVA table for Fluorescence
df Sum
squares
%
Mean
squares
%
Mean sq. after removing GOI
% F value P value
Promoter 6 421.3 22.1 70.2 36.0 70.2 37.0 1356.6 3.7E-218 UTR 10 865.7 45.5 86.6 44.4 86.6 45.6 1672.5 9.6E-262 GOI 1 5.0 0.3 5.0 2.6 0.0 0.0 96.2 6.1E-20
Promoter:UTR 60 227.7 12.0 3.8 1.9 3.8 2.0 73.3 2.7E-150 Promoter:GOI 6 13.1 0.7 2.2 1.1 2.2 1.2 42.0 2.5E-37
UTR:GOI 10 255.5 13.4 25.6 13.1 25.6 13.5 493.6 5.1E-183 Promoter:UTR:GOI 60 98.7 5.2 1.6 0.8 1.6 0.9 31.8 6.8E-101
Residuals 308 15.9 0.8 0.1 0.0 0.1 0.0 b: ANOVA table for mRNA abundance
df Sum
squares %
Mean squares
%
Mean sq. after
removing GOI
% F value P value
Promoter 6 96.3 5.8 16.1 2.3 16.1 21.2 25.9 7.02E-25 UTR 10 444.2 26.7 44.4 6.4 44.4 58.7 71.6 2.58E-74 GOI 1 620.8 37.3 620.8 89.1 0.0 0.0 1001.1 8.67E-99
Promoter:UTR 60 141.8 8.5 2.4 0.3 2.4 3.1 3.8 7.87E-15 Promoter:GOI 6 27.1 1.6 4.5 0.7 4.5 6.0 7.3 2.69E-07
UTR:GOI 10 64.9 3.9 6.5 0.9 6.5 8.6 10.5 3.02E-15 Promoter:UTR:GOI 60 76.3 4.6 1.3 0.2 1.3 1.7 2.1 4.41E-05
Residuals 308 191.0 11.5 0.6 0.1 0.6 0.8 NA NA c: ANOVA table for translation efficiency
df Sum
squares
% Mean square
s %
Mean sq. after
removing GOI
% F value P value
Promoter 6 292.2 16.5 48.7 5.9 48.7 53.8 67.1 4.83E-53 UTR 10 225.0 12.7 22.5 2.7 22.5 24.8 31.0 4.33E-41 GOI 1 737.0 41.5 737.0 89.1 0.0 0.0 1015.5 1.61E-99
Promoter:UTR 60 93.0 5.2 1.6 0.2 1.6 1.7 2.1 1.62E-05 Promoter:GOI 6 19.9 1.1 3.3 0.4 3.3 3.7 4.6 1.85E-04
UTR:GOI 10 128.6 7.2 12.9 1.6 12.9 14.2 17.7 1.90E-25 Promoter:UTR:GOI 60 56.0 3.2 0.9 0.1 0.9 1.0 1.3 9.03E-02
Residuals 308 223.6 12.6 0.7 0.1 0.7 0.8 NA NA
Nature Methods: doi:10.1038/nmeth.2403

14
Supplementary Table 3: Process Steps and Costs for BIOFAB Quant. Estimation Pilot Study
(168 plasmid-based constructs plus 57 chromosomal integrations)
Task Staffing Time (hours)
Materials & Supplies Costs (USD)
Design (part selection & sequences, junction architecture, cloning strategy)
1 senior researcher
80 n/a $5,000
Build (oligo. synthesis, assembly, sequence verification)
1 senior researcher, 2 research assistants
360 (120 per) Oligonucleotides ($550), enzymes ($1144), sequencing, ($1650), tips, media, plates ($500). $3,844 total or $17.08 per vector.
$19,500 $3,844
Measurements (plate reader, cytometry, qPCR)
1 senior researcher, 2 research assistants
360 (120 per) Triplicate assays for 225 constructs by plate reader and cytometry. Additional triplicate assays for 168 plasmid-based constructs by qPCR. Cost per plate reader or cytometer assay ($3.00/construct). Cost per qPCR assay $20.00/construct). $12,000 total.
$19,500 $12,000
Analysis (data processing, numerical methods)
1 senior researcher, 1 graduate student (not charged)
120 (60 per) n/a $3,750
Totals n/a 920 hours n/a $63,594
All costs calculated for low-to-medium throughput assays carried out in a rent free BSL1 facility equipped with a -80C freezer, -20C freezer, deli fridge, 1 microplate shaker, multichannel pipettes, a microplate reader, a flow cytometer, and a qPCR machine. Salaries include overhead and benefits and are approximate to within 10%.
Nature Methods: doi:10.1038/nmeth.2403

15
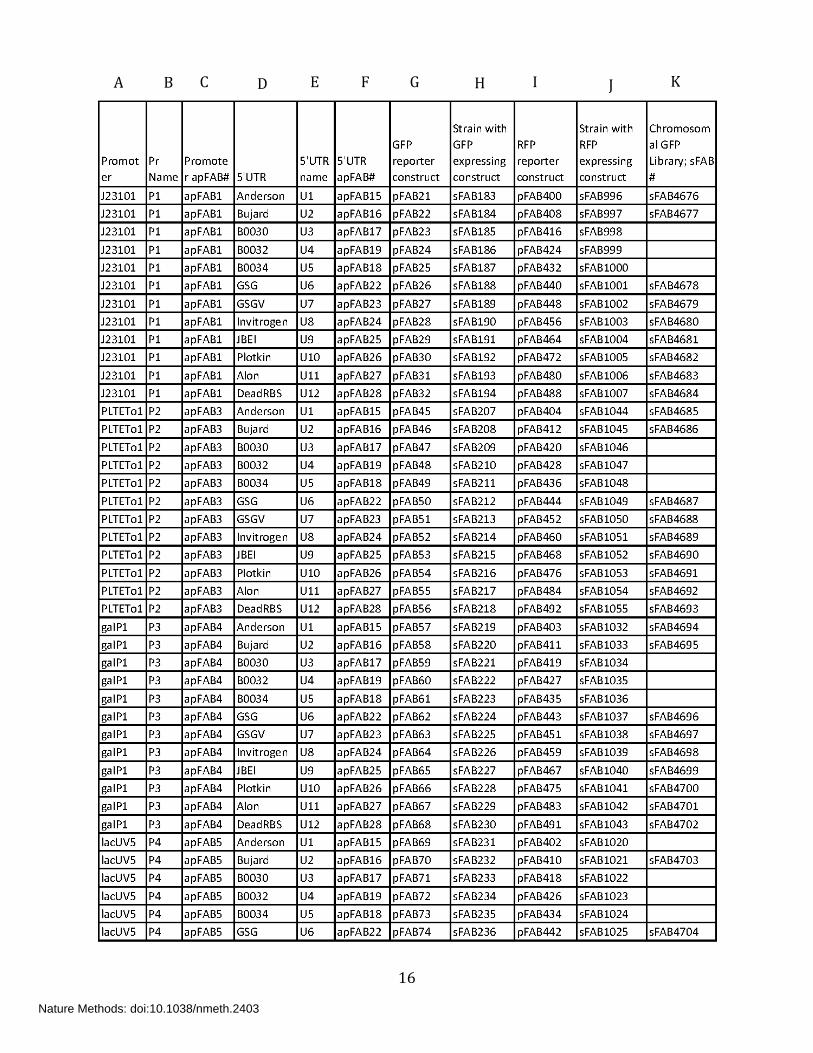
Supplementary Table 4: List of plasmids and strains used in the present work
Column A: Promoter name (generic or source name)
Column B: Promoter name used in the main text
Column C: Abstract part number for promoter element indicated as apFAB #
Column D: 5’UTR name (generic or source name)
Column E: 5’UTR name used in the main text
Column F: Abstract part number for 5’UTR element indicated as apFAB #
Column G: Plasmid number for the combinatorial library with GFP reporter
Column H: Strain number with GFP library
Column I: Plasmid number for the combinatorial library with RFP reporter
Column J: Strain number with RFP library
Column K: Strain number for the combinatorial library with GFP reporter on the chromosome.
Nature Methods: doi:10.1038/nmeth.2403
16
A B C D E F G H I J K
Nature Methods: doi:10.1038/nmeth.2403

17
Nature Methods: doi:10.1038/nmeth.2403
18
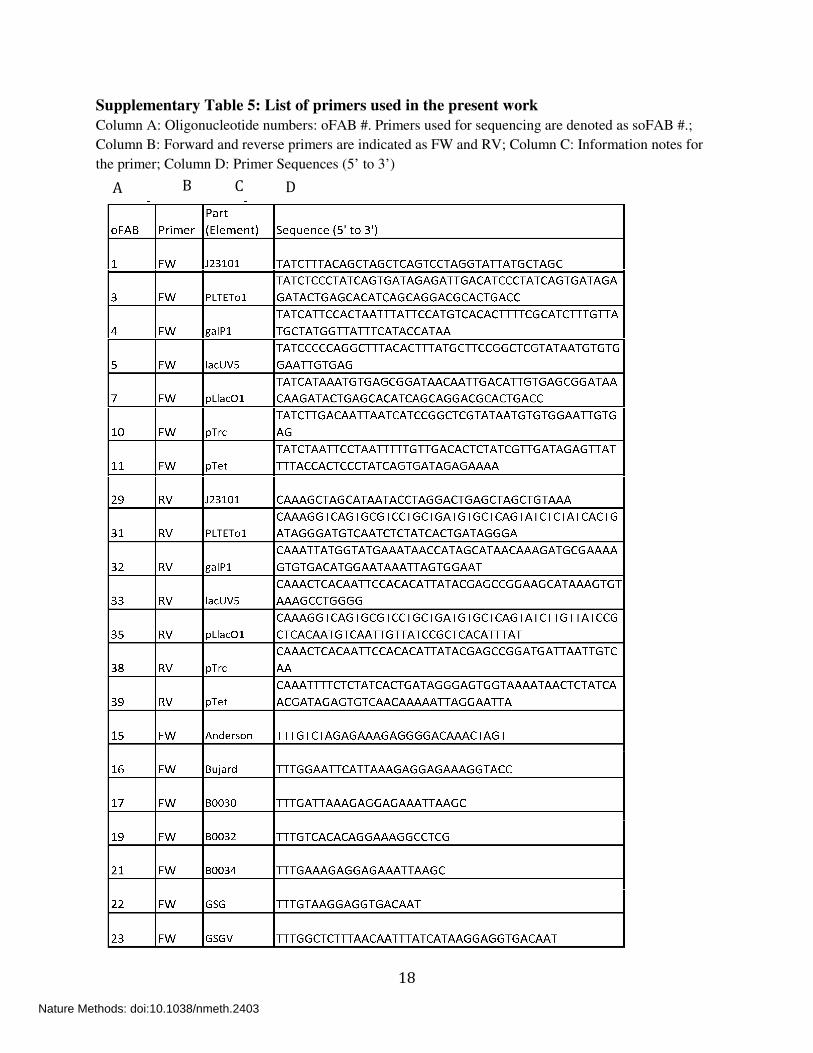
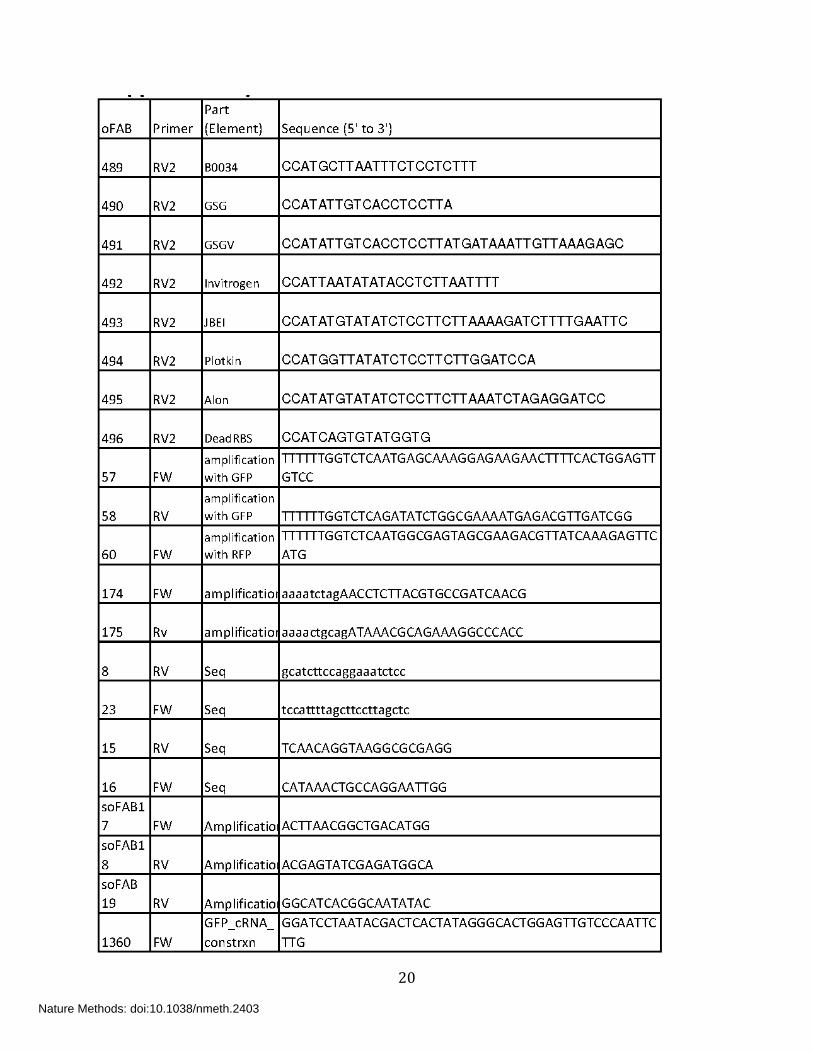
Supplementary Table 5: List of primers used in the present work
Column A: Oligonucleotide numbers: oFAB #. Primers used for sequencing are denoted as soFAB #.;
Column B: Forward and reverse primers are indicated as FW and RV; Column C: Information notes for
the primer; Column D: Primer Sequences (5’ to 3’)
A B C D
Nature Methods: doi:10.1038/nmeth.2403

19
Nature Methods: doi:10.1038/nmeth.2403
20
Nature Methods: doi:10.1038/nmeth.2403

21
Nature Methods: doi:10.1038/nmeth.2403

22
Supplementary Note
Quantitative estimate of the time, effort, costs that are required to perform genetic part
characterization in BioFAB like facility
Ideally, when introducing a new biological part into a cell one could predict its operation
from a first principles model. However, the first principles necessary to understand part
function within a cellular milieu are often not clear. Uncertainty in the proper model can
be placed in at least three classes: (i) the mechanism underlying the model, (ii) the values
of kinetic and thermodynamic parameters of that model in vivo, and, most difficult, (iii)
uncertainty regarding what other processes may impact the part operation. In this latter
class, for cellular systems, there are likely a bevy of direct interactions and interferences
with currently uncharacterized or unknown cellular processes not included in the model,
and then indirect effects on cellular resources affecting fitness and stability of the host.
It is inevitable, therefore, that though the known physics will inform and constrain the
model for the part and its interactions with other cellular factors, there will likely have to
be some leeway for modeling interactions for which there is no known mechanism. A
low order regression model is a good approximation for most cases and this is what we
have presented here for gene expression parts. Such an approach is also what has been
used in representing classical sequence/structure/activity relationships with proven
industrial utility9, 10. Such models are most useful when the part classes are limited and
the number of factors being considered is relatively small (i.e., a main effect plus a small
number of interactions). Different classes of elements are likely to have different modes
of interaction with other elements and thus make the model more complex to capture all
possibilities. Stated differently, it is easier to parameterize such models when the part
classes used to vary a functional feature, say translation initiation, have like mechanisms
such that similar underlying models can be used to describe part performance. Once a
class of models exist for a given part family along with an understanding of possible
context mediators (i.e., interactions amongst parts, the cellular context, and external
environment) and the activity variables one wishes to track, it is possible to calculate how
the process of characterizing parts scales (to some degree).
In the example developed here, we use mRNA levels and total protein fluorescence as
activity variables and two classes (parts families) of gene expression controllers (i.e.,
“promoter” and “5’ UTR”) that we assert affect mostly transcription and translation
initiation, respectively, with some additional effect on mRNA stability by both part
classes. There are also two context mediators: interaction amongst parts and the gene they
are driving, and the temperature change tested here. We use a factorial ANOVA to
analyze how all variables impact mRNA and protein values to derive the estimated
Nature Methods: doi:10.1038/nmeth.2403

23
activities of parts (ANOVA main effects) and interactions. The form of the model and the
goal of using such a model to estimate part scores leads to questions re: how many
constructs must be measured to achieve a particular confidence in estimated scores.
Ideally, we would hope to have sets of parts that collectively represent of range of
activities. If we assume that the constructs to be assayed are drawn from a random
combinatorial library composed from such sets then we could ask how many of these we
would have to screen to derive canonical scores for the parts their interactions. For
factorial ANOVA-based models we can use standard formulas for a priori statistical
power to derive the number of constructs necessary to classify these scores into some
number of levels (Reference: Sample Size Calculations: Practical Methods for Engineers
and Scientists, Paul Matthews ISBN:0615324614). To use these formulas we need to
specify a desired maximum false positive and false negative rate and an expected effect
size. The effect size can be estimated from prior data or standard rules-of-thumb. For
example, we might expect to distinguish different “strengths” for each of the promoters
and UTRs assuming about five different distinguishable strengths for each and moderate
interactions among all elements. We then further assert two “levels” for the genes (RFP
and GFP). Thus, there are 5*5*2 groups. To reduce the probability of falsely identifying
two elements as identically strong to below 20% and a significance level of 0.05, we
would need approximately 200 randomly chosen individual constructs made from
representative promoters and UTRs. As the number of variables and levels increase, or
the effect sizes become smaller, or the required false positive and false negative rates
drop, the number of samples goes up rather rapidly and costs go up.
In this manuscript, the parts families are small and perhaps not entirely representative,
and we analyzed an exhaustive combinatorial library. While this approach ensures we
have scores for every element with the maximum statistical power possible given the size
of the families we started with, ultimately for these models to be the most useful we
would need three things.
First, it would be ideal for the parts families to be composed of members that were
mechanistically homogeneous (as noted above, so that the same model faithfully applies
to each element), represented a wide range of activities (as done here), and with as much
sequence variation as possible (to exercise all the possible idiosyncratic interactions with
other parts and context variables, akin as done here).
Second, these parts families should be engineered to have as well-insulated function as
possible (not done in this manuscript, but addressed in the accompanying manuscript11).
In the present case, for example, the promoter library had differing lengths of 5’ UTR at
one end thereby adding elements to the transcript that could affect mRNA stability and
Nature Methods: doi:10.1038/nmeth.2403

24
translation initiation. Similarly, there was a strong interaction between the 5’ UTR and
the downstream gene. Thus multiple features impacting mRNA and fluorescent protein
levels are changed by each member of the library leading to more complex interactions
and the need for a full factorial model. In Lei et al.12, for example, it is shown how
standardized transcript cleavage can insulate promoter and 5’UTR function and in the
companion paper to this manuscript11 we show how to insulate 5’UTR and gene function
thus simplifying the model, thereby theoretically reducing the amount of characterization
necessary.
Third, parts would be characterized in standard ways over the range of compositions and
contexts most useful for any particular application (in this manuscript we are focused on
supporting laboratory research as the application). Once an initial model is well
characterized, any new member of a part family can be effectively characterized with
many fewer samples than needed to create the initial part characterizations with some
cost in error (Figure 5, main text). Such efforts can be distributed outside a single facility
as long as individuals are following standard characterization protocols that don’t
exercise variables not captured in the central model, or if they do exercise such variables
they are captured effectively as metadata.
The entire cost for the process then is the cost to make and characterize the N samples
needed to realize the initial models (Supplementary Table 3). That is, the total cost is
N*((cost to make a construct)+(cost to assay)+(cost to process data)) + (cost to calculate
parameterized model). The latter term is usually negligible. Note that this representation
does not account for the cost to design standard biological parts that operate robustly and
homogeneously across changing contexts (see companion paper).
In summary, for ubiquitous functions like gene expression controllers, core metabolic
activities, and perhaps elements that target macromolecules to different locations or
processing machinery, it will be fruitful for BIOFABs to take on the bulk of the part
choice, composition design, and subsequent characterization. Individual variants not
present in BIOFAB libraries can then be characterized by individual users and made
useful to others by donating information to public domain repositories that use such data
to improve models. Specialty parts that are used in only a few applications will ultimately
fall into the domain of the particular stakeholder for those applications.
Nature Methods: doi:10.1038/nmeth.2403

25
References
1. Markham, N.R. & Zuker, M. UNAFold: software for nucleic acid folding and
hybridization. Methods Mol Biol 453, 3-31 (2008).
2. Lutz, R. & Bujard, H. Independent and tight regulation of transcriptional units in
Escherichia coli via the LacR/O, the TetR/O and AraC/I1-I2 regulatory elements.
Nucleic Acids Res 25, 1203-1210 (1997).
3. Hook-Barnard, I.G. & Hinton, D.M. Transcription initiation by mix and match
elements: flexibility for polymerase binding to bacterial promoters. Gene Regul Syst
Bio 1, 275-293 (2007).
4. Lee, T.S. et al. BglBrick vectors and datasheets: A synthetic biology platform for gene
expression. J Biol Eng 5, 12 (2011).
5. Ringquist, S. et al. Translation Initiation in Escherichia-Coli - Sequences within the
Ribosome-Binding Site. Mol Microbiol 6, 1219-1229 (1992).
6. Vimberg, V., Tats, A., Remm, M. & Tenson, T. Translation initiation region sequence
preferences in Escherichia coli. BMC Mol Biol 8, 100 (2007).
7. Kudla, G., Murray, A.W., Tollervey, D. & Plotkin, J.B. Coding-sequence determinants
of gene expression in Escherichia coli. Science 324, 255-258 (2009).
8. Zaslaver, A. et al. A comprehensive library of fluorescent transcriptional reporters
for Escherichia coli. Nat Methods 3, 623-628 (2006).
9. Perkins, R., Fang, H., Tong, W. & Welsh, W.J. Quantitative structure-activity
relationship methods: perspectives on drug discovery and toxicology. Environ
Toxicol Chem 22, 1666-1679 (2003).
10. Tong, W., Welsh, W.J., Shi, L., Fang, H. & Perkins, R. Structure-activity relationship
approaches and applications. Environ Toxicol Chem 22, 1680-1695 (2003).
11. Mutalik, V.K., Guimaraes, J. C., Cambray, G., Lam, C., Christoffersen, M. J., Mai, Q-A.,
Tran, A. B., Paull, M., Keasling, J. D., Arkin, A. P., Endy, D. Precise and Reliable Gene
Expression via Standard Transcription and Translation Initiation Elements. Nat
Methods (2013 (NMETH-A16594B)).
12. Qi, L., Haurwitz, R.E., Shao, W., Doudna, J.A. & Arkin, A.P. RNA processing enables
predictable programming of gene expression. Nat Biotechnol 30, 1002-1006 (2012).
Nature Methods: doi:10.1038/nmeth.2403