Museums in the Neighborhood: evaluating the socio-economic impact of museums Stephen Sheppard,...
12
Museums in the Neighborhood: evaluating the socio-economic impact of museums Stephen Sheppard, Williams College and C 3 D American Association of Museums Denver, Colorado April 30, 2008
-
date post
21-Dec-2015 -
Category
Documents
-
view
215 -
download
1
Transcript of Museums in the Neighborhood: evaluating the socio-economic impact of museums Stephen Sheppard,...

Museums in the Neighborhood: evaluating the socio-economic impact of museums
Stephen Sheppard, Williams College and C3D
American Association of MuseumsDenver, Colorado
April 30, 2008
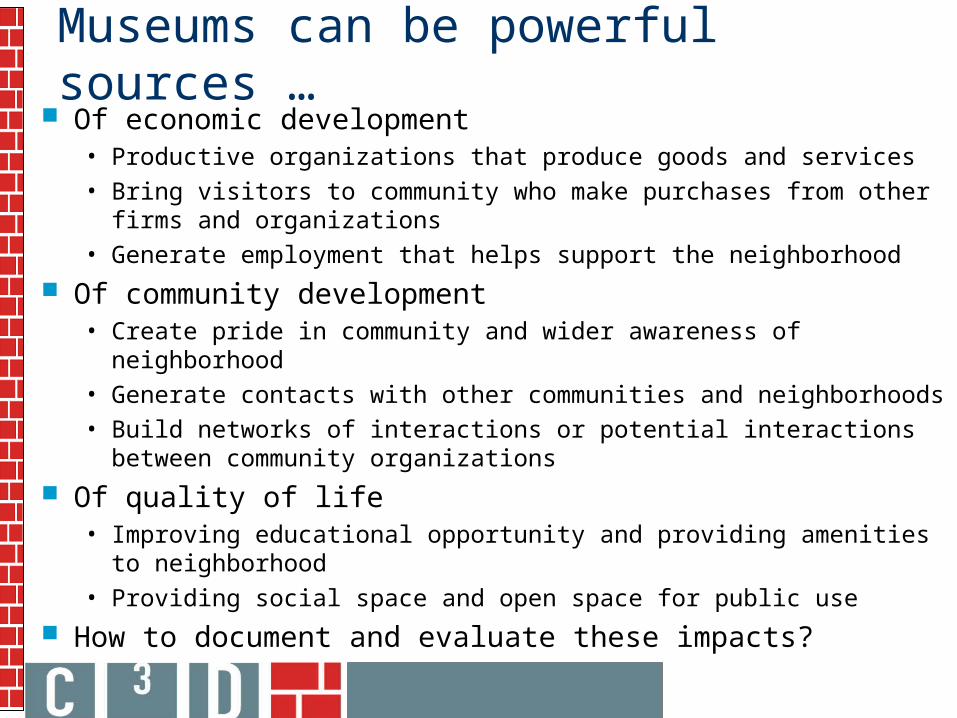
Museums can be powerful sources … Of economic development
• Productive organizations that produce goods and services
• Bring visitors to community who make purchases from other firms and organizations
• Generate employment that helps support the neighborhood
Of community development• Create pride in community and wider awareness of neighborhood
• Generate contacts with other communities and neighborhoods
• Build networks of interactions or potential interactions between community organizations
Of quality of life• Improving educational opportunity and providing amenities to neighborhood
• Providing social space and open space for public use
How to document and evaluate these impacts?

Income, employment, social network, quality of life Income and employment
• Attracting visitors and residents, purchasing inputs from local economy• Comparing museums with similarly sized establishments in other sectors
• Museums often generate MORE income and employment than manufacturing or business services
• Museums generally among the top 10 sectors
• Communities don’t generally have to choose one or the other Social Network
• Museums provide social space• Museums forge partnerships in community• Weaving the fabric of social network
Quality of Life• When quality of life improves, demand for neighborhood increases• Directly measured in additional value
• Relative to other neighborhoods in the urban area• Relative to time before museum opened or expanded

Income and employment generation
Museum Budget Non-Local Visitors Price Level
$4,500,000 65,000 2007
Direct Indirect Induced Total
Gallery and Other Programming $4,500,000 $2,202,567 $1,991,781 $8,694,348
Non-local Visitors $643,820 $116,967 $169,354 $930,141
Total $5,143,820 $2,319,534 $2,161,135 $9,624,489
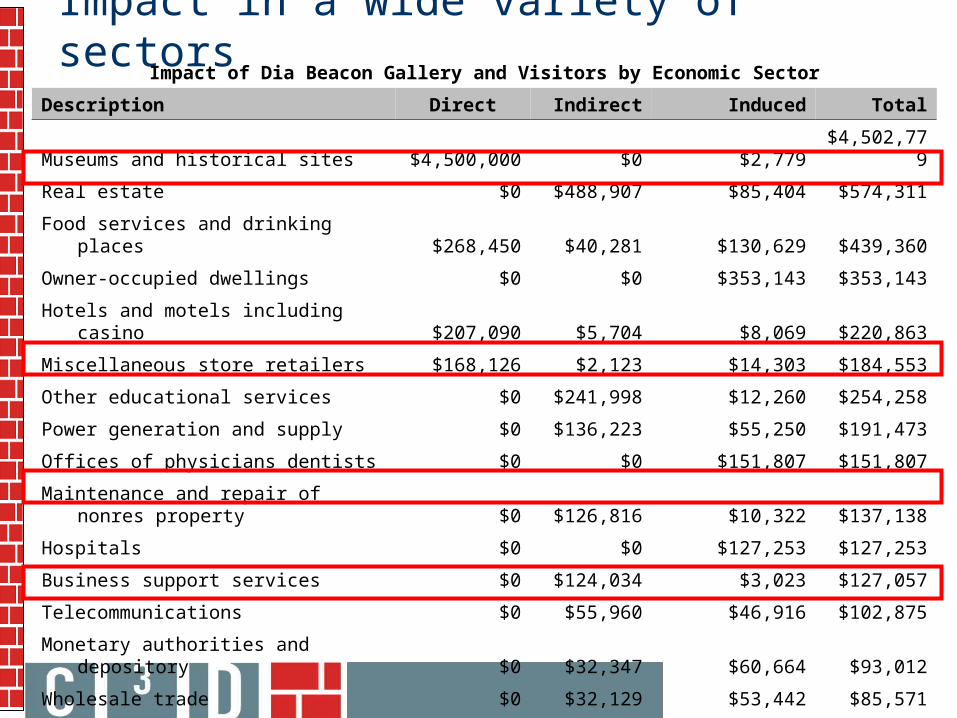
Impact in a wide variety of sectorsImpact of Dia Beacon Gallery and Visitors by Economic Sector
Description Direct Indirect Induced Total
Museums and historical sites $4,500,000 $0 $2,779 $4,502,779
Real estate $0 $488,907 $85,404 $574,311
Food services and drinking places $268,450 $40,281 $130,629 $439,360
Owner-occupied dwellings $0 $0 $353,143 $353,143
Hotels and motels including casino $207,090 $5,704 $8,069 $220,863
Miscellaneous store retailers $168,126 $2,123 $14,303 $184,553
Other educational services $0 $241,998 $12,260 $254,258
Power generation and supply $0 $136,223 $55,250 $191,473
Offices of physicians dentists $0 $0 $151,807 $151,807
Maintenance and repair of nonres property $0 $126,816 $10,322 $137,138
Hospitals $0 $0 $127,253 $127,253
Business support services $0 $124,034 $3,023 $127,057
Telecommunications $0 $55,960 $46,916 $102,875
Monetary authorities and depository $0 $32,347 $60,664 $93,012
Wholesale trade $0 $32,129 $53,442 $85,571
Services to buildings and dwellings $0 $74,687 $13,648 $88,335
Employment services $0 $76,852 $9,422 $86,275
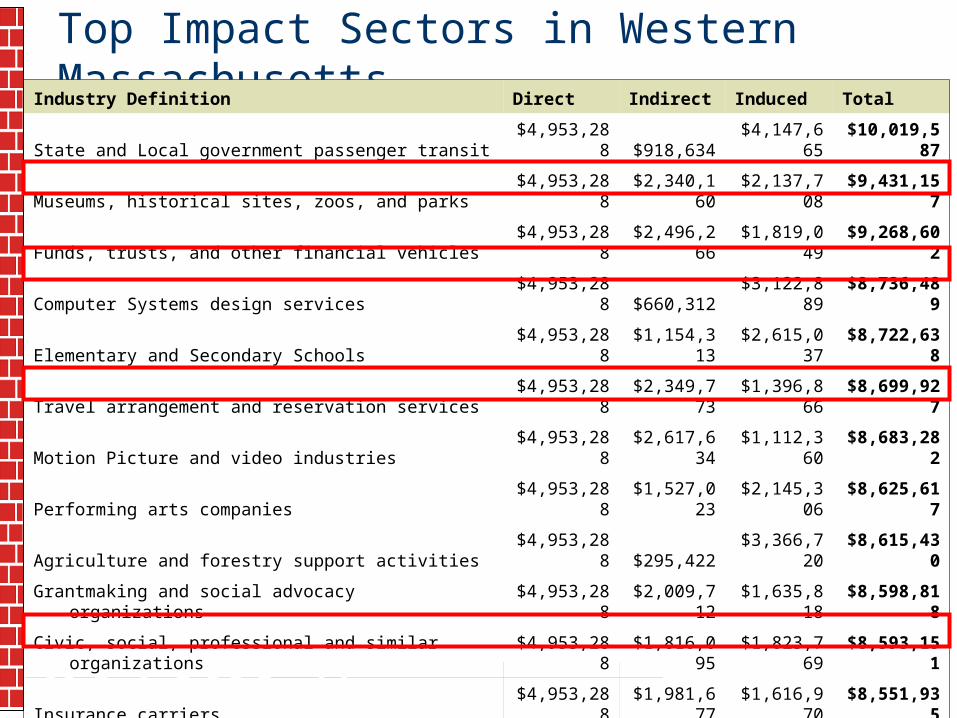
Top Impact Sectors in Western MassachusettsIndustry Definition Direct Indirect Induced Total
State and Local government passenger transit $4,953,288 $918,634 $4,147,665 $10,019,587
Museums, historical sites, zoos, and parks $4,953,288 $2,340,160 $2,137,708 $9,431,157
Funds, trusts, and other financial vehicles $4,953,288 $2,496,266 $1,819,049 $9,268,602
Computer Systems design services $4,953,288 $660,312 $3,122,889 $8,736,489
Elementary and Secondary Schools $4,953,288 $1,154,313 $2,615,037 $8,722,638
Travel arrangement and reservation services $4,953,288 $2,349,773 $1,396,866 $8,699,927
Motion Picture and video industries $4,953,288 $2,617,634 $1,112,360 $8,683,282
Performing arts companies $4,953,288 $1,527,023 $2,145,306 $8,625,617
Agriculture and forestry support activities $4,953,288 $295,422 $3,366,720 $8,615,430
Grantmaking and social advocacy organizations $4,953,288 $2,009,712 $1,635,818 $8,598,818
Civic, social, professional and similar organizations $4,953,288 $1,816,095 $1,823,769 $8,593,151
Insurance carriers $4,953,288 $1,981,677 $1,616,970 $8,551,935
Custom computer programming services $4,953,288 $545,368 $3,025,560 $8,524,216
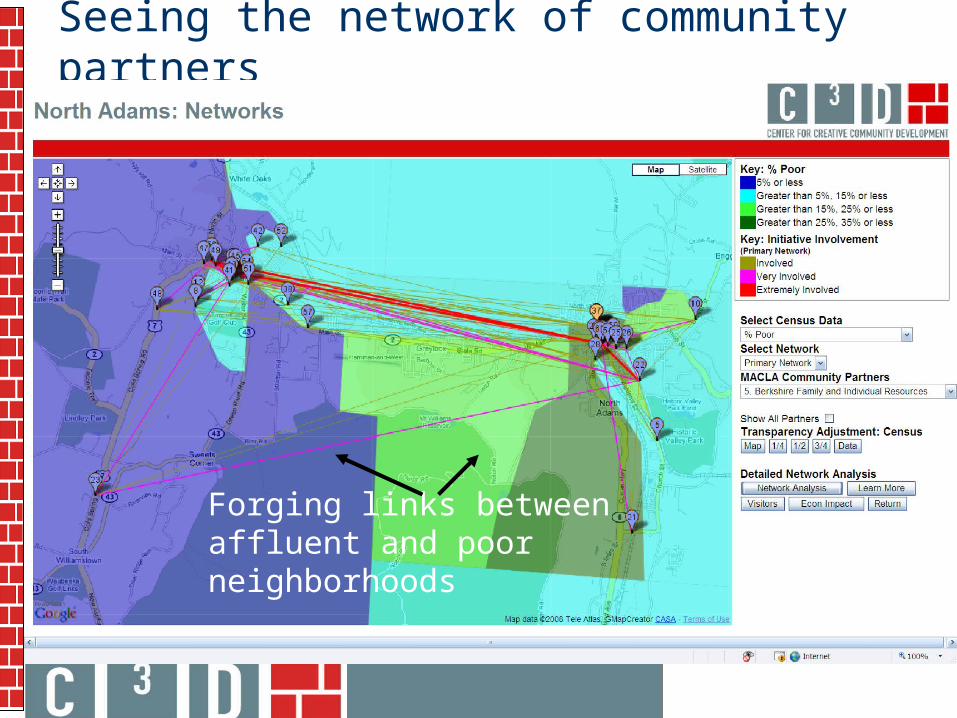
Seeing the network of community partners
Forging links between affluent and poor neighborhoods

Zoom in to see links between neighborhood groups

Improving quality of life

Improved QOL increases demand for neighborhood
Larger impacts for neighborhoods closest to museum

Conclusions While the exact amounts vary, all of the museums we
have studied show:• Positive local economic impacts for income and employment• Impacts that compare favorably to other economic sectors for
comparable organizations• Powerful abilities to forge social networks between different
groups and different neighborhoods• Positive impacts on local quality of life that increase the
demand for residence in the neighborhood• Contributions to wealth creation in the community
These findings have important implications for museums• Motivation for local financial support for museum• Socio-Economic health of community can be an important part
of museum mission

C3D Toolkit: http://www.c-3-d.org/Toolkit