MUSCLE ACTIVATION, AND KNEE INTERNAL …libres.uncg.edu/ir/uncg/f/umi-uncg-1217.pdf · muscle...
158
SHIMOKOCHI, YOHEI, PhD, The Moderating Effect of Tibialis Anterior Fatigue Protocol on the Relationships between Rearfoot Eversion, Thigh Muscle Activation, and Knee Internal Rotation during a Single Leg Forward Jump Stop Task. (2006) Directed by Dr. Sandra J. Shultz. pp158. Objective: To examine the moderating effect of tibialis anterior muscle fatigue protocol on the relationships between rearfoot eversion, thigh muscle activation, and knee internal rotation during a single leg forward jump stop task. Subjects: 72 recreationally active healthy individuals (age = 23.8, ht = 168.9cm, and mass = 70.9kg) Methods: Subjects performed a single leg forward jump stop task before and after a tibialis anterior muscle (TA) fatiguing protocol. TA fatigue was induced through dorsiflexion exercise by lifting 5% of subject’s body weight using a pulley system. During the jump stop task, kinematic and thigh muscle activation data were obtained using an electromagnetic tracking system and surface electromyography (sEMG). Knee internal rotation excursion (KIRexc), rearfoot eversion excursion at peak knee internal rotation (EV KIRexc ), and sEMG percent RMS amplitudes of vastus lateraris (%VL), biceps femoris (%BF), and semitendinosus (%ST) 150ms before touch down were obtained during the jump stop task before and after the fatiguing protocol. Path analyses examined the extent to which EV KIRexc and thigh muscle activations predicted KIRexc in pre- and post-fatigue conditions. A paired sample t-test examined if TA fatigue would increase total rearfoot eversion (EVexc) and KIRexc in the post-fatigue condition as compared to the pre-fatigue condition. Results: TA fatigue did not increase EVexc or KIRexc. Path analyses revealed that although no relationships were found between EV KIRexc , %VL, BF, or ST and KIRexc in the pre-fatigue condition, %VL
Transcript of MUSCLE ACTIVATION, AND KNEE INTERNAL …libres.uncg.edu/ir/uncg/f/umi-uncg-1217.pdf · muscle...

SHIMOKOCHI, YOHEI, PhD, The Moderating Effect of Tibialis Anterior Fatigue Protocol on the Relationships between Rearfoot Eversion, Thigh Muscle Activation, and Knee Internal Rotation during a Single Leg Forward Jump Stop Task. (2006) Directed by Dr. Sandra J. Shultz. pp158.
Objective: To examine the moderating effect of tibialis anterior muscle fatigue protocol on
the relationships between rearfoot eversion, thigh muscle activation, and knee internal
rotation during a single leg forward jump stop task. Subjects: 72 recreationally active
healthy individuals (age = 23.8, ht = 168.9cm, and mass = 70.9kg) Methods: Subjects
performed a single leg forward jump stop task before and after a tibialis anterior muscle
(TA) fatiguing protocol. TA fatigue was induced through dorsiflexion exercise by lifting
5% of subject’s body weight using a pulley system. During the jump stop task, kinematic
and thigh muscle activation data were obtained using an electromagnetic tracking system
and surface electromyography (sEMG). Knee internal rotation excursion (KIRexc), rearfoot
eversion excursion at peak knee internal rotation (EVKIRexc), and sEMG percent RMS
amplitudes of vastus lateraris (%VL), biceps femoris (%BF), and semitendinosus (%ST)
150ms before touch down were obtained during the jump stop task before and after the
fatiguing protocol. Path analyses examined the extent to which EVKIRexc and thigh muscle
activations predicted KIRexc in pre- and post-fatigue conditions. A paired sample t-test
examined if TA fatigue would increase total rearfoot eversion (EVexc) and KIRexc in the
post-fatigue condition as compared to the pre-fatigue condition. Results: TA fatigue did not
increase EVexc or KIRexc. Path analyses revealed that although no relationships were
found between EVKIRexc, %VL, BF, or ST and KIRexc in the pre-fatigue condition, %VL

ii
was significantly related with KIRexc in post-fatigue condition. Conclusions: The primary
results revealed that TA fatigue did not change either rearfoot eversion or knee internal
rotation motion, and the only association found was between post-fatigue quadriceps
muscle activation and knee internal rotation motion. Considering the ACL injury
mechanism, these findings support the importance of preventing excessive quadriceps
contraction to prevent excessive knee internal rotation, but calls into question the
theoretical connection between excessive rearfoot eversion, increased knee internal
rotation, and ACL injury risk. However, these findings are limited to a single leg forward
jump stop task, and the theoretical connections between rearfoot eversion, knee internal
rotation and ACL injury risk during other functionally relevant dynamic tasks should be
evaluated.

THE MODERATING EFFECT OF TIBIALIS ANTERIOR FATIGUE PROTOCOL
ON THE RELATIONSHIPS BETWEEN REARFOOT EVERSION, THIGH
MUSCLE ACTIVATION, AND KNEE INTERNAL ROTATION
DURING A SINGLE LEG FORWARD JUMP STOP TASK
By
Yohei Shimokochi
A Dissertation Defense Submitted to the Faculty of The Graduate School at
The University of North Carolina at Greensboro in Partial Fulfillment
of the Requirements for the Degree Doctor of Philosophy
Greensboro 2006
Approved by
_________________________________________ Committee Chair: Sandra J. Shultz

ii
To my wife Makiko
Your patient support and understanding made this accomplishment possible

iii
APPROVAL PAGE This dissertation has been approved by the following committee of the Faculty of The Graduate School at the University of North Carolina at Greensboro.
Committee Chair______________________________________
Committee Members______________________________________ _______________________________________ _______________________________________ _______________________________________
Date of Acceptance by Committee Date of Final Oral Examination

iv
ACKNOWLEDGMENTS
I wish to express my special acknowledgement to my advicer Dr. Sandra J Shultz
for her devotion to mentoring and supporting me throughout my doctoral course. I also
wish to thank my entire dissertation committee Dr. David H Perrin, Dr. Allan H
Goldfarb, Dr. Randy J Schmitz, and Dr. Richard M Luecht, for their patient support.

v
TABLE OF CONTENTS Page
LIST OF TABLES........................................................................................................... viii
LIST OF FIGURES ........................................................................................................... ix
CHAPTER
I. INTRODUCTION................................................................................................ 1
Purpose........................................................................................................ 4 Hypothesis................................................................................................... 4 Assumptions and Delimitations .................................................................. 5 Limitations .................................................................................................. 5 Operational Definitions...............................................................................6
II. REVIEW OF LITERATURE............................................................................... 9
Mechanisms of ACL Injury and ACL Loading Patterns ............................ 9 Retrospective Analyses................................................................. 10 Video and Photographic Analyses ................................................ 14 ACL Loading Patterns with Application of External Loads......... 15
Anterior Shear Forces....................................................... 17 Quadriceps and Hamstrings Muscle Contractions........... 18 Torques in Frontal and Transverse Planes ...................... 20 ACL Loading Patterns In Vivo during Closed Kinetic
Chain Exercises ............................................................. 23 ACL Loading Estimated by the Computer Simulations ............... 25 Conclusions................................................................................... 27
Factors that may Influence Transverse Plane Kinetics and Kinematics .. 29 Motion Transfer from Rearfoot Eversion to Tibial Internal
Rotation...................................................................................... 29 Theoretical Background.................................................... 29 Inter-Individual Differences.............................................. 30 Motion Transfer Ratio in Static Stance............................. 33 Motion Ttransfer during Dynamic Motions ...................... 34 Effects of Rearfoot Eversion on Knee Internal Rotation .. 35
Quadriceps Muscle Contraction.................................................... 37 Cadaver Studies ................................................................ 37 In Vivo Dynamic Motions ................................................. 38
Hamstring Muscle Contractions ................................................... 39 Conclusion .................................................................................... 41
Muscle Control in Rearfoot Eversion ....................................................... 42

vi
Local Muscle Fatigue as a Model to Investigate the Effects of Muscle Weakness ............................................................................................... 44
Summary................................................................................................... 45
III. METHODS ........................................................................................................ 47
Design ....................................................................................................... 47 Subjects ..................................................................................................... 47 Instrumentation ......................................................................................... 48
Kinetic and Kinematic Data Acquisition ...................................... 48 Surface EMG ................................................................................ 49 Maximal Voluntary Isometric Contraction................................... 49 Pulley System for Fatiguing Exercise........................................... 50
Protocol ..................................................................................................... 52 Single-leg Forward Jump Stop Task............................................. 54 sEMG Placement and Recording of sEMG Signal ....................... 55 Digitization of the Lower Extremities for Kinematic Analysis .... 56 TA Fatigue Protocol and Pre- and Post-Fatigue MVIC
Measurements ............................................................................ 57 Time Window for Post-Fatigue Data Acquisition .................................... 59 Data Collection/Reduction........................................................................ 61
Kinetic and Kinematic Data Processing ....................................... 61 sEMG Data Processing ................................................................. 62
Statistical Analyses ................................................................................... 64
IV. RESULTS.......................................................................................................... 70
Reliability and Validity of the TA Fatigue Protocol................................. 70 Predicting Knee Internal Rotation from Rearfoot Eversion and Thigh
Muscle Activation (Hypothesis 1) ......................................................... 73 Effect of Tibialis Anterior Fatigue on Knee Internal Rotation and
Rearfoot Eversion (Hypothesis 2).......................................................... 75 The Relationship between Tibialis Anterior Muscle Fatigue and
Rearfoot Eversion (Hypothesis 3).......................................................... 75 Factors Influencing Knee Internal Rotation Following Tibialis Anterior
Muscle Fatigue (Hypothesis 4) .............................................................. 79
V. DISCUSSION .................................................................................................... 83
The Relationship of Knee Internal Rotation with Rearfoot Eversion and Thigh Muscle Activation ....................................................................... 83
The Relationship between Rearfoot Eversion and Knee Internal Rotation...................................................................................... 84
Clinical Implications......................................................... 89 The Relationship between Thigh Muscle Activations and Knee
Internal Rotation ........................................................................ 90

vii
The Effect of Tibialis Anterior Fatigue on Knee Internal Rotation and Eversion ................................................................................................. 92
The Relationship of Knee Internal Rotation with Rearfoot Eversion and Thigh Muscle Activation in the Post-fatigue Condition........................ 96
Limitations ................................................................................................ 98 Conclusions............................................................................................. 102
REFERENCES ............................................................................................................... 104
APPENDIX A. SUBJECT DATA SHEET .................................................................... 114
APPENDIX B. LISREL SYNTAX AND OUTPUT FOR HYPOTHESIS 1................. 115
APPENDIX C. SPSS OUTPUT FOR HYPOTHESIS 2 ................................................ 119
APPENDIX D. LISREL SYNTAX AND OUTPUT FOR HYPOTHESES 3 AND 4... 120
APPENDIX E. IRB APPROVED FORM ...................................................................... 129
APPENDIX F. IRB APPROVED CONSENT FORM................................................... 130
APPENDIX G. RAW DATA ......................................................................................... 133

viii
LIST OF TABLES
Page
Table 1. Mechanisms of ACL Injuries Described by Previous Studies............................ 11
Table 2. Absolute and Relative Maximal Voluntary Isometric Contraction Force and Median Power Frequency in Pre- and Post-fatigue Measurements. ............... 60
Table 3. Means ± SDs and Ranges for Kinematics, Strength, and sEMG Variables in
Pre- and Post-fatigue Conditions .................................................................... 71 Table 4. Mean ± SD, Intraclass Correlation Coefficients, and Standard Error of the
Measurements for Fatigue Related Variables ................................................. 72 Table 5. Comparison of Normalized RMS Amplitudes of the Vastus Lateraris,
Semitendinosus, and Biceps Femoris during Last 5 Repetitions of the First, Middle, and Last Sets of the Tibialis Anterior Fatiguing Exercise................. 74
Table 6. Unstandardized and Standardized Path Coefficients When Predicting Knee
Internal Rotation Excursion from Rearfoot Eversion Motion and Thigh Muscle Activation in Pre-fatigue Condition................................................... 76
Table 7. Unstandardized and Standardized Path Coefficients When Predicting Eversion
Excursion in the Post-fatigue Condition ......................................................... 77 Table 8. Structural Equation Model Fit Indices for Pre- and Post-fatigue Condition
Together .......................................................................................................... 80 Table 9. Unstandardized and Standardized Path Coefficients When Predicting Post-
Fatigue Knee Internal Rotation Excursion...................................................... 81

ix
LIST OF FIGURES
Page
Figure 1. Sagittal View of the Pulley System to Fatigue the Tibialis Aterior Muscle ..... 51
Figure 2. Superior View of the Pulley System. ................................................................ 53
Figure 3. Path Diagram Showing Interrelationships Between the Predictor and Dependent Variables. ...................................................................................... 66

1
CHAPTER I
INTRODUCTION
The mechanism(s) for anterior cruciate ligament (ACL) injury is often described
as a sudden deceleration, such as a sudden jump stop during forward running (Boden,
Dean, Feagin, & Garrett Jr, 2000). Theoretically, this quick decelerating movement
increases quadriceps contraction force, which may increase the amount of ACL loading
especially during shallow knee flexion angles (Arms et al., 1984; Beynnon et al., 1997;
Markolf, O'Neil, Jackson, & McAllister, 2004). ACL loading may be further increased
when the quadriceps contraction force is accompanied by excessive tibial internal
rotation relative to the femur (knee internal rotation) (Arms et al., 1984). Nyland et al.
(1997) reported that knee internal rotation occurs during the early stance phase when
decelerating from forward running, and ACL injured individuals often described a
mechanism of injury with excessive tibial internal rotation (presumably at the knee) at a
shallow knee flexion angle (McNair, Marshall, & Matheson, 1990). Hence, preventing
excessive knee internal rotation during sudden deceleration appears to be a key factor in
preventing ACL injuries. However, only a few studies have specifically addressed this
biomechanical issue (Nyland, Caborn, Shapiro, & Johnson, 1999; Nyland et al., 1997).
Factors that may influence knee internal rotation during weight bearing with a
shallow knee flexion angle include rearfoot eversion (lateral rotation of the calcaneus

2
relative to the tibia), and co-activation of the quadriceps and hamstrings muscles. In
particular, the influence of foot motion (i.e. rearfoot eversion) has received little
attention.
Obligatory motion transfer occurs from rearfoot eversion to tibial internal rotation
relative to the foot (tibial internal rotation) (V. T. Inman, 1976), as evidenced by a high
correlation observed between rearfoot eversion and tibial internal rotation (Nigg, Cole, &
Nachbauer, 1993). Because of this coupling link between rearfoot eversion and tibial
internal rotation, it has been hypothesized that excessive pronation may also lead to
excessive knee internal rotation, thereby increasing ACL tensile force and the potential
for injury risk (Beckett, Massie, Bowers, & Stoll, 1992; Loudon, Jenkins, & Loudon,
1996; Woodford-Rogers, Cyphert, & Denegar, 1994). While this theory is supported by
studies that have found increased ankle pronation (measured by navicular drop) in ACL
injured versus non-injured individuals (Beckett et al., 1992; Loudon et al., 1996;
Woodford-Rogers et al., 1994), biomechanical studies have not demonstrated this transfer
of motion to the knee (Lafortune, Cavanagh, Sommer, & Kalenak, 1994; McClay &
Manal, 1997). However, studies to date have been limited to very small sample sizes,
and it is possible that low statistical power and relatively large subject variability led to a
lack of significant findings. Further, this relationship was studied during normal gait, and
findings may be different under more dynamic, high force attenuating activities.
When examining the effect of rearfoot eversion on the knee internal rotation, it is
also important to consider the active muscle forces acting on the ankle and knee joint.
The importance of the quadriceps and hamstrings muscles in controlling the amount of

3
knee internal rotation has been demonstrated by several studies (Baratta et al., 1988;
DeMorat, Weinhold, Blackburn, Chudik, & Garrett, 2004; Hirokawa, Solomonow, Lu,
Lou, & D'ambrosia, 1992; MacWilliams, Wilson, DesJardins, Romero, & Chao, 1999;
Solomonow et al., 1987). Less is known about the role of distal musculature acting on
the ankle. As rearfoot eversion may potentially influence knee internal rotation, the ankle
musculature may play an important role in controlling rearfoot eversion, possibly
influencing knee internal rotation. In particular, the tibialis anterior muscle regulates the
amount of rearfoot eversion and plantar flexion of the subtalar and talocrural joints
because of its inversion and dorsiflexion moment arms (Klein, Mattys, & Rooze, 1996).
Previous studies have shown that especially during heel to toe landing motions (e.g.
during a forward jump stop, running, or walking), the tibialis anterior muscle is most
active immediately after heel contact (Cornwall & Mcpoil, 1994; Elliott & Blanksby,
1979; Hunt, Smith, & Torode, 2001). These studies suggest that the tibialis anterior
muscle plays a primary role in decelerating plantar flexion movement during a heel-to-toe
landing upon heel contact, and contributes to controlling the amount of eversion. In fact,
studies have demonstrated that activation of the tibialis anterior muscle coincides with the
rate of rearfoot eversion during the stance phase of walking (Cornwall & Mcpoil, 1994),
and that isokinetic strengthening of the inverter muscle group significantly reduces the
amount of rearfoot eversion during running (Feltner et al., 1994).
A review of the literature has revealed no published studies that have investigated
the relationship between the ankle musculature, rearfoot eversion and the amount of knee
internal rotation. Isolated fatigue of a muscle or muscle group has been previously used

4
as an effective method to determine the role of a particular muscle or muscle group
during dynamic motion (Nyland et al., 1997; Rodacki, Fowler, & Bennett, 2002).
Comparing the amount of rearfoot eversion and knee internal rotation before and after
tibialis anterior muscle fatigue can improve our understanding of how the tibialis anterior
muscle functions to control rearfoot eversion and therefore knee internal rotation during a
dynamic task. Understanding how the ankle musculature affects knee biomechanics may
help us improve our ACL rehabilitation/prevention strategies.
Purpose
The primary purpose of this study was to examine the moderating effect of tibialis anterior
fatigue protocol on the relationships between rearfoot eversion, thigh muscle activation, and
knee internal rotation during a single leg forward jump stop task.
Hypothesis
Hypothesis 1: Greater rearfoot eversion and quadriceps muscle activation and lesser
hamstrings muscle activations will be related to greater knee internal rotation in the pre-
fatigue condition.
Hypothesis 2: Peak rearfoot eversion and knee internal rotation will increase during the
landing task after tibialis anterior muscle fatigue.
Hypothesis 3: Greater tibialis anterior muscle fatigue, as measured by MVIC force, will
be related to greater rearfoot eversion in the post-fatigue condition.

5
Hypothesis 4: Tibialis anterior muscle fatigue will have an indirect effect on knee internal
rotation via an increase in rearfoot eversion. Specifically, it is expected that greater
rearfoot eversion following fatigue will lead to greater knee internal rotation compared to
the pre-fatigue condition, once thigh muscle activation is accounted for.
Assumptions and Delimitations
1. Healthy, recreationally active people between the ages of 18 and 35 were studied.
2. A single-leg forward jump stop was studied
3. Position and ground reaction force data obtained from an electromagnetic tracking
system and a non-conductive force plate were valid and reliable measures of
lower extremity kinematics and kinetics.
4. Activation amplitude, as measured by surface electromyography was sufficiently
reliable and sensitive to identify changes in muscle activation from pre to post
tibialis anterior muscle fatigue.
Limitations
1. The results from this dissertation cannot be generalized to populations other than
healthy, recreationally active people between the ages of 18 and 35.
2. Changes in muscle function following fatiguing exercise of the tibialis anterior
muscle may not be limited to the tibialis anterior muscle due to compensatory
muscle contractions and/or contraction of other dorsiflexor muscles.
3. The results from this dissertation cannot be generalized to other types of dynamic
motions.

6
4. Strain on the ACL as a result of change in knee internal rotation cannot be
directly measured in this study.
5. While sEMG is a valid measure of muscle activation, it is not a direct measure of
muscle force.
Operational Definitions
Dominant leg – The stance leg when kicking a ball.
Healthy – No history of ligament injury or surgery, no history of injury or chronic
pain in either lower extremity for the past 6 months, no neuromuscular disease, and
no other health problems that hinder the subject’s ability to perform the fatiguing
exercise or jump stop task used in this study.
Hip flexion (extension) – Sagittal plane femoral rotation about the medial-lateral axis
of the local coordinate system fixed on the sacrum. Positive direction was defined as
hip flexion.
Initial foot contact of landing – The moment at which the vertical ground reaction
force exceeded or becames equivalent to 10N.
Knee flexion (extension) – Sagittal plane femoral rotation about the medial-lateral
axis of the local coordinate system fixed on the shank segment. The positive
direction was defined as knee flexion.
Knee internal (external) rotation – Medial (lateral) transverse plane tibial rotation
about the superior-inferior axis of the local coordinate system fixed on the thigh
segment. Positive direction was defined as knee internal rotation.

7
Tibialis Anterior maximal isometric contraction force – The peak isometric force
obtained during ankle dorsiflexion and inversion while the ankle was connected to the
foot plate and position in neutral.
Maximum RMS amplitude – The maximum root means square (RMS) signal
obtained during a maximal voluntary isometric contraction.
Mean RMS amplitude – The mean amplitude of muscle activation 150ms before the
time of foot contact. This value represented the ensemble average over the 5
successful trials, expressed as a percentage of the maximum signal obtained during a
maximal voluntary isometric contraction.
Tibialis Anterior Muscle Fatigue – The temporal decline in the performance capacity
of tibialis anterior muscle after being activated for a certain period of time.
Specfically, this demonstrated by a failure to lift 5% of body weight through a full
range of motion for three consecutive trials. Tibialis anterior muscle fatigue was
expressed as percentage decline in the maximal isometric contraction force after task
failure compared with the pre-fatigue maximal isometric contraction force.
Peak hip flexion angle – The ensemble average of initial peak hip flexion angle after
foot contact across 5 trials of the jump stop tasks.
Peak knee internal rotation – The initial peak knee internal rotation angle after foot
contact during a jump stop task.
Knee internal rotation excursion – The ensemble average of the amounts of excursion
of knee internal rotation from the touch down to peak knee internal rotation across 5
trials of a jump stop task.

8
Rearfoot eversion (inversion) – Frontal plane lateral (medial) calcaneal rotation about
the anterior-posterior axis of the local coordinate system fixed on the shank segment.
Positive direction will be defined as ankle inversion.
Rearfoot eversion at peak knee internal rotation – The ensemble average of ankle
eversion angle at the moment of peak knee internal rotation angle across 5 trials of
the jump stop task.
Peak rearfoot eversion angle – The initial peak ankle eversion angle after foot contact
from the touch down to the maximum knee flexion angle during a jump stop task.
Rearfoot eversion excursion – The ensemble average of the amount of rearfoot
excursion from the touch down to peak rearfoot eversion across 5 trials of a jump stop
task.
Recreationally active – An individual who exercises at least 3 times a week for 30
minutes and does not participate in competitive sports such as professional or
intercollegiate sports.
Task Failure – The inability to complete a pre-determined full range of motion for 3
consecutive repetitions
Tibial internal (external) rotation – Medial (lateral) transverse plane tibial rotation
about the superior-inferior axis of the local coordinate system fixed on the foot
segment.

9
CHAPTER II
REVIEW OF LITERATURE
This review of literature will discuss the theoretical connections of how tibialis
anterior muscle function and rearfoot eversion may affect the amount of tibial internal
rotation relative to the femur (knee internal rotation) and potentially increase ACL injury
risk. Based on the findings from previous studies, the mechanisms of ACL injury will be
discussed first. Secondly, the role of knee internal rotation in ACL injury will be
explained, as well as the factors that may control this motion. A theoretical model of the
contributions of the tibialis anterior muscle in controlling rearfoot eversion and the
amount of knee internal rotation will then be presented. In this review, knee internal
rotation is specifically defined as tibial internal rotation relative to the femur, while tibial
internal rotation is defined as tibial internal rotation relative to the foot. Rearfoot
eversion is defined as calcaneal lateral rotation about the anterior-posterior axis of the
shank.
Mechanisms of ACL Injury and ACL Loading Patterns
Mechanisms of ACL injury have been investigated by different models including
retrospective studies and video or photographic analyses. However, due to limitations in
these studies, it is not possible to directly determine how the ACL is injured. Therefore,
mathematical modeling such as computer simulations and studies that measured ACL

10
loading patterns in vivo and vitro have also been used to examine what external loads
stress the ACL. Collectively, these studies help describe the ACL injury mechanism(s).
Retrospective Analyses
Mechanisms of ACL injury have been retrospectively investigated usually by
interviewing ACL injured people (Boden et al., 2000; Ferretti, Papandrea, Conteduca, &
Mariani, 1992; Lightfoot, Mckinley, Doyle, & Amendola, 2005; Olsen, Myklebust,
Engebretsen, Holme, & Bahr, 2003) and reviewing their medical charts (Warren &
Marshall, 1978). Table 1 describes the findings from these studies. As one can see from
the table, most of the injuries occur with non-contact mechanisms, such as landing from a
jump and decelerating the body while running with and without a change in direction.
Very often, a combined motion (rather than a single planar motion) occurs at the time of
injury. For example, in many cases, it is thought that the knee goes into excessive valgus
with the knee in either internal or external rotation while the knee is hyperextended or in
a shallow knee flexion angle (i.e. 20º) (McNair et al., 1990). Therefore, the occurrence of
ACL injuries is most likely the result of knee loading in multiple planes when the knee is
near full extension.
There are some limitations when using retrospective studies. All the information
about the mechanisms of ACL injuries depends on the subject’s recall and senses to
describe the positions of each segment at the time of the injury. Boden et al. (2000)
reported that the time of interview was on average 3.4 years after the occurrence of the
injury (range 1 day – 30.3 years). With this range in time delay, it is questionable
whether all subjects can accurately recall the exact mechanisms or the position of their

11
Table 1. Mechanisms of ACL Injuries Described by Previous Studies.
Authors Methods Populations Mechanisms of ACL injuries Warren and Marshall 1978
Review of medical charts 53 patients who sustained ACL/MCL injury during skiing
• 33 cases: VL force with KER loading • 6 cases: KIR with HyprExt and VR force
o 4 of these fell forward resulting in HyprExt and KIR
• 12 cases: VL force without rotation • 2 cases: HyprExt
McNair et al. 1990 Interview 23 subjects with unilateral isolated
ACL injury • 16 cases (70%): noncontact situations • 7 cases: contact situations with other players • 19 subjects (83%) recalled the MOI
o 10 cases (53%): Kflx angle between 20º and full Ext with excessive KIR
o 4 cases (21%): similar Kflx angle as above with KER
o 3 cases (16%): HyprExt o 1 case: HyprExt with KIR o 1case: HyprExt with KER
Ferretti et al. 1992 Interview 52 volleyball players at various
levels in the National Championship • Most of the injuries happen during jumping
(48 cases with only 2 contact MOI) • 38 cases: “Twisting injury” during landing
phase • 7 cases: “Twisting injury” during takeoff • 22 cases: KER + VL loading • 21 cases: KIR + VL loading
Boden et al. 2000 Interview 65 men (72 ACL injured knees) and 25 women (28 knees)
• 71 cases (72%): noncontact MOI • 21 cases (28%): contact MOI • 38 knees: Deceleration during or just before a
change in direction • 26 knees: Landing after jumping • 2 knees: HyprExt
11

12
• 1 knee: backward fall • 1 knee: “combination mechanism” • 1 knee: unclassified
Olsen et al. 2003 Interview 53 Norwegian handball players • 19 cases: Plant and cut • 16 cases: Landing from a jump shot • No other information available
Lightfoot et al. 2005 Interview 6 collegiate wrestlers • Wrestler 1: HyprExt • Wrestler 2: KER with foot planted, and
opponent fell, applying VL stress • Wrestler 3: In the disadvantage position; his
leg was lifted with knee flexed, and VL stress applied
• Wrestler 4: Weight bearing leg was twisted and gave out
• Wrestler 5: no exact description • Wrestler 6: knee twisted • All cases except for wrestler 3 happened
during takedowns Ireland 1999 Qualitative analyses of still
photographs 2 cases • Hip slightly abducted position, then internally
rotated as tibia externally rotated relative to the femur and foot pronated, = “valgus collapse”
Boden et al. 2000 Video qualitative analyses 16 men and 7 women • Noncontact: 65% • Contact: 35% • 6 knees (40%): Sharp decelerations with a
change in direction • 4 knees (27%): Sharp decelerations without a
change in direction • 3 knees (20%): Landing on one leg • 2 knees (13%): Landing on 2 legs
o VL collapse observed during decelerations with a change in direction and landing on one leg in most cases
o No VL collapse were observed during a
12

13
sudden deceleration without a change in direction and 2 leg landing
• In many deceleration mechanisms, the hip joint in the injured leg was in the neutral position while leaning backward.
Olsen et al. 2004 Video qualitative analyses using TV station archives by 3 knee experts (MDs with clinical and research experience)
12 Norwegian female handball players
• Many of the players were perturbed (out of balance, pushed or held by an opponent, or trying to evade a collision with an opponent)
• 12 cases: plant and cut o 4 cases: 2 foot push off o 8 cases: 1 foot pushoff o All happen in shallow Kflx (between 5
and 25º) and VL (between 5-20º) at the time of injury in all cases
o 7 out of 12 cases: 5-15º of KIR o 5 out of 12 cases 5-10º of KER
• 4 cases: a single-leg landing from a jump shot with 5-10º of KER and VL
• 2 cases: decelerating without changing direction with 10º of KER and VL
• 1 case: running with 10º of KER and VL MOI = mechanism of injury, KIR = knee internal rotation, KER = knee external rotation, VL = knee valgus, VR = knee varus,
Kflx = knee flexion, HyprExt = hyperextension of the knee
13

14
body at the time of injury. This may be true especially for small motions such as knee
internal/external rotation. Because of these reasons, descriptions of the ACL injury
mechanism are often vague (Boden et al., 2000; Ferretti et al., 1992; Lightfoot et al.,
2005; McNair et al., 1990). Moreover, forces acting on the tibia as a result of active
muscle forces, tibiofemoral reaction forces, and tibiofemoral friction forces at the time of
injury cannot be determined from these studies.
Even with these limitations, important information regarding the mechanisms of
ACL injury can be gained. The common mechanisms repeatedly described by patients
include the application of torques to the knee in both frontal and transverse planes during
sudden deceleration motions, such as landing from a jump and deceleration from forward
running.
Video and Photographic Analyses
Qualitative analyses using photographs or video have been done by some
researchers (Boden et al., 2000; Ireland, 1999; Olsen, Myklebust, Engebretsen, & Bahr,
2004), and are more objective than the retrospective analyses previously described. In
agreement with retrospective studies, these studies suggest that ACL injuries happened
during weight bearing activities at a shallow knee flexion angle (i.e. 5º~20º), often with
other combined motions (see table 1). In particular, valgus motions were frequently
observed with transverse plane knee rotation motions (Boden et al., 2000; Olsen et al.,
2004). Ireland (1999) introduced the “position of no return” that ACL injured people
often demonstrate based on qualitative video analyses. This motion is defined as
adduction and internal rotation of the hip, external rotation of the tibia relative to the

15
femur, internal rotation of the tibia on the foot, and forefoot pronation (did not specify the
exact motion for forefoot pronation). Boden et al. (2000) and Olsen et al. (2004)
described additional important features that ACL injured people demonstrated at the time
of the injury. Boden et al. (2000) observed that the injured leg was often placed forward
of the body with the upper body leaning backward, while Olsen et al. (2004) observed
that players were often perturbed by other opponents just before landing.
While these observations from experts shed further light on the mechanisms of
ACL injury, they also have limitations. The time point when ACL injury actually
happens cannot be determined from these observations. The authors provide no
descriptions for how they determined the moment of injury (Boden et al., 2000; Ireland,
1999; Olsen et al., 2004), and it is difficult to decipher if the joint angles and motions at
the time of the injury were accurate. In other words, it is possible that the observed
“position of no return”, may be a result of the ACL injury, not the mechanism leading to
ACL injury itself. Further, as in any motion analyses not using MRI or X-ray, exact
movements of bony segments cannot be precisely determined. This limitation is more of
a concern when qualitatively analyzing video or photographs than when using
sophisticated motion analysis systems. However, given the consensus of the results with
the retrospective studies previously described, these studies continue to support that ACL
injuries often occur as a result of a combination of motions.
ACL Loading Patterns with Application of External Loads
ACL loading patterns have been examined by applying external loads to the knee
both in vivo and in vitro. Although the mechanisms of ACL injuries were not directly

16
examined, these studies provide evidence as to what external loads may possibly stress
and damage the ACL.
Two methods (contact and non-contact) have been used to measure ACL tensile
forces during the application of various external loads to the knee (Woo et al., 1998). In
the contact method, a small force transducer is attached to the origin or insertion of the
ACL and directly measures the amount of ACL tensile force (Markolf, 1990; Miyasaka,
Matsumoto, Suda, Otani, & Toyama, 2002). The non-contact method does not involve
the implantation of a force transducer, but rather is accomplished with a procedure
introduced by Woo et al. (1998) and Sakane et al. (1999). Using a robotic arm with a 6
degree of freedom force transducer, a variety of loads are applied to the cadaver knee
with most of the passive structures present. The robotic arm records the force during
application of torque or force to the knee. Then, the ACL is cut, and the robotic arm once
again loads the knee in the exact same path of movement as before. The force obtained
by subtracting the force with the ACL absent from the force with the ACL intact is
considered the force developed in the ACL. The advantage of the non-contact method is
that it can obtain not only the magnitude but also the direction and origin of the force
vector, while the contact method can only obtain the magnitude of the force vector (Woo
et al., 1998).
Another way to measure the amount of ACL loading is the measurement of ACL
strain. To measure ACL strain, a small strain gauge is implanted, usually on the
anteromedial part of the ACL. Because the strain gauge is small, ACL strain has been
obtained from both living humans and cadavers (Arms et al., 1984; Beynnon et al., 1997;

17
Cerulli, Benoit, Lamontagne, Caraffa, & Liti, 2003; Fleming et al., 2001). Strain
represents a relative amount of change in length of the ACL from its initial length, and is
expressed as a percentage of its initial length. Different from the force measurement, a
lack of change in ACL strain does not necessarily mean that the ACL is not loaded.
Rather, it just means that the force did not result in a change of length of the ACL from
its initial length. Further, since the strain gauge is attached to only a small part of the
ACL (anteromedial), the strain measured at the implanted site may not be a representative
of strain across the ACL as a whole. The following section will summarize the results of
studies examining ACL loading patterns using these methods.
Anterior Shear Forces
It has been widely known that the ACL is loaded when applying an anterior
directed force to the tibia, and that the majority of the anterior tibiofemoral shear force is
restrained by the ACL (Butler, Noyes, & Grood, 1980; Sakane et al., 1999; Woo et al.,
1998). In recent studies using a robotic arm with a 6 degree of freedom force transducer,
ACL tensile force was measured during application of an anterior shear force to the tibia
(Sakane et al., 1999; Woo et al., 1998). Woo et al. (1998) reported that below 30º of
knee flexion, the amount of ACL tensile force was not significantly different from the
anterior shear force applied to the tibia, while ACL tensile force was significantly
reduced at knee flexion angles greater than 30º. Sakane et al. (1999) demonstrated
similar results in that ACL tensile forces were equivalent to 94% and 54% of the applied
anterior shear force to the tibia at 15º and 90º of knee flexion, respectively. These results
are in agreement with the study by Butler et al. (1980) and suggest that the ACL is the

18
major restraint against anterior shear forces to the tibia relative to the femur. This is
especially true during shallow knee flexion angles, indicating that the ACL is more
vulnerable to excessive anterior shear forces near full knee extension.
Quadriceps and Hamstrings Muscle Contractions
Quadriceps muscle contraction has been thought to be one of the major forces to
produce anterior directed forces of the tibia (Isaac, Beard, Price, Murray, & Dodd, 2005;
Pandy & Schelburne, 1997). An increase in ACL tensile force with quadriceps
contraction in shallow knee flexion angles can be explained by the direction of the
infrapatella tendon force vector in the sagittal plane at varying knee flexion angles. Isaac
et al. (2005) reported that the angle between the infrapatella tendon and the longitudinal
axis of the tibia is the largest during shallow knee flexion angles. Therefore, the anterior
shear force component becomes larger near full knee extension compared to deeper knee
flexion angles where the direction of the shear force may become posterior. In fact, they
reported that shear forces were directed posteriorly at knee flexion angles greater than
70º. Thus, it can be assumed that vigorous, unopposed contraction of the quadriceps
muscle group near full knee extension can be harmful for the ACL.
This theory is supported by studies that found isolated quadriceps contractions
significantly increased ACL strain or tensile force, especially during shallow knee flexion
angles (i.e. less than 40~60º of knee flexion) (Arms et al., 1984; Li et al., 1999; Markolf
et al., 2004). Furthermore, negative ACL strain values (Arms et al., 1984) and reduction
of ACL tensile forces (Li et al., 1999; Markolf et al., 2004) have been observed during
quadriceps contractions with the knee flexed greater than 45º to 60º. These results are

19
consistent with the studies examining the ACL strain during open kinetic chain knee
extension exercises using human subjects (Beynnon et al., 1995; Beynnon et al., 1997).
Beynnon et al. (1995; 1997) found that ACL strain increased only during shallow knee
flexion angles but was not strained when knee flexion angles were greater than 40º~60º
during the eccentric phase of knee extension exercises or isometric quadriceps
contractions.
While these studies suggest that excessive quadriceps force may increase the risk
of ACL injuries, only one study directly examined this possibility (DeMorat et al., 2004).
DeMorat et al. (2004) examined the effect of a 4500N quadriceps contraction force on the
ACL in cadavers and observed that 6 of the 11 knee specimens experienced ACL partial
or complete ruptures. However, it should be noted that they observed not only anterior
tibial displacement, but also knee internal rotation and knee valgus motions. Hence, the
quadriceps contractions may produce some degree of knee internal rotation and valgus
torque to the tibia in addition to anterior tibial translation. Thus, the force vector for ACL
loading due to the quadriceps contraction may affect more than one plane of motion.
On the other hand, hamstrings contractions are thought to produce posterior shear
forces, and along with the quadriceps, compressive forces at the tibiofemoral joint,
increasing the stability of the knee (Baratta et al., 1988; Solomonow et al., 1987). Studies
have demonstrated that ACL tensile force due to quadriceps contractions decreased with
hamstrings co-contractions (Li et al., 1999; Markolf et al., 2004). The amount of
reduction in ACL tensile force was especially notable as the knee flexion angle increased
(Li et al., 1999; Markolf et al., 2004). From these results, it may be said that the

20
protective function of the hamstrings muscle to the ACL may decrease as knee extension
angle increases. This further supports the notion that applying excessive quadriceps
contraction force or anterior shear force to the tibia near full knee extension places the
ACL at greater vulnerability for strain and tension.
In conclusion, excessive quadriceps contraction force may increase ACL loading
and possibly increase the risk of ACL injury. This can be explained by the fact that the
infrapatella tendon contains an anterior shear force component to the tibia, especially
near full extension. The athletes who sustain an ACL injury have often reported that the
involved leg was positioned forward to the upper body, with the upper body leaning
backward during a sudden deceleration motion from forward running (Boden et al.,
2000). In this position, the individual must produce a quadriceps contraction force to
decelerate. Further, in this small hip flexion angle (i.e. leaning backward), the hamstrings
are in a shortened position and assumed to lend little stability to the knee during this
sudden deceleration motion. As a result, the tibia may experience a higher anterior shear
force, increasing ACL tensile force and injury risk. Further, there is evidence that the
quadriceps contraction force may produce torques in frontal and transverse plane (i.e.
knee internal rotation and valgus rotation torques). This indicates the importance of
examining multiple planes of motions when considering the mechanisms of ACL injuries.
Torques in Frontal and Transverse Planes
Most ACL injuries happen during weight bearing conditions, such as landing
from a jump or sudden deceleration motions from forward running as previously
described. During such ballistic weight bearing deceleration motions, a strong

21
quadriceps contraction is likely necessary to resist the imposed knee flexion torque.
Thus, the focus of this section will be the ACL loading patterns with the applications of
external moments to the knee in frontal and transverse planes with combined loading of
quadriceps force or weight bearing. Further, ACL loading patterns due to combined
loadings of knee valgus and internal/external rotation are also compared as they are
frequently observed motions during non-contact ACL injuries (Olsen et al., 2004).
Studies agree that applying knee internal rotation torques in combination with a
quadriceps force will increase ACL loading more than an applied knee external rotation
torque in combination with a quadriceps force (Arms et al., 1984; Fleming et al., 2001;
Markolf et al., 2004). Approximately two times higher ACL tensile forces have been
observed when applying a combined quadriceps force and knee internal rotation torque
compared to the application of a quadriceps force with and without an external rotation
torque (Markolf et al., 2004). While ACL strain due to a combined quadriceps force and
knee internal rotation torque was observed to be the highest (up to ~2% higher than the
strain values with the application of only quadriceps force), the application of a
combined quadriceps force and knee external rotation torque actually reduced strain of
the ACL (Arms et al., 1984). In both cases, higher ACL strain and tensile forces were
observed near full knee extension (~15º for the former study and full extension for the
latter study). Similarly, in human subjects during a weight bearing condition at 20º of
knee flexion angle, applications of 9Nm knee internal and external rotation torques
increased ACL strain as compared to the strain value of weight bearing without any
torque application (Fleming et al., 2001). Although no statistical analysis was done, the

22
amount of increment due to the application of knee internal rotation torque was
appreciably higher than that due to external rotation torque during a weight bearing
condition. These results imply that when the knee experiences excessive knee internal
rotation torque along with excessive quadriceps force, the ACL may develop significant
strain or tensile force, potentially increasing ACL injury risk.
Applications of combined valgus or varus torque during a quadriceps contraction
when weight bearing have been reported to increase the ACL strain in vivo and vitro
(Arms et al., 1984; Fleming et al., 2001). However, different from the transverse plane
torque applications previously mentioned, frontal plane toque applications have not been
shown to markedly affect the amount of ACL strain (Arms et al., 1984; Fleming et al.,
2001). A cadaver study showed that compared to ACL strain due to a quadriceps force,
ACL strain values with both quadriceps force and 15Nm of valgus or varus torque were
higher during knee flexion angles greater than ~40º (Arms et al., 1984). However,
during knee flexion angles less than ~40º, ACL strain due to these combination loadings
was slightly lower (~1%) than the strain due to quadriceps force. Similarly, during
weight bearing, the application of 10Nm valgus-varus torques did not change the strain
value as compared to the strain only due to weight bearing (Fleming et al., 2001). These
studies suggest that during weight-bearing activities, where quadriceps muscle activity
becomes dominant, valgus or varus torque may not dramatically influence ACL strain.
However, it is possible that if additional torque such as internal rotation torque is applied
to the knee with valgus and varus loading, further increase in ACL loading may be
observed.

23
Studies examining the effect of combined frontal and transverse knee loading on
the ACL tensile force is relevant given these motions are often observed together at the
time of injury (Olsen et al., 2004). Studies that used a robotic arm to examine ACL in
situ force showed that combined loading of valgus with either knee internal or external
rotation torques significantly increase the ACL tensile force (Fukuda et al., 2003;
Gabriel, Wong, Woo, Yagi, & Debski, 2004; Akihiro Kanamori et al., 2000; A.
Kanamori et al., 2002). However, ACL tensile force was almost 2 times greater with the
application of valgus and knee internal rotation torque than with the application of valgus
and knee external rotation torque at 15º of knee flexion, and significantly higher than an
isolated valgus torque when the knee was flexed greater than 30º (Akihiro Kanamori et
al., 2000). These studies provide evidence that excessive combined torques of valgus and
knee internal rotation near full knee extension places the ACL at greater risk for strain
and injury. This risk may further increase if these torques are augmented by excessive
quadriceps contraction. Although Ireland (1999) described ACL injury as frequently
occurring as a result of combined excessive valgus and knee external rotation, these
studies support the need to study knee internal rotation kinetics and kinematics during
dynamic motions.
ACL Loading Patterns In Vivo during Closed Kinetic Chain Exercises
ACL injuries typically occur when the foot makes contact with the ground such as
during sudden deceleration, landing, or jumping (Boden et al., 2000; Ferretti et al., 1992;
Lightfoot et al., 2005; McNair et al., 1990). While studies examining ACL loading
during closed kinetic chain exercise are limited, they are relevant as these activities share

24
similar movement and muscle activation patterns in weight bearing. Therefore,
examining ACL loading patterns during weight bearing activities should provide
additional insight about the mechanisms of ACL injury.
Only one case study has examined ACL strain patterns during a sudden
deceleration task. Cerulli et al. (2003) examined ACL strain during a forward jump stop
task. A small strain gauge was implanted on the anteromedial bundle of the ACL, and
the subject performed 3 trials of a double leg forward jump stop task. The peak strain
values were recorded immediately after the foot contact, at approximately the same time
that peak ground reaction forces occurred. They reported average strain values of 2%
during a Lachman test and 5.5% during the jump stop task. This implies that the ACL
may experience larger loads during a sudden deceleration task, especially immediately
after the foot contact.
The amount of ACL strain during exercises that are often used for post ACL
reconstruction rehabilitation, have also been examined. Two studies examined the ACL
strain patterns during several closed kinetic chain exercises (Beynnon et al., 1997; Heijne
et al., 2004). Heijne et al. (2004) examined the ACL strain pattern during step up and
down motions, lunges, and one-legged sit to stand. They observed average peak strain
values of 2.5% during all exercises, with no significant difference between exercises.
The strain values at 30º of knee flexion were significantly larger than the values at 50º
and 70º of knee flexion. Similarly, Beynnon et al. (1997) reported that ACL strain values
(approximately 4%) were the largest at 10º of knee flexion angle during squatting with
and without resistance (created by a rubber tube). The strain values were observed to

25
decrease as knee flexion angle increased and strain was near zero at 60º of knee flexion.
These studies of non-ballistic closed chain exercises once again demonstrate that ACL
strain values are higher during shallow knee flexion angles, further validating previous
reported studies that ACL injuries tend to happen near full knee extension (Boden et al.,
2000; McNair et al., 1990; Olsen et al., 2004).
Comparison of the mean strain values reported by Beynnon et al. (1997) and
Cerulli et al. (2003) indicates that the amount of strain may be higher during more
ballistic type of exercise such as sudden deceleration motions. This comparison may be
appropriate because the strain values during a Lachman tests were similar in both studies
(approximately 2% of ACL strain) (Beynnon et al., 1997; Cerulli et al., 2003).
ACL Loading Estimated by the Computer Simulations
ACL loading during dynamic motions has also been calculated using computer
simulations (McLean, Huang, Su, & van den Bogert, 2004; Pandy & Schelburne, 1997;
Pflum, Shelburne, Torry, Decker, & Pandy, 2004; Shelburne & Pandy, 1998). These
studies directly calculate the amount of ACL tensile force based on predicted kinetic and
kinematic variables accounting for such factors as individual muscle forces,
anthropometric properties, and other soft tissue supports. This approach is useful in order
to predict the amount of ACL tensile force during actual dynamic motions.
While it is difficult to control the activation of involved muscles in vivo, computer
simulations can simulate the effects of different muscle activations on ACL loading
patterns during exercise. For example, Shelburne and Pandy (1998) demonstrated the
importance of hamstring activation in reducing ACL loading during non-ballistic

26
squatting motions. Their calculations agreed with studies by Beynnon et al. (1995) and
Heijne et al. (2004) in that ACL loading is highest near full knee extension. Although
their study examined static position in two dimentional modeling, more complex factors
should be considered in more ballistic dynamic motions. During such dynamic motions,
ACL loading is the result of multiple factors including ground reaction force, joint
reaction forces, infrapatella forces, and external torques in multiple planes (McLean et
al., 2004; Pflum et al., 2004). A study examining ACL loading patterns during a sidestep
cutting maneuver highlights the importance of studying transverse and frontal plane
kinetics and kinematics (McLean et al., 2004). Three hundred and two hundred fifty Nm
of peak external valgus and knee internal rotation torques were observed, respectively,
during perturbation simulations in the stance phase before changing direction. Due to
these large amounts of external valgus and knee internal rotation moments, they declared
that transverse and frontal knee kinetics were important factors in ACL injury risk.
These studies highlight the concept that the sum of all the forces acting on the
knee determines the ACL loading during dynamic motions. In other words, ACL loading
cannot be explained by only the quadriceps force or joint reaction force, which is
calculated by inverse dynamics. Mathematical models such as those described are not
perfect, as it is not possible to obtain perfect data about all the tissue properties, muscle
activation patterns, and the forces produced by individual muscles. Thus, to what extent
the results from these models reflect the real human ACL is unknown. However, results
from these models do indicate that the ACL loading pattern during dynamic motions
changes depending on involvement of many factors. In agreement with the results that

27
measured ACL loading in vivo and vitro, quadriceps and hamstrings muscle contractions
appear to significantly influence the amount of ACL loading. Further, these studies
suggest that loading in the transverse and frontal planes, as well as the sagittal plane may
be necessary when examining actual dynamic motions.
Conclusions
Studies revealed that ACL injuries often happen when attempting to decelerate
the body from a jump or forward running while the knee is in a shallow flexion angle. At
the time of injury, combined motions such as knee valgus and knee internal/external
rotation are often observed. From these observations, it can be expected that the knee is
loaded in multiple planes of motion.
The ACL has been widely known to be loaded with anterior shear forces to the
tibia. Quadriceps muscle contraction forces have been shown to produce anterior shear
force, possibly damaging the ACL, especially near full extension. On the other hand,
hamstrings co-contraction forces have been shown to be protective to the ACL,
increasing the stability of the knee while the quadriceps muscles are contracting.
Observations revealed that ACL injured individuals often demonstrate body positions that
may have increased quadriceps contraction forces and reduced efficacy of the hamstrings.
A study using computer simulations also revealed that quadriceps and hamstring muscle
activations are the major sources that change ACL loading during squatting. Thus,
controlling body position and thigh muscle activations in order to prevent ACL injuries
during sudden deceleration or landing motions is important.

28
Consensus in the literature indicates that external torques to the tibia in frontal
and transverse planes may potentially strain the ACL, possibly increasing the potential
for injury risk. This is particularly true when accompanied by a quadriceps contraction
force or during weight bearing, as both in vivo and vitro studies agree that the application
of knee internal rotation torques increased ACL loading more than the application of
knee external rotation torques. Combined valgus and knee internal rotation torques has
been shown to produce higher ACL tensile forces than the combined valgus and knee
external rotation torques. Although knee external rotation is often described in ACL
injury, the literature suggests that knee internal rotation may be an equally, if not more
important motion to restrain and protect the ACL. In fact, a computer simulation
revealed that throughout the stance phase of crossover cutting, the knee may experience
extremely high external knee internal rotation moments. These studies therefore question
the belief that the combined motions of knee external rotation and valgus, as described by
the “position of no return”, is the cause of ACL injury. Rather, if the knee experiences
excessive external knee internal rotation moments during weight bearing at a shallow
knee flexion with excessive quadriceps contraction force, the ACL may be loaded
excessively, possibly leading to injury. Thus, excessive knee internal rotation
immediately after foot contact during sudden deceleration tasks may be an important
variable to examine when studying knee transverse plane motions in relation to ACL
injury.
So far, information regarding transverse plane kinetics and kinematics during
sudden deceleration tasks is scant. However, such information is important when we

29
consider ACL injury prevention/rehabilitation. Thus, the next section will explore
possible factors that may influence knee internal rotation during weight bearing.
Factors that may Influence Transverse Plane Kinetics and Kinematics
It has been demonstrated that rearfoot eversion is associated with internal rotation
of the tibia relative to the foot (tibial internal rotation), (V. T. Inman, 1976). Because of
this coupling link between ankle eversion and tibial internal rotation, it has been
hypothesized that excessive rearfoot eversion may also lead to excessive internal rotation
of the tibia relative to the femur (knee internal rotation), thereby increasing ACL loading
and injury risk (Beckett et al., 1992; Loudon et al., 1996; Woodford-Rogers et al., 1994).
Quadriceps and hamstrings contraction forces have also been shown to influence the
amount of knee internal rotation (DeMorat et al., 2004; Hirokawa et al., 1992;
MacWilliams et al., 1999). How these factors may individually and collectively affect
knee transverse plane kinetics and kinematics during weight bearing will be the focus of
this section.
Motion Transfer from Rearfoot Eversion to Tibial Internal Rotation
Theoretical Background
The theoretical connection between rearfoot eversion and tibial internal rotation
was introduced by Inman (1976) and has been demonstrated in vivo and vitro
(Hintermann, Nigg, Sommer, & Cole, 1994; Lundberg, Svensson, Bylund, Goldie, &
Selvik, 1989; McClay & Manal, 1997; Nawoczenski, Saltzman, & Cook, 1998; Nigg et
al., 1993; Siegler, Chen, & Schneck, 1988; Wright, Desal, & Henderson, 1964). Several
studies have investigated the subtalar joint axis and found the angle to be between 26º

30
and 42º from horizontal in the sagittal plane (Lundberg, 1989; Manter, 1941; Root, Weed,
Sgarlato, & Bluth, 1966). Because of this inclination of the subtalar joint axis, when the
calcaneus is fixed on the floor and rotates laterally (everts), the talus rotates internally in
relation to the calcaneus. This internal rotation of the talus is transmitted to the tibia
because the talocrural joint is limited primarily to one degree of freedom (plantar/dorsi
flexion), resulting in tibial internal rotation in relation to the calcaneus (V. T. Inman,
1976). Conversely, ankle inversion is associated with tibial external rotation.
Theoretically, if the inclination of the subtalar joint axis is the only influencing
factor, the amount of tibial internal/external rotation totally depends on the inclination of
the subtalar joint axis. For example, if the inclination axis is low, more
eversion/inversion is necessary to cause tibial internal/external rotation as compared to a
higher inclination angle. However, other factors may influence the amount of motion
transfer from the calcaneus to tibia. These factors may include the mobility or laxity of
the talocrural and subtalar joints, amount of compressive force at the ankle joint, and
ankle joint position.
Inter-Individual Differences
The amount of the motion transfer from ankle eversion to tibial internal rotation
has been shown to differ widely among individuals (Hintermann et al., 1994; Nigg et al.,
1993). Thus, when examining the association between ankle eversion and the tibial
internal rotation, within subject comparisons may be a better research design because we
can minimize the factors that may influence the motion transfer between people.

31
Literature has reported mean subtalar joint inclination angles of 41º and 42º in the
sagittal plane in vitro (Manter, 1941; Root et al., 1966). Although these mean angles
seem to be consistent, the variability in the subtalar joint inclination axis has been shown
to be large among specimens, ranging between 22º and 55º with a standard deviation of
8.36 in one study (n=22) (Root et al., 1966), and between 20º and 68º (n=42) in another
study (Manter, 1941). A study using living humans has reported mean subtalar joint axis
angles ranging between 26º and 52º, depending on the position of inversion/eversion
position (1989), and this was supported by a cadaver study (Leardini, Stagni, &
O'Connor, 2001). This in vivo study also reported larger standard deviations at each foot
position than previously reported by Root et al. (1966). These studies imply a possible
large inter-individual difference in the amount of motion transfer from rearfoot eversion
to tibial internal rotation. Such differences may be augmented during dynamic weight
bearing tasks as it changes the position of the rearfoot.
Although subtalar and talocrural joints have been described as a hinge joint in
several studies (V. T. Inman, 1976; Manter, 1941; Root et al., 1966), the possibility that
they may not act as a true hinge joint has been reported. Sieglar et al. (1988) investigated
the amount of contributions in talocrural and subtalar joints for each motion by passively
rotating the calcaneus relative to the tibia in all three planes. It was found that for
plantar/dorsi flexion, the contribution from the subtalar joint was relatively small when
calcaneal positions were close to neutral relative to the tibia. However, the amount of
contribution from the subtalar joint increased as the amount of plantar/dorsi flexion
increase, and equaled the contribution from the talocrural joint at the end of the range of

32
motion. For inversion/eversion, the talocrural joint also contributed to inversion/eversion
up to approximately 50% of the total motion. Similar results were reported for
internal/external rotation of the calcaneus relative to the tibia. For both motions,
specifically large inter-specimen differences in the contribution from each joint were
observed. These results imply that an individual with more freedom in internal/external
rotation of the foot at the talocrural joint (larger laxity) may have lesser amounts of
motion transfer, as the amount of talus rotation may not completely transfer to the tibia at
the talocrural joint.
Once this inter-specimen/individual variability is accounted for, there may be a
high correlation between ankle frontal and tibial transverse plane rotations. Siegler et al.
(1988) conducted a regression analysis to predict the amount of ankle inversion/eversion
with ankle internal/external rotation. (Note: because the ankle rotation was obtained
relative to the tibia, ankle external rotation corresponds to tibial internal rotation.) In
order to take the inter-specimen variability into account, they normalized each joint angle
by the total range of motion in each specimen; first, they obtained the maximum range of
motion in each specimen, and the raw joint angle was expressed as a percentage based on
the corresponding total range of motion. It was found that there was a high correlation
between the two motions (r = 0.996) with a regression equation of γ = 1.308 + 0.612β +
0.002β2, where γ and β correspond to rearfoot internal (+)/external (-) and inversion
(+)/eversion (-), respectively. This equation indicates that an increase in ankle eversion is
associated with increase in tibial internal rotation. Thus, when inter-specimen/individual

33
differences are accounted for, a high association is indeed observed between rearfoot
eversion and tibial internal rotation.
Motion Transfer Ratio in Static Stance
In order to quantify the amount of motion transfer, previous studies have
calculated the motion transfer ratio of rearfoot eversion/inversion to tibial
internal/external rotation. This ratio is calculated by dividing the amount of tibial
internal/external rotation by the amount of rearfoot eversion/inversion. According to the
theory described by Inman (1976), if the subtalar joint axis is 45º from the horizontal in
sagittal plane and if no loss of motion transfer happens, the ratio will be 1. However,
studies that evaluated the motion transfer ratio in the static position in vivo and vitro have
shown a ratio that is different from 1.
Hintermman et al. (1994) examined the motion transfer in vitro and reported a
motion transfer ratio of 0.46 during eversion and 0.74 during inversion at the neutral
position with no axial compressive load applied. However, this transfer ratio decreased
to 0.28 at 600N of compressive force during eversion. Similar results were found by
Lundberg et al. (1989) who investigated the motion transfer in vivo. Although they
reported motion transfer ratios based on the tibial motion relative to the first metatarsal,
the motion transfer ratio was 0.28, ranging from 0.11 to 0.44 in weight bearing. Further,
Hintermann et al. (1994) found a decreased in the motion transfer ratio as dorsiflexion
angle increased during rearfoot eversion, while the motion transfer ratio during rearfoot
inversion remained relatively constant. Thus, it may be expected that depending on
degree of ankle dorsiflexion and weight bearing status during dynamic motion,

34
individuals may demonstrate a different motion transfer ratio of rearfoot eversion to tibial
internal rotation. However, it should be noted that these results were derived from static
stance, and it is unknown to what extent these results may translate to dynamic motions
in living humans.
Motion Ttransfer during Dynamic Motions
Motion transfer ratios from rearfoot eversion to tibial internal rotation during
locomotion have been reported by several studies (McClay & Manal, 1997; Nawoczenski
et al., 1998; Nigg et al., 1993) and seem to be larger than the ratios measured during
static stance (Hintermann et al., 1994; Lundberg et al., 1989). Also, ratios during
walking or running have been shown to be influenced by foot structure and range of
motion of the rearfoot.
During running, an average ratio of 0.76 has been reported for subjects with high
and low arch height (Nigg et al., 1993), with a lower ratio noted in the low arch subjects
(0.65) compared to high arch subjects (1.09) (Nawoczenski et al., 1998). A greater
motion transfer ratio in the high arch group may be attributed to a higher subtalar joint
inclination angle in the sagittal plane (Nawoczenski et al., 1998). People with greater
rearfoot eversion have also been reported to have larger transfer ratios during running
(0.81) compared to those with less rearfoot eversion (0.65) during running (McClay &
Manal, 1997). These studies suggest that foot shape and the amount of rearfoot eversion
are two factors that influence the motion transfer ratios and that the amount of motion
transfer may be higher during dynamic weight bearing motions than during static stance.

35
Both in vivo and vitro studies suggest that there are several possible factors that
influence motion transfer ratio. Although a high correlation (R2 = 0.991) between
rearfoot eversion and tibial internal rotation during running have been reported using
mean values (Nigg et al., 1993), this correlation coefficient is expected to be lower with
individual values. Therefore, when comparing the amount of tibial internal rotation
resulting from changes in the amount of rearfoot eversion among different people, it may
be necessary to take into account these possible inter-individual factors. Within subject
comparisons may therefore be a better way to examine the effect of changes in rearfoot
eversion on tibial and knee internal rotation during dynamic motions.
Effects of Rearfoot Eversion on Knee Internal Rotation
As noted previously, it has been hypothesized that the coupling motion between
rearfoot eversion and tibial internal rotation may be transferred to the knee, potentially
increasing knee internal rotation and risk of ACL injury. While a few studies have
examined the effect of rearfoot eversion on knee internal rotation during walking or
running, these findings do not support this hypothesis.
Lafortune et al. (1994) examined the amount of knee internal rotation during
walking while wearing valgus and varus shoes (to produce rearfoot eversion or inversion,
respectively) and standard shoes. Although tibial internal rotation increased significantly
relative to its position in space during walking with valgus shoes compared to the varus
and standard shoes, knee internal rotation did not change significantly between the
different shoe conditions. The authors suggested that while tibial internal rotation
increased, so did internal rotation of the hip joint, resulting in no significant increase in

36
knee internal rotation. Others reported similar findings. Nester et al. (2003) found no
change in the amount of knee internal rotation as a result of inserting an orthoses to cause
rearfoot eversion during walking. Similarly, McClay and Manal (1997) found that people
with an everted foot showed significantly larger internal tibial rotation at the foot but not
at the knee.
The lack of findings relating foot eversion to knee internal rotation may be a
function of low statistical power and relatively large inter-subject variability (Lafortune
et al., 1994; McClay & Manal, 1997). Lafortune et al. (1994) based their findings on only
5 subjects, and McClay and Manal (1997) studied only 5 subjects in each group. While
not significant, the mean knee internal rotation in the everted group (8.3º ± 4.5) was
larger than the normal group (5.6º ± 3.9) in McClay and Manal (1997). Further, these
measurements were taken during normal gait, and findings may be different under more
dynamic, high force attenuating activities such as landing. Further study is needed to
examine the relationship between rearfoot eversion and knee internal rotation in the
activities that require relatively high shock attenuation, with subject samples that will
yield acceptable statistical power.
Another consideration when examining these findings is the potential for other
factors to influence knee internal rotation. In particular, active muscle contractions and
inter-individual differences in passive restraints at the knee (e.g. ACL and joint capsule
laxity) were not accounted for. The importance of the quadriceps and hamstrings in
stabilizing the tibiofemoral joint and controlling the amount of knee internal/external
rotation has been demonstrated by several authors (Baratta et al., 1988; DeMorat et al.,

37
2004; Hirokawa et al., 1992; Li et al., 1999; MacWilliams et al., 1999; Pandy &
Schelburne, 1997; Solomonow et al., 1987). Hence, in order to clarify the relationship
between rearfoot eversion and knee internal rotation, it may be necessary to examine and
account for the activation patterns of these muscles.
Quadriceps Muscle Contraction
Quadriceps muscle contractions have been shown to influence knee internal
rotation, with some conflicting results. While studies using cadavers have shown an
increase in knee internal rotation as a result of quadriceps forces (DeMorat et al., 2004;
Hirokawa et al., 1992; Li et al., 1999), a study examining dynamic motion has reported
opposite results (Nyland et al., 1997).
Cadaver Studies
Simulated quadriceps contractions in cadaver knee specimens have consistently
resulted in internal rotation of the tibia on femur. Using a 4500N force in cadaver knee
specimens at 20º of knee flexion, DeMorat et al. (2004) observed an average of 5.5° of
knee internal rotation in all knee specimens. Similar increases were noted by Hirokawa
et al. (1992) and Li et al. (1999) using much smaller quadriceps forces in the range of 39
– 200N. The amount of knee internal rotation appears to increase as knee flexion angle
increases from 0 – 30º, then decreases as knee flexion angle increases from 30 – 120º.
The theory why quadriceps force produces knee internal rotation is based on
geometrical anatomy (DeMorat et al., 2004). The lateral tibial plateau has a posterior
tibial slope, smaller convex surface, and more mobile meniscus compared to the medial
tibial plateau. Thus, the lateral tibial plateau allows the lateral tibia to shift more

38
anteriorly than the medial side when the quadriceps muscles contract, as the infrapatella
tendon produces an anterior directed force on the tibia. This larger amount of anterior
shift of the lateral tibial plateau on the femur compared to the medial tibial plateau results
in knee internal rotation. This theory (DeMorat et al., 2004) is supported by the findings
by Speer et al. (1992) who reported that 93% of ACL ruptured patients (50 out of 54) had
evidence of posterolateral joint injury at the knee, particularly to the posterior horn of the
lateral meniscus. It was hypothesized that a violent anterior subluxation of the lateral
tibial plateau occurred when the ACL was ruptured during knee flexion. They named
this event as an “index pivot shift event”, which describes knee internal rotation as a
result of greater anterior suluxation of the lateral tibia compared to medial tibia.
In Vivo Dynamic Motions
Contradicting findings have been reported during dynamic, weight bearing
motions. Nyland et al. (1997) examined the kinetic and kinematic changes during the
decelerating phase of forward running into the crossover cutting maneuver after fatiguing
exercise. The subjects performed repetitive maximal isokinetic eccentric quadriceps
contractions until their torque production dropped to less than 80% of their initial
maximal torque production. In contrast with the previously mentioned cadaver studies,
they observed an increase in knee internal rotation with quadriceps muscle fatigue.
However, comparisons are difficult due to differences in study methods.
In the work by Nyland et al. (1997), their premise was that fatiguing exercise
would result in decreased force production of the quadriceps. However, subjects
continued the fatiguing exercise until only 20% of torque reduction was experienced.

39
Thus, it is not clear whether the subjects had a sufficient amount of muscle fatigue to
have a reduction in quadriceps muscle contraction force at the time of the post-fatigue
crossover cutting maneuver. Because they provided only kinematic and kinetic data, it is
unclear how activities of knee musculature (e.g. hamstrings) were changed. Further,
because the crossover cutting maneuver involves trunk rotation following to the
deceleration from the forward running, other compensatory motions might have affected
tibial movement after the fatiguing exercise. Thus, it may not be possible to isolate the
effects of quadriceps force on the amount of knee internal rotation as described by
laboratory cadavers studies (DeMorat et al., 2004; Hirokawa et al., 1992; Li et al., 1999).
Because of the consistent findings of controlled laboratory studies (DeMorat et al., 2004;
Hirokawa et al., 1992; Li et al., 1999), demonstrating the contribution of quadriceps
muscle forces to knee internal rotation, it seems prudent to account for quadriceps muscle
activity when examining the effect of ankle eversion on the transverse plane knee kinetics
and kinematics.
Hamstring Muscle Contractions
There are two primary situations when the hamstring muscles act to control the
amount of transverse plane knee rotation; 1) when the lateral or medial hamstring
muscles act independently to produce external or internal rotation moment, respectively
and 2) when all hamstring muscles co-contract with the quadriceps muscles to increase
joint stability.
It has been found that the biceps femoris muscle has an external rotation moment
arm about the longitudinal axis of the tibia (Buford Jr, Ivey Jr, Nakamura, Patterson, &

40
Nguyen, 2001). Therefore, knee external rotation will occur if the knee external rotation
moment produced by the biceps femoris is larger than the knee internal rotation moment
produced by other muscles (e.g.medial hamstrings). Some studies have reported an
increase in lateral hamstrings preactivity during cutting maneuvers and landing tasks in
subjects with ACL deficiency (Branch, Hunter, & Donath, 1989; Swanik, Lephart,
Swanik, Stone, & Fu, 2004). This increase in the preactivity is thought to be a
compensatory mechanism to reduce the amount of knee internal rotation during weight
bearing. However, for non-ACL injured people, it is unknown whether they selectively
activate the biceps femoris muscle over the medial hamstrings during sudden decelerating
motions, thereby producing more external rotation motion.
The importance of the hamstring muscles for increasing stability at the knee has
been well described. Activation of the hamstring muscle may counteract anterior shear
forces produced by the infrapatella tendon and increase the compressive force within the
knee joint, possibly increasing the stability of the knee (Baratta et al., 1988). Solomonow
et al. (1987) and Baratta et al. (1988) observed that during isokinetic knee extension with
15°/sec angular velocity, subjects co-contracted the hamstring muscles, although the level
of hamstring muscle activation was low (~7% of the maximal contraction). However,
when ACL deficient subjects experienced a sudden tibial anterior subluxation during the
knee extension exercise, an increase in the hamstring muscle activity was observed
(Solomonow et al., 1987). In a separate experiment, Solomonow et al. (1987) observed
hamstrings reflex contractions when feline ACLs were tensioned by a wire. Thus, they
hypothesized the existence of the reflex arc in the hamstring muscles via

41
mechanoreceptors on the ACL that sense tensile forces. From these experiments,
hamstring muscle contractions are considered to be important for increasing stability of
the knee.
The potential for hamstring muscle co-contractions to reduce the amount of tibial
anterior translation on the femur and knee internal rotation has been demonstrated by
cadaver studies. In fact, studies using cadavers have demonstrated this. As noted
previously, Li et al. (1999) observed an increase in knee internal rotation as a result of
quadriceps contraction force in cadaver knee specimens. However, the amount of knee
internal rotation became significantly lower with hamstring co-contraction, especially at
15º or greater of knee flexion. MacWilliams et al. (1999) also observed a decrease in the
amount of knee internal rotation when the knee internal rotation torques were applied to
the cadaver knee specimens with and without hamstrings co-contraction. Larger mean
differences in knee internal rotation were observed with increasing knee flexion angles
(~2.5º difference at 15º of knee flexion and ~10º at 60º of knee flexion) when comparing
the two conditions (with and without hamstrings co-contraction forces). These studies
suggest that hamstrings co-contraction provides an active restraint against an applied
knee internal rotation torque that becomes more effective as knee flexion angles increase.
Conclusion
It has been demonstrated that rearfoot eversion is associated with tibial internal
rotation relative to the foot. However, studies have yet to demonstrate that this motion
transfer results in increased knee internal rotation. It is possible that the lack of findings
at the knee may be explained by small sample sizes, use of tasks that did not require high

42
shock attenuation, and not accounting for compensatory changes in knee muscle
activations with increased knee loading. From inverse dynamics calculations, it is not
possible to examine the amount of contribution in each muscle group for net internal
moments during dynamic motions (Winter, 1990). Thus, simultaneous collection of
EMG data from muscles that may control knee motion (i.e. quadriceps, hamstrings
muscles) may further clarify this relationship.
Muscle Control in Rearfoot Eversion
As rearfoot eversion may be an important factor for controlling knee internal
rotation, factors that control rearfoot eversion should be considered. Rearfoot eversion
during dynamic motions can be controlled by passive structures (e.g. ligaments, joint
capsule etc.) and active muscle forces. As muscle function can be affected through
training, it is important to examine how muscles acting on the foot may influence rearfoot
eversion, thus tibial motion. To date, no study could be found that has examined the role
of the ankle musculature on transverse plane knee kinetics and kinematics during sudden
deceleration motions. During the early stance phase of running or walking, the tibialis
anterior muscle becomes highly active in order to decelerate plantar flexion (Elliott &
Blanksby, 1979; Hunt et al., 2001; Wright et al., 1964). During this time, the ankle everts
and the tibia internally rotates (Hunt et al., 2001; Wright et al., 1964). A cadaver study
suggests this motion may be controlled by the tibialis anterior muscle, given its
dorsiflexion and inversion moment arms (Klein et al., 1996). Although the tibialis
posterior muscle has the longest inversion moment arm (Klein et al., 1996), muscles
located posterior to the malleolus become most active after the mid stance phase of

43
locomotion (Hunt et al., 2001; O'connor & Hamill, 2004; Wright et al., 1964). Therefore,
in the early stance phase of a heel to toe landing, the tibialis anterior muscle may play an
important role in controlling ankle plantar flexion and eversion and absorbing the impact
force (Gerritsen, van den Bogert, & Nigg, 1994). Studies have shown that tibialis
anterior muscle activation coincides with the amount of rearfoot eversion during walking
after heel contact (Cornwall & Mcpoil, 1994), and that isokinetic inversion exercise
reduces the amount of rearfoot eversion during running (Feltner et al., 1994).
The importance of studying the early stance phase of deceleration or landing
motion may be considered from the stand point of ACL injury patterns. As noted
previously, the ACL develops more tensile force at shallow knee flexion angles when the
quadriceps muscle are actively contracting (Arms et al., 1984; DeMorat et al., 2004; Li et
al., 1999; Markolf et al., 2004; Pandy & Schelburne, 1997). Furthermore, ACL strain has
been shown to become the highest immediately after foot contact when landing from a
forward jump (Cerulli et al., 2003). These findings support the observations that ACL
injuries often happen immediately after foot strike when the knee is at a shallow knee
flexion angle during landing or deceleration motions (Boden et al., 2000; McNair et al.,
1990; Olsen et al., 2004).
Collectively, these studies suggest that the tibialis anterior muscle may play an
important role in controlling ankle dorsiflexion and eversion, especially during heel to toe
landing motions. Because of this, weakness or fatigue of the tibialis anterior muscle may
lead to an increase in ankle eversion, potentially increasing tibial internal rotation relative
to the foot.

44
Local Muscle Fatigue as a Model to Investigate the Effects of Muscle Weakness
Muscle fatigue can be defined as the temporal decline in the performance capacity
of muscles after being activated for a certain period of time, often demonstrated by a
failure to sustain or augment a certain intended force or power (Asumussen, 1979).
Although numerous factors may be involved in fatigue, repeated muscle contractions
cause local physiological changes (Allen, 2004; Asumussen, 1979; Fowles, Green,
Tupling, O'Brian, & Roy, 2002; Leppik et al., 2004; Ortenblad, Sjogaard, & Madsen,
2000) and alter muscle fiber recruitment (Houtman, Stegeman, Van Dijk, & Zwarts,
2003), leading to a reduction in force generation. Thus, research models that create
localized muscle fatigue may be useful to examine the functional importance of one
muscle or muscle group on certain functional tasks.
Several studies have examined the role of an isolated muscle group on joint
biomechanics using a fatigue model (Christina, White, & Gilchirist, 2001; Nyland et al.,
1999; Nyland et al., 1997; Rodacki et al., 2002). These studies used repeated isotonic
(Christina et al., 2001; Rodacki et al., 2002) or isokinetic muscle contractions (Nyland et
al., 1999; Nyland et al., 1997) to fatigue a muscle or muscle group and compared
biomechanical changes during various functional tasks before and after the fatiguing
exercise.
When utilizing these models in human experiments, it is important to note that it
is not possible to change the function of one muscle without changing the function of
other muscles (Gerritsen et al., 1994). Most human motions consist of movements in
multiple joints and planes, and internal moment productions in one joint are often

45
influenced by movements of other joints (e.g. biarticular muscles, center of pressure
location). Quadriceps and hamstring muscle contraction forces may be important
influencing factors for controlling transverse plane knee kinetics and kinematics, as
described previously. During a single-leg forward jump stop task, it is expected that the
hip joint produces a hip extensor moment to reduce the momentum of the trunk to rotate
into flexion. Depending on how the hip joint is controlled by the hip extensors,
hamstrings activation may be changed as the hamstring muscles help to control the hip
joint in the sagittal plane. Further, inverse dynamics calculations dictate that in closed
kinetic chain exercise, kinetics of the distal segment directly influences the proximal
segment kinetics (Winter, 1990). In fact, Rodacki et al. (2002) demonstrated that
fatiguing one muscle group resulted in changes in kinetic and kinematic variables and
non-fatigued muscle activations in multiple joints. Therefore, to gain a complete picture
of changes in knee kinetics and kinematics after fatiguing exercise, it may be necessary to
control for both ankle and hip joint kinetics and kinematics to account for compensatory
changes at other joints.
Summary
ACL injuries often happen during sudden deceleration or landing motions. At the
time of the injury, individuals often demonstrate multiple planes of motions at the knee,
such as knee valgus and/or internal/external rotations. In particular, the application of
excessive internal rotation moment to the knee has been shown to be one of the possible
causes of ACL injuries. Rearfoot eversion has been shown to couple with tibial internal

46
rotation, possibly leading to excessive knee internal rotation and increased ACL tensile
forces.
During heel to toe landing that involves sudden deceleration motions, the tibialis
anterior muscle may play an important role in controlling ankle plantar flexion and
eversion. Therefore, if the tibialis anterior muscle loses its ability to control the plantar
flexion and eversion during this landing motion, ankle eversion motion may increase,
possibly leading to more knee internal rotation. However, in order to examine this
relationship, it is necessary to control for quadriceps and hamstring muscle activations
and external knee internal rotation moment as knee internal rotation may also be
influenced by these factors.
Isolated fatigue of the tibialis anterior muscle can be used as a model to create
muscle weakness and allow us to determine the role of the tibialis anterior muscle during
such functional tasks. Thus far, a review of literature has revealed no study that has
examined the role of the ankle musculature on transverse plane kinetics and kinematics of
the knee. Determining the contribution of ankle musculature to knee kinetics and
kinematics during functional tasks will further our knowledge of factors that contribute to
at risk knee joint motions, and improve our knee prevention/rehabilitation programs.

47
CHAPTER III
METHODS
Design
Subjects were recruited from a healthy, recreationally active population in the
surrounding community. They were instructed to perform a forward, single-leg jump
stop task with the jump distance corresponding to 75% of their height. Kinetic and
kinematic data and EMG data were obtained from the lower extremity during the jump
stop task. Fatiguing exercise for the tibialis anterior was induced by repeated muscle
contractions using a pulley system that has been specifically designed to fatigue the
tibialis anterior muscle. Peak knee internal rotation and rearfoot eversion motion were
compared pre- and post-fatigue in order to examine the role of the tibialis anterior in
controlling frontal plane ankle and transverse plane knee motions. A path analysis was
used to examine the overall and individual contribution of rearfoot eversion and
quadriceps and hamstrings muscle activation to the amount of knee internal rotation,
tibialis anterior muscle fatigue as a mediator.
Subjects
Seventy six subjects ranging in age from 18 to 35 (male = 38, female = 38, age =
23.7 ± 4, ht = 169.3 ± 14.0 cm, and mass = 71.3 ± 14.9 kg) were recruited to participate.
The number of subjects was determined based on the number of predictors (15 for each

48
predictor). Subjects were between the ages of 18 and 35 years, physically active
(exercising 3 times a week for at least 30 minutes), had no ligamentous injury in the past,
and no history of musculoskeletal injury or surgery in their lower extremities in the past 6
months at the time of participation. Previous literature that compared the amount of knee
internal rotation has demonstrated the mean differences of 2.7° during forward running
(McClay & Manal, 1997). Based on data from preliminary studies that examined knee
kinematics during a single leg landing from a 45cm box, a 3° increase in knee internal
rotation was observed to be a large effect (0.80). Thus, it can be confidently said that if
3° of knee internal rotation is detected between pre- and post-TA fatigue conditions, this
amount of difference should have clinical importance. From these data, we determined
that 25 subjects per gender would provide adequate power to detect clinically important
differences between pre- and post-fatigue conditions with a power of 0.80 and type I
error rate of 0.05. However, 76 subjects were recruited to accommodate the number of
prediction variables that were used in the regression analyses (Howell, 2002)
25629.247979.0
80.222;7979.0
75986.3
322
21
21 ==
=
===−=− d
ndXX
δσ
µµ
Instrumentation
Kinetic and Kinematic Data Acquisition
Kinetic and kinematic data during the jump stop task were obtained using a 3-
dimensional electromagnetic tracking system (Ascension Star Hardware, Ascension
Technology, Burlington, VT, Motion MonitorSoftware, Innovative Sports Training,
Chicago, IL) and a non-conducting force plate (Type 4060, Bertec Corporation,

49
Columbus, OH). The data from the electromagnetic tracking system and force
plate was imported into Motion Monitor Software (Ascension Star Hardware, Ascension
Technology, Burlington, VT, Motion MonitorSoftware, Innovative Sports Training,
Chicago, IL) in order to calculate kinetic and kinematic variables.
Surface EMG
The signal from the force transducer was amplified through a strain gauge
transducer (Model 9820, Interface Advanced Force Measnrement, AZ) and collected at
rate of 1000Hz. Myoelectric activity from the lower extremity was obtained with a 16-
Channel Myopac surface EMG (sEMG) unit (Run Technologies, Mission Viejo, CA).
Unit specifications include an amplification of 1mV/V, frequency bandwidth of 10 to
1000Hz, input resistance of 1 MHz, internal sampling rate of 8 KHz, and a common
mode rejection ratio of 90dB at 60Hz. sEMG data were collected at a rate of 1000 Hz
and stored in the personal computer for further analysis. All sEMG data were processed
and analyzed using Datapac 2K2 Lab Application Software (Run Technologies; Mission
Viejo, CA).
Maximal Voluntary Isometric Contraction
Maximal voluntary isometric contraction (MVIC) force from the tibialis anterior
muscle (TA) was obtained using a force transducer (Model SM-50, Interface Advanced
Force Measurement, AZ) in line with a resistance wire that provided isometric resistance
to ankle inversion and dorsiflexion (figure 1). An isokinetic dynamometer (Biodex
System 3, Biodex Medical System Inc., Shirley, NY) was used to position subjects for

50
obtaining maximal sEMG signals of the vastus lateralis (VL), biceps femoris (BF), and
semitendinosus (ST) for later normalization.
Pulley System for Fatiguing Exercise
Maximal voluntary isometric contraction (MVIC) force was measured and TA
fatigue was induced through TA fatiguing protocol (see Protocol section below) using a
custom pulley system that allowed isolated fatigue of the TA in close proximity to the
electromagnetic tracking system (figure 1). A resistance wire ran from the footplate and
a hanging weight during fatiguing exercise, and to a hook during the MVIC force
measurement.
In the sitting position with the foot hanging off the edge of the table, the footplate
was secured to the subject’s foot by using three straps: two over the fore- and mid-foot
regions and one over the anterior aspect of the ankle joint; in this way, the foot can be
secured without removing the motion sensor on each segment. Straps were also secured
over the distal tibia and femur to prevent muscle compensations or substitutions. When
the ankle is placed in maximal plantar flexion, the angle of the wire was aligned
perpendicular to the foot, and the wire that connects the weight and the footplate was
aligned 90° in the sagittal plane. The attachment site of the wire on the footplate was
aligned to the second metatarsophalangeal joint. In this way, the total plantar flexion
torque produced by the resistance weight can be expressed by the following equation: T =
FRG × sine Ө LRG; where T equals the plantar flexion resistance torque applied to the foot,
FRG corresponds to the weight of the resistant in the sagittal plane, LRG corresponds to the
length of the lever arm for the resistance, and Ө corresponds to the angle between the

51
Figure 1. Sagittal View of the Pulley System to Fatigue the Tibialis Anterior Muscle
5% Body Weight
Force Transducer
Foot Plate
Ө

52
wire and the footplate in the sagittal plane. Previous work has shown that the moment
producing capability of the TA drops as the ankle goes into dorsiflexion and increases
when the plantar flexion angle increases (V. Inman, Ralston, & Todd, 1981). Therefore,
one of the advantages of this custom device is that the resistance torque curve would be
theoretically matched to the moment producing capability curve of the tibialis anterior,
allowing the muscle to be fatigued across its full range of motion.
Figure 2 shows the superior view of the TA fatiguing device. The angle between
the wire and the tibial shaft was aligned to ~30 degrees. In this way, one of the force
components of the resistance weights was in the direction of ankle eversion, and the other
was in the direction of plantar flexion. Since the action of the TA is dorsiflexion and
inversion, this pulley system allowed fatigue of both the dorsiflexion and inversion
components of the muscle.
When the MVIC force was obtained, the end of the wire was fixed to a stationary
hook so that when subjects pulled the foot plate toward them, they contracted their
dorsiflexors isometrically. During fatiguing exercise, 5% of the body weight was
attached to the end of the wire, allowing the subjects to perform repeated concentric and
eccentric muscle contractions. A metronome standardized the rate of repeated
contractions.
Protocol
Upon arrival, subjects read and signed an informed consent form that has been
approved by the University’s institutional review board for the protection of human

53
Figure 2. Superior View of the Pulley System.
ס30
Motion sensors (the motion sensor for the foot is located underneath the ankle strap)
EMG electrodes
Adjustable bar
Direction of pull

54
subjects, and age, height, and mass were manually recorded. Then, all subjects
preceded through the following protocol steps:
1. Practice and familiarization of the single-leg forward jump stop task
2. Attachment of sEMG electrodes and recording of MVIC trials for sEMG
normalization of the quadriceps and hamstring muscles
3. Digitization of the lower extremities for kinematic analysis
4. Performance of 5 pre-fatigue trials of the forward, single-leg jump stop task
5. Pre-fatigue MVIC force measurement of the TA
6. Tibialis anterior muscle exercise to fatigue
7. Post-fatigue MVIC measurement of the TA
8. Performance of 5 post-fatigue trials of the forward, single-leg jump stop task
The first 10 subjects (5 males and 5 females) were asked to participate in an
identical experimental protocol session within 7 to 10 days of the first experimental
session to establish reliability and validity of the TA fatigue protocol. A detailed
description of each protocol step follows.
Single-leg Forward Jump Stop Task
Before and after the fatigue protocol, subjects performed a forward, jump stop
with a single-leg landing. Subjects stood on their dominant leg (defined as the stance leg
when kicking a ball), then jumped toward a force plate positioned at a distance of 75% of
their body height away from the starting position, and landed on the opposite leg. They
were instructed to land on the center of the force plate and keep their balance after
landing, while keeping their thumbs on their iliac crests throughout the task. Pilot work

55
showed that people can successfully and safely perform this jump task at this distance
(even after fatiguing exercise), and that the TA is quite active (42.38%MVIC, n = 1)
during the early phase of landing (100ms after the foot contact). Before actual data
collection, subjects were allowed to practice this jumping task as many times as needed
until they became comfortable with the task.
sEMG Placement and Recording of sEMG Signal
Two Bipolar, Ag/Ag-Cl surface electrodes (Blue Sensor N-00-S; Ambu Products,
Ølstykke, Denmark; skin contact size 30x22mm) were attached (center-to-center distance
of 20mm) on the muscle bellies of the TA, VL, BF, and ST between the motor point and
their distal tendon. The locations of the motor points for each muscle were determined
according to the study by Rainoldi et al. (2004). A reference electrode was attached on
the tibial shaft. Prior to electrode placements, the skin over the involved areas was
shaved and rubbed with alcohol pads.
To normalize the sEMG amplitude, sEMG signals from VL, BF, and ST were
obtained while subjects performed maximal isometric knee extension or flexion
contractions. Subjects sat on a seat fixed in an isokinetic dynamometer, with the hip joint
placed in approximately 85º of flexion. Then, the lateral femoral epicondyle was aligned
to the rotational axis of the lever arm. After positioning the subjects, they were secured
using Velcro straps over the distal thigh, hip and chest. The distal end of the lever arm
was fixed to the lower leg just superior to the malleoli, and the knee joint was placed at
30º of flexion. In this position, subjects practiced both maximal isometric knee flexion
and extension contractions (one time each at approximately 25% effort, 50% effort, 75%

56
effort, and 100% effort). Subjects were instructed to put their arms across their chest and
kick (knee extension) or pull (knee flexion) the lever arm as hard as they could during
each MVIC. Subjects performed 3 trials of 3 second MVICs for each muscle contraction.
sEMG signals were obtained from the VL during the maximal isometric knee extensor
contractions and from the BF and ST during the maximal isometric knee flexor
contractions. Constant verbal encouragement was given across trials and subjects.
Digitization of the Lower Extremities for Kinematic Analysis
After the practice trials of the single-leg, forward jump stop task, four motion
sensors were secured on the dominant leg: one on the sacrum, and one each on the lateral
aspect of the calcaneus, the flat part of the tibial shaft, and the lateral aspect of the thigh
over the iliotibial band. To limit sensor movement, sensors were attached to the skin by
double-sided carpet tape and stabilized with non-adhesive elastic tape and standard white
tape. Joint centers of the ankle and knee were obtained as described by Madigan and
Pidcoe (Madigan & Pidcoe, 2003). The hip joint center was determined as described by
Leardini et al. (1999)
The world coordinate system was fixed on the center of the force plate with
positive X axis directed anterior, positive Y axis directed superior, and positive Z axis
directed lateral when the subjects stood facing the positive X axis direction. To
determine the orientation and position of each segment, a segment coordinate system was
constructed (Wu, 1995). Longitudinal axes for the segment coordinate system in each
segment coincided to the line between the hip and knee joint centers for the thigh, the
knee and ankle joint centers for the shank, and the ankle joint center and the tip of second

57
toe for the foot. For the thigh and shank segment, the longitudinal axis was assigned the
y axis and directed superiorly. However, for the foot segment, the longitudinal axis was
assigned the x axis and directed anteriorly. When determining the other two axes for
each segment coordinate system, the subjects stood straight, facing the positive X axis
direction of the world coordinate system, while they straightened their knees and placed
their feet parallel and pelvic width apart. Then, the two other axes for each segment
coordinate system were aligned to the world coordinate system.
TA Fatigue Protocol and Pre- and Post-Fatigue MVIC Measurements
In both pre- and post- fatigue conditions, subjects performed 5 trials of the
forward, single-leg jump stop task. Loss of balance and not being able to keep the
thumbs on the iliac spines were considered a mistrial, and such data were discarded and
repeated. Kinetic and kinematic data for 5 successful trials of the single-leg jump stop
task (both pre and post fatigue) were obtained and stored in the computer for further
analysis.
Before and immediately after the fatigue protocol, MVIC force was obtained from
the TA. When measuring the MVIC, the ankle joint was placed in the neutral position.
The resistance weight was removed from the end of the wire, and the end of the wire was
fixed to a hook, keeping the wire taut. In this position, subjects were asked to pull the
foot plate straight toward them as hard as possible for 3 seconds, and the MVIC force
was obtained using a force transducer attached to the wire.
After the MVIC force was obtained, the end of the wire was released from the
hook, and weights that correspond to 5% of the subject’s body weight were attached.

58
Subjects were then asked to perform repeated dorsiflexion contractions, with the foot in
slight inversion, until muscle exhaustion. The exercise consisted of a sequence of 20
repetitions of dorsiflexion performed at a consistent pace (1 rep/2 sec), with a 15 second
rest between sets. The subject was asked to touch a bar, placed so that the dorsum of the
foot touched the bar when the ankle joint reached a neutral position with each repetition.
To standardize exercise pace and rest periods, a metronome was used. The exercise
continued until subjects could no longer bring their ankle into the neutral position (i.e.
touch the bar) for 3 consecutive trials.
Although subjects were instructed to use only dorsiflexor muscles (i.e. tibialis
anterior) to dorsiflex their ankle, EMG data were recorded from the VL, BF, and ST
during the last 5 repetitions of each set of the fatigue protocol. These data were used to
check whether subjects contracted their thigh muscles to compensate for the TA as
fatigue progressed.
After the cessation of the exercise, MVIC force was measured immediately in the
same way as the pre-fatigue measure. During both the MVIC measurement and the
fatiguing exercise, sEMG recorded myoelectric activity, and verbal encouragement was
given to the subjects to ensure that they gave their maximal effort. Subjects were
immediately released from the pulley system and performed the post-fatigue forward
jump task within 30 seconds. The time for the post-fatigue data collections (from the end
of the post-fatigue MVIC measurement to the end of the single leg forward jump stop
task) were recorded manually using a stop watch.

59
Time Window for Post-Fatigue Data Acquisition
In order to determine the time window for the post fatigue data collection, we
conducted a pilot study to examine the recovery curve for MVIC force after the above
described fatigue protocol for the TA. MVIC measurements for the TA were performed
before and immediately after exhaustion (T1), 30 seconds after T1 (T2), 30 seconds after
T2 (T3), then at 1 minute intervals following for 6 minutes (T4-T9). MVIC force and
sEMG signals were obtained from the TA during each MVIC. Power spectrum analyses
were conducted to transform the sEMG signal from the time domain to the frequency
domain using a fast Fourier transformation to obtain the median power frequency (MPF).
MVIC force and MPF in pre- and post-fatigue MVIC measurements were compared
using repeated measure ANOVA. Simple contrasts were used as a post hoc analysis to
determine whether each variable in each post-fatigue MVIC measurement was
significantly different from the corresponding pre-fatigue MVIC measurement. Results
are summarized in table 2. The results indicate that post-fatigue MVIC force was 40% of
pre-fatigue MVIC force immediately after the fatiguing exercise (n = 10), and the MVIC
force recovered to 74.24% of pre-fatigue MVIC force within 7 minutes and 30 seconds
after the exercise. sEMG frequency spectrum analysis during the MVIC demonstrated a
21.65% reduction in MPF immediately after the exercise. However, significant
reductions in MPF were only observed until 4 minutes and 15 seconds after the exercise
(T6). These observations suggest that the TA fatigue protocol results in a significant
amount of fatigue of the TA for up to 4-7 minutes.
After the fatigue protocol, little time was needed to prepare subjects for the post-

60
Table 2. Absolute and Relative Maximal Voluntary Isometric Contraction (MVIC and %MVIC, respectively) Force and Median Power Frequency (MPF and %MPF, respectively) in Pre- and Post-fatigue Measurements
Pre-
fatigue
T1
(0min)
T2
(33sec)
T3
(1min 6sec)
T4
(2min 9sec)
T5
(3min
12sec)
T6
(4min
15sec)
T7
(5min
18sec)
T8
(6min
21sec)
T9
(7min
24sec)
MVIC (N) 168.23
(43.72)
67.59
(35.81)**
80.84
(41.23)**
90.48
(46.1)**
102.47
(39.16)**
106.06
(43.86)**
114.91
(34.91)**
119.18
(35.70)**
119.83
(36.07)**
123.77
(38.67)**
%MVIC
(%)
100 40.41
(18.33)
47.95
(20.50)
53.37
(20.12)
61.23
(16.56)
62.61
(16.97)
69.24
(14.58)
71.77
(13.68)
72.14
(13.89)
74.23
(13.91)
MPF (Hz) 140.98
(17.22)
110.46
(11.49)**
115.94
(11.71)**
119.89
(12.61)**
126.27
(14.51)*
127.61
(15.45)*
129.77
(15.47)*
132.39
(17.26)
135.10
(14.58)
136.09
(17.43)
%MPF (%) 100 79.04
(9.76)
83.26
(12.65)
86.01
(12.63)
90.45
(12.79)
91.20
(11.60)
92.66
(10.61)
94.44
(10.97)
96.53
(10.44)
97.03
(10.69)
N = 10 ** indicate significant difference from corresponding pre-fatigue value at ≤0.01 level. * indicates significant difference
from corresponding pre-fatigue value at ≤0.05 level.
60

61
fatigue data collection. All the straps and the foot plate were taken off from their leg and
foot, and they were positioned so that they were ready to perform the post-fatigue
forward, single-leg jump stop task wihin 30 seconds of completion of the post-fatigue
MVIC force measurement. The subjects were asked to perform the jump stop task as
before, keeping their balance for at least 3 seconds. Thus, this task took approximately 5
seconds. As soon as subjects performed the jump task, the examiner saved the kinetic
and kinematic data just collected (an additional 5 seconds), and the same procedure was
repeated 5 times. Hence the post-fatigue data collection occurred within 2 minutes,
which was well within the fatigue recovery curve of 4 – 7 minutes. According to the
MVIC force recovery data, subjects were expected to have an average of ~ 50% MVIC
force reduction (based on an average of % MVIC forces in T1-T4) during the first two
minutes following fatigue. This amount of MVIC reduction is considered a large
treatment effect as compared to previous studies (Christina et al., 2001; Nyland et al.,
1997; Yaggie & McGregor, 2002).
Data Collection/Reduction
Kinetic and Kinematic Data Processing
Position and ground reaction force (GRF) data 500 ms prior to, and 1 second after
the touch down of the jump stop task were collected at 140 Hz and 1000Hz, respectively,
and stored in a personal computer. Fourth order zero-lag, low-pass Butterworth filters
with cutoff frequency of 60 Hz for GRF and 12 Hz for kinematic data were used to
smooth the data. Data was imported into the Motion Monitor software to calculate
kinematic and kinetic data using Euler’s equations. The position and GRF data were

62
synchronized using a linear interpolation method. The data points to be analyzed for
each trial were from the moment of touch down to when the knee joint reached initial
peak knee flexion angle. Knee internal rotation excursion angle (KIRexc) in each trial
was obtained and averaged across 5 successful trials for both pre- and post-fatigue
conditions. Total rearfoot eversion excursion angle (EVexc) and rearfoot eversion
excursion angle at knee internal rotation peak (EVKIRexc) also were obtained from each
trial and averaged across 5 successful trials for each condition.
For the ankle joint, positive directions were defined as ankle dorsiflexion and
eversion. For the knee joint, positive directions was defined as knee flexion and internal
rotation.
sEMG Data Processing
The raw sEMG data was filtered using a 4th order, zero-lag Butterworth filter with
a band pass of 10 – 400 Hz. For each 3 second MVIC from the TA, the sEMG signals
collected from 500ms after the initiation of the MVIC to 100 ms before the end of MVIC
were used for the power frequency spectrum analysis time window based on previous
pilot data. To analyze muscle fatigue from the sEMG signal, MPF was obtained from a
power spectrum analysis. A fast Fourier transformation of 256 data points, processed
with a Hanning window, was performed with a frame duration of 0.26 ms in order to
transform time-amplitude domain EMG data into frequency-power domain sEMG data.
The sEMG signals were obtained from the TA, VL, BF, and ST during both the
MVICs and the jump stop tasks. sEMG signals during the jump stop task were collected
from 500ms before the foot contact and 500ms after the foot contact. The mean RMS

63
amplitude over the 150ms immediately before contact was ensemble averaged over 5
trials and used for analysis. For the sEMG normalization, the sEMG signal from the
middle 3 seconds of the MVIC contractions was obtained and digitally processed with a
mean RMS algorithm using a 100ms time constant. During this period, peak RMS
amplitudes were obtained from the 3 MVIC trials for each contraction and averaged over
3 trials. This average peak RMS amplitude for each muscle was used for normalizing the
mean RMS amplitudes during the jump task. Values were expressed as a percentage of
their MVIC (%MVICRMS). In the present study, VL activation was used to represent the
activation of the quadriceps muscle group as a whole. This is based on a single nerve
(femoral nerve) innervating all quadriceps muscle (Moore, 1992), suggesting that all
muscles are equally activated during a given task. Further, previous literature has shown
that the magnitude of activation from all quadriceps muscles couples well with the
magnitude of extensor muscle contraction force development (Anderson, Adams,
Sjøgaard, Thorboe, & Saltion, 1985).
To analyze contraction force failure, the raw signal from the force transducer was
low pass filtered at 40 Hz, and the peak value was obtained from the same time window
as previously described. For determining the pre-fatigue MVIC force value, the 3 highest
peak values obtained from the 3 pre-fatigue MVIC trials was averaged and used for
analysis. The post fatigue MVIC force was obtained in the same manner, and expressed
as relative values (%MVICpre) to the pre-fatigue MVIC values.
To comfirm whether subjects compensated for TA fatigue using other muscles
during the TA fatiguing exercise, the sEMG data from the first, middle, and last sets were

64
obtained. The mean RMS amplitude with a 25ms time constant was obtained during the
5 repetitions from each set and were expressed as their %MVICRMS.
In the post-fatigue condition, not all subjects successfully performed 5 single leg
forward jump stop tasks within 2 minutes. In that case, kinematics and EMG data from 3
– 4 successful trials within the 2 minutes window were ensemble averaged (4 successful
trials in 22 subjects, 3 successful trials in 3 subjects). Further, in 2 subjects, post-fatigue
data collection time was appreciably longer than 2 minutes (2 minutes 22 sec and 2
minutes 28 sec). For these two subjects, the first 3 trials were used for the analyses.
Statistical Analyses
Prior to testing the stated research hypotheses, reliability and validity of the
fatigue protocol was examined. To assess day-to-day consistency of TA muscle fatigue
in response to the fatigue protocol, separate repeated measures ANOVAs were used to
calculate intraclass correlation coefficients (ICC2,k) and standard error of measurements
(SEMs) for each of the fatigue variables: MVIC Force (pre, post, and %decline), median
power frequency (pre, post and %decline), and number of repetitions to reach fatigue. To
confirm TA fatigue following the fatigue protocol, paired sample t-tests compared pre
and post measurements of MVIC force and MPFs. To examine possible muscular
compensations during TA fatigue, separate repeated measure ANOVAs compared
normalized RMS amplitudes (%MVICRMS) during the last 5 repetitions of the first,
middle, and last sets of TA fatigue protocol for the VL, BF and ST. A Post hoc pairwise
comparisons of mean values were conducted with a Bonferonni adjustment if the main
effect was significant.

65
To test hypotheses 1, 3 and 4, a path analysis with 13 paths was conducted to
obtain relationships between each predictor and dependent variable in both pre- and post-
fatigue conditions. Figure 3 illustrates the path diagram and the relevant relationships
examined between the predictors and dependent variables. The variables with an arrow
head pointing at them constitute the dependent variables. The remaining variables
without arrows pointing at them are the predictors or explanatory variables. In path
analysis, a variable may be both a predictor and a dependent variable. As in the
regression model, each path has an associated slope or coefficient that can be considered
an average rate of change or regression weight that denotes the isolated effect of the
predictor on the dependent variable. There are two different types of path coefficients,
unstandardized and standardized. Unstandardized path coefficients represent the effect of
the predictor on the dependent variable using the raw scale values (i.e., based upon the
partial covariance). A standardized coefficients represent the partial regression effect, if
the predictor and dependent variables are standardized (i.e., converted to z-scores) or if
the correlation matrix is analyzed.
The significance of each predictor is evaluated by testing whether or not the path
coefficient (standardized or unstandardized) is statistically different from zero. In order
to carry out this hypothesis test, a Student’s t statistic is computed as the ratio t=b-
µ(b)/σ(b), where µ(b) is the true (but unknown population) coefficient and σ(b) is the
standard error of the estimates of b. If the standardized coefficient is tested, µ(b)=0, the
ratio simplifies to t=b/σ(b). The standard error of the path coefficient, estimated as s(b),
is the variability of the statistic over repeated sampling. For example, suppose that a path

66
Figure 3. Path Diagram Showing Interrelationships Between the Predictor and
Dependent Variables.
pre = pre-fatigue, post = post-fatigue, KIRexc = knee internal rotation excursion,
EVKIRexc = rearfoot eversion excursion, MVIC%dec = percentage of maximum voluntary
isometric contraction (MVIC) force decline, %VL, ST, and BF = normalized RMS
amplitude for vastus lateralis, semitendinosus, and biceps femoris muscles
P1
P2
P3
P4
P5
P6
P7
P8
P9
P10
P11
P12
P13
preKIRexc
preEVKIRexc postEVKIRexc
pre%VL post%VL
pre%ST post%ST
pre%BF post%BF
TA MVIC%dec
postKIRexc

67
coefficient is calculated repeatedly from many different random samplings. Replications
of the estimated path coefficients have a distribution about true path coefficient from the
population that follows a Student’s t-distribution with a standard deviation estimated as
the asymptotic standard error of the path coefficient. If the t-value for the path
coefficient is greater than 1.995 or 2.65, the probability that the path coefficient is not
statistically different from zero is less than 0.05 or 0.01, respectively, and we reject the
null hypothesis, H0: µ(b)=0.
When comparing the magnitudes of the predicting capacities of more than two
predictors measured in different units (e.g. EVKIRexc vs %VL), it is necessary to
standardize the path coefficients to interpret the effects. That is, the unstandardized
coefficients are functions of the covariance between two variables. If the variables are on
different scales, the effects become uninterpretable and certainly cannot be compared to
other effects. Interpreting the standardized path coefficients makes it easier to compare
the relative magnitude of the prediction capacities of different predictors.
To test Hypothesis 1, the path analysis was limited to the pre-fatigue condition.
Unstandardized path coefficients between each predictor variable and preKIRexc (P2 –
P5) examined the extent to which rearfoot eversion excursion (EVKIRexc) and thigh
muscle activation (pre%VL, pre%BF, pre%ST) predicted knee internal rotation excursion
(preKIRexc). To test Hypothesis 2, paired-sample t-tests examined changes in the
amount of KIRexc and EVexc from pre- to post-fatigue conditions. To test Hypothesis 3,
the path coefficients for P1 and 7 were examined first to confirm if there was any effect
of TA fatigue on postEVKIRexc, and then to determine if they were significant predictors.

68
If the path coefficient of P1 was not significant, but that of P7 was significant, it was
assumed that MVIC%dec had a significant effect on postEVKIRexc as they were not related
in the pre-fatigue condition. Further, to compare the magnitude of the prediction
capacities for MVIC%dec and preEVKIRexc, the standardized path coefficients for P6 and
P7 were compared. To test Hypothesis 4, the unstandardized path coefficients between
each predictor variable (postEVKIRexc, post%VL, post%ST, post%BF, and MVIC%dec
and preKIRexc) were examined and indicated the extent to which rearfoot eversion and
thigh muscle activation predicted knee internal rotation excursion (postKIRexc)
following TA fatigue (P7 – P13). The direct path from MVIC%dec to postKIRexc (see
Figure 3) was also examined to determine the relative magnitude of the direct effect of
TA fatigue on postKIRexc. That is, if the direct path of MVIC%dec to postKIRexc was
significant and if its standardized path coefficient was larger than the product of
standardized path coefficients for P7 and P9, it would be considered that TA fatigue had a
direct effect on knee internal rotation motion in the post-fatigue condition.
In order to evaluate whether this structural equation model fits the data, overall, a
χ2 (chi-square) goodness-of-fit statistic was examined. The χ2 test evaluates whether the
observed covariance matrix of predictors and dependents was significantly different from
the model-predicted covariance matrix (i.e., the covariance matrix estimated from the
path model). If there is no significant residual difference between the observed and
predicted covariance matrices, the path model is considered to provide an adequate
representation of the observed data. However, the χ2 statistic is very sensitive to sample
size. Therefore, other model fit indices that are typically used to evaluate the quality of

69
fit between the observed covariance matrix and the path model were evaluated based on
guidelines described by previous studies (Bollen & Long, 1993; Hu & Bentler, 1995).
The typical guidelines for model fit indices are as follows. The model fit is considered to
be good if the Goodness of Fit Index (GFI), adjusted Goodness of Fit Index (AGFI),
Non-Normed Fit Index (NNFI),or Comparative Fit Index (CFI) are greater than 0.90.
Another often-reported index is the Root Mean Square Error of Approximation
(RMSEA). RMSEA values of less than 0.01 are considered exceptional. Values less than
0.05 are considered “very good”, and values less than 0.08 are viewed as “acceptable”
(Browne & Cudeck, 1993). It is not uncommon to report multiple fit indices. In fact,
reporting multiple fit indices helps to confirm the fit of a particular path model.
If the model fits the data, the overall pattern of relationships among predictors and
dependents modeled by the path coefficients is considered valid. However, it is still
essential to individually test each path coefficient for significance from zero. The Type I
error rate (α level) was set at α=0.05 for all of these path-coefficient hypothesis tests and
paired t-tests. The explicit null hypothesis pertaining to each of the stated research
hypotheses are as follows:
Null hypothesis 1: P2 = P3 = P4 = P5 = 0
Null hypothesis 2: preKIRexc = postKIRexc, preEVexc = postEVexc
Null hypothesis 3: P1 = 0, P1 × P7 > P6
Null hypothesis 4: P8 = P7 × P9 = P10 = P11 = P12 = P13 = 0
P1 through13 represents each path in the model (see Figure 3).

70
CHAPTER IV
RESULTS
A total of 76 subjects participated in this study. However, due to an unexpected
mechanical problem during the MVIC measurements of the TA, data from four subjects
were not used. Therefore, data from 72 out of 76 subjects (males = 35, females = 37)
were analyzed (age = 23.8, ht = 168.9cm, and mass = 70.9kg). Means ± SDs, minimum,
and maximum values for all pre- and post-fatigue variables are presented in Table 3. In
addition, knee flexion angle and time to peak knee internal rotation were reported in
Table 3 as they may be related to the amount of ACL loading and non-contact ACL
injury (Arms et al., 1984; Li et al., 1999; Olsen et al., 2004). During the single leg jump
stop task, subjects demonstrated 54.7 ± 8.5º and 54.3 ± 9.0º of peak knee flexion within
183.65 ± 45.4ms and 193.9 ± 49.5ms of touch down in the pre- and post-fatigue
conditions, respectively. All the kinematic data were obtained during these time periods.
Reliability and Validity of the TA Fatigue Protocol
The means, standard deviations, and reliability coefficients for each fatigue
variable on the first 5 males and 5 females are presented in Table 4. On average, subjects
performed a total of 126.2± 65.1 repetitions of the TA fatigue protocol before reaching
the required 50% fatigue. Intraclass correlation coefficients revealed that subjects were
very consistent in the number of repetitions required to reach fatigue between the two test
sessions (ICC = 0.91, SEM = 19.24). Day to day consistency of TA force measurements

71
Table 3. Means ± SDs and Ranges for Kinematics, Strength, and sEMG Variables in Pre-
and Post-fatigue Conditions
Pre-Fatigue Range Post-Fatigue Range Mean ± SDs (Min – Max) Mean ± SDs (Min – Max) KIRexc (deg) 8.0 ± 3.6 (1.7 – 15.4) 7.7 ± 3.8 (0.7 – 21.0)
EVexc (deg) 12.0 ± 4.8 (1.7 – 24.7) 12.2 ± 5.1 (1.9 – 25.4)
EVKIRexc (deg) 8.2 ± 5.6 (-8.0 – 23.9) 8.3 ± 5.5 (-5.3 – 23.7)
%VL (%) 8.0 ± 4.8 (2.1 – 24.9) 7.7 ± 5.7 (2.4 – 38.0)
%ST (%) 21.1 ± 10.7 (6.8 – 64.0) 19.9 ± 11.1 (6.9 – 64.4)
%BF (%) 17.3 ± 9.2 (3.5 – 47.0) 17.4 ± 11.7 (2.3 – 70.0)
MVIC (N) 164.1 ± 40.7 (54.1 – 323.4) 72.2 ± 32.4 (23.2 – 209.3)
MVIC%dec (%) 55.5 ± 16.1 (18.0 – 86.6)
MPF (Hz) 145.4 ± 21.0 (94.7 – 187.4) 100.2 ± 22.2 (50.2 – 168.7)
MPF%dec (%) 30.8 ± 14.6 (-51.6 – 65.7)
KFlx@KIRpk (deg) 37.4 ± 9.6 (17.8 – 62.5) 36.2 ± 12.1 (4.7 – 63.2)
Time to KIRpk (ms) 70.2 ± 26.8 (28.8 – 149.4) 71.0 ± 29.4 (19.0 – 135.0)
N = 72, KIRexc = knee internal rotation excursion, EVexc = eversion excursion, EVKIRexc
= eversion excursion at peak knee internal rotation, %VL, ST, and BF = normalized RMS
amplitude of vastus lateralis, semitendinosus, and biceps femoris muscles, MVIC%dec =
percentage of MVIC force decline, MPF = median power frequency, MPF%dec = median
power frequency percent decline, KFx@KIRpk = knee flexion angle at peak knee internal
rotation, Time to KIRpk = time to peak knee internal rotation.

72
Table 4. Mean ± SD, Intraclass Correlation Coefficients (ICC2,k), and Dtandard Error of
the Measurements (SEM) for Fatigue Related Variables
Day 1 Mean ± SD
Day 2 Mean ± SD
ICC2,k SEM
preMVIC (N) 164.3 ± 38.9 157.6 ± 34.2 0.75 19.40
postMVIC (N) 78.7 ± 37.8 68.3 ± 38.1 0.87 13.81
MVIC%dec (%) 51.9 ± 19.7 58.6 ± 20.8 0.90 6.61
# of Reps to Fatigue 126.2 ± 65.1 115.1 ± 51.2 0.91 19.24
preMPF (Hz) 156.8 ± 22.1 151.3 ± 20.3 0.91 6.58
postMPF (Hz) 106.5 ± 20.5 104.7 ± 14.7 0.73 10.66
MPF%dec (%) 31.9 ± 9.7 30.7 ± 5.4 0.64 5.85
N = 10, pre = pre-fatigue, post = post-fatigue, MVIC = maximum voluntary isometric
contraction force, %dec = percentage force decline, MPF = median power frequency

73
were also good to excellent, ranging from 0.75 for preMVIC, 0.87 for postMVIC, and
0.90 for percent force decline (MVIC%dec). While pre- and post-fatigue median power
frequencies (preMPF, postMPF) were also good to excellent (0.91 and 0.73 respectively),
the percentage decline in MPF from pre to post fatigue (MPF%dec) was less consistent
(ICC2,k = 0.64).
On average, there was a 55.5% MVIC force decline (164.1 ± 40.7 N in the pre-
fatigue condition versus 72.2 ± 32.4 N in the post-fatigue condition) in the TA following
the fatigue protocol (t = 20.75, df = 71, p < .001) (refer to Table 3). MPF also decreased
significantly from pre (145.4 ± 21.0Hz) to post-fatigue (100.3 ± 22.3 Hz) (t = 17.956, df
= 71, p < 0.001), resulting in a 30 ±14.6 % decrease in the frequency content of the
signal. Assessment of thigh muscle activation during the first, middle and last sets of the
fatigue protocol revealed that normalized RMS amplitudes for the VL and ST were
greater during the middle and last sets compared to the first set (Table 5).
These results indicated that subjects reached the desired level of fatigue in
response to the fatigue protocol, but in the process recruited greater vastus lateralis and
semitendinosus muscle activation as the TA fatigue protocol progressed.
Predicting Knee Internal Rotation from Rearfoot Eversion and Thigh
Muscle Activation (Hypothesis 1)
To examine the extent to which rearfoot eversion and muscle activation of the
vastus lateralis, semitendinosus and biceps femoris predicted knee internal rotation
excursion during the single leg jump stop task, the path analysis was limited to the pre-

74
Table 5. Comparison of Normalized RMS Amplitudes (%) of the Vastus Lateraris (VL),
Semitendinosus (ST), and Biceps Femoris (BF) during Last 5 Repetitions of the First,
Middle, and Last Sets of the Tibialis Anterior Fatiguing Exercise (Values are Means ±
Standard Deviations)
First Set Middle Set Last Set F values df = 1
Post Hoc
% VL 11.7 ± 9.2 16.4± 11.2 16.0 ± 12.0 33.03** F < M, F < L
% ST 1.0 ± 4.1 1.6 ± 8.5 1.5 ± 8.6 2.23 N/A
% BF 3.3 ± 2.5 7.3 ± 3.1 8.4 ± 1.1 12.94** F < M, F < L
N = 72, ** indicates p < 0.01, F, M, and L indicate First, Middle, and Last sets,
respectively

75
fatigue condition (Figure 3; P2 - P5). The model-fit analysis confirmed that the model fit
was essentially perfect (χ2 = 0.00, df = 0, p = 1.00, RMSEA = 0.00). This is because the
model was saturated (i.e., has zero degrees of freedom). Also see Table 3, which
contains the descriptive statistics.
Table 6 lists the coefficients, standard errors of the coefficients, and t statistics for
paths P2 through P5 in the pre-fatigue condition. The critical t statistic was 0.95t71=1.995.
That is, any reported values greater than or equal to 1.995 can be interpreted as
significantly different from zero with 95 percent confidence. These findings revealed
that only 4% of the variance in preKIRpk was predicted by EVKIRexc, %VL, %BF, and
%ST. However, none of the path coefficients exceeded the critical value; therefore, the
“explained variance” was essentially zero in the population.
Effect of Tibialis Anterior Fatigue on Knee Internal Rotation and
Rearfoot Eversion (Hypothesis 2)
Table 3 lists the means, standard deviations and ranges for knee internal rotation
(preKIRexc, postKIRexc) and rearfoot eversion (preEVexc, postEVexc) during the single
leg forward jump stop task before and after TA muscle fatigue. In response to TA
muscle fatigue, there was no significant increase in KIRexc (t = 1.348, df = 71, p =
0.182) or in EVexc (t = -.756, df = 71, p = 0.452).
The Relationship between Tibialis Anterior Muscle Fatigue and
Rearfoot Eversion (Hypothesis 3)
In order to examine how MVIC%dec influenced postEVKIRexc while accounting
for preEVKIRexc, the P6 and P7 path coefficients were evaluated (Table 7). P1 was also

76
Table 6. Unstandardized and Standardized Path Coefficients When Predicting Knee
Internal Rotation Excursion (preKIRexc) from Rearfoot Eversion Motion and Thigh
Muscle Activation in the Pre-fatigue Condition
Unstandardized Path Coeff.
Standardized Path Coeff.
Standard Error
t-value
Sig.
preEVKIRexc 0.10 0.16 0.08 1.28 p > 0.05
pre%VL 0.10 0.13 0.10 1.01 p > 0.05
pre%ST -0.01 -0.04 0.06 -0.22 p > 0.05
pre%BF 0.02 0.06 0.07 0.35 p > 0.05
N = 72, df = 71, preEVKIRexc = eversion excursion at peak knee internal rotation,
pre%VL, ST, and BF = normalized RMS amplitude of the vastus lateralis,
semitendinosus, and biceps femoris muscles

77
Table 7. Unstandardized and Standardized Path Coefficients When Predicting Eversion
Excursion in the Post-fatigue Condition (postEVKIRexc)
Unstandardized Path Coeff.
Standardized Path Coeff.
Standard Error
t-value
Sig.
preEVKIRexc 0.84 0.86 0.06 14.45 p < 0.01
MVIC%dec -0.05 -0.15 0.02 -2.50 p < 0.05
N = 72, df = 71, preEVKIRexc = pre-fatigue eversion excursion , MVIC%dec =
percentage force decline of tibialis anterior muscle

78
evaluated for significance to determine if there is a relationship between MVIC%dec and
postEVKIRexc that occurs due to TA fatigue, or whether that relationship potentially exists
before the fatigue condition. If there is no relationship between preEVKIRexc and
MVIC%dec, but there is in the post-fatigue condition, it can be confirmed that
MVIC%dec had an effect on postEVKIRexc. It was confirmed that the path coefficient for
P1 (-0.21) was not significant (Std. Error = 0.36, t = -0.58, p > 0.05). Conversely, the
path coefficient for P7 (P7 = -0.05) was significant (Std. Erro = 0.02, t = -2.50, p < 0.05).
However, the relationship was opposite to what was expected, suggesting that greater TA
fatigue was related to decreased eversion motion in the post-fatigue condition.
In order to examine the extent to which MVIC%dec affected the amount of post-
fatigue eversion motion (postEVKIRexc), the standardized path coefficients for P6 and 7
were compared (see Table 7 and Figure 3). In this structural equation model, 78% of
observed variance in postEVKIRexc was explained by both TA fatigue (MVIC%dec) and
eversion motion in the pre-fatigue condition (preEVKIRexc) (i.e., via P6 and P7). The
standardized path coefficient between MVIC%dec and postEVexc was – 0.15 (P7), while
the path coefficient between preEVKIRexc and postEVKIRexc was 0.86 (P6). Comparing the
magnitudes of these path coefficients indicates that although a large amount of variance
in the postEVKIRexc was predicted, a greater than 5 times larger magnitude in the
standardzed path coefficient for P7 than P6 indicates that preEVKIRexc was the primary
predictor of postEVKIRexc. Although TA fatigue had a small but significant effect on post
fatigue rearfoot eversion, the relationship was opposite of what was hypothesized, with
greater TA fatigue leading to decreased rearfoot eversion excursion.

79
Factors Influencing Knee Internal Rotation Following Tibialis
Anterior Muscle Fatigue (Hypothesis 4)
Overall model fit was evaluated. The chi-square statistics showed that the
observed covariance matrix was not significantly different from the model-based,
predicted covariance matrix (χ2 = 28.72, df = 21, p = 0.21). Therefore, the model was
considered an acceptable fit with the population covariance matrix. It should be noted
that when the χ2 statistic is non-significant in a goodness-of-fit test, it is not typically
considered necessary to consider other fit statistics. However, given the small sample
size, in this analysis the GFI, NNFI, and CFI all exceeded 0.90 (see Table 8). Only AGFI
was below the acceptable range of more than 0.9 (AGFI=0.78). These fit results suggest
that it is appropriate to evaluate the individual paths in the proposed model.
To examine the extent to which rearfoot eversion and thigh muscle activation of
the vastus lateralis, semitendinosus and biceps femoris predicted knee internal rotation
excursion during the single leg jump stop task following TA fatigue, a path analysis was
conducted for both pre- and post-fatigue conditions together. In the post-fatigue
condition, the direct and indirect relationships of MVIC%dec and the direct relationships
of preKIRexc, postEVKIRexc, post%VL, post%BF, post%ST on postKIRexc were
examined (see Table 9). If MVIC%dec has a direct relationship on post-fatigue knee
internal rotation (postKIRexc), the path coefficient for P8 should be significant and larger
than the product of standardized path coefficients for P7 and P9. In order for MVIC%dec
to have an indirect effect on postKIRexc via eversion motion in the post-fatigue condition
(postEVKIRexc), path coefficients for both P7 and 9 should both be significant. The

80
Table 8. Structural Equation Model Fit Indices for Pre- and Post-fatigue
Condition Together
χ2 (df p-value) GFI AGFI NFI CFI RMSEA
28.72 (21 0.12) 0.93 0.78 0.94 0.98 0.076 χ
2 = Chi square value, GFI = Goodness of Fit Index, AGFI = Adjusted Goodness
of Fit Index, NFI = Normed Fit Index, CFI = Comparative Fit Index, and RMSEA
= Root Mean Square Error of Approximation

81
Table 9. Unstandardized and Standardized Path Coefficients When Predicting Post-
Fatigue Knee Internal Rotation Excursion (postKIRexc)
Unstandardized Path Coeff.
Standardized Path Coeff.
Standard Error
t-value
Sig.
preKIRexc 0.83 0.81 0.07 12.11 p < 0.01
postEVKIRexc 0.04 0.06 0.05 0.84 p > 0.05
post%VL 0.13 0.20 0.05 2.66 p < 0.01
post%ST -0.02 -0.06 0.03 -0.62 p > 0.05
post%BF -0.03 -0.10 0.03 -0.98 p > 0.05
MVIC%dec -0.01 -0.04 0.02 -0.66 p > 0.05
N = 72, df = 71, preKIRexc = pre fatigue knee internal rotation excursion, postEVKIRexc =
post fatigue eversion excursion, post%VL, ST, and BF = normalize RMS amplitude of
vastus lateralis, semitendinosus, and biceps femoris muscles, respectively, post fatigue,
MVIC%dec = percentage force decline of tibialis anterior muscle

82
results showed that the unstandardized path coefficient for P8 (-0.01) was not significant,
suggesting that the amount of TA fatigue had no direct relationship on post-fatigue knee
internal rotation motion. Although the path coefficient for P7 was significant, as
described above, P9 was not significant at α = 0.05. This result indicates that although
greater TA fatigue was related to decreased rearfoot eversion motion following the TA
fatigue protocol, rearfoot eversion motion was not related with knee internal rotation
motion. Thus, TA fatigue had neither an indirect or direct effect on knee internal rotation
motion.
In this latter model, 72% of observed variance in postKIRexc was explained by
the predictors; however, the only significant predictors were pre-fatigue knee internal
rotation motion (preKIRexc) and the normalized RMS amplitude for the VL in the post-
fatigue condition (post%VL). preKIRexc had a standardized path coefficient of 0.81 on
postKIRexc, which was four times the magnitude of the standardized path coefficient of
0.20 for post%VL on postKIRexc. These results suggest that although most of the
variance in the amount of knee internal rotation motion was explained by the knee
internal rotation motion in the pre-fatigue condition during a single leg forward jump stop
task, VL activation before touch down explained a small but significant amount of
variance in the knee internal rotation in the post-fatigue condition. Thus, this result
partially supports Hypothesis 4.

83
CHAPTER V
DISCUSSION
There are three primary findings in current study. Firstly, there was no
association of knee internal rotation motion with rearfoot eversion motion and thigh
muscle activation in the pre-fatigue condition. Secondly, tibialis anterior muscle fatigue
did not change either total rearfoot eversion or knee internal rotation motion. Thirdly,
there was a significant positive association between quadriceps muscle activation and
knee internal rotation motionin the post-fatigue condition. This discussion will first
address the research findings associated with the relationship between rearfoot eversion
and knee internal rotation in the pre-fatigue condition. This will be followed by a
discussion of the findings related to the effects of tibialis anterior fatigue on rearfoot
eversion motion and their relationship with thigh muscle activation and knee internal
rotation motion.
The Relationship of Knee Internal Rotation with Rearfoot Eversion
and Thigh Muscle Activation
The current study attempted to build on previous work examining the relationship
between eversion and knee internal rotation by taking into account and controlling for
several factors (e.g. thigh activation) not previously accounted for that might influence
this relationship. However, consistent with previous studies (Lafortune et al., 1994;
McClay & Manal, 1997; Nester et al., 2003), the current results revealed no relationship

84
between rearfoot eversion, thigh muscle activation and knee internal rotation in the pre-
fatigue condition. This section will compare the findings of the current study to previous
studies considering their methodological differences, and will consider possible reasons
for why eversion and thigh activations did not have an association with knee internal
rotation.
The Relationship between Rearfoot Eversion and Knee Internal Rotation
Several studies have examined the effect of increased rearfoot eversion on knee
internal rotation because of the link between rearfoot eversion and tibial internal rotation
on the calcaneus (Lafortune et al., 1994; McClay & Manal, 1997; Nester et al., 2003).
For example, McClay and Manal (1997) compared the amount of knee internal rotation
during running between two groups who demonstrated normal and excessive amount of
rearfoot eversion during running. Although they found significantly greater tibial internal
rotation on the calcaneus in the group with excessive rearfoot eversion compared with
those with normal motion, the amount of knee internal rotation was not statistically
different between the two groups. Other studies compared the change in knee internal
rotation during walking before and after increasing the amount of rearfoot eversion by
wearing lateral wedged shoe or orthotics to increase eversion (Lafortune et al., 1994;
Nester et al., 2003). Neither study found a significant difference in knee internal rotation
between interventions. However, several factors were considered for why they did not
find any effect of increased rearfoot eversion on knee internal rotation motion, and the
current study attempted to take into account of these factors.

85
McClay and Manal (1997) used only 5 subjects in each group, and Lafortune et al.
(1994) also used only 5 subjects total. Due to the expected low statistical power in their
studies, it was expected that their lack of results might in part be due to small sample
sizes. In fact, McClay and Manal (1997) showed significantly larger tibial internal
rotation on the calcaneus with non-significant but larger mean knee internal rotation in
the group with a pronated foot. Lafortune et al. (1994) mentioned that there were large
interindividual differences in the amount of knee internal rotation, leading to non-
significant differences in knee internal rotation between conditions (with and without
lateral wedged orthotics). Thus, in order to improve the ability to identify significant
relationships between rearfoot eversion and knee internal rotation in this study, a larger
sample size was used to predict knee internal rotation (i.e. 18 subjects for each predictor).
Another factor that previous studies did not control for is thigh muscle activation.
In previous well controlled laboratory studies using cadaver knees, it has been
demonstrated that a quadriceps contraction force increased knee internal rotation,
especially between 20~30º of knee flexion angle (DeMorat et al., 2004; Hirokawa et al.,
1992; Li et al., 1999). This increase in knee internal rotation due to the quadriceps
muscle contraction might be explained by the shape and geometry of the tibiofemoral
joint (DeMorat et al., 2004). During these shallow knee flexion angles, it has been
reported that the infrapatella tendon force due to the quadriceps muscle contraction has
an anterior shear force component to the tibia (Isaac et al., 2005). When this anterior
shear force pulls the tibia anteriorly, the lateral side of the tibia is moved more anteriorly
due to a shallower and wider lateral meniscus than the medial side of the tibia. This

86
larger anterior movement of the lateral tibia was theorized as the reason why quadriceps
muscle contraction produce knee internal rotation (DeMorat et al., 2004). Hamstring
muscle co-contractions may also influence the amount of knee internal rotation. Co-
contraction of the hamstring muscles has been theorized to increase the stability of the
knee when quadriceps contraction force exists (Baratta et al., 1988; Solomonow et al.,
1987), effectively reducing the amount of knee internal rotation when an internal rotation
load or quadriceps muscle contraction force is applied to the knee (Li et al., 1999;
MacWilliams et al., 1999).
Therefore, in order to take into account thigh muscle contractions as a factor to
influence the knee internal rotation during a single leg forward jump stop task, this study
obtained muscle activation data. As the path analysis can take into account the shared
variances among predictors in the dependents, including multiple predictors that
theoretically associate with dependents can provide a more complete picture of the
relationships than only examining simple correlations.
Task differences between this study and previous studies examining knee internal
rotation during dynamic tasks should also be considered. Nyland et al. (1997) examined
the effects of quadriceps or hamstring muscle fatigue following repeated eccentric
contraction exercise. Their subjects performed fatiguing eccentric exercise for the knee
extensors or flexors until they experienced more than 20% of torque output reduction in
each muscle group. With the premise that the fatigued muscle group would reduce the
contraction force after the fatiguing exercise, they examined the change in transverse
plane knee motions before and after each fatiguing exercise. Contrary to the above

87
cadaver studies (DeMorat et al., 2004; Hirokawa et al., 1992; Li et al., 1999), they found
an increase in the amount of knee internal rotation (2.4° increase) after quadriceps
eccentric exercise. Conversely, in agreement with previous studies (Li et al., 1999;
MacWilliams et al., 1999), a small increase in knee internal rotation (1.1°) was observed
after hamstring muscle eccentric exercise. However, these differences were not
statistically assessed, and comparing their results to the results from cadaver studies is
difficult because during a crossover cutting motion, upper body transverse plane
movement may increase or decrease the amount of knee internal rotation. Further, as
their subjects experienced only 20% of torque output reduction following to the eccentric
fatiguing exercises, it is not clear whether they actually reduced the contraction force
during cutting maneuver. Because of these reasons, this study used a task that does not
require upper body transverse plane motion compared with other tasks and obtained
muscle activation data from the quadriceps and hamstring muscles during the task.
Further task differences should be noted compared with previous studies
examining locomotion as a task. Non-contact ACL injury was often observed during
tasks that would require high shock attenuation as compared with locomotion (Boden et
al., 2000; McNair et al., 1990; Olsen et al., 2004). Previous studies examining the
relationship between rearfoot eversion and knee internal rotation used running or walking
that would produce vertical ground forces corresponding to only 1.2 to 1.6 times body
weight (Christina et al., 2001; Hunt et al., 2001; McClay & Manal, 1997). Conversely,
the vertical ground reaction forces observed in this study averaged 3.5 times body weight.
Thus, it could be considered that the single leg forward jump stop task would be more
88
appropriate task to examine the amount of knee internal rotation as a possible motion to
increase ACL loading.
In spite of controlling for each of these factors, the results of the current study are
in agreement with the previous studies finding no association between rearfoot eversion
and knee internal rotation (Lafortune et al., 1994; McClay & Manal, 1997; Nester et al.,
2003). However, for clarity, it should be noted that although no association was found
between rearfoot eversion and knee internal rotation in these analyses, it does not mean
that rearfoot eversion does not couple with tibial internal rotation, possibly leading to
increase in knee internal rotation. From these results, we can only conclude that people
who had greater eversion motion did not consistently experience greater knee internal
rotation motion. These results are specific to the single leg forward jump stop task, and
thus, it is necessary to examine whether the relationship between rearfoot eversion and
knee internal rotation exists using other functional tasks.
The lack of relationship between rearfoot eversion and knee internal rotation is
likely due to some biomechanical phenomenon, rather than a statistical concern. The
data were carefully assessed to determine whether the lack of relationship was due to
some statistical reason, such as restricted variance, existence of outliers, and/or a lack of
measurement reliability of the kinematic data. It is possible to find no relationships
between predictor and dependent variables if there is not enough of a distribution in the
predictor and/or dependent variable. However, as one can see from Table 3, both KIRexc
and EVKIRexc have ranges between 1.7º – 15.8º and between -8.0º and 23.9, respectively,

89
suggesting that there were sufficient variance in the data. Further, observation of the raw
data revealed no outliers (See Appendix G).
A lack of measurement reliability could also be an issue in identifying
relationships between two variables. In order to assess whether there were measurement
reliability concerns, post-hoc ICC analyses were conducted for preKIRexc and preEVexc
using the data from first 10 subjects who attended two identical data collection sessions.
The results showed that both preKIRexc and preEVKIRexc showed excellent ICC values
(0.88 and 0.83 with 1.79 and 2.39 for SEMs, respectively). Thus, measurement reliability
does not appear to be a concern or a plausible reason for the lack of relationships.
Clinical Implications
The result from this study and others (Lafortune et al., 1994; McClay & Manal,
1997; Nester et al., 2003) raises a question regarding the theoretical connection between a
pronated foot and ACL injury, specifically that people with an excessively pronated foot
may be at increased risk of ACL injury due to concomitant increase in knee internal
rotation (Beckett et al., 1992; Loudon et al., 1996; Woodford-Rogers et al., 1994). This
theory was based on the obligatory motion coupling between rearfoot eversion and tibial
internal rotation. For example, Nigg et al. (1993) found a significant high correlation
between rearfoot eversion and tibial internal rotation on the calcaneus (R2 = 0.991, p <
0.0001) during running. However, this high significant association was based on the
average values of rearfoot eversion and tibial internal rotation over the time period of the
first half of the stance phase of running from 30 people. Therefore, if they conducted the
correlation analysis based on the rearfoot eversion and tibial internal rotation values at

90
one point of the time, for example at peak knee internal rotation, the association should
be much lower due to expected intersubject variability. Thus, it is necessary to re-
evaluate the validity of this theory based on the findings of this and other studies.
The Relationship between Thigh Muscle Activations and Knee Internal Rotation
Similar to rearfoot eversion, activation of the quadriceps and medial and lateral
hamstring muscles were not associated with knee internal rotation motions in the pre-
fatigue condition. In order to assess the amount of muscle activation, it was decided to
examine the ensemble average of %MVICRMS of thigh muscles over 150ms before the
touch down as an indicator of the amount of muscle recruitment. This time window was
determined because previous studies have reported that electromechanical delay (EMD)
associated with voluntary contractions of the quadriceps and hamstring muscles range
between 40 and 100 ms (Chan, Lee, Wong, Wong, & Yeung, 2001; Gleeson, Reilly,
Mercer, Rakowski, & Rees, 1998; Kroll, 1974; Mercer, Gleeson, Claridge, & Clement,
1998; Paasuke, Ereline, & Gapeyeva, 1999; Zhou, 1996). On average, peak knee internal
rotation happened immediately after touch down in the pre-fatigue condition (70.2 ± 26.8
ms), thus time to peak knee internal rotation was within the reported range of the EMD.
However, standard deviations for the time to peak knee internal rotation are
relatively large compared to their means, ranging between 28.8ms and 149.4ms. This
large variability suggests relatively large inter-individual differences in the time to peak
knee internal rotation. Thus, it was possible that the 150ms pre-contact time window for
recording muscle activity might not be appropriate for some people, especially if their
EMD was much shorter than their time to peak knee internal rotation. If this was the

91
case, the ability for %VL, ST, and BF aquired 150ms before touch down to predict
KIRexc would be significantly lower.
Another consideration is the flexion angle of the knee. In this task, peak knee
internal rotation happened relatively early after the touch down with the knee flexed 37.4
± 9.6º. Li et al. (1999) found that the capacity of a quadriceps contraction or hamstring
muscle co-contractions to increase or reduce knee internal rotation changes depending on
the knee flexion angle. They found that although there were no significant differences in
knee internal rotation (~7.5º) with 200N of quadriceps force at 15º, 30º, and 60º of knee
flexion, there was a trend toward increased knee internal rotation angle as the knee
moved from full extension toward 30º of knee flexion, then began to decrease as the knee
moved further into flexion and reached almost zero at 120º of knee flexion with a 200N
of quadriceps force. Conversely, hamstring co-contractions at 60º of knee flexion
reduced knee internal rotation to close to the neutral position, whereas a 30% reduction in
knee internal rotation was observed at 30°, and no change due to hamstring muscle co-
contractions were observed at 15º of knee flexion. These results highlight the variations
in knee flexion angle among subjects at the time of peak knee internal rotation, which
may affect the capacity of quadricep and/or hamstring muscle activation to predict the
amount of knee internal rotation. Thus, the variability in the knee flexion angle at peak
knee internal rotation may be a factor that needs to be controlled in future studies.
As discussed above, retrospectively, there are several possible factors that might
have to be controlled in order to better predicte knee internal rotation motion from thigh
muscle activation. Due to the limitation of EMG measurement (De Luca, 1997), it is not

92
possible at this point to make a conclusion about how quadriceps and hamstring muscle
activation levels influence the amount of knee internal rotation motion. Future study
should consider these factors as they attempt to futher elucidate this relationship.
The Effect of Tibialis Anterior Fatigue on Knee Internal Rotation and Eversion
One of the purposes of this study was to examine the effects of TA fatigue on
rearfoot eversion and knee internal rotation during single leg forward jump stop task. To
fatigue the TA muscle, a pulley system was designed to create a resistance torque that
was opposite the direction of TA moment producing capability. Because of the nature of
the research purpose, it was most important that subjects could reproduce a similar
amount of TA fatigue, most importantly, MVIC strength measurements and MVIC%dec
would have to be reliably consistent day to day. Although the ICC2,k for the preMVIC
(0.75) was moderate, those for postMVIC and MVIC%dec showed excellent reliability
(ICC2,k = 0.87 and 0.90, respectively). Further, although MPF%dec had a relatively low
ICC value (ICC2,k = 0.64), those for preMPF and postMPF showed good to excellent
reliablity (ICC2,k = 0.91 and 0.73, respectively). These results indicate that the TA
fatigue protocol yielded consistent TA fatigue from day to day.
Although subjects experienced an average of 55% MVIC%dec in the TA muscle
after the fatiguing exercise, the results showed that TA fatigue did not increase the total
amount of eversion (EVexc) and knee internal rotation motions (KIRexc) during the
single leg forward jump stop task. While this finding was contrary to the research
hypothesis, it is in agreement with a previous study that observed no change in rearfoot
eversion during the stance phase of running after a similar fatigue protocol for dorsiflexor

93
muscles (Christina et al., 2001). However, in the current study, subjects experienced a
greater amount of TA fatigue decline (55.5% in this study versus 42% in the study by
Christina et al. (2001)). In addition, although their fatigue protocol included only sagittal
plane ankle motion, the fatigue protocol in the present study contained an inversion
moment production requirement. Further, TA muscle fatigue was also confirmed by
significant MPF decrease after the fatiguing exercise (Lindstrom, Magnusson, &
Petersen, 1970), and post-fatigue data collection time (103.4 ± 12.8 sec) was short
enough to preserve a significant amount of fatigue according to preliminary data (please
refer to the methods section).
Further, differences in the task should be noted as compared to previous studies.
As discussed previously, in order to simulate the observed acute non-contact ACL
mechanism (Boden et al., 2000; McNair et al., 1990; Olsen et al., 2004), a task that would
produce more ground reaction force than locomotion was used in this study. Thus, if the
TA is an important muscle to control rearfoot eversion, it would be assumed that the
demand for the TA to control the amount of rearfoot eversion during the landing phase
would be higher in the forward jump stop task than running. Even so, TA fatigue did not
cause a significant change in rearfoot eversion, and no relationship between rearfoot
eversion and knee internal rotation was observed. Hence, these studies collectively
suggest that the TA is not a significant contributor to the control of rearfoot eversion
motion during this dynamic task.
One possible explanation for why no change in total rearfoot eversion motion was
observed after the fatiguing exercise is that other muscle(s) or muscle group(s) may have

94
compensated for the TA muscle in controlling the amount of rearfoot eversion. As
mentioned by Gerritsen et al (Gerritsen et al., 1994), in actual human movement,
changing the function of one structure does not necessarily lead to changes in only the
function of that structure. Other structures may compensate for change in the function of
a certain structure (e.g. tibialis anterior muscle fatigue). A cadaver study has
demonstrated that the triceps surae muscle group and tibialis posterior muscle have a
moment arm for not only plantar flexion but inversion (Klein et al., 1996). Therefore, if
these muscles compensated for the TA in regulating the amount of rearfoot eversion, no
change in the amount of rearfoot eversion might be observed. In fact, it has been
reported that compared to the inversion moment arm for the TA (3.8 mm), the tibialis
posterior muscle has a much longer inversion moment arm on average (19.1 mm) (Klein
et al., 1996). Further, the triceps surae muscles also have a 5.3mm inversion moment arm
on average (Klein et al., 1996). Thus, even in this type of heel to toe or relatively flat
foot landing motion, it is possible that these muscles may have contributed to controlling
the amount of rearfoot eversion.
In support of this possible explanation, results from the path analysis have shown
that greater TA fatigue was related to a decrease in rearfoot eversion excursion from the
touch down to peak knee internal rotation in the post-fatigue condition compared to pre-
fatigue condition. The result that no relationship was found between pre-fatigue rearfoot
eversion excursion and MVIC%dec further strengthen the possibility that subjects tended
to compensated for TA fatigue using other inverter muscles. In fact, post-hoc analysis
comparing the %MVICRMS for TA in pre- and post-fatigue conditions (10.1±7.5% and

95
6.9±5.7% in pre- and post-fatigue conditions, respectively) showed that post-fatigue
%MVICRMS for TA was significantly less during 150ms before the touch down following
fatigue (t = 4.081, p < 0.001). This result suggests that subjects activated less in the post-
fatigue condition before touch down compared with the pre-fatigue condition. However,
in both cases, TA muscle activation is relatively low prior to touch down. Hence, TA
fatigue may have had a negligible effect on TA activation, thus rearfoot eversion, during
the stance phase immediately after touch down. Future studies should examine these
relationships further into the stance phase, as well as account for other inverter muscles
(e.g. triceps surae, tibialis posterior) which may also act to control rearfoot eversion
during dynamic tasks.
Likewise, the amount of KIRexc did not change after TA fatigue. If rearfoot
eversion was an important factor to affect the amount of tibial internal rotation, one
would expect some change in knee internal rotation excursion (albeit in the opposite
direction of what was hypothesized). If greater rearfoot eversion was related to greater
tibial internal rotation on the calcaneous and thus knee internal rotation, the lack of
change in KIRexc after fatigue might simply be attributed to no change in rearfoot
eversion motion. However, at this point, because no significant relationship was found
between rearfoot eversion and knee internal rotation motions in the path analysis, it is
unclear why no change was observed in knee internal rotation after TA fatigue.

96
The Relationship of Knee Internal Rotation with Rearfoot Eversion
and Thigh Muscle Activation in the Post-fatigue Condition
The results from path analysis for the post-fatigue conditions were the same as
that for the pre-fatigue condition, except that %VL was significantly and positively
related with knee internal rotation excursion. As no change in total eversion motion
(EVexc) was found following fatigue, it is not surprising that the relationship between
rearfoot eversion and knee internal rotation motions did not change in the post-fatigue
condition. The small magnitude of the standardized path coefficient between TA fatigue
(MVIC%dec) and post fatigue eversion motion (postEVKIRexc) also indicate that even
though there were some effects of TA fatigue, the treatment effect was too minimal to
effect a change in this relationship.
During the post-fatigue single leg forward jump stop task, there was no
appreciable change in the time to peak knee internal rotation (71.0 ± 29.4ms) compared
with the pre-fatigue condition (70.2 ± 26.8 ms) or changes in thigh muscle activation
levels (see Table 3 and Appendix G). One possible explanation is that the EMD for the
VL may have matched up better with the time to peak knee internal rotation in the post-
fatigue condition, increasing the capacity of %VL to predict change in knee internal
rotation motion. During the TA fatiguing exercise, it was observed that subjects tended
to activate their quadriceps muscles more as TA fatigue progress. This indicates that
subjects did not use the TA in isolation to lift the weight, and contracted their quadriceps
muscles more as they fatigued. It has been reported that EMD is lengthened after
repeated maximal isometric contractions by about 50% (Zhou, 1996). It is unknown to

97
what extent quadriceps muscle fatigue occurred. However, if the EMDs of some
subjects, especially those who had a longer time to peak knee internal rotation, were
lengthened because of the quadriceps fatigue, %VL might better represent the level of
quadriceps muscle contraction at the time of peak knee internal rotation. As a result, the
prediction capacity of post%VL might be increased to some extent in the post-fatigue
condition.
Conversely, while ST did not show an appreciable increase in average RMS
amplitude during the fatiguing protocol, BF showed some increase in activity as TA
fatigue progress during the fatigue protocol. Although the direction for the association
between hamstring muscle activations and knee internal rotation following TA fatigue
became negative as expected, the relationships did not become significant. It is unknown
to what extent the EMD for both hamstring muscles were changed due to fatigue.
However, it is unlikely that hamstring muscles demonstrated the same amount of
compensatory contractions as the quadriceps did. This is supported by a lesser change in
RMS amplitude in ST and BF compared with that for VL as fatigue progressed (see
Table 5).
The possible issue of EMD may be strengthened by comparing the thigh muscle
activation levels between pre- and post-fatigue conditions. As mentioned previously,
there were no appreciable changes in the muscle activation levels between pre- and post-
fatigue conditions. Thus, any change in the relationships between thigh muscle
activations and knee internal rotation motion in the post-fatigue condition was likely due
to other reasons than changes in activation levels. Thus, changes in EMD are more likely

98
to be responsible for the change in the relationships between thigh muscle activation and
knee internal rotation motion following tibial anterior muscle fatigue.
Because many factors influence EMG amplitude and muscle contraction force or
moment producing capability of muscle (De Luca, 1997), the extent to which the EMG
amplitude relates to muscle contraction force is unknown. However, these results tend to
support that quadriceps contraction may increase knee internal rotation during weight
bearing motion when the knee is flexed less than 60° (see Table 3) as demonstrated by Li
et al. (1999) and others (DeMorat et al., 2004; Hirokawa et al., 1992). These findings
strengthen the importance of controlling quadriceps muscle contraction when examining
the relationship between rearfoot eversion and knee internal rotation. Thus, the
hypothesis that greater quadriceps muscle activation relates to greater knee internal
rotation was partly supported. Further, the change in the relationship between thigh
muscle activation and knee internal rotation in the post-fatigue as compared with the pre-
fatigue condition indicate the necessity to examine mehods of EMG analysis so that
EMG data can best represent the state of muscle contractions at a certain point in time.
Limitations
Although this study tried to examine the factors that affect knee internal rotation
comprehensively, there were several limitations in this study. Firstly, it was not possible
in this study to control for some intrinsic factors that might affect the amount of motion
transfer from rearfoot eversion to tibial internal rotation.
Theoretically, if there is no loss of motion transfer from eversion to tibial internal
rotation and if the angle of the subtalar joint axis is 45° in the sagittal plane, eversion and

99
tibial internal rotation should have the same amount of range of motion (V. T. Inman,
1976). Thus, if all subjects had the same subtalar joint axis angle in the sagittal plane with
no loss in motion transfer, there would be a perfect positive correlation between eversion
and tibial internal rotation. If this was the case, unless hip joint motion attenuated tibial
internal rotation (Lafortune et al., 1994), high positive correlations between rearfoot
eversion and knee internal rotation would be expected. However, a relatively large
amount of inter-individual differences in the angle of the subtalar joint axis in the sagittal
plane (the range between 20 and 68º) has been reported (Lundberg, 1989; Manter, 1941;
Root et al., 1966). Thus, this large variability in the subtalar joint axis angle in the
sagittal plane could become one of the uncontrollable factors when examining the
relationship between the amount of rearfoot eversion and knee internal rotation.
The mobility or laxity in the talocrural joint might be another factor that might
influence the amount of motion transfer ratio from rearfoot eversion to tibial internal
rotation. The theory of the motion transfer from rearfoot eversion to tibial internal
rotation has been based on the assumption that the talocrural joint has only one degree of
freedom; dorsi/plantar flexion (V. T. Inman, 1976). However, Siegler et al. (1988)
reported using a cadaver ankle that the transverse rotation motion could occur at the
talocrural joint. Thus, some amount of eversion might not be completely transferred to
tibial internal rotation depending on the mobility/laxity of the talocrural joint.
Another factor to change the amount of the motion transfer from the eversion to
tibial internal rotation may be the position of and the axial load to the ankle joint.
Hintermann et al. (Hintermann et al., 1994) examined the amount of motion transfer ratio

100
from eversion to tibial internal rotation at different dorsiflexion angles and axial loads.
Their study found that the motion transfer ratio from eversion to tibial internal rotation
decreased as the dorsiflexion angle and axial load to the ankle joint increased. As each
subject likely had different ankle joint positions and ankle joint loadings during the
landing task, the motion transfer from eversion and tibial internal rotation might also be
different among subjects.
Further, foot type has been shown to influence the motion transfer ratio (McClay
& Manal, 1997; Nawoczenski et al., 1998). Using a radiography, Nawoczenski et al.
(1998) classified the subjects into low rearfoot or high rearfoot groups (people with high
or low rearfoot inclination angle in sagittal plane, respectively) according to their
calcaneal inclination and lateral tarometatarsal angles in sagittal plane, and anterior-
posterior talometatarsal angles in transverse plane. They found that a foot with high
rearfoot angle had significantly higher motion transfer ratio from eversion to tibial
internal rotation (1.09) than a foot with low rearfoot angle (0.65), suggesting that people
with high inclination in the rearfoot experience larger tibial internal rotations given a
certain amount of EV than people with low rearfoot inclinations. MacClay and Manal
reported a higher motion transfer ratio (0.81) in people with pronated feet (foot eversion
greater than 18º during running) than people with a normal foot (0.65) (the foot eversion
between 8º and 15º during running). These differing results in the motion transfer ratio
may be attributed to method of clasifying foot types, however, their results indicate the
possibility of motion transfer ratio variability depending on the characteristics of the foot.

101
In summary, a variety of factors may result in considerable intersubject variability
in the motion transfer from eversion to tibial internal rotation during a single leg forward
jump stop task. However, the current study attempted to control for this inter-subject
variability by using a within subjects design, and by recruiting a large enough sample to
ensure adequate statistical power to identify meaningful relationships should they exist.
Thus, it seems unlikely the variability in motion transfer alone would completely explain
the lack of relationships between rearfoot eversion and knee internal rotation. Given the
type of task used, it is possible that other factors previously described (e.g. variations in
knee flexion angle and its interaction with thigh muscle activation) may need to be taken
into account in future studies to further clarify this relationship.
Inability to establish a standardized neutral position for each person is one
potential limitation. In the current study, the neutral position was recorded as a normal
standing position. Although each standing positon was standardized with the subjects
standing straight and placing both feet pararel and shoulder width apart, this position does
not control ankle position, especially in the frontal plane. Because the subject was not
positioned in neutral alignment, the present study used excursion values for kinematic
data. It is unknown if this may have affected the relationship between rearfoot eversion
and knee internal rotation, and if different results would have been obtained with pure
values based on some standardized neutral position. In future research, establishing a
position that best representative neutral alignment across individuals may improve our
understanding of the relationship between ankle and knee joint kinematics.

102
Finally, the limitations of sEMG should also be noted. Because of the previous
findings that quadriceps and hamstring muscle contraction forces affect the amount of
knee internal rotation, this study examined the amount of muscle activations that was
normalized by each muscle’s MVIC. However, as Deluca described (De Luca, 1997), it
is unknown to what extent these EMG activations associate with actual muscle
contraction force during dynamic tasks. Thus, even if the relationship between
quadriceps muscle activation and knee internal rotation was found in this study, future
research would be needed to verify the relationship between quadriceps contraction force
and knee internal rotation during dynamic motions.
Conclusions
This study examined the extent to which rearfoot eversion and quadriceps and
hamstring muscle activations relate to knee internal rotation motion during a single leg
forward jump stop task. Based on an expected relationship between rearfoot eversion and
knee internal rotation, this study also examined how tibialis anterior muscle fatigue may
influence rearfoot eversion motion, and alter knee internal rotation motion. However, a
relationship between greater rearfoot eversion and greater knee internal rotation was not
observed. This study and others (Lafortune et al., 1994; McClay & Manal, 1997; Nester
et al., 2003) suggest that notion that excessive foot pronations lead to excessive knee
internal rotation and an increase in ACL injury risk may need to be re-examined.
However, these findings are limited to a single leg forward jump stop task, and the
theoretical connections between rearfoot eversion, knee internal rotation and ACL injury
risk during other functionally relevant dynamic tasks should be evaluated. Further, the

103
expected increase in rearfoot eversion during the single leg forward jump stop task
following tibialis anterior fatigue did not occur, and further strengthens previous work
(Christina et al., 2001) that found TA fatigue is not a significant determinant of rearfoot
eversion motion.
Because cadaver studies have demonstrated that greater quadriceps and lesser
hamstring muscle contraction forces increase the amount of knee internal rotation, this
study also examine if these relationship existed during a dynamic task. Results in the
post-fatigue conditions support the previous cadaver studies that greater quadriceps
activation was related to greater knee internal rotation. Although this result is not
conclusive, it further supports studies that suggest excessive quadriceps contractions may
increase the risk of ACL injury via more anterior shear forces and knee internal rotation
(Arms et al., 1984; DeMorat et al., 2004). Due to the limitations of sEMG
measurements, further study is needed to clarify these relationships, as this study only
measured muscle activation levels and did not measure actual muscle contraction forces.
If the quadriceps muscle contraction force during shallow knee flexion increases
the amount of knee internal rotation and ACL strain due to its anterior shear force, this
study further emphasizes the necessity to prevent excessive quadriceps contraction
demand. Future studies should also examine techniques to reduce the quadriceps
contraction demand during sudden deceleration tasks.

104
REFERENCES
Allen, D. (2004). Skeltal muscle function: role of ionic changes in fatigue, damage and disease. Clin Exp Pharmacol Physiol, 31, 485-493.
Anderson, P., Adams, R. P., Sjøgaard, G., Thorboe, A., & Saltion, B. (1985). Dynamic knee extension as model for study of isolated exercising muscle in humans. J Appl Physiol, 59(5), 1647-1653.
Arms, S., Pope, M. H., Johnson, R. J., Fischer, R. A., Arvidsson, I., & Eriksson, E. (1984). The biomechanics of anterior cruciate ligament rehabilitation and reconstruction. Am J Sports Med, 12(1), 8-18.
Asumussen, E. (1979). Muscle fatigue. Med Sci Sports, 11(4), 313-321.
Baratta, R., Solomonow, M., Zhou, B. H., Letson, D., Chuinard, R., & D'ambrosia, R. (1988). Muscle coactivation - the role of the antagonist musculature in maintaining knee stability. Am J Sports Med, 16(2), 113-122.
Beckett, K. E., Massie, D. L., Bowers, K. D., & Stoll, D. A. (1992). Incidence of hyperpronation in the ACL injured knee: A clinical perspective. J Athl Train, 27(1), 58-62.
Beynnon, B. D., Fleming, B. C., Johnson, R. J., Nichols, C. E., Renstrom, P. A., & Pope, M. H. (1995). Anterior cruciate ligament strain behavior during rehabilitation exercises in vivo. Am J Sports Med, 23(1), 24-34.
Beynnon, B. D., Johnson, R. J., Fleming, B. C., Stankewich, C. J., Renstrom, P. A., & Nichols, C. E. (1997). The strain behavior of the anterior cruciate ligament during squatting and active flexion-extension: A comparison of an open and closed kinetic chain exercise. Am J Sports Med, 25(6), 823-829.
Boden, B. P., Dean, G. S., Feagin, J. A., & Garrett Jr, W. E. (2000). Mechanisms of Anterior Cruciate Ligament Injury. Orthopedics, 23(6), 537-578.

105
Bollen, K., & Long, J. S. (1993). Testing structural equation models. Newbury Park, CA: Sage.
Branch, T., Hunter, R., & Donath, M. (1989). Dynamic EMG analysis of the anterior cruciate ligament deficient legs with and without bracing during cutting. Am J Sports Med, 17, 35-41.
Browne, M. W., & Cudeck, R. (1993). Alternative ways of assessing model fit. In K. A. Bollen & J. S. Long (Eds.), Testing structural equation models (pp. 136-162). Newbury Park, CA: Sage.
Buford Jr, W. L., Ivey Jr, F. M., Nakamura, T., Patterson, R. M., & Nguyen, D. K. (2001). Internal / external rotation moment arms of muscles at the knee: moment arms for the normal knee and the ACL-deficient knee. Knee, 8, 293-303.
Butler, D. L., Noyes, F. R., & Grood, E. S. (1980). Ligamentous restraints to anterior-posterior drawer in the human knee. J Bone Joint Surg Am, 62A(2), 259-270.
Cerulli, G., Benoit, D. L., Lamontagne, M., Caraffa, A., & Liti, A. (2003). In vivo anterior cruciate ligament strain behaviour during a rapid deceleration movement: case report. Knee Surg Sports Traumatol Arthrosc, 11, 307-311.
Chan, A. Y. F., Lee, F. L. L., Wong, P. K., Wong, C. Y. M., & Yeung, S. S. (2001). Effects of knee joint angles and fatigue on the neuromuscular control of vastus medialis oblique and vastus lateralis muscles in humans. Eur J Appl Physiol, 84, 36-41.
Christina, K. A., White, S. C., & Gilchirist, L. A. (2001). Effect of localized muscle fatigue on vertical ground reaction forces and ankle joint motion during running. Hum Mov Sci, 20, 2001.
Cornwall, M. W., & Mcpoil, T. G. (1994). The influence of tibialis anterior muscle activity on rearfoot motion during walking. Foot Ankle, 15, 75-79.
De Luca, C. J. (1997). The use of surface electromyography in biomechanics. J Appl Biomech, 13, 135-163.

106
DeMorat, G., Weinhold, P., Blackburn, T., Chudik, S., & Garrett, W. (2004). Aggressive quadriceps loading can induce noncontact anterior cruciate ligament injury. Am J Sports Med, 32(2), 477-483.
Elliott, B. C., & Blanksby, B. A. (1979). The synchronization of muscle activity and body segment movements during a running cycle. Med Sci Sports, 11(4), 322-327.
Feltner, M. E., Macrae, H. S. H., Macrae, P. G., Turner, N. S., Hartman, C. A., Summers, M. L., et al. (1994). Strength training effects on rearfoot motion in running. Med Sci Sports Exerc, 26, 1021-1027.
Ferretti, A., Papandrea, P., Conteduca, F., & Mariani, P. P. (1992). Knee ligament injuries in volleyball players. Am J Sports Med, 20(2), 203-202.
Fleming, B. C., Renstrom, P. A., Beynnon, B. D., Engstrom, B., Peura, G. D., Badger, G. J., et al. (2001). The effect of weightbearing and external loading on anterior cruciate ligament strain. J Biomech, 34, 163-170.
Fowles, J. R., Green, H. J., Tupling, R., O'Brian, S., & Roy, B. D. (2002). Human neuromuscular fatigue is associated with altered Na+ -K+ -ATPase activity following isometric exercise. J Appl Physiol, 92, 1585-1593.
Fukuda, Y., Woo, S. L.-Y., Loh, J. C., Tsuda, E., Tang, P., McMahon, P. J., et al. (2003). A quantitative analysis of valgus torque on the ACL: a human cadaveric study. J Orthop Res, 21, 1107-1112.
Gabriel, M. T., Wong, E. K., Woo, S. L.-Y., Yagi, M., & Debski, R. E. (2004). Distribution of in situ forces in the anterior cruciate ligament in response to rotatory loads. J Orthop Res, 22, 85-89.
Gerritsen, K. G., van den Bogert, A. J., & Nigg, B. M. (1994). Direct dynamics simulation of the impact phase in heel-toe running. J Biomech, 28(6), 661-668.
Gleeson, N. P., Reilly, T., Mercer, T. H., Rakowski, S., & Rees, D. (1998). Influence of acute endurance activity on leg neuromuscular and musculoskeletal performance. Med Sci Sports Exerc, 30(4), 596-608.
107
Heijne, A., Fleming, B. C., Renstrom, P. A., Peura, G. D., Beynnon, B. D., & Werner, S. (2004). Strain on the anterior cruciate ligament during closed kinetic chain exercises. Med Sci Sports Exerc, 36(6), 935-941.
Hintermann, B., Nigg, B. M., Sommer, C., & Cole, G. K. (1994). Transfer of movement between calcaneus and tibia in vitro. Clin Biomech (Bristol, Avon), 9, 349-355.
Hirokawa, S., Solomonow, M., Lu, Y., Lou, Z.-P., & D'ambrosia, R. (1992). Anterior-posterior and rotational displacement of the tibia elicited by quadriceps contraction. Am J Sports Med, 20(3), 299-306.
Houtman, C. J., Stegeman, D. F., Van Dijk, J. P., & Zwarts, M. J. (2003). Changes in muscle fiber conduction velocity indicate recruitment of distinct motor unit populations. J Appl Physiol, 95, 1045-1054.
Howell, D. C. (2002). Statistical Methods for Psychology (5 ed.). Pacific Grove: Wadsworth.
Hu, L., & Bentler, P. M. (1995). Evaluating model fit. In R. H. Hoyle (Ed.), Structural equation modelling: Concepts, issues, and applications (pp. 76-99). Thousand Oaks, CA: Sage.
Hunt, E., Smith, R. M., & Torode, M. (2001). Extrinsic muscle activity, foot motion and ankle joint moments during the stance phase of walking. Foot Ankle Int, 22, 31-41.
Inman, V., Ralston, H., & Todd, F. (1981). Human Walking (Vol. 39). Baltimore: Williams and Wilkins.
Inman, V. T. (1976). The joints of the ankle. Baltimore: The Williams & Wilkins Company.
Ireland, M. L. (1999). Anterior cruciate ligament injury in female athletes: epidemiology. J Athl Train, 34(2), 150-154.
108
Isaac, D. L., Beard, D. J., Price, A. J., Murray, D. W., & Dodd, C. A. F. (2005). In-vivo sagittal plane knee kinematics: ACL intact, deficient and reconstructed knees. Knee, 12, 25-31.
Kanamori, A., Woo, S. L.-Y., Ma, B., Zeminski, J., Rudy, T. W., Li, G., et al. (2000). The forces in the anterior cruciate ligament and knee kinematics during a simulated pivot shift test: a human cadaveric study using robotic technology. Arthroscopy, 16(6), 633-639.
Kanamori, A., Zeminski, J., Rudy, T. W., Li, G., Fu, F. H., & Woo, S. L.-Y. (2002). The effects of axial tibial torque on the function of the anterior cruciate ligament: a biomechanical study of a simulated pivot shift test. Arthroscopy, 18(4), 394-398.
Klein, P., Mattys, S., & Rooze, M. (1996). Moment arm length variations of selected muscles acting on talocrural and subtalar joints during movement: An in vitoro study. J Biomech, 29(1), 21-30.
Kroll, W. (1974). Fractionated reaction and reflex time before and after fatiguing isotonic exercise. Med Sci Sports, 6, 260-266.
Lafortune, M. A., Cavanagh, P. R., Sommer, H. J. r., & Kalenak, A. (1994). Foot inversion-eversion and knee kinematics during walking. J Orthop Res, 12(3), 412-420.
Leardini, A., Cappozzo, A., Catani, F., Toksvig-Larsen, S., Petitto, A., Sforza, V., et al. (1999). Validation of a functional method for the estimation of hip joint centre location. J Biomech, 32, 99-103.
Leardini, A., Stagni, R., & O'Connor, J. (2001). Mobility of the subtalar joint in the intact ankle complex. J Biomech, 34, 805-809.
Leppik, J. A., Aughey, R. J., Medved, I., Fairweather, I., Carey, M. F., & Mckenna, M. J. (2004). Prolonged exercise to fatigue in fuman impairs skeltal muscle Na+ -K+ -ATP ase activity, sarcoplasmic reticulum Ca2+ release, and Ca2+ uptake. J Appl Physiol, 97, 1414-1423.

109
Li, G., Rudy, T. W., Sakane, M., Kanamori, A., Ma, C. B., & Woo, S. L.-Y. (1999). The importance of quadriceps and hamstring muscle loading on knee kinematics and in-situ forces in the ACL. J Biomech, 32, 395-400.
Lightfoot, A. J., Mckinley, T., Doyle, M., & Amendola, A. (2005). ACL tear in collegiate wrestlers: Report of six cases in one season. Iowa Orthop J, 25, 145-148.
Lindstrom, L., Magnusson, R., & Petersen, I. (1970). Muscular fatigue and action potential conduction velocity changes studied with frequency analysis of EMG signals. Electromyography(4), 341-356.
Loudon, J. K., Jenkins, W., & Loudon, K. L. (1996). The relationship between static posture and ACL injury in female athletes. J Orthop Sports Phys Ther, 24, 91-97.
Lundberg, A. (1989). Kinematics of the ankle and foot: In vivo roentogen stereophotogrammetry. Acta Orthop Scand Suppl, 233(60).
Lundberg, A., Svensson, O. K., Bylund, C., Goldie, I., & Selvik, G. r. (1989). Kinematics of the ankle/foot complex - Part 2: Pronation and supination. Foot Ankle, 9(5), 1989.
MacWilliams, B. A., Wilson, D. R., DesJardins, J. D., Romero, J., & Chao, E. Y. (1999). Hamstrings cocontraction reduces internal rotation, anterior translation, and anterior cruciate ligament load in weight-bearing flexion. J Orthop Res, 17(6), 817-822.
Madigan, M. L., & Pidcoe, P. E. (2003). Change in landing biomechanics during a fatiguing landing activity. J Electromyogr Kinesiol, 13, 491-498.
Manter, J. T. (1941). Movements of the subtalar and transverse tarsal joints. Anat Rec, 80, 397-410.
Markolf, K. L. (1990). Direct Measurement of resultant forces in the anterior cruciate ligament. J Bone Joint Surg, 72-A(4), 557-567.

110
Markolf, K. L., O'Neil, G., Jackson, S. R., & McAllister, D. R. (2004). Effects of applied quadriceps and hamstrings muscle loads on forces in the anterior and posterior cruciate ligaments. Am J Sports Med, 32(5), 1144-1149.
McClay, I., & Manal, K. (1997). Coupling parameters in runners with normal and excessive pronation. J Appl Biomech, 13, 109-125.
McLean, S. G., Huang, X., Su, A., & van den Bogert, A. J. (2004). Sagittal plane biomechanics cannot injure the ACL during sidestep cutting. Clinic Biomech, 19, 828-838.
McNair, P. J., Marshall, R. N., & Matheson, J. A. (1990). Important features associated with acute anterior cruciate ligament injury. N Z Med J, 103, 537-539.
Mercer, T. H., Gleeson, N. P., Claridge, S., & Clement, S. (1998). Prolonged intermittent high intensity exercise impairs neuromuscular performance of the knee flexors. Eur J Appl Physiol, 77, 560-562.
Miyasaka, T., Matsumoto, H., Suda, Y., Otani, T., & Toyama, Y. (2002). Coordination of the anterior and posterior cruciate ligaments in constraining the varus-valgus and internal-external rotatory instability of the knee. J Orthop Sci, 7, 348-353.
Moore, K. L. (1992). Clinical Oriented Anatomy (3rd ed.). Baltimore: Williams & Wilkins.
Nawoczenski, D. A., Saltzman, C. L., & Cook, T. M. (1998). The effect of foot structure on the three-dimentional kinematic coupling behavior of the leg and rear foot. Phys Ther, 78(4), 404-416.
Nester, C. J., van den Bogert, A. J., & Bowker, P. (2003). Effect of foot orthoses on the kinetics and kinematics of normal walking gait. Gait Posture, 17, 180-187.
Nigg, B. M., Cole, G. K., & Nachbauer, W. (1993). Effect of arch height of the foot on angular motion of the lower extremities in running. J Biomech, 26, 909-916.

111
Nyland, J. A., Caborn, D. N., Shapiro, R., & Johnson, D. L. (1999). Crossover cutting during hamstring fatigue produces transverse plane knee control deficits. J Athl Train, 37, 137-.
Nyland, J. A., Shapiro, R., Caborn, D. N. M., Nitz, A. J., & R., M. T. (1997). The effect of quadriceps femoris, hamstring, and placebo eccentric fatigue on knee and ankle dynamics during crossover cutting. J Orthop Sports Phys Ther, 25(3), 171-184.
O'connor, K. M., & Hamill, J. (2004). The role of selected extrinsic foot muscles during running. Clinic Biomech, 19, 71-77.
Olsen, O. E., Myklebust, G., Engebretsen, L., & Bahr, R. (2004). Injury mechanisms for anterior cruciate ligament injuries in team handball A systematic video analysis. Am J Sports Med, 32(4), 1002-1012.
Olsen, O. E., Myklebust, G., Engebretsen, L., Holme, I., & Bahr, R. (2003). Relationship between floor type and risk of ACL injury in team handball. Scand J Med Sci Sports, 13, 299-304.
Ortenblad, N., Sjogaard, G., & Madsen, K. (2000). Impaired sarcoplasmic reticulum Ca2+ release rate after fatiguing stimulation in rat skeltal muscle. J Appl Physiol, 89, 210-217.
Paasuke, M., Ereline, J., & Gapeyeva, H. (1999). Neuromuscular fatigue during repeated exhaustive submaximal static contractions of knee extensor muscles in endurance-trained, power-trained and untrained men. Acta Physiol Scand, 166, 319-326.
Pandy, M. G., & Schelburne, K. B. (1997). Dependence of cruciate-ligament loading on muscule forces and external load. J Biomech, 30(10), 1015-1024.
Pflum, M., Shelburne, K. B., Torry, M. R., Decker, M. J., & Pandy, M. G. (2004). Model prediction of anterior cruciate ligament force during drop-landings. Med Sci Sports Exerc, 36(11), 1949-1958.
Rainoldi, A., Melchiorri, G., & Caruso, I. (2004). A method for positioning electrodes during surface EMG recordings in lower limb muscles. J Neurosci Methods(134), 37-43.

112
Rodacki, A. L. F., Fowler, N. E., & Bennett, S. J. (2002). Vertical jump coordination: fatigue effects. Med Sci Sports Exerc, 34(1), 105-116.
Root, M. L., Weed, J. H., Sgarlato, T. E., & Bluth, D. R. (1966). Axis of motion of the subtalar joint. J Am Podiatry Assoc, 56(4), 149-155.
Sakane, M., Livesay, G. A., Fox, R. J., Rudy, T. W., Runco, T. J., & Woo, S. L.-Y. (1999). Relative contribition of the ACL, MCL, and bony contact to the anterior stability of the knee. Knee Surg Sports Traumatol Arthrosc, 7, 93-97.
Shelburne, K. B., & Pandy, M. G. (1998). Determinants of cruciate-ligament loading during rehabilitation exercise. Clinic Biomech, 13, 403-413.
Siegler, S., Chen, J., & Schneck, C. D. (1988). The three dimensional kinematics and flexibility characteristics of the human ankle and subtalar joints - Part I: Kinematics. J Biomech Eng, 110(4), 364-373.
Solomonow, M., Baratta, R., Zhou, B. H., Shoji, H., Bose, W., Beck, C., et al. (1987). The synergistic action of the anterior cruciate ligament and thigh muscles in maintaining joint stability. Am J Sports Med, 15(3), 207-213.
Speer, K. P., Spritzer, C. E., Bassett, F. H., Feagin, J. A., & Garrett, W. E. (1992). Osseous injury associated with acute tears of the anterior cruciate ligament. Am J Sports Med, 20(4), 382-389.
Swanik, C. B., Lephart, S. M., Swanik, K. A., Stone, D. A., & Fu, F. H. (2004). Neuromuscular dynamic restraint in women with anterior cruciate ligament injuries. Clin Orthop Relat Res, 425, 189-199.
Warren, R. F., & Marshall, J. L. (1978). Injuries of the anterior cruciate and medial collateral ligaments of the knee - a retrospective analysis of clinical records part I. Clin Orthop, 136, 191-197.
Winter, D. A. (1990). Biomechanics and Motor Control of Human Movement (2 ed.). New York, NY: John Wiley & Sons, Inc.

113
Woo, S. L.-Y., Fox, R. J., Sakane, M., Livesay, G. A., Rudy, T. W., & Fu, F. H. (1998). Biomechanics of the ACL: Measurements of in situ force in the ACL and knee kinematics. Knee, 5, 267-288.
Woodford-Rogers, B., Cyphert, L., & Denegar, C. R. (1994). Risk factors for anterior cruciate ligament injury in high school and college athletes. J Athl Train, 29, 343-346.
Wright, D. G., Desal, S. M., & Henderson, W. H. (1964). Action of the subtalar and ankle-joint complex during the stance phase of walking. J Bone Joint Surg Am, 46-A(2), 361-382.
Wu, G. (1995). Kinematics Theory. In R. L. Craik & C. A. Oatis (Eds.), Gait Analysis: Theory and Application (pp. 159-182). St. Louis: Mosby - Year Book, Inc.
Yaggie, J. A., & McGregor, S. J. (2002). Effects of isokinetic ankle fatigue on the maintenance of balance and postural limits. Arch Phys Med Rehabil, 83, 224-228.
Zhou, S. (1996). Acute effect of repeated maximal isometric contraction on electromechanical delay of knee extensor muscle. J. Electromyogr Kinesiol, 6(2), 117-127.

114
APPENDIX A. SUBJECT DATA SHEET
Shimokochi Dissertation Participant Data Sheet
To Be Completed By Participant Date:________________
1. Name: ________________________________________________
2. Age: ________________ Sex (Please circle one): Male Female
3. Your stance leg when kicking a soccer ball (Please circle one): Right Left
4. Physical Activity: ________min/day ________time/a week
5. Do you have any current lower extremity injuries (Foot, Ankle, Knee, Hip)
______ Yes _______ No
If yes, please describe:
_____________________________________________________________________
_____________________________________________________________________
6. If you have any past injuries that may impair your ability to land or jump, please
indicate current status:
__________________________________________________________________
________________________________________________________________
To Be Completed By Investigator
Day ________ First MVIC for the thight: Ext Flx Subject number _______ Height: ___________cm Weight: __________kg 75% Height: ___________cm 5% Wt: __________kg Fatiguing Exercise Repetitions: ___________ Time from the post-fatigue MVIC to the end of post-fatigue jump stop task: _____ min_____sec

115
APPENDIX B. LISREL SYNTAX AND OUTPUT FOR HYPOTHESIS 1 DA NI=5 NO=72 MA=CM LA preKIRexc preEVexc pre%VL pre%BF pre%ST CM 12.99 2.89 31.78 2.10 -1.77 22.93 1.84 -2.82 10.57 84.72 2.48 1.97 22.21 67.53 114.23 MO Ny=1 Nx=4 PD OU SS DA NI=5 NO=72 MA=CM Number of Input Variables 5 Number of Y - Variables 1 Number of X - Variables 4 Number of ETA - Variables 1 Number of KSI - Variables 4 Number of Observations 72 DA NI=5 NO=72 MA=CM Covariance Matrix preKIRex preEVexc pre%VL pre%BF pre%ST -------- -------- -------- -------- -------- preKIRex 12.99 preEVexc 2.89 31.78 pre%VL 2.10 -1.77 22.93 pre%BF 1.84 -2.82 10.57 84.72 pre%ST 2.48 1.97 22.21 67.53 114.23 DA NI=5 NO=72 MA=CM Parameter Specifications GAMMA preEVexc pre%VL pre%BF pre%ST -------- -------- -------- -------- preKIRex 1 2 3 4 PHI preEVexc pre%VL pre%BF pre%ST -------- -------- -------- -------- preEVexc 5 pre%VL 6 7

116
pre%BF 8 9 10 pre%ST 11 12 13 14 PSI preKIRex -------- 15 DA NI=5 NO=72 MA=CM Number of Iterations = 0 LISREL Estimates (Maximum Likelihood) GAMMA preEVexc pre%VL pre%BF pre%ST -------- -------- -------- -------- preKIRex 0.10 0.10 0.02 -0.01 (0.08) (0.10) (0.07) (0.06) 1.28 1.01 0.35 -0.22 Covariance Matrix of Y and X preKIRex preEVexc pre%VL pre%BF pre%ST -------- -------- -------- -------- -------- preKIRex 12.99 preEVexc 2.89 31.78 pre%VL 2.10 -1.77 22.93 pre%BF 1.84 -2.82 10.57 84.72 pre%ST 2.48 1.97 22.21 67.53 114.23 PHI preEVexc pre%VL pre%BF pre%ST -------- -------- -------- -------- preEVexc 31.78 (5.49) 5.79 pre%VL -1.77 22.93 (3.31) (3.96) -0.54 5.79 pre%BF -2.82 10.57 84.72 (6.35) (5.54) (14.64) -0.44 1.91 5.79 pre%ST 1.97 22.21 67.53 114.23 (7.36) (6.82) (14.58) (19.74)

117
0.27 3.26 4.63 5.79 PSI preKIRex -------- 12.48 (2.16) 5.79 Squared Multiple Correlations for Structural Equations preKIRex -------- 0.04 Goodness of Fit Statistics Degrees of Freedom = 0 Minimum Fit Function Chi-Square = 0.0 (P = 1.00) Normal Theory Weighted Least Squares Chi-Square = 0.00 (P = 1.00) The Model is Saturated, the Fit is Perfect ! DA NI=5 NO=72 MA=CM Standardized Solution GAMMA preEVexc pre%VL pre%BF pre%ST -------- -------- -------- -------- preKIRex 0.16 0.13 0.06 -0.04 Correlation Matrix of Y and X preKIRex preEVexc pre%VL pre%BF pre%ST -------- -------- -------- -------- -------- preKIRex 1.00 preEVexc 0.14 1.00 pre%VL 0.12 -0.07 1.00 pre%BF 0.06 -0.05 0.24 1.00 pre%ST 0.06 0.03 0.43 0.69 1.00 PSI preKIRex -------- 0.96

118
Regression Matrix Y on X (Standardized) preEVexc pre%VL pre%BF pre%ST -------- -------- -------- -------- preKIRex 0.16 0.13 0.06 -0.04

119
APPENDIX C. SPSS OUTPUT FOR HYPOTHESIS 2
Paired Samples Statistics
8.199 72 5.637 .664
8.337 72 5.508 .649
8.007 72 3.604 .425
7.668 72 3.783 .446
preCalcEVexc@KIRpk
postCalcEVexc@KIRpk
Pair 1
preKIRexc
postKIRexc
Pair 2
Mean NStd.
DeviationStd. Error
Mean
Paired Samples Correlations
72 .868 .000
72 .834 .000
Pair 1
Pair 2
N Correlation Sig.
Paired Samples Test
-.138 2.861 .337 -.810 .535 -.408 71 .684
.339 2.132 .251 -.162 .840 1.348 71 .182
Pair 1
Pair 2
MeanStd.
DeviationStd. Error
Mean Lower Upper
95% ConfidenceInterval of the
Difference
Paired Differences
t dfSig.
(2-tailed)
Pre = pre-fatigue condition, post = post-fatigue condition, CalcEVexc@KIRpk = rearfoot
eversion at peak knee internal rotation during single leg forward jump stop task, KIRexc
= knee internal rotation excursion during single leg forward jump stop task

120
APPENDIX D. LISREL SYNTAX AND OUTPUT FOR HYPOTHESES 3 AND 4 DA NI=11 NO=72 MA=CM LA preKIRexc preEVKIRexc pre%VL pre%BF pre%st %MVICdec postKIRexc postEVexc post%VL post%BF post%ST CM 12.99 2.89 31.78 2.10 -1.77 22.93 1.84 -2.82 10.57 84.72 2.48 1.97 22.21 67.53 114.23 -15.07 -6.63 2.42 -25.80 -12.54 260.14 11.38 2.11 3.15 -3.12 -1.53 -15.14 14.31 3.33 26.96 -1.68 -2.92 -3.52 -18.76 3.77 30.34 3.68 -3.50 20.94 11.57 23.57 -5.58 5.81 -2.64 32.86 3.75 -2.06 10.53 89.41 74.76 -41.65 1.12 1.47 28.86 137.07 4.74 3.06 18.01 64.17 102.25 -13.30 2.39 -0.17 29.51 95.75 122.34 SE 7 8 6 1 2 3 5 4 9 10 11 MO NX=7 NY=4 GA=FU,FI PS=DI,FR BE=FU,FI FR GA(4,1) FR GA(4,1) GA(4,2) GA(4,3) GA(4,4) FR GA(3,1) FR GA(2,1) FR GA(1,5) GA(1,6) GA(1,7) FR BE(2,3) BE(1,3) BE(1,2) BE(1,4) PD OU SS DA NI=11 NO=72 MA=CM Number of Input Variables 11 Number of Y - Variables 4 Number of X - Variables 7 Number of ETA - Variables 4 Number of KSI - Variables 7 Number of Observations 72 DA NI=11 NO=72 MA=CM Covariance Matrix postKIRe postEVex %MVICdec preKIRex preEVKIR pre%VL -------- -------- -------- -------- -------- -------- postKIRe 14.31 postEVex 3.77 30.34 %MVICdec -15.14 -18.76 260.14 preKIRex 11.38 3.33 -15.07 12.99 preEVKIR 2.11 26.96 -6.63 2.89 31.78 pre%VL 3.15 -1.68 2.42 2.10 -1.77 22.93 pre%st -1.53 -3.52 -12.54 2.48 1.97 22.21 pre%BF -3.12 -2.92 -25.80 1.84 -2.82 10.57

121
post%VL 5.81 -2.64 -5.58 3.68 -3.50 20.94 post%BF 1.12 1.47 -41.65 3.75 -2.06 10.53 post%ST 2.39 -0.17 -13.30 4.74 3.06 18.01 Covariance Matrix pre%st pre%BF post%VL post%BF post%ST -------- -------- -------- -------- -------- pre%st 114.23 pre%BF 67.53 84.72 post%VL 23.57 11.57 32.86 post%BF 74.76 89.41 28.86 137.07 post%ST 102.25 64.17 29.51 95.75 122.34 DA NI=11 NO=72 MA=CM Parameter Specifications BETA postKIRe postEVex %MVICdec preKIRex -------- -------- -------- -------- postKIRe 0 1 2 3 postEVex 0 0 4 0 %MVICdec 0 0 0 0 preKIRex 0 0 0 0 GAMMA preEVKIR pre%VL pre%st pre%BF post%VL post%BF -------- -------- -------- -------- -------- -------- postKIRe 0 0 0 0 5 6 postEVex 8 0 0 0 0 0 %MVICdec 9 0 0 0 0 0 preKIRex 10 11 12 13 0 0 GAMMA post%ST -------- postKIRe 7 postEVex 0 %MVICdec 0 preKIRex 0 PHI preEVKIR pre%VL pre%st pre%BF post%VL post%BF -------- -------- -------- -------- -------- -------- preEVKIR 14 pre%VL 15 16 pre%st 17 18 19 pre%BF 20 21 22 23

122
post%VL 24 25 26 27 28 post%BF 29 30 31 32 33 34 post%ST 35 36 37 38 39 40 PHI post%ST -------- post%ST 41 PSI postKIRe postEVex %MVICdec preKIRex -------- -------- -------- -------- 42 43 44 45 DA NI=11 NO=72 MA=CM Number of Iterations = 14 LISREL Estimates (Maximum Likelihood) BETA postKIRe postEVex %MVICdec preKIRex -------- -------- -------- -------- postKIRe - - 0.04 -0.01 0.83 (0.05) (0.02) (0.07) 0.84 -0.66 12.11 postEVex - - - - -0.05 - - (0.02) -2.50 %MVICdec - - - - - - - - preKIRex - - - - - - - - GAMMA preEVKIR pre%VL pre%st pre%BF post%VL post%BF -------- -------- -------- -------- -------- -------- postKIRe - - - - - - - - 0.13 -0.03 (0.05) (0.03) 2.66 -0.98 postEVex 0.84 - - - - - - - - - - (0.06) 14.45
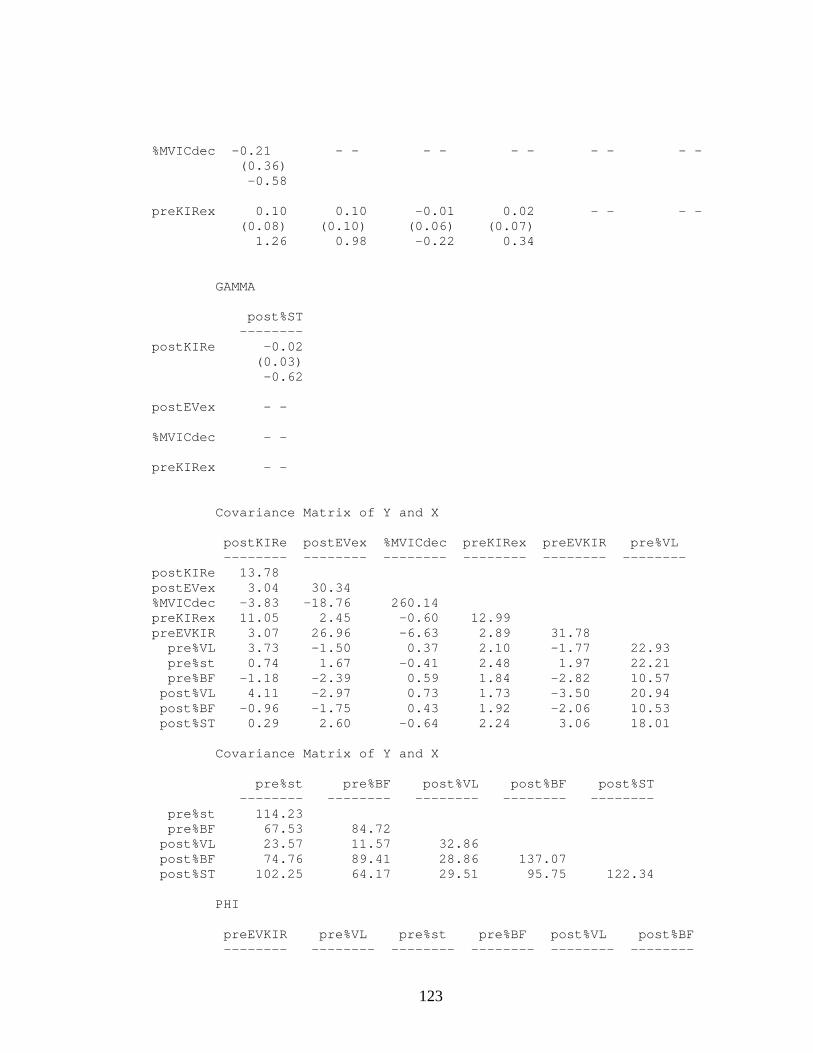
123
%MVICdec -0.21 - - - - - - - - - - (0.36) -0.58 preKIRex 0.10 0.10 -0.01 0.02 - - - - (0.08) (0.10) (0.06) (0.07) 1.26 0.98 -0.22 0.34 GAMMA post%ST -------- postKIRe -0.02 (0.03) -0.62 postEVex - - %MVICdec - - preKIRex - - Covariance Matrix of Y and X postKIRe postEVex %MVICdec preKIRex preEVKIR pre%VL -------- -------- -------- -------- -------- -------- postKIRe 13.78 postEVex 3.04 30.34 %MVICdec -3.83 -18.76 260.14 preKIRex 11.05 2.45 -0.60 12.99 preEVKIR 3.07 26.96 -6.63 2.89 31.78 pre%VL 3.73 -1.50 0.37 2.10 -1.77 22.93 pre%st 0.74 1.67 -0.41 2.48 1.97 22.21 pre%BF -1.18 -2.39 0.59 1.84 -2.82 10.57 post%VL 4.11 -2.97 0.73 1.73 -3.50 20.94 post%BF -0.96 -1.75 0.43 1.92 -2.06 10.53 post%ST 0.29 2.60 -0.64 2.24 3.06 18.01 Covariance Matrix of Y and X pre%st pre%BF post%VL post%BF post%ST -------- -------- -------- -------- -------- pre%st 114.23 pre%BF 67.53 84.72 post%VL 23.57 11.57 32.86 post%BF 74.76 89.41 28.86 137.07 post%ST 102.25 64.17 29.51 95.75 122.34 PHI preEVKIR pre%VL pre%st pre%BF post%VL post%BF -------- -------- -------- -------- -------- --------

124
preEVKIR 31.78 (5.62) 5.66 pre%VL -1.77 22.93 (3.38) (4.05) -0.52 5.66 pre%st 1.97 22.21 114.23 (7.54) (6.97) (20.19) 0.26 3.18 5.66 pre%BF -2.82 10.57 67.53 84.72 (6.50) (5.67) (14.92) (14.98) -0.43 1.87 4.53 5.66 post%VL -3.50 20.94 23.57 11.57 32.86 (4.06) (4.32) (8.21) (6.75) (5.81) -0.86 4.85 2.87 1.71 5.66 post%BF -2.06 10.53 74.76 89.41 28.86 137.07 (8.25) (7.13) (18.22) (17.50) (9.13) (24.23) -0.25 1.48 4.10 5.11 3.16 5.66 post%ST 3.06 18.01 102.25 64.17 29.51 95.75 (7.80) (6.99) (19.54) (15.04) (8.74) (20.13) 0.39 2.58 5.23 4.27 3.38 4.76 PHI post%ST -------- post%ST 122.34 (21.63) 5.66 PSI Note: This matrix is diagonal. postKIRe postEVex %MVICdec preKIRex -------- -------- -------- -------- 3.84 6.80 258.76 12.48 (0.68) (1.20) (45.74) (2.21) 5.66 5.66 5.66 5.66 Squared Multiple Correlations for Structural Equations postKIRe postEVex %MVICdec preKIRex -------- -------- -------- -------- 0.72 0.78 0.01 0.04

125
Squared Multiple Correlations for Reduced Form postKIRe postEVex %MVICdec preKIRex -------- -------- -------- -------- 0.09 0.75 0.01 0.04 Reduced Form preEVKIR pre%VL pre%st pre%BF post%VL post%BF -------- -------- -------- ------- -------- -------- postKIRe 0.12 0.08 -0.01 0.02 0.13 -0.03 (0.08) (0.09) (0.05) (0.06) (0.05) (0.03) 1.54 0.98 -0.22 0.34 2.66 -0.98 postEVex 0.85 - - - - - - - - - - (0.06) 14.00 %MVICdec -0.21 - - - - - - - - - - (0.36) -0.58 preKIRex 0.10 0.10 -0.01 0.02 - - - - (0.08) (0.10) (0.06) (0.07) 1.26 0.98 -0.22 0.34 Reduced Form post%ST -------- postKIRe -0.02 (0.03) -0.62 postEVex - - %MVICdec - - preKIRex - - Goodness of Fit Statistics Degrees of Freedom = 21 Minimum Fit Function Chi-Square = 29.57 (P = 0.10) Normal Theory Weighted Least Squares Chi-Square = 28.72 (P = 0.12) Estimated Non-centrality Parameter (NCP) = 7.72 90 Percent Confidence Interval for NCP = (0.0 ; 25.91) Minimum Fit Function Value = 0.42 Population Discrepancy Function Value (F0) = 0.12

126
90 Percent Confidence Interval for F0 = (0.0 ; 0.40) Root Mean Square Error of Approximation (RMSEA) = 0.076 90 Percent Confidence Interval for RMSEA = (0.0 ; 0.14) P-Value for Test of Close Fit (RMSEA < 0.05) = 0.26 Expected Cross-Validation Index (ECVI) = 1.85 90 Percent Confidence Interval for ECVI = (1.73 ; 2.14) ECVI for Saturated Model = 2.06 ECVI for Independence Model = 7.92 Chi-Square for Independence Model with 55 Degrees of Freedom = 485.11 Independence AIC = 507.11 Model AIC = 118.72 Saturated AIC = 132.00 Independence CAIC = 543.15 Model CAIC = 266.17 Saturated CAIC = 348.26 Normed Fit Index (NFI) = 0.94 Non-Normed Fit Index (NNFI) = 0.95 Parsimony Normed Fit Index (PNFI) = 0.36 Comparative Fit Index (CFI) = 0.98 Incremental Fit Index (IFI) = 0.98 Relative Fit Index (RFI) = 0.84 Critical N (CN) = 94.47 Root Mean Square Residual (RMR) = 7.00 Standardized RMR = 0.061 Goodness of Fit Index (GFI) = 0.93 Adjusted Goodness of Fit Index (AGFI) = 0.78 Parsimony Goodness of Fit Index (PGFI) = 0.30 DA NI=11 NO=72 MA=CM Standardized Solution BETA postKIRe postEVex %MVICdec preKIRex -------- -------- -------- -------- postKIRe - - 0.06 -0.04 0.81 postEVex - - - - -0.15 - - %MVICdec - - - - - - - - preKIRex - - - - - - - - GAMMA preEVKIR pre%VL pre%st pre%BF post%VL post%BF -------- -------- -------- -------- -------- -------- postKIRe - - - - - - - - 0.20 -0.10 postEVex 0.86 - - - - - - - - - -

127
%MVICdec -0.07 - - - - - - - - - - preKIRex 0.16 0.13 -0.04 0.06 - - - - GAMMA post%ST -------- postKIRe -0.06 postEVex - - %MVICdec - - preKIRex - - Correlation Matrix of Y and X postKIRe postEVex %MVICdec preKIRex preEVKIR pre%VL -------- -------- -------- -------- -------- -------- postKIRe 1.00 postEVex 0.15 1.00 %MVICdec -0.06 -0.21 1.00 preKIRex 0.83 0.12 -0.01 1.00 preEVKIR 0.15 0.87 -0.07 0.14 1.00 pre%VL 0.21 -0.06 0.00 0.12 -0.07 1.00 pre%st 0.02 0.03 0.00 0.06 0.03 0.43 pre%BF -0.03 -0.05 0.00 0.06 -0.05 0.24 post%VL 0.19 -0.09 0.01 0.08 -0.11 0.76 post%BF -0.02 -0.03 0.00 0.05 -0.03 0.19 post%ST 0.01 0.04 0.00 0.06 0.05 0.34 Correlation Matrix of Y and X pre%st pre%BF post%VL post%BF post%ST -------- -------- -------- -------- -------- pre%st 1.00 pre%BF 0.69 1.00 post%VL 0.38 0.22 1.00 post%BF 0.60 0.83 0.43 1.00 post%ST 0.86 0.63 0.47 0.74 1.00 PSI Note: This matrix is diagonal. postKIRe postEVex %MVICdec preKIRex -------- -------- -------- -------- 0.28 0.22 0.99 0.96 Regression Matrix Y on X (Standardized) preEVKIR pre%VL pre%st pre%BF post%VL post%BF -------- -------- -------- -------- -------- -------- postKIRe 0.18 0.11 -0.03 0.05 0.20 -0.10 postEVex 0.87 - - - - - - - - - - %MVICdec -0.07 - - - - - - - - - - preKIRex 0.16 0.13 -0.04 0.06 - - - -
128
Regression Matrix Y on X (Standardized) post%ST -------- postKIRe -0.06 postEVex - - %MVICdec - - preKIRex - - Time used: 0.040 Seconds DATE: 5/26/2006 TIME: 16:38

129
APPENDIX E. IRB APPROVED FORM

130
APPENDIX F. IRB APPROVED CONSENT FORM THE UNIVERSITY OF NORTH CAROLINA
GREENSBORO CONSENT TO ACT AS A HUMAN PARTICIPANT: LONG FORM
Project Title: The Effect Of Tibialis Anterior Fatigue On Tibial Internal Rotation And Eversion During Heel-Toe Landing Project Director: Yohei Shimokochi Participant's Name: __________________________________________ DESCRIPTION AND EXPLANATION OF PROCEDURES: The Purpose of the Research To determine whether the amount of knee and ankle motion increases during a heel-toe landing after fatiguing the muscle on the front of the lower leg (anterior tibialis). By agreeing to participate in the study, you are indicating you are between the ages of 18 and 35, exercise at least 30 minutes, 3 times a week, have no history of ankle and knee ligament injury or surgery, no history of other muscle or bone injury or chronic pain in either lower extremity for the past 6 months, and are otherwise healthy. If you are one of the first 10 subjects to participate, we will ask you to return for a second, identical data collection session, scheduled 7-10 days after the initial testing session. What you will do in the study: All testing will be performed in the Applied Neuromechanics Research Laboratory at UNCG. We will answer any questions you may have about the study. Prior to actual testing, we will record your height, weight, age, sex, and and the amount of foot pronation and ankle flexibility. The amount of foot pronation will be measured by measuring the change in height of a bone on your foot between a neutral and relaxed standing posture. Ankle flexibility will be measured by using a standard goniometer (i.e. protractor). To measure muscle activity in your leg, we will attach surface (sEMG) electrodes on the skin of your thigh and lower leg after shaving the hair and cleaning the area with alcohol swabs. You will be familiarized to all testing procedures, then, you will undergo the following data collection procedures.
First, you will be asked to sit normally on the chair of an isokinetic dynamometer. Your upper body will be stabilized with straps across your chest and hips, and your stance leg (the leg you stand on when you kick a ball) will be attached to the lever arm of the dynamometer with your knee in 30 degrees of knee flexion. In this position, you will be asked to practice maximal effort thigh contractions by trying to straighten or flex your knee against the fixed lever arm (one time each at 25% effort, 50% effort, 75% effort, and 100% effort). Then, you will be asked to perform 3 trials of 3 second of maximal muscle contractions while

131
trying to straighten and bend your knee as hard as you can, and sEMG electrodes will collect the electrical activity of your thigh muscles. Then, you will practice the landing task. You will stand on the line that is drawn at 75% of your height away from the center of force plate with your non-stance leg. Using your non-stance leg, you will jump toward the force plate and land on the force plates with stance leg. After you become comfortable with doing the landing task, motion sensors will be attached on your stance leg and sacrum (lower back), which will record and collect the position of your lower extremity joints and forces against the ground. You will be asked to perform 5 successful landing tasks to record this data.
Then, you will be seated and we will attach your foot to a weighted pulley system to fatigue the muscle on the front of your lower leg. After securing your foot to the pulley system, you will be asked to pull the foot plate toward you and slightly inward as hard as you can, and your strength to pull the foot plate and sEMG data from the muscle on the front of your lower leg, and the front and back of your thigh will be measured. Then, you will be asked to pull the wire toward you and slightly inward repeatedly as many times as possible until you can no longer lift the weight. sEMG data will be recorded periodically throughout these repeated repetitions. When you can no longer lift the weight up, strength and sEMG data will once again be collected.
Immediately after the strength measurement, you will be asked to perform 5 more landing trials, and we will record the sEMG, position and ground reaction force data the same as before.
RISKS AND DISCOMFORTS: There is minimal risk to participating in this study. The distance you have to jump will be only 75% of your height and has been used in previous studies. Also, the investigator will stand next to you to support you in case you begin to fall. Although you will feel some discomfort because this study involves fatigue of the ankle muscles, the resistance weight used in this study will be very light (about 1.1~11lb). You may experience some delayed muscle soreness the day or two following the exercise protocol. POTENTIAL BENEFITS: Ten dollars will be paid as compensation. COMPENSATION/TREATMENT FOR INJURY: (If study poses more than minimal risk, you must include a statement regarding compensation and/or treatment available for injury, and direct participants to contact Mr. Eric Allen at (336) 256-1482 about any research-related injuries they sustain.) N/A

132
CONSENT: By signing this consent form, you agree that you understand the procedures and any risks and benefits involved in this research. You are free to refuse to participate or to withdraw your consent to participate in this research at any time without penalty or prejudice; your participation is entirely voluntary. Your privacy will be protected because you will not be identified by name as a participant in this project. The research and this consent form have been approved by the University of North Carolina at Greensboro Institutional Review Board, which insures that research involving people follows federal regulations. Questions regarding your rights as a participant in this project can be answered by calling Mr. Eric Allen at (336) 256-1482. Questions regarding the research itself will be answered by Yohei Shimokochi, MA, ATC by calling (336) 334-3039 or Sandra J Shultz PhD, ATC by calling (336-334-3027). Any new information that develops during the project will be provided to you if the information might affect your willingness to continue participation in the project. By signing this form, you are agreeing to participate in the project described to you by Yohei Shimomochi. And a copy of this consent form will be provided to you. ____________________________________ ______________ Participant's Signature* Date

133
APPENDIX G. RAW DATA
1) Raw data for predictor and dependent variables for Hypothesis 1
Subject # preKIRexc preEVKIRexc pre%VL pre%BF pre%ST 1 3.7 6.7 8.4 7.7 29.7 2 13.4 7.1 11.4 33.2 40.5 3 14.6 4.2 5.5 18.7 11.8 4 8.3 10.3 5.4 3.5 8.8 5 6.3 8.9 3.9 11.1 31.9 6 11.2 11.9 9.0 21.4 26.3 9 11.0 4.6 9.2 10.6 28.8
11 3.3 6.2 4.2 29.4 28.3 12 4.8 6.5 4.1 15.4 25.7 13 15.2 -8.0 9.2 14.5 14.8 14 9.5 2.1 7.6 12.6 25.0 15 9.3 6.3 24.9 16.1 21.3 16 7.4 11.8 6.2 34.4 28.3 17 4.9 7.3 7.8 25.9 19.4 18 7.2 12.6 19.1 15.5 32.3 19 8.6 8.8 19.7 8.6 23.6 20 1.7 6.2 6.8 9.5 11.6 21 6.7 15.3 8.3 6.8 9.0 22 7.5 19.2 5.4 13.3 16.3 23 13.9 10.5 5.3 20.9 11.3 24 2.3 4.6 6.9 18.0 20.5 25 13.2 13.0 6.2 9.0 17.2 27 8.0 3.1 6.7 14.8 21.9 28 7.1 9.6 17.7 12.5 13.2 29 9.0 10.6 6.4 10.4 10.2 30 10.3 13.5 4.0 27.6 20.4 31 3.2 5.4 2.7 14.0 17.6 32 5.6 11.2 9.2 20.1 17.7 33 13.0 13.4 14.5 39.3 52.0 34 8.2 11.6 13.8 14.4 17.2 35 9.2 6.1 12.1 38.8 34.8 36 6.7 12.3 3.5 6.6 10.9 37 9.6 15.1 3.5 23.0 13.1 38 3.4 4.6 2.2 11.9 12.1 39 13.0 16.9 7.3 6.7 6.8 40 10.3 4.4 11.1 25.4 39.0 41 3.4 3.8 17.4 19.8 27.8 42 4.7 11.4 4.9 4.4 12.2 43 9.0 9.5 7.5 28.2 33.3 44 5.1 12.8 7.6 7.0 22.1

134
Subject # preKIRexc preEVKIRexc pre%VL pre%BF pre%ST 45 10.3 6.4 5.1 18.0 13.4 46 4.1 9.2 6.0 4.6 7.9 47 3.5 6.2 6.7 19.9 15.4 48 7.3 15.9 5.4 37.2 36.1 49 4.2 9.2 4.4 25.6 41.2 51 8.7 5.4 4.2 7.1 10.1 52 6.4 -5.6 5.1 13.1 12.1 53 3.5 4.8 7.6 17.3 17.5 54 3.3 14.5 4.1 7.3 16.8 55 6.4 4.6 5.0 28.5 28.6 56 4.6 -3.1 12.7 23.4 12.4 57 7.1 4.8 4.4 19.2 13.8 58 10.8 14.0 10.1 21.3 21.9 59 7.4 15.3 3.1 21.6 30.8 60 4.7 9.2 9.0 19.6 14.1 61 12.9 -2.2 9.4 14.7 24.6 62 15.4 23.9 4.6 5.0 15.5 63 14.3 8.6 6.6 13.6 13.6 64 6.1 10.2 6.5 29.3 26.2 65 5.0 9.3 8.7 21.7 20.9 66 7.7 6.9 23.7 47.0 64.0 67 5.4 -2.8 8.4 15.5 23.2 68 6.4 5.1 6.9 11.2 8.5 69 4.2 0.2 7.2 15.4 19.2 70 14.6 8.1 5.5 21.2 16.8 71 15.2 14.8 17.6 11.9 31.7 72 10.6 5.0 3.2 7.9 14.2 73 12.0 8.4 5.8 16.2 25.6 74 7.4 7.9 8.3 14.8 12.4 75 9.9 -1.2 5.7 16.9 12.7 76 6.7 12.2 5.9 7.2 22.5 87 7.3 13.9 4.3 13.5 7.5

135
2) Raw data for Hypothesis 2 (This table presents rearfoot eversion excursion
only. Please refer to raw data for knee internal rotation excursion in
Appendix G - 1) and 3))
preEVexc postEVexc 10.5 12.8 11.4 10.5 7.7 7.1
12.6 12.8 9.9 8.6
15.2 12.2 8.2 7.1
11.8 9.7 12.0 14.5 2.2 3.5 6.4 4.5 9.3 9.4
14.6 14.0 12.5 13.3 16.6 14.1 12.7 13.7 14.0 11.9 21.9 21.1 19.6 17.3 13.6 11.5 10.3 3.6 15.6 17.9 6.3 12.0
13.9 11.5 16.8 20.8 14.3 18.3 11.9 11.0 15.2 14.5 13.7 15.4 12.7 18.9 8.5 11.5
13.1 14.7 22.5 20.8 10.9 10.0 17.3 17.4 6.6 8.2
11.0 11.4 13.8 13.2

136
preEVexc postEVexc 12.7 10.7 16.5 15.3 8.1 6.9
17.3 15.2 12.2 10.7 16.1 15.1 11.0 12.0 6.9 7.3 1.7 3.2 5.5 5.5
22.0 20.6 13.9 12.6 3.2 6.2 8.8 11.4
15.9 17.3 16.3 17.0 13.1 15.5 2.6 4.0
24.7 23.7 10.2 15.1 12.1 10.2 12.5 6.9 8.2 9.0 1.8 1.9
12.4 12.3 6.9 7.9 8.1 12.7
17.4 25.4 9.9 12.9
11.0 10.0 10.0 5.3 6.5 5.6
13.7 13.3 14.8 18.9

137
3) Raw data for predictor and dependent variables for Hypotheses 3 and 4
Subject # postKIRexc postEVKIRexc post%VL post%BF post%ST MVIC%dec 1 3.3 4.8 6.8 8.6 31.3 78.4 2 13.3 5.3 8.9 28.0 35.5 67.0 3 13.1 5.3 6.0 16.8 10.6 25.1 4 8.9 8.5 3.8 2.3 7.4 68.5 5 3.1 8.5 4.2 9.6 25.7 45.2 6 9.0 4.9 7.3 21.2 23.9 55.9 9 11.3 5.1 13.1 12.6 33.8 40.7
11 1.1 4.0 3.5 22.5 23.3 70.6 12 1.7 4.7 2.9 15.2 22.7 66.9 13 13.8 -3.8 11.0 14.0 17.8 18.0 14 12.7 1.3 5.6 11.3 21.9 49.4 15 8.1 7.8 24.0 10.9 11.8 53.1 16 4.3 11.8 4.9 36.8 32.6 44.1 17 4.1 11.9 7.8 26.1 18.2 55.6 18 8.2 8.8 14.3 16.9 30.4 55.5 19 9.4 12.2 11.0 8.9 11.4 75.3 20 2.5 6.6 6.2 10.3 11.9 33.5 21 7.4 16.4 7.8 7.2 7.8 60.2 22 9.1 15.3 4.5 13.0 16.2 30.0 23 12.5 8.7 4.8 16.0 9.9 37.7 24 5.6 0.8 4.8 20.5 32.5 86.6 25 14.7 14.6 6.7 8.0 15.2 51.0 27 8.1 10.0 6.6 13.6 18.3 50.6 28 7.5 1.8 19.4 9.8 9.5 70.4 29 7.6 13.0 6.8 10.6 12.0 82.1 30 8.7 15.4 4.2 47.7 23.3 24.3 31 1.7 3.7 3.1 13.1 16.8 75.6 32 5.5 10.9 9.6 17.3 16.9 68.9 33 9.3 13.1 13.0 40.9 48.1 18.7 34 7.9 16.2 10.5 14.9 18.3 53.5 35 8.2 9.0 14.4 32.3 29.2 33.2 36 7.9 13.1 2.9 9.2 9.9 40.4 37 10.3 19.0 3.4 30.0 15.4 29.4 38 2.5 10.3 2.4 10.8 15.2 66.6 39 11.0 15.4 6.8 6.6 9.2 36.4 40 12.8 6.8 38.0 69.9 60.2 45.3 41 6.2 7.1 15.9 15.4 19.7 51.3 42 8.0 11.6 3.9 3.9 11.9 40.8 43 9.4 8.8 7.4 30.5 33.0 57.5 44 4.3 12.1 5.7 5.4 19.2 51.2 45 11.3 5.6 4.7 15.8 14.4 70.7 46 4.4 11.4 6.9 6.2 8.1 53.5

138
Subject # postKIRexc postEVKIRexc post%VL post%BF post%ST MVIC%dec 47 4.1 9.2 5.1 19.2 11.9 68.7 48 5.9 14.7 4.5 31.0 31.9 57.0 49 0.7 5.0 3.7 16.7 18.4 45.5 51 9.2 5.3 3.4 5.7 9.9 66.7 52 7.1 -5.3 6.3 11.9 10.5 43.3 53 5.0 4.7 5.6 15.3 15.5 44.1 54 4.4 14.5 4.3 7.2 13.8 59.3 55 3.7 6.0 4.6 33.7 30.3 69.1 56 3.8 0.6 12.5 24.6 14.3 61.2 57 11.3 9.3 4.1 22.1 16.6 48.2 58 3.9 10.0 7.9 18.6 19.3 61.5 59 5.6 13.1 2.4 16.6 22.5 37.5 60 5.4 9.3 7.4 22.0 21.3 68.5 61 8.8 -2.6 7.4 11.8 21.1 82.1 62 12.1 23.7 3.5 7.3 32.3 61.6 63 12.5 12.3 5.9 9.0 8.9 54.3 64 6.7 8.7 6.0 32.1 24.3 63.5 65 4.8 5.1 10.2 17.6 17.5 85.4 66 5.9 7.7 18.2 48.8 64.4 51.5 67 5.7 -3.0 6.1 18.1 21.7 68.1 68 5.0 8.4 7.1 12.4 6.9 55.5 69 5.7 1.7 3.9 8.3 16.1 35.3 70 13.1 9.5 5.4 22.6 17.1 54.7 71 21.0 15.7 19.8 11.1 27.2 58.6 72 6.6 4.2 4.2 8.7 12.7 59.7 73 11.6 6.0 4.5 14.2 20.8 74.3 74 4.5 3.3 11.1 12.3 15.5 67.5 75 10.3 1.1 3.5 13.1 8.6 67.7 76 7.3 8.4 7.2 6.4 15.9 83.1 87 9.8 15.7 4.5 12.3 7.5 53.3

139
4) MVIC percent average RMS amplitude for the vastus lateralis muscle
during the first, middle, and last set of TA fatiguing exercise
Subject # First set Middle set Last Set 1 13.12 18.02 9.33 2 10.79 16.34 12.60 3 7.09 16.50 18.06 4 12.83 18.64 19.44 5 7.43 9.66 8.64 6 12.77 20.18 21.54 9 27.72 46.65 40.43
11 20.26 28.50 36.32 12 11.07 17.56 21.87 13 19.56 17.35 19.47 14 13.81 23.47 17.93 15 11.02 11.40 13.57 16 8.25 11.01 14.31 17 6.79 14.03 14.22 18 21.73 38.16 43.03 19 10.93 13.43 12.60 20 12.38 14.16 12.24 21 6.36 5.95 3.78 22 14.49 28.70 27.49 23 12.43 13.81 12.77 24 18.29 18.02 17.09 25 6.92 6.31 5.23 27 3.95 9.31 10.11 28 11.96 13.80 14.50 29 11.70 15.72 15.41 30 6.27 10.35 13.16 31 6.54 9.03 11.70 32 5.88 7.80 8.82 33 19.96 22.82 0.55 34 28.82 32.97 38.74 35 63.58 67.15 78.24 36 2.51 5.21 8.29 37 8.79 13.58 11.84 38 7.59 11.15 9.41 39 11.60 15.36 16.53 40 22.17 27.05 21.60 41 20.88 22.06 17.15 42 6.47 10.59 7.64 43 6.90 10.99 17.34 44 12.57 14.61 12.65

140
Subject # First set Middle set Last Set 45 7.30 13.18 12.45 46 12.51 20.58 19.71 47 9.91 11.44 10.93 48 6.39 9.11 10.41 49 6.85 11.34 6.09 51 2.93 8.32 5.24 52 5.03 7.33 9.16 53 14.32 18.20 25.18 54 5.94 5.48 4.63 55 7.62 11.12 9.09 56 17.91 37.83 30.33 57 15.30 18.13 18.39 58 19.53 18.37 59 28.03 30.29 33.71 60 29.29 32.30 30.98 61 6.71 9.16 10.84 62 2.23 3.57 4.44 63 2.90 3.49 6.46 64 3.44 7.22 7.74 65 4.86 8.60 6.53 66 0.45 32.86 30.95 67 3.86 4.43 5.94 68 6.94 9.64 12.14 69 7.13 10.42 8.04 70 11.92 15.13 19.65 71 20.11 39.94 30.96 72 7.04 8.26 7.60 73 13.34 21.43 14.75 74 0.13 7.31 6.73 75 5.81 8.74 9.08 76 3.19 4.76 6.58 87 8.67 7.60 7.38

141
5) MVIC percent average RMS amplitude for the biceps femoris muscle
during the first, middle, and last set of TA fatiguing exercise
Subject # First set Middle set Last Set 1 3.56 6.17 3.98 2 2.60 11.77 13.09 3 1.28 5.71 29.53 4 0.31 0.87 9.24 5 2.85 5.16 15.23 6 1.12 16.92 8.39 9 5.11 1.60 11.03
11 1.48 5.91 9.15 12 8.36 15.47 9.32 13 1.10 3.26 5.66 14 3.55 8.13 9.15 15 1.90 4.23 9.09 16 2.20 13.75 7.47 17 4.68 9.21 4.37 18 3.32 9.32 8.43 19 0.72 1.22 1.29 20 1.69 2.81 2.02 21 11.01 11.03 5.73 22 3.28 9.61 4.71 23 3.32 1.86 5.05 24 8.72 10.44 7.24 25 0.30 0.34 8.13 27 1.41 3.27 13.69 28 2.60 1.20 0.75 29 0.45 0.53 0.72 30 3.21 4.77 8.39 31 3.30 7.95 39.34 32 3.70 2.35 1.39 33 3.57 11.06 0.76 34 4.44 12.49 10.94 35 3.36 3.28 5.83 36 0.99 4.91 6.25 37 0.73 14.70 8.38 38 2.69 5.78 6.75 39 0.60 0.33 7.64 40 7.03 31.54 29.49 41 14.07 15.64 8.28 42 7.10 15.51 4.79 43 1.47 2.97 9.45 44 0.23 0.32 6.33

142
Subject # First set Middle set Last Set 45 1.10 1.96 7.58 46 2.63 5.47 12.30 47 1.10 7.06 2.49 48 5.15 1.42 1.51 49 2.93 3.00 2.26 51 0.72 3.84 3.23 52 2.62 3.55 21.57 53 2.10 1.65 4.09 54 0.99 8.76 2.33 55 3.35 6.53 4.08 56 1.47 1.74 2.26 57 0.85 1.79 0.41 58 10.90 14.13 59 0.51 2.01 1.63 60 5.68 12.68 7.83 61 1.20 1.18 0.75 62 1.98 1.39 38.02 63 0.36 0.26 12.74 64 5.89 2.59 12.72 65 3.06 4.01 7.04 66 0.72 51.29 27.02 67 6.92 27.40 1.03 68 1.21 0.59 0.45 69 2.14 3.12 7.47 70 0.99 1.02 3.19 71 0.61 1.96 3.88 72 28.97 26.78 7.82 73 1.08 6.79 1.96 74 0.68 15.36 32.01 75 0.73 1.29 0.48 76 0.72 0.81 0.58 87 4.29 12.39 7.19

143
6) MVIC percent average RMS amplitude for the semitedinosus muscle
during the first, middle, and last set of TA fatiguing exercise
Subject # First set Middle set Last Set 1 0.76 1.60 1.12 2 1.08 3.14 4.02 3 0.81 2.13 4.11 4 0.42 0.54 1.54 5 1.54 2.59 2.67 6 0.63 1.50 1.49 9 1.29 1.04 2.30
11 0.72 1.69 2.45 12 0.42 0.63 0.99 13 0.63 1.35 1.41 14 0.96 2.37 2.20 15 0.47 0.55 0.90 16 0.34 0.70 0.86 17 0.49 0.81 0.96 18 0.89 1.37 1.43 19 0.81 1.08 1.63 20 0.38 0.52 0.57 21 1.03 1.08 0.84 22 0.48 0.95 0.85 23 0.96 1.25 1.53 24 0.70 0.78 0.76 25 4.94 5.03 5.19 27 0.72 0.95 1.55 28 0.80 0.84 0.72 29 0.37 0.50 0.40 30 0.81 0.84 1.25 31 0.44 0.63 1.78 32 0.62 0.61 0.59 33 0.66 1.70 0.53 34 0.77 1.58 2.28 35 0.75 0.89 2.46 36 0.19 0.32 0.84 37 0.23 0.88 1.24 38 1.05 1.50 1.30 39 0.32 0.69 1.22 40 1.94 5.42 6.03 41 21.17 26.18 1.76 42 0.15 0.18 0.21 43 0.53 0.68 1.11 44 0.35 0.43 0.85

144
Subject # First set Middle set Last Set 45 0.52 0.85 1.59 46 0.63 1.32 1.91 47 0.30 1.01 0.82 48 0.68 0.51 0.76 49 2.12 2.14 2.26 51 0.29 0.83 0.53 52 0.81 1.04 1.83 53 0.32 0.27 0.58 54 0.22 0.71 0.41 55 0.38 0.72 1.04 56 0.38 0.30 0.41 57 0.39 1.16 0.95 58 2.11 2.26 59 0.54 1.46 1.22 60 1.07 2.00 2.01 61 0.50 0.70 0.95 62 0.86 0.85 3.41 63 0.37 0.39 0.84 64 0.58 0.95 2.01 65 0.32 0.61 0.89 66 0.38 2.11 1.94 67 0.73 2.32 0.51 68 0.36 0.39 0.59 69 0.45 0.62 1.15 70 0.72 0.75 1.90 71 0.68 1.70 1.16 72 2.85 2.91 1.76 73 1.15 1.43 0.82 74 0.30 1.09 2.35 75 0.30 0.41 0.41 76 0.35 0.38 2.51 87 0.36 0.60 0.87

145
7) Pre- and post-fatigue tibialis anterior muscle MVIC force (N) (preMVIC
and postMVIC, respectively), number of repetitions in TA fatigue
exercise, median power frequency (Hz) during pre- and post-fatigue
MVIC (preMPF and postMPF, respectively), and post-fatigue total data
collection time (sec)
Subject # preMVIC postMVIC Reps preMPF postMPF MPF%dec
Post-fatigue data collection time
1 159.7 34.4 105 179.3 135.0 24.7 144 2 170.1 56.1 80 141.7 87.5 38.3 120 3 182.8 137.0 240 183.4 137.2 25.2 120 4 185.1 58.4 60 149.4 92.8 37.8 119 5 223.2 122.4 165 116.9 95.9 17.9 125 6 161.4 71.1 190 146.9 98.2 33.1 121 9 68.7 40.8 65 167.8 94.6 43.6 102
11 224.6 66.0 89 155.5 116.1 25.3 101 12 155.4 51.5 95 137.1 85.7 37.5 110 13 163.6 134.2 68 182.7 104.3 42.9 96 14 164.3 83.2 51 139.8 94.5 32.4 92 15 172.7 81.0 194 162.9 133.6 18.0 148 16 178.0 99.5 115 150.5 101.7 32.5 107 17 182.6 81.2 428 142.4 122.3 14.1 97 18 136.9 60.9 91 138.4 102.1 26.3 118 19 158.5 39.2 73 140.0 105.2 24.9 119 20 162.4 108.1 180 158.6 129.5 18.3 115 21 104.3 41.5 84 166.7 138.8 16.7 100 22 144.4 101.1 44 174.1 91.8 47.3 96 23 161.7 100.7 119 163.5 128.2 21.6 128 24 205.8 27.6 99 130.9 107.9 17.6 122 25 169.4 83.0 275 128.8 96.4 25.1 100 27 172.3 85.1 377 149.7 114.0 23.8 100 28 250.6 74.1 60 176.0 141.9 19.4 92 29 215.3 38.6 100 110.4 64.5 41.6 106 30 139.7 105.8 145 174.7 137.8 21.1 110 31 170.9 41.7 93 130.6 101.0 22.7 113 32 162.7 50.7 211 111.9 169.7 -51.6 100 33 142.4 115.7 75 166.0 112.7 32.1 104 34 127.2 59.2 55 94.7 73.2 22.7 100 35 134.0 89.5 55 115.8 88.3 23.7 119

146
Subject # preMVIC postMVIC Reps preMPF postMPF MPF%dec
Post-fatigue data collection time
36 169.0 100.7 215 140.5 86.8 38.2 97 37 194.0 137.0 115 137.1 80.4 41.3 99 38 159.2 53.2 75 130.6 113.3 13.2 94 39 155.2 98.8 95 170.1 102.8 39.6 89 40 136.5 74.7 74 104.9 69.3 34.0 98 41 169.6 82.5 215 147.3 113.1 23.2 108 42 133.6 79.1 113 161.4 108.0 33.1 94 43 131.8 56.1 132 152.5 98.1 35.7 90 44 109.3 53.3 57 128.5 77.6 39.6 100 45 133.0 38.9 108 137.9 71.6 48.1 84 46 113.4 52.7 75 177.4 114.1 35.7 85 47 98.0 30.7 98 144.8 107.3 25.9 100 48 161.2 69.3 108 133.1 113.3 14.9 100 49 54.1 29.5 163 149.4 117.1 21.6 101 51 172.2 57.3 263 163.2 76.6 53.0 99 52 202.6 114.8 208 162.8 129.2 20.6 98 53 184.0 102.8 95 129.1 98.7 23.5 100 54 206.4 83.9 287 133.7 94.3 29.5 97 55 216.2 66.7 115 137.5 89.1 35.2 98 56 168.6 65.4 127 151.5 106.4 29.8 109 57 131.0 67.9 47 146.9 90.5 38.4 105 58 168.7 64.9 27 153.5 122.6 20.1 102 59 160.6 100.4 74 142.9 59.4 58.5 86 60 129.8 40.9 117 119.6 70.3 41.2 85 61 231.6 41.4 167 143.9 99.1 31.1 93 62 172.5 66.3 215 146.1 50.2 65.7 94 63 197.4 90.2 283 187.4 121.4 35.2 106 64 129.1 47.1 235 170.7 108.4 36.5 100 65 171.7 25.0 220 149.1 88.7 40.5 90 66 145.1 70.3 97 152.7 73.3 52.0 85 67 134.2 42.8 111 153.2 88.8 42.1 105 68 180.0 80.1 97 112.8 73.3 35.0 94 69 323.4 209.3 146 118.8 65.3 45.0 90 70 157.4 71.4 96 141.6 95.7 32.4 108 71 139.6 57.8 65 157.0 99.9 36.4 83 72 104.0 41.9 46 166.6 102.3 38.6 95 73 196.0 50.3 131 151.9 104.1 31.4 111 74 194.2 63.1 96 113.2 83.3 26.4 104 75 175.1 56.6 111 127.4 95.4 25.1 116 76 137.1 23.2 291 108.6 78.6 27.6 106 87 220.4 103.0 104 123.2 71.1 42.3 102

147
8) TA fatiguing exercise related variables for examining the reliability and
consistency of the TA fatigue protocol
Subject # preMVIC postMVIC Reps preMPF postMPF MPF%dec 1 93.9 8.8 95 174.3 120.7 30.7 2 174.7 65.3 71 124.5 87.4 29.8 3 191.6 120.8 188 160.4 118.9 25.9 4 130.1 17.4 74 135.1 77.9 42.4 5 202.6 98.0 188 122.9 96.9 21.2 6 169.4 69.1 163 145.4 99.9 31.3 9 116.2 77.3 73 180.0 119.9 33.4
12 156.5 67.6 129 144.1 102.5 28.9 13 176.6 117.9 47 170.8 116.6 31.8 15 164.4 40.8 123 155.1 106.1 31.6