Municipality Finance Plc Interim report 1 January – 30 … MUNICIPALITY FINANCE Interim report 1...
29
Interim report 1 January – 30 June 2015 Building tomorrow.
Transcript of Municipality Finance Plc Interim report 1 January – 30 … MUNICIPALITY FINANCE Interim report 1...

Interim report 1 January – 30 June 2015
Building tomorrow.

2
MUNICIPALITY FINANCE Interim report 1 January – 30 June 2015
CEO’s Review
Growth prospects in the Finnish economy have weakened further during the current year. The country’s new government faces major challenges in reinstating economic growth, which must be achieved. At the same time, cuts have to be made and essential structural reforms carried out.
Fortunately, it appears that the government is tackling the right issues and focusing on problems with the seriousness they deserve. The Government Programme gives municipalities long-awaited room for manoeuvre in deciding where to make savings, and makes the achievement of planned structural reforms a top priority.
The programme addresses many important issues on a highly generic level, however, so its real impact will only be revealed as details are released. The boost to housing construction mentioned in the programme is a welcome promise, but it is important to ensure financing is available. Since the financial crisis, Municipality Finance has provided almost all of the funding for the sector. If the company’s opportunities for financing state-subsidised housing production are reduced, financing may become more difficult and expensive to obtain.
Finland needs structural reforms now. The government’s most important task is to resolutely push through the essential reforms. One crucial reform is related to the structures and operating models of social and health care services. As in other areas, when making decisions concerning the social and health care reform, the govern-ment must ensure that competitive financing can be obtained for renovating old properties and new construction projects.
At the end of last year, Municipality Finance’s balance sheet total surpassed EUR 30 billion, making the company Finland’s third-largest financial institution in terms of balance sheet total. For this reason Municipality Finance is included in a compre-hensive assessment conducted by the European Central Bank, involving stress testing and assessments of the credit quality of assets. In the beginning of July the Finnish Financial Supervisory decided on the systemically important banks in Finland (O-SII) and the additional capital requirements imposed on them. The Finnish Financial Supervisory Authority classified Municipality Finance as a systemically important institution and set an additional capital requirement of 0.5 per cent for it. Municipality Finance clearly
fulfils the requirement as the company’s ratio of owns funds to risk-weighted assets totalled 31.75% as at the end of June 2015.
The company’s large balance sheet increases the leverage ratio requirements of financial regulation. Municipality Finance has increased its own funds in accordance with its strategy, through strong opera-tional results. While continuing to increase capital through operating results, we are also investigating the possibility of issuing a capital loan on the national and international markets as an alternative way of reinforcing the capital structure.
Despite the uncertainty in the operating envi-ronment, the year has started well for Municipality Finance. Its funding is highly competitive and the company has retained its position as a desirable investment target. Finnish municipali-ties are operating sensibly in the current challenging economic climate, considering taking loans while being aware of the risks involved, but not ceasing to make essential investments that support growth.
Helsinki, 11 August 2015
Pekka Averio President and CEO
Despite the uncertainty in the operating environment, the year has started well for Municipality Finance.
3
MUNICIPALITY FINANCE Interim report 1 January – 30 June 2015
The first half of 2015 in brief
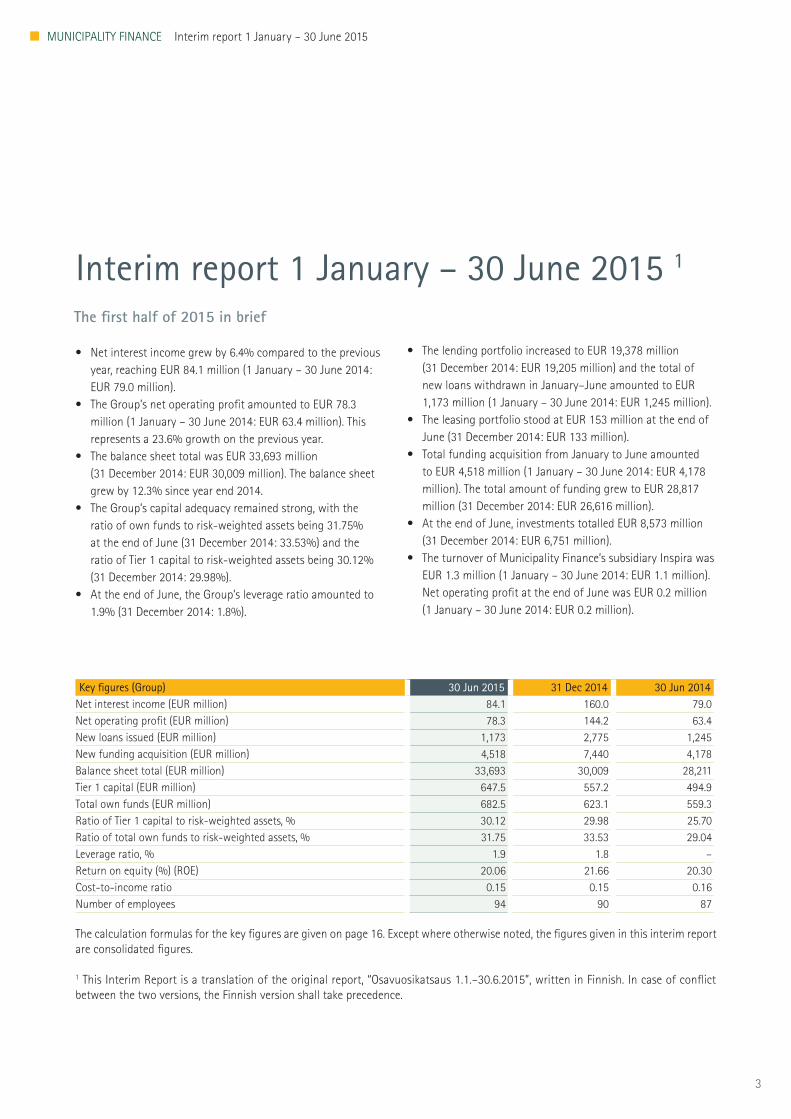
• Net interest income grew by 6.4% compared to the previous year, reaching EUR 84.1 million (1 January – 30 June 2014: EUR 79.0 million).
• The Group’s net operating profit amounted to EUR 78.3 million (1 January – 30 June 2014: EUR 63.4 million). This represents a 23.6% growth on the previous year.
• The balance sheet total was EUR 33,693 million (31 December 2014: EUR 30,009 million). The balance sheet grew by 12.3% since year end 2014.
• The Group’s capital adequacy remained strong, with the ratio of own funds to risk-weighted assets being 31.75% at the end of June (31 December 2014: 33.53%) and the ratio of Tier 1 capital to risk-weighted assets being 30.12% (31 December 2014: 29.98%).
• At the end of June, the Group’s leverage ratio amounted to 1.9% (31 December 2014: 1.8%).
Interim report 1 January – 30 June 2015 1
Key figures (Group) 30 Jun 2015 31 Dec 2014 30 Jun 2014Net interest income (EUR million) 84.1 160.0 79.0Net operating profit (EUR million) 78.3 144.2 63.4New loans issued (EUR million) 1,173 2,775 1,245New funding acquisition (EUR million) 4,518 7,440 4,178Balance sheet total (EUR million) 33,693 30,009 28,211Tier 1 capital (EUR million) 647.5 557.2 494.9Total own funds (EUR million) 682.5 623.1 559.3Ratio of Tier 1 capital to risk-weighted assets, % 30.12 29.98 25.70Ratio of total own funds to risk-weighted assets, % 31.75 33.53 29.04Leverage ratio, % 1.9 1.8 –Return on equity (%) (ROE) 20.06 21.66 20.30Cost-to-income ratio 0.15 0.15 0.16Number of employees 94 90 87
The calculation formulas for the key figures are given on page 16. Except where otherwise noted, the figures given in this interim report are consolidated figures.
1 This Interim Report is a translation of the original report, “Osavuosikatsaus 1.1.–30.6.2015”, written in Finnish. In case of conflict between the two versions, the Finnish version shall take precedence.
• The lending portfolio increased to EUR 19,378 million (31 December 2014: EUR 19,205 million) and the total of new loans withdrawn in January–June amounted to EUR 1,173 million (1 January – 30 June 2014: EUR 1,245 million).
• The leasing portfolio stood at EUR 153 million at the end of June (31 December 2014: EUR 133 million).
• Total funding acquisition from January to June amounted to EUR 4,518 million (1 January – 30 June 2014: EUR 4,178 million). The total amount of funding grew to EUR 28,817 million (31 December 2014: EUR 26,616 million).
• At the end of June, investments totalled EUR 8,573 million (31 December 2014: EUR 6,751 million).
• The turnover of Municipality Finance’s subsidiary Inspira was EUR 1.3 million (1 January – 30 June 2014: EUR 1.1 million). Net operating profit at the end of June was EUR 0.2 million (1 January – 30 June 2014: EUR 0.2 million).
4
MUNICIPALITY FINANCE Interim report 1 January – 30 June 2015
The first half of 2015 in briefNet operating result and balance sheetThe group’s operations remained good during the first half of the year, with continued positive development of the net interest income. At the end of June, net interest income stood at EUR 84.1 million (1 January–30 June 2014: EUR 79.0 million). Net interest income includes EUR 1.3 million in commissions from the repurchase of own bonds (1 January–30 June 2014: EUR 1.2 million).
Net operating profit for the period, before appropriations and taxes, totalled EUR 78.3 million (1 January–30 June 2014: EUR 63.4 million). Operating profit excluding valuations and non-recurring items continued its strong growth.
The net operating profit of Municipality Finance’s subsidiary, Inspira, was EUR 0.2 million for the first six months of the year (1 January–30 June 2014: EUR 0.2 million).
The group’s commission expenses totalled EUR 1.8 million at the end of June 2015 (1 January–30 June 2014: EUR 1.8 million). Operating expenses for the period were EUR 11.8 million (1 January–30 June 2014: EUR 10.3 million). Administrative expenses totalled EUR 8.2 million (1 January–30 June 2014: EUR 6.7 million), of which personnel expenses accounted for EUR 5.4 million (1 January–30 June 2014: EUR 4.2 million). Depreciation of tangible and intangible assets amounted to EUR 0.7 million (1 January–30 June 2014: EUR 0.7 million). Other operating expenses were EUR 2.8 million(1 January–30 June 2014: EUR 2.8 million).
The consolidated balance sheet total amounted to EUR 33,693 million at the end of June 2015 (31 December 2014: EUR 30,009 million).
Domestic operationsMunicipality Finance’s customers consist of municipalities, municipal federations, municipality-controlled entities and non-profit corporations nominated by the Housing Finance and Development Centre of Finland (ARA). The company offers its customer base diverse financial services and is by far the biggest single provider of financing in its customer segment.
The market in which the company’s customers operate was characterised by uncertainty during the period, just as in the preceding years. Weak economic growth and doubts concerning the progress of struc-tural reforms in the municipal sector have hampered investment decisions.
During the reporting period, Municipality Finance enhanced its customer service by reorganising its customer financing
function, in order to serve its customers more broadly. The aim of the reorganisation was to ensure that new service needs arising from the changing customer environment are recognised even more effectively than before. Customers’ needs are fulfilled by improving electronic services and by offering new products and comprehensive solutions. The development of the service model has also involved closer collaboration between Municipality Finance and its subsidiary, Inspira.
Despite the uncertainty in the operating environment of its customers, demand for the group’s services has remained stable, and has also grown significantly for certain services.
With regard to lending, competition to attract customers in the municipal sector increased in the period from January to June. The group was able to respond to market competition and maintain its status as the most important financing provider for its customer segment, thanks to its strong financial posi-tion. Municipality Finance plays a particularly important role in financing state-subsidised housing construction.
The total volume of loan tender requests received by Municipality Finance in the period from January to June was EUR 2,833 million (1 January–30 June 2014: EUR 2,146 million). New loans drawn down in the first six months of 2015 totalled EUR 1,173 million (1 January–30 June 2014: EUR 1,245 million). At the end of June, Municipality Finance’s long-term loan port-folio stood at EUR 19,378 million (31 December 2014: EUR 19,205 million).
There was also continued demand for short-term financing. During the first half of the year, customers obtained EUR 4,736 million in financing under short-term municipal paper and municipal commercial paper programmes (1 January–30 June 2014: EUR 4,771 million). At the end of the interim period, the balance sheet included EUR
1,182 million of municipal and municipal commercial papers (31 December 2014: EUR 845 million).
In addition to loans, Municipality Finance offers municipalities, municipal federations and municipal enterprises derivative contracts tailored to their needs for the management of interest rate risk. Demand for derivative products remained high in the first half of 2015. As interest rates stayed low, customers increased their hedging against possible future increases in market rates.
Municipality Finance has offered leasing financing to munici-palities, municipal federations and municipality-controlled entities since 2010, to provide alternatives on the market. Long-term work has been carried out to ensure this service model and its pricing are as transparent as possible. Demand for leasing
Customers’ needs are fulfilled by improving elec-tronic services and by offering new products and comprehen-sive solutions
Municipality Finance was able to maintain its status as the most impor-tant financing provider for its customer segment
Demand for leasing solutions grew sharply in early 2015
5
MUNICIPALITY FINANCE Interim report 1 January – 30 June 2015
solutions grew sharply in early 2015. Customers are particularly interested in leasing-based solutions for real estate financing. The leasing portfolio stood at EUR 153 million at the end of June 2015 (31 December 2014: EUR 133 million).
Municipality Finance and its subsidiary, Inspira, which offers financial advisory services, began collaborating more closely during the first half of 2015, as part of the group’s new customer service model.
Demand for Inspira’s services exceeded that of previous periods. Inspira’s turnover in January–June was EUR 1.3 million (1 January–30 June 2014: EUR 1.1 million), and its net operating profit was EUR 0.2 million (1 January–30 June 2014: EUR 0.2 million).
Inspira’s turnover came mostly from assignments related to financing arrangements of its customers’ investments, as well as advising on restructuring operations and on the group struc-tures and responsibilities of municipal companies. Inspira also carried out several projects involving competitive tendering and financing arrangements of broadband investments. The single biggest assignment came from the E18 Hamina to Vaalimaa motorway project, for which Inspira provided financial advisory services during the procurement process.
Operations in international capital marketsIn the first half or 2015, the international capital markets were characterised by high liquidity, and Municipality Finance’s funding team succeeded in obtaining financing for its customers at competitive prices.
In January–June 2015, EUR 4,518 million was acquired in long-term funding (1 January–30 June 2014: EUR 4,178 million). In January 2015, the first public bond of the year was issued in the form of a USD 1 billion fixed-rate benchmark bond. In April, Municipality Finance stepped up its presence in the Australian market by increasing the size of its public bond issued under the Kangaroo programme by AUD 75 million.
A total of EUR 2,050 million was issued in short-term debt instruments under the Euro Commercial Paper programme in January–June (1 January–30 June 2014: EUR 3,288 million).
Overall, the company issued bonds denominated in 11 different currencies in the first half of 2015. Total funding at the end of June 2015 amounted to EUR 28,817 million (31 December 2014: EUR 26,616 million). Of the funding 16% is denominated in euros (31 December 2014: 18%) and 84% in foreign currencies (31 December 2014: 82%).
Municipality Finance currently obtains its funding in the international capital markets, where the group is a well-known and active participant. A total of 157 funding transactions were carried out in the period January to June (1 January–30 June 2014: 130).
The group’s funding strategy is to diversify funding sources, and this has proven to be a successful approach. Municipality Finance
diversifies its funding acquisition in three ways: geographically, by issuing bonds targeted at different investor groups, and by issuing bonds with different maturities. Active collaboration with investors has increased the company’s renown in various markets, and investor relations are increasingly progressing towards the maintenance of key investor relationships.
Municipality Finance’s funding is based, in addition to diversi-fication, on reliability, speed and flexibility. The majority of funding is carried out as standardised issues under debt programmes.
Municipality Finance has the following debt programmes:
Medium Term Note (MTN) programme EUR 25,000 millionEuro-Commercial Paper (ECP) programme EUR 4,000 millionAUD debt programme (Kangaroo) AUD 2,000 millionDomestic debt programme EUR 800 million
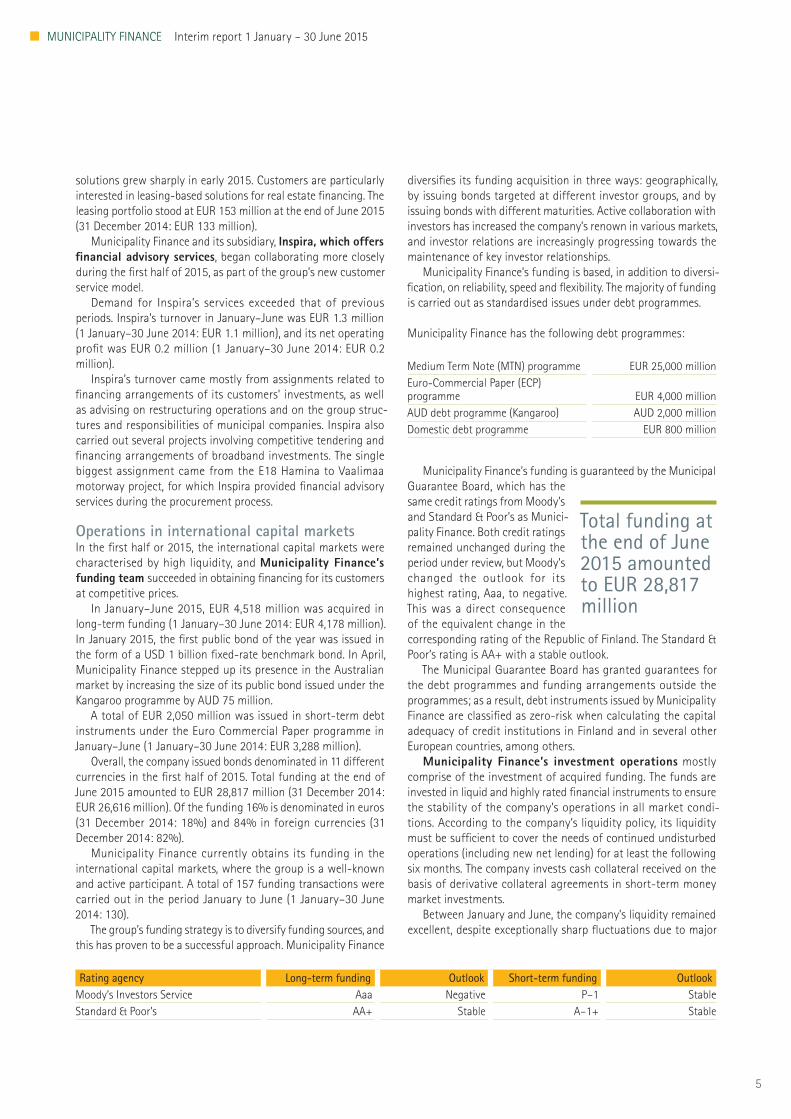
Municipality Finance’s funding is guaranteed by the Municipal Guarantee Board, which has the same credit ratings from Moody’s and Standard & Poor’s as Munici-pality Finance. Both credit ratings remained unchanged during the period under review, but Moody’s changed the outlook for its highest rating, Aaa, to negative. This was a direct consequence of the equivalent change in the corresponding rating of the Republic of Finland. The Standard & Poor’s rating is AA+ with a stable outlook.
The Municipal Guarantee Board has granted guarantees for the debt programmes and funding arrangements outside the programmes; as a result, debt instruments issued by Municipality Finance are classified as zero-risk when calculating the capital adequacy of credit institutions in Finland and in several other European countries, among others.
Municipality Finance’s investment operations mostly comprise of the investment of acquired funding. The funds are invested in liquid and highly rated financial instruments to ensure the stability of the company’s operations in all market condi-tions. According to the company’s liquidity policy, its liquidity must be sufficient to cover the needs of continued undisturbed operations (including new net lending) for at least the following six months. The company invests cash collateral received on the basis of derivative collateral agreements in short-term money market investments.
Between January and June, the company’s liquidity remained excellent, despite exceptionally sharp fluctuations due to major
Total funding at the end of June 2015 amounted to EUR 28,817 million
Rating agency Long-term funding Outlook Short-term funding OutlookMoody’s Investors Service Aaa Negative P–1 StableStandard & Poor’s AA+ Stable A–1+ Stable
6
MUNICIPALITY FINANCE Interim report 1 January – 30 June 2015
Municipality Finance Group’s own funds totalled EUR 682.5 million at the end of June
Common Equity Tier 1 capital to risk-weighted assets meets both additional capital require-ments by a wide margin
variations in the cash collateral received on the basis of derivative collateral agreements.
At the end of June 2015, investments in securi-ties totalled EUR 7,107 million (31 December 2014: EUR 5,581 million), and their average credit rating was AA (31 December 2014: AA). The average maturity of the security portfolio stood at 2.4 years at the end of June (31 December 2014: 2.3 years). In addition to this, the company had EUR 1,466 million in other investments (31 December 2014: EUR 1,170 million), of which EUR 1,438 million was in central bank deposits (31 December 2014: EUR 593 million) and EUR 28 million in money market deposits in credit institutions (31 December 2014: EUR 27 million). No repurchase agreements had been entered into at the end of June 2015 (31 December 2014: EUR 550 million).
Capital adequacyThe Group calculates its capital adequacy based on the EU Capital Requirements Regulation (EU 575/2013) and Directive (2013/36/EU). The capital adequacy requirement for credit risk is calculated using the standard method, and the capital adequacy require-ment for operative risks using the basic method. As the Group has neither a trading book nor share or commodity positions; only currency risks are taken into account in the capital adequacy calculations for market risk. As the company hedges against exchange rate risks by using derivative contracts to translate all foreign currency denominated funding into euros, the company’s currency position is very small.
The credit ratings given by Standard & Poor’s, Moody’s Investor Service and Fitch Ratings are used to determine the risk weights used in the capital adequacy calculations. In capital adequacy calculations for credit risk, Municipality Finance uses methods for reducing the credit risk such as guarantees provided by munici-palities as well as deficiency guarantees given by the Republic of Finland. For derivatives, netting agreements, collateral agree-ments (ISDA/Credit Support Annex) and guarantees granted by the Municipal Guarantee Board are used for reducing the capital adequacy requirement related to the counterparty risk of deriva-tive counterparties.
The Group’s principles for capital adequacy management are described in the financial statements for 2014.
Minimum capital requirements and capital buffersThe minimum capital requirements for credit institutions increased at the beginning of 2015. Finland adopted fixed and variable (also known as a countercyclical buffer) additional capital requirements in accordance with the Act on Credit Institutions. The additional capital requirement is 2.5% of total risk and entered into force at the beginning of 2015. The variable additional capital requirement will vary between 0–2.5% of the total risk. Based on its macro-prudential analysis, the Board of the Finnish Financial Supervisory Authority will decide the amount of the variable additional capital
requirement quarterly. The Financial Supervisory Authority decided not to impose a countercyclical capital buffer on credit institutions during the first half of 2015.
In July, the Financial Supervisory Authority designated Municipality Finance as one of Finland’s systemically important credit institutions (O-SII) and imposed an additional capital requirement on the company. The additional capital requirement is calculated using the amount of total risk and has to be covered by Common Equity Tier 1 capital. Depending on the credit institution’s total risk, the additional capital requirement can range between
0–2%. Municipality Finance was imposed with an additional capital requirement of 0.5%, which will enter into force on 7 January 2016.
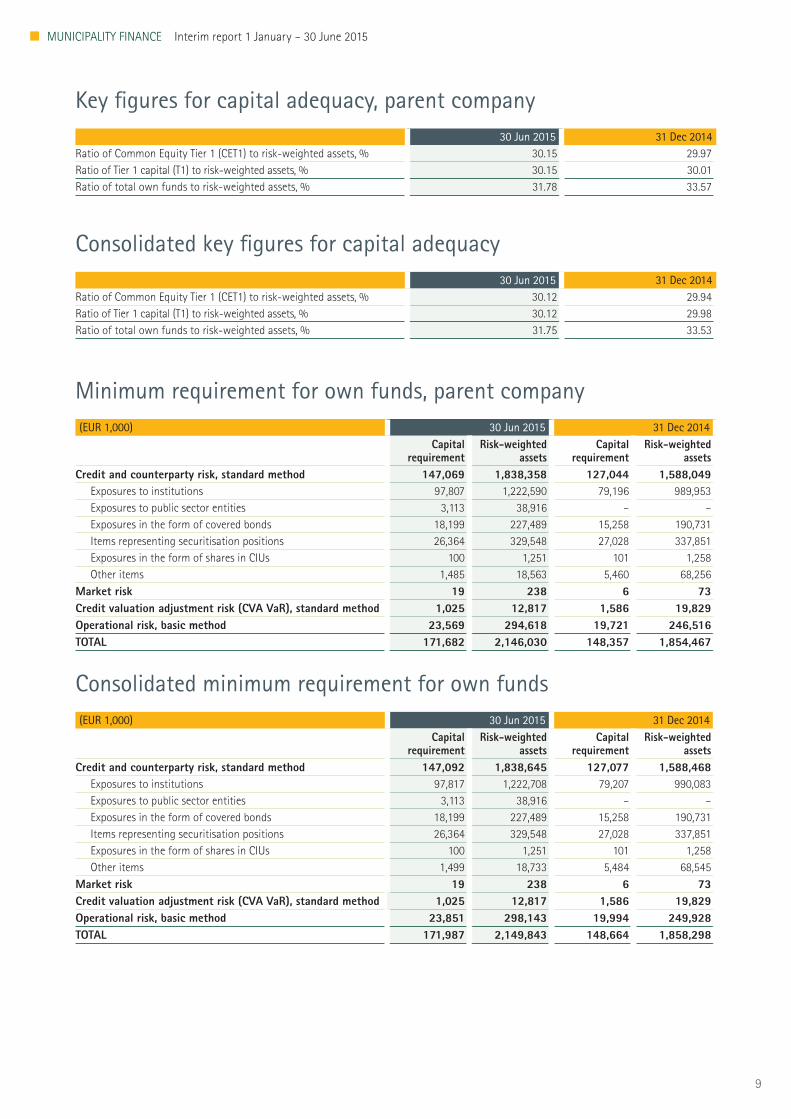
Municipality Finance’s ratio of Common Equity Tier 1 capital to risk-weighted assets meets both additional capital requirements by a wide margin.
Key figures for capital adequacy Municipality Finance Group’s own funds totalled EUR 682.5 million at the end of June 2015 (31 December 2014: EUR 623.1 million). Common Equity Tier 1 capital (CET1) amounted to EUR
647.5 million (31 December 2014: EUR 556.4 million) and takes into account Municipality Finance’s own Debt Valuation Adjustment (DVA) amounting to EUR –0.7 million (31 December 2014: EUR –1.9 million). Tier 1 capital amounted to EUR 647.5 million (31 December 2014: EUR 557.2 million).
Common Equity Tier 1 capital includes the net profit for the period
of 1 January – 30 June 2015, EUR 62.6 million, as the result for the period has been subject to a review by the auditors and can, therefore, be included in CET1 capital on the basis of the permis-sion granted by the Financial Supervisory Authority in accordance with the Capital Requirements Regulation. In accordance with the EU Capital Requirements Regulation and the Financial Supervisory Authority’s FIN-FSA Regulation 25/2013, the unrealised profits from assets measured at fair value (fair value reserve) have been included in CET1 capital (for the period 1 January 2015 – 31 December 2017). In the figures for the comparative year, the fair value reserve is included in Tier 2 capital. Tier 1 capital at the end of June 2015 does not include a provision for dividend distribution, as the Board of Directors evaluates the amount of dividends paid out each year based on the decision of the Annual General Meeting and submits its dividend proposal based on the company’s financial situation and applicable regulation, taking into account the company’s ownership structure.
Tier 2 capital totalled EUR 35.0 million at the end of the year (31 December 2014: EUR 65.9 million). With the authorisation of the Financial Supervisory Authority, the capital investments in Additional Tier 1 capital, totalling EUR 1 million, were paid

7
MUNICIPALITY FINANCE Interim report 1 January – 30 June 2015
off on 24 April 2015. Tier 2 capital includes a EUR 35 million debenture loan with a maturity date of 9 May 2021, and for which the Group is entitled to prematurely repay the loan principal and accumulated interest as of 9 May 2016. Detailed descriptions of the subordinated loans and debenture loans are included in Note 7 to this Interim Report.
The Group’s capital adequacy has remained solid, with the ratio of total own funds to risk-weighted assets being 31.75%. At the end of 2014, the ratio of total own funds to risk-weighted assets, based on the new capital adequacy regulation, was 33.53%.
Leverage ratioThe final level and content of the leverage ratio requirement is likely to become known in 2017. Municipality Finance has analysed the impact of the new leverage ratio requirement on the company’s ability to continue its current operations and grow in accordance with its strategy. The company’s own funds can be increased through the results of its operations and by issuing a capital loan in the domestic and international capital markets. At the end of June 2015, the leverage ratio stood at 1.9% (31 December 2014: 1.8%), calculated using currently valid calcula-tion principles.

8
MUNICIPALITY FINANCE Interim report 1 January – 30 June 2015
Minimum own funds requirements(% of total risk exposure amount) 30 Jun 2015 31 Dec 2014
Common Equity Tier 1 (CET1) capital ratio 4.5% 4.5%Tier 1 Capital (T1) capital ratio 6.0% 6.0%Total Capital ratio 8.0% 8.0%
Capital buffers(% of total risk exposure amount) 30 Jun 2015 31 Dec 2014
Capital conservation buffer 1) 2.5% 0.0%Countercyclical buffer 2) 0.0% 0.0%Other systemically important institution (O-SII) 3) 0.0% 0.0%
1) Act on Credit Institutions (610/2014) Sect 10:3 § and Capital Requirements Regulation and Directive (CRR/CRD4). Valid from 1st January 2015 onwards.2) Act on Credit Institutions (610/2014) Sect 10:4–5 § and Capital Requirements Regulation and Directive (CRR/CRD4). On 30th June
2015, the Board of Financial Supervisory Authority (FIN-FSA) decided not to set countercyclical capital buffer requirement.3) Act on Credit Institutions (610/2014) Sect 10:8 § and Capital Requirements Regulation and Directive (CRR/CRD4). Additional capital
requirement (O-SII) for Municipality Finance Plc is 0.5%. The decision of the Board of FIN-FSA on 6th July 2015, valid from 7th January 2016 onwards.
Own funds, parent company(EUR 1,000) 30 Jun 2015 31 Dec 2014
Common Equity tier 1 before adjustments 652,836 560,905Adjustments to Common Equity Tier 1 –5,766 –5,131COMMON EQUITY TIER 1 (CET1) 647,070 555,773Additional Tier 1 capital before adjustments – 807Adjustments to Additional Tier 1 capital – –ADDITIONAL TIER 1 CAPITAL (AT1) – 807TIER 1 CAPITAL (T1) 647,070 556,581Tier 2 capital before adjustments 35,000 65,914Adjustments to Tier 2 capital – –TIER 2 CAPITAL (T2) 35,000 65,914TOTAL OWN FUNDS 682,070 622,494
Consolidated own funds(EUR 1,000) 30 Jun 2015 31 Dec 2014
Common Equity tier 1 before adjustments 653,038 561,112Adjustments to Common Equity Tier 1 –5,499 –4,757COMMON EQUITY TIER 1 (CET1) 647,539 556,354Additional Tier 1 capital before adjustments – 807Adjustments to Additional Tier 1 capital – –ADDITIONAL TIER 1 CAPITAL (AT1) – 807TIER 1 CAPITAL (T1) 647,539 557,162Tier 2 capital before adjustments 35,000 65,914Adjustments to Tier 2 capital – –TIER 2 CAPITAL (T2) 35,000 65,914TOTAL OWN FUNDS 682,539 623,075
9
MUNICIPALITY FINANCE Interim report 1 January – 30 June 2015
Key figures for capital adequacy, parent company30 Jun 2015 31 Dec 2014
Ratio of Common Equity Tier 1 (CET1) to risk-weighted assets, % 30.15 29.97Ratio of Tier 1 capital (T1) to risk-weighted assets, % 30.15 30.01Ratio of total own funds to risk-weighted assets, % 31.78 33.57
Consolidated key figures for capital adequacy30 Jun 2015 31 Dec 2014
Ratio of Common Equity Tier 1 (CET1) to risk-weighted assets, % 30.12 29.94Ratio of Tier 1 capital (T1) to risk-weighted assets, % 30.12 29.98Ratio of total own funds to risk-weighted assets, % 31.75 33.53
Minimum requirement for own funds, parent company(EUR 1,000) 30 Jun 2015 31 Dec 2014
Capital requirement
Risk-weighted assets
Capital requirement
Risk-weighted assets
Credit and counterparty risk, standard method 147,069 1,838,358 127,044 1,588,049Exposures to institutions 97,807 1,222,590 79,196 989,953Exposures to public sector entities 3,113 38,916 – –Exposures in the form of covered bonds 18,199 227,489 15,258 190,731Items representing securitisation positions 26,364 329,548 27,028 337,851Exposures in the form of shares in CIUs 100 1,251 101 1,258Other items 1,485 18,563 5,460 68,256
Market risk 19 238 6 73Credit valuation adjustment risk (CVA VaR), standard method 1,025 12,817 1,586 19,829Operational risk, basic method 23,569 294,618 19,721 246,516TOTAL 171,682 2,146,030 148,357 1,854,467
Consolidated minimum requirement for own funds(EUR 1,000) 30 Jun 2015 31 Dec 2014
Capital requirement
Risk-weighted assets
Capital requirement
Risk-weighted assets
Credit and counterparty risk, standard method 147,092 1,838,645 127,077 1,588,468Exposures to institutions 97,817 1,222,708 79,207 990,083Exposures to public sector entities 3,113 38,916 – –Exposures in the form of covered bonds 18,199 227,489 15,258 190,731Items representing securitisation positions 26,364 329,548 27,028 337,851Exposures in the form of shares in CIUs 100 1,251 101 1,258Other items 1,499 18,733 5,484 68,545
Market risk 19 238 6 73Credit valuation adjustment risk (CVA VaR), standard method 1,025 12,817 1,586 19,829Operational risk, basic method 23,851 298,143 19,994 249,928TOTAL 171,987 2,149,843 148,664 1,858,298
10
MUNICIPALITY FINANCE Interim report 1 January – 30 June 2015
Exposure by class, parent companyExposure classes(EUR 1,000) 30 Jun 2015 31 Dec 2014
Total exposure
Risk-weighted assets
Total exposure
Risk-weighted assets
Exposures to central governments or central banks 1,995,141 – 1,136,655 –Exposures to regional governments or local authorities 10,067,710 – 9,905,111 –Exposures to international organisations 260,958 – 253,326 –Exposures to multilateral development banks 250,886 – 215,418 –Exposures to institutions 5,177,628 1,222,590 4,851,808 989,953Exposures to public sector entities 194,578 38,916 – –Exposures to corporates 4,366,001 – 4,370,988 –Exposures secured by mortgages on immovable property 6,410,190 – 6,079,832 –Exposures in the form of covered bonds 2,034,636 227,489 1,708,802 190,731Items representing securitisation positions 96,522 329,548 104,014 337,851Exposures in the form of shares in CIUs 9,724 1,251 9,761 1,258Other items 213,683 18,563 253,062 68,256Off-balance-sheet items 1,518,819 – 959,776 –
Total 32,596,476 1,838,358 29,848,553 1,588,049
Consolidated exposure by classExposure classes(EUR 1,000) 30 Jun 2015 31 Dec 2014
Total exposure
Risk-weighted assets
Total exposure
Risk-weighted assets
Exposures to central governments or central banks 1,995,141 – 1,136,655 –Exposures to regional governments or local authorities 10,067,710 – 9,905,111 –Exposures to international organisations 260,958 – 253,326 –Exposures to multilateral development banks 250,886 – 215,418 –Exposures to institutions 5,178,216 1,222,708 4,852,459 990,083Exposures to public sector entities 194,578 38,916 – –Exposures to corporates 4,366,001 – 4,370,988 –Exposures secured by mortgages on immovable property 6,410,190 – 6,079,832 –Exposures in the form of covered bonds 2,034,636 227,489 1,708,802 190,731Items representing securitisation positions 96,522 329,548 104,014 337,851Exposures in the form of shares in CIUs 9,724 1,251 9,761 1,258Other items 214,112 18,733 253,724 68,545Off-balance-sheet items 1,518,819 – 959,776 –
Total 32,597,493 1,838,645 29,849,866 1,588,468
Consolidated leverage ratio(EUR 1,000) 30 Jun 2015 31 Dec 2014
Tier 1 capital (T1) 647,539 557,162Total exposure 33,455,143 31,449,290Leverage ratio % 1.9 1.8

11
MUNICIPALITY FINANCE Interim report 1 January – 30 June 2015
GovernanceCorporate Governance Policy In addition to corporate legislation, Municipality Finance complies with the requirements on the organisation of govern-ance provided in the Act on Credit Institutions. The company’s governance policy is described in more detail on Municipality Finance’s website. Municipality Finance has published a Corporate Governance Statement on its website, pursuant to Chapter 7, section 7 of the Finnish Securities Market Act,which is separate from the 2014 financial statements and includes the description of the main features of the internal control and risk manage-ment systems pertaining to the financial reporting process. The statement also includes the governance descriptions required by the Act on Credit Institutions and information on how the company complies with the Finnish Corporate Governance Code for listed companies published by the Finnish Securities Market Association. As Municipality Finance is solely an issuer of listed bonds, and since its shares are not subject to public trading, it is not appropriate to directly apply said Code with respect to Municipality Finance. However, the company has used the Corpo-rate Governance Code as the basis for preparing its own internal Corporate Governance Policy.
The Annual General Meeting The Annual General Meeting of Municipality Finance was held on 26 March 2015. The Annual General Meeting approved the financial statements for 2014 and discharged the members of the Board of Directors, the CEO and the Deputy CEO from liability for the financial year 2014. In addition, the Annual General Meeting adopted the proposal of the Board of Directors not to distribute a dividend and to retain the distributable funds of EUR 53,158,350.27 in equity.
Based on the proposal of the Shareholders’ Nomination Committee, the Annual General Meeting decided that the Board of Directors shall have eight members during the 2015–2016 term of office and elected the members of the Board of Directors. The Annual General Meeting also adopted the proposal of the Shareholders’ Nomination Committee on the remuneration of Board members.
With regard to a reference to legislation, the Annual General Meeting decided on adopting a technical change to the Articles of Association proposed by the Board. In accordance with the proposal of the Shareholders’ Nomination Committee, the meeting decided to amend its previous decision regarding the operation of the Shareholders’ Nomination Committee due to amendments in credit institution legislation. At the same time, the Annual General Meeting decided to update the election process of Shareholders’ Nomination Committee members in respect of the stability of the company’s ownership structure.
The meeting also elected KPMG Oy Ab as the auditor of the company, with Marcus Tötterman, APA, as the principal auditor. Marcus Tötterman also acted as the principal auditor in the previous financial year.
Board of Directors At the Annual General Meeting of 26 March 2015, the Share-holders’ Nomination Committee made a proposal to the meeting regarding those Board members to be elected for the term beginning at the end of the Annual General Meeting of 2015 and concluding at the end of the following Annual General Meeting. The Annual General Meeting elected the following members to the Board of Directors:
Eva Liljeblom, Chairman of the Board, member of the Board of Directors since 2003 – Education: D.Sc. (Econ.) – Year of birth: 1958 – Primary occupation: Rector (until 31 July 2015), Professor, Hanken School of Economics in Helsinki
– Independence: Independent of the company and its significant shareholders
Tapani Hellstén, Vice Chairman, member of the Board of Directors since 2014 – Education: M.A. (Adm. Sci.) – Year of birth: 1957 – Primary occupation: Executive Vice President, Keva – Independence: Independent of the company
Fredrik Forssell, member of the Board of Directors since 2011 – Education: M.Sc. (Econ.) – Year of birth: 1968 – Primary occupation: CIO, Internal equity & FI, Keva – Independence: Independent of the company
Teppo Koivisto, member of the Board of Directors since 2011 – Education: M.A. (Pol. Sci.) – Year of birth: 1966 – Primary occupation: Head of Division, State Treasury – Independence: Independent of the company
Sirpa Louhevirta, member of the Board of Directors since 2011 – Education: M.Sc. (Econ.) – Year of birth: 1964 – Primary occupation: Senior Vice President, Group Treasury and Real Estate, Sanoma Corporation
– Independence: Independent of the company and its significant shareholders
Tuula Saxholm, member of the Board of Directors since 2013 – Education: M.Sc. (Econ.) – Year of birth: 1961 – Primary occupation: Finance Director, City of Helsinki – Independence: Independent of the company
Asta Tolonen, member of the Board of Directors since 2011 – Education: M.Sc. (Econ.) – Year of birth: 1960
12
MUNICIPALITY FINANCE Interim report 1 January – 30 June 2015
– Primary occupation: Municipal Manager, Municipality of Suomussalmi
– Independence: Independent of the company and its significant shareholders
Juha Yli-Rajala, member of the Board of Directors since 2011 – Education: M.A. (Adm. Sci.) – Year of birth: 1964 – Primary occupation: Director, City of Tampere – Independence: Independent of the company and its significant shareholders
In order to organise its work as efficiently as possible, the Board of Municipality Finance has established Audit, Risk and Remuneration Committees for the assistance and preparation of matters. The members of the Audit Committee are Tapani Hellstén (Chairman), Tuula Saxholm, Asta Tolonen and Juha Yli-Rajala. The members of the Risk Committee are Fredrik Forssell (Chairman), Eva Liljeblom and Sirpa Louhevirta. The members of the Remu-neration Committee are Eva Liljeblom (Chair), Teppo Koivisto and Juha Yli-Rajala.
The operations of the Board of Directors and its committees are described in more detail on the company’s website.
Personnel At the end of June 2015, Municipality Finance Group had 94 employees (31 December 2014: 90), of whom 81 were staff of the parent company (31 December 2014: 75).
The President and CEO of Municipality Finance is Pekka Averio. Executive Vice President Esa Kallio acts as deputy to the CEO. In addition, the Board of Management of Municipality Finance includes Senior Vice President Toni Heikkilä, Senior Vice President Jukka Helminen, Senior Vice President Marjo Tomminen and Senior Vice President Mari Tyster.
The CEO of Municipality Finance’s subsidiary Inspira is Kimmo Lehto.
Internal audit Internal auditing has been outsourced to Deloitte & Touche Ltd. The company’s Legal and Compliance department is responsible for the coordination of the outsourced audit. Internal audit tasks include monitoring the reliability and accuracy of Municipality Finance’s financial and other management information. The tasks also include making sure that the company has adequate and properly organised manual and IT systems for its operations and that the risks associated with the operations are being managed adequately. The results of the internal audit are reported to the Board of Directors and its Audit Committee.
Risk management principles and the Group’s risk position Municipality Finance’s operations require sufficient risk manage-ment mechanisms to ensure that the company’s risk position remains within the limits confirmed by the Board of Directors. Municipality Finance applies very conservative principles to its risk management. The aim is to keep the overall risk status at such a low level that the company’s strong credit rating (Aaa (neg)./AA+) will not be compromised.
Municipality Finance’s general principles, limits and measure-ment methods used in risk management are determined by the Board of Directors. It is the task of the Risk Committee to assist the Board in matters related to the company’s risk strategy and risk taking, and to monitor the compliance of management with the risk strategy set by the Board. The purpose of risk manage-ment is to ensure that the risks associated with lending, funding acquisition, investment and other business operations are aligned with Municipality Finance’s low risk profile.
There were no material changes in the company’s risk position in January–June 2015. Risks remained within the set limits and, according to the company’s assessment, risk management was performed according to requirements. The company’s risk position is regularly reported on to the Board of Directors as a part of the monthly reporting, and the risk management director regularly provides the Board with a broader overall review of the company’s risk position in relation to various risk areas.
The company’s risk management is described in more detail in the financial statements for 2014.
Strategic risksStrategic risk refers to the company choosing the wrong strategy in pursuit of financially profitable operations, or to the inability of the company to adapt the chosen strategy to changes in the operating environment. The Group’s management of strategic risks is based on continuous monitoring and analyses of customer needs, market trend forecasts, and changes in the competition and the operating environment. Risks and their significance are assessed annually when the business plan is drawn up. The Group’s existing strategy extends to 2020.
Credit riskCredit risk refers to the risk of a counterparty defaulting on its commitments to the company. Municipality Finance may grant loans and leasing financing without separate securities only directly to municipalities or joint municipal authorities. Other loans must be secured with an absolute guarantee or deficiency guarantee issued by a municipality or joint municipal authority, or with a state deficiency guarantee. A primary pledge is required when the loan is given a deficiency guarantee by a municipality or a state. The amount of the primary pledge must equal 1.2 times the amount of the loan. The use of these guarantees to reduce credit risk enables the classification of all granted loans as zero-risk when calculating capital adequacy. The company does not bear the residual value risk for the objects of its leasing services.

13
MUNICIPALITY FINANCE Interim report 1 January – 30 June 2015
In its history, Municipality Finance has never incurred credit losses from financing its customers.
Municipality Finance is also exposed to credit risk from its prefunding investment portfolio and derivative instruments. In selecting counterparties, Municipality Finance evaluates credit risk with principles and limits based on external credit ratings and approved by the Board of Directors. The nominal values of debt securities and equivalent credit values of derivatives (fair value method) are used in monitoring credit risk.
With major derivative counterparties, Municipality Finance limits the credit risk of derivative contracts with ISDA Credit Support Annexes. The company has 46 Credit Support Annexes in force. Additionally, the Municipal Guarantee Board’s guarantees are used for reducing the counterparty risk related to the deriva-tive contracts of certain counterparties.
Credit Valuation Adjustments (CVA) which takes credit risk into account is applied to derivative counterparties and Debt Valuation Adjustment (DVA) is applied to Municipality Finance. CVA is calculated for each derivative counterparty by simulating Municipality Finance’s expected positive exposures throughout the maturity of the portfolio, taking into account the probability of default and loss given default. Similarly, DVA is determined on the basis of Municipality Finance’s expected negative exposures, taking into account the probability of Municipality Finance’s default and loss given default.
Market risk Market risk refers to the risk of the company incurring a loss as a result of an unfavourable change in market price or its volatility. Market risks include interest rate, exchange rate, share price and other price risks. Municipality Finance manages the interest rate risk arising from business operations by means of derivative contracts. The company hedges against exchange rate risks by using derivative contracts to swap all funding denominated in foreign currencies into euros. Derivative contracts are also used to hedge against other market risks. Derivative contracts may only be used for hedging purposes.
The company has specified limits for the following market risks:• Currency position risk• Interest rate risk
– Duration– Value-at-Risk– Economic Value
• Income risk• Price risk of pre-funding investments
Liquidity riskLiquidity risk refers to the risk of the company not being able to perform payment obligations arising from the settling of funding agreements or other funding activities on their due date. The company manages liquidity risk by limiting the average matu-rity between customer financing and funding. In addition, the company has set a minimum level for available liquidity which should be sufficient for the liquidity needs for at least six months.
The Board of Directors of Municipality Finance has set the following limits on liquidity risks: • Refinancing gap• Sufficiency of liquid assets measured as a minimum time
period
Market liquidity riskMarket liquidity risk refers to the company failing to realise or cover its position at market price due to the market lacking depth or not functioning due to disruption.
The company monitors the liquidity of markets and products on a continuous basis. In addition, derivative contracts are concluded in accordance with established market standards. Nearly all market values of debt securities valued at fair value are calculated on the basis of quotations received from the market. For the remaining debt securities, the market value is calculated using other market information.
The company has been approved as a monetary policy coun-terparty of the Bank of Finland. The company has pledged loans to the Bank of Finland and can obtain credit from the central bank against these collaterals.
Operational risksOperational risk refers to the risk of loss due to insufficient or failed internal processes, personnel, systems or external factors. Operational risks also include risks arising from failure to comply with internal and external regulation (compliance risk), legal risks and reputational risk. Operational risks may result in expenses, payable compensation, loss of reputation, false information on position, risk and results, or the interruption of operations.
Operational risks are recognised as part of the company’s operations and processes. This has been implemented with an annual mapping of operational risk at department and company levels. Each function/department is responsible for the manage-ment of its operational risks. In addition, the company’s depart-ments responsible for risk control support the other functions/departments and have company-wide responsibility for the coordination of operational risk management.
Municipality Finance uses various methods for managing operational risks. The company has internal operational guide-lines in place. Key duties and processes have been charted and described. Internal instructions and processes are updated on a regular basis and compliance with these is supervised. The tasks of trading, risk control, back office functions, documentation and accounting are separated. The company has adequate substi-tution systems to ensure the continuity of key functions. The expertise of the personnel is maintained and developed through regular development discussions and training plans. Municipality Finance has taken out the insurance policies required by its opera-tions and assesses the level of insurance cover on a regular basis. Municipality Finance has a contingency plan for situations in which business operations are interrupted. The plan is designed to ensure the continued functioning of the company and the limitation of losses in different disruptive scenarios. The annual mapping of operational risks and the operational risk event report process support the company’s continuity planning.

14
MUNICIPALITY FINANCE Interim report 1 January – 30 June 2015
Municipality Finance’s compliance function continuously monitors the development of legislation and regulations issued by authorities relevant to the company’s operations and ensures that any regulatory changes are responded to appropriately. The legislation and regulations concerning the operations of credit institutions have undergone significant changes during the past few years and will continue to be amended in the future, which creates challenges for the company’s compliance. The company has tried to minimise the risks related to this through active contact with the authorities and interest groups as well as organisation of the company’s internal compliance function (including reporting and the evaluation of effects).
The company has significant ongoing information system projects aimed at improving the efficiency of operations. The extent of these projects causes operational risks that the company strives to minimise by developing and implementing models related to project management and monitoring (including regular reporting).
The realisation of operational risks is monitored through systematic operational risk reporting, on the basis of which oper-ating principles are changed or other measures implemented to reduce operational risks where necessary. Operative risk events are reported to the Board of Management and the Board of Directors. No material losses were incurred as a result of operational risks in 2015.
Events after the reporting periodIn 2015, the Financial Stability Office of the Ministry of Finance will collect contributions to the resolution fund, termed stability fees from credit institutions and investment service companies falling within the scope of application of crisis-resolution legis-lation. The total amount of stability fees collected in 2015 will correspond to 0.1% of the total value of guaranteed deposits in Finland on 31 July 2015. The amount of the fee imposed on Municipality Finance will not be determined before late 2015, and the company has not made an expense provision for this in its accounting.
Due to the systematically significant position of Municipality Finance, the European Central Bank (ECB) initiated a comprehen-sive assessment of the operations of Municipality Finance in the spring of 2015. The comprehensive assessment is a process of ECB’s common monitoring mechanism and includes stress testing and the assessment of the credit quality of assets. The assessment should be completed by the end of 2015.
Prospects for the second half of 2015Economic growth is predicted to remain slow in Finland. Despite the weak growth prospects, Municipality Finance does not expect substantial changes to take place in its operating environment, or that of its customers during the remainder of 2015. The operating conditions for the company’s customers may improve in the next few years, if structural reforms get under way and if other actions are taken by the new government which are expected to improve Finnish municipalities’ finances and increase their range of deci-sion making.
The company will focus on continuing to carry out its primary duty of ensuring competitive funding for its customers under all circumstances.
Municipality Finance is a financing partner for its customer-owners, and a key part of the basic economic structure of Finland. The company will continue to develop its operations and its service model, as required by the changing needs of its customers. One aim of the company is to pre-empt some of the changes taking place among its customers and in the market, so that it can offer increasingly fitting solutions for them.
In order to meet leverage ratio requirements, Municipality Finance is continuously analysing the adequacy of its capital structure, and is prepared to improve it if necessary. As before, the company’s own funds can be increased through the result of its operations, but possibly also by issuing a capital loan in the domestic and international capital markets.
Throughout 2015, the group’s profitability is expected to remain at the strong level seen last year.
Helsinki, 11 August 2015Municipality Finance PlcBoard of Directors
Further information:Pekka Averio, President and CEO, tel. +358 500 406 856
Esa Kallio, Executive Vice President, Deputy to CEO, tel. +358 50 337 7953
Marjo Tomminen, Senior Vice President, CFO, tel. +358 50 386 1764
15
MUNICIPALITY FINANCE Interim report 1 January – 30 June 2015
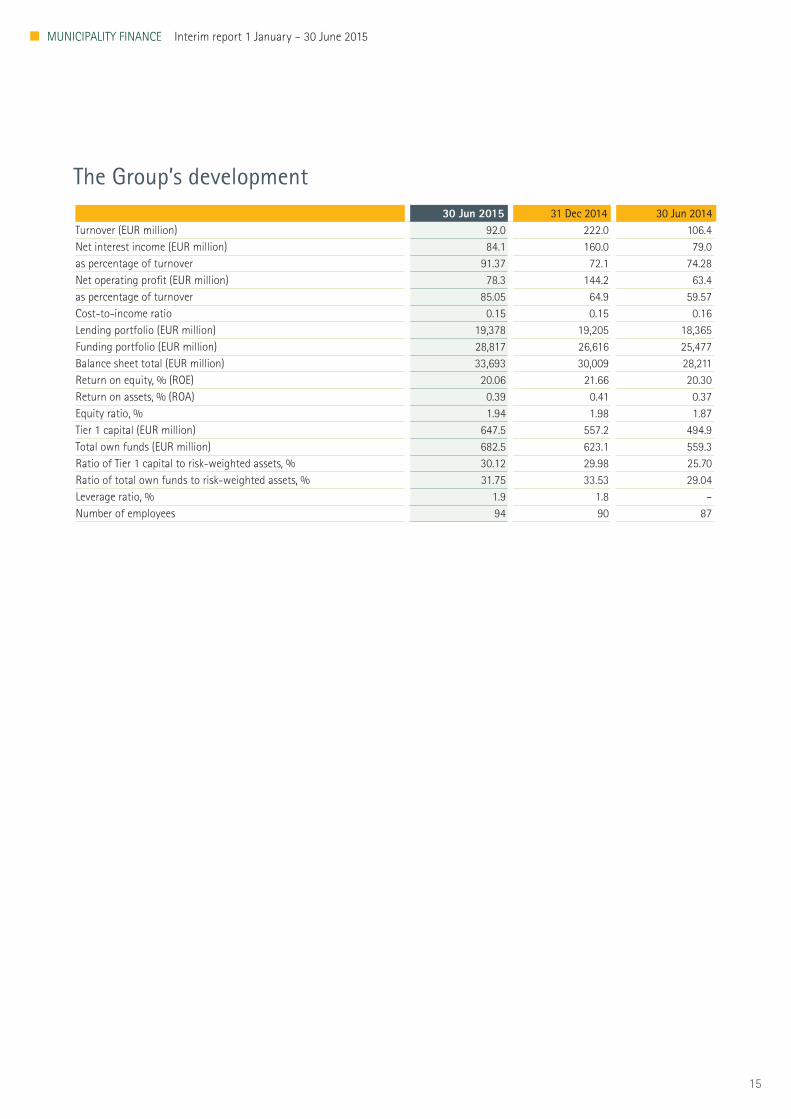
The Group’s development30 Jun 2015 31 Dec 2014 30 Jun 2014
Turnover (EUR million) 92.0 222.0 106.4Net interest income (EUR million) 84.1 160.0 79.0as percentage of turnover 91.37 72.1 74.28Net operating profit (EUR million) 78.3 144.2 63.4as percentage of turnover 85.05 64.9 59.57Cost-to-income ratio 0.15 0.15 0.16Lending portfolio (EUR million) 19,378 19,205 18,365Funding portfolio (EUR million) 28,817 26,616 25,477Balance sheet total (EUR million) 33,693 30,009 28,211Return on equity, % (ROE) 20.06 21.66 20.30Return on assets, % (ROA) 0.39 0.41 0.37Equity ratio, % 1.94 1.98 1.87Tier 1 capital (EUR million) 647.5 557.2 494.9Total own funds (EUR million) 682.5 623.1 559.3Ratio of Tier 1 capital to risk-weighted assets, % 30.12 29.98 25.70Ratio of total own funds to risk-weighted assets, % 31.75 33.53 29.04Leverage ratio, % 1.9 1.8 –Number of employees 94 90 87
16
MUNICIPALITY FINANCE Interim report 1 January – 30 June 2015
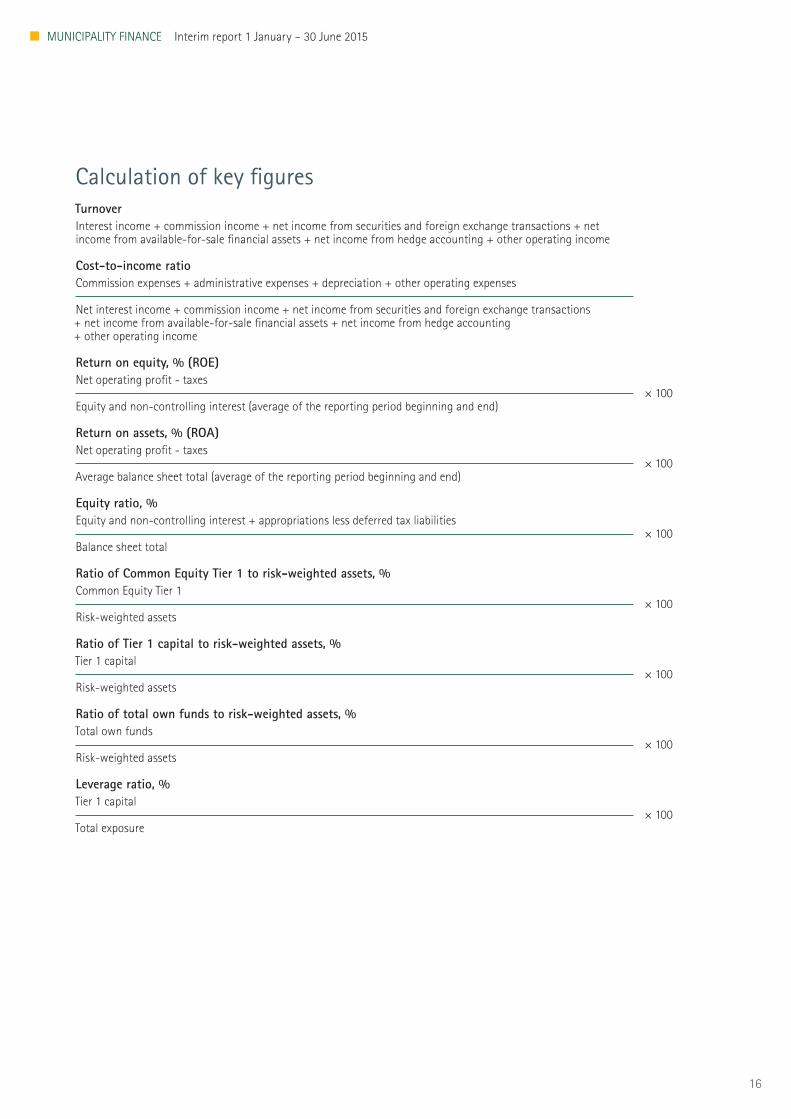
Calculation of key figuresTurnoverInterest income + commission income + net income from securities and foreign exchange transactions + net income from available-for-sale financial assets + net income from hedge accounting + other operating income
Cost-to-income ratioCommission expenses + administrative expenses + depreciation + other operating expenses
Net interest income + commission income + net income from securities and foreign exchange transactions+ net income from available-for-sale financial assets + net income from hedge accounting + other operating income
Return on equity, % (ROE)Net operating profit - taxes × 100Equity and non-controlling interest (average of the reporting period beginning and end)
Return on assets, % (ROA)Net operating profit - taxes × 100Average balance sheet total (average of the reporting period beginning and end)
Equity ratio, %Equity and non-controlling interest + appropriations less deferred tax liabilities × 100Balance sheet total
Ratio of Common Equity Tier 1 to risk-weighted assets, %Common Equity Tier 1 × 100Risk-weighted assets
Ratio of Tier 1 capital to risk-weighted assets, %Tier 1 capital × 100Risk-weighted assets
Ratio of total own funds to risk-weighted assets, %Total own funds × 100Risk-weighted assets
Leverage ratio, %Tier 1 capital × 100Total exposure
17
MUNICIPALITY FINANCE Interim report 1 January – 30 June 2015
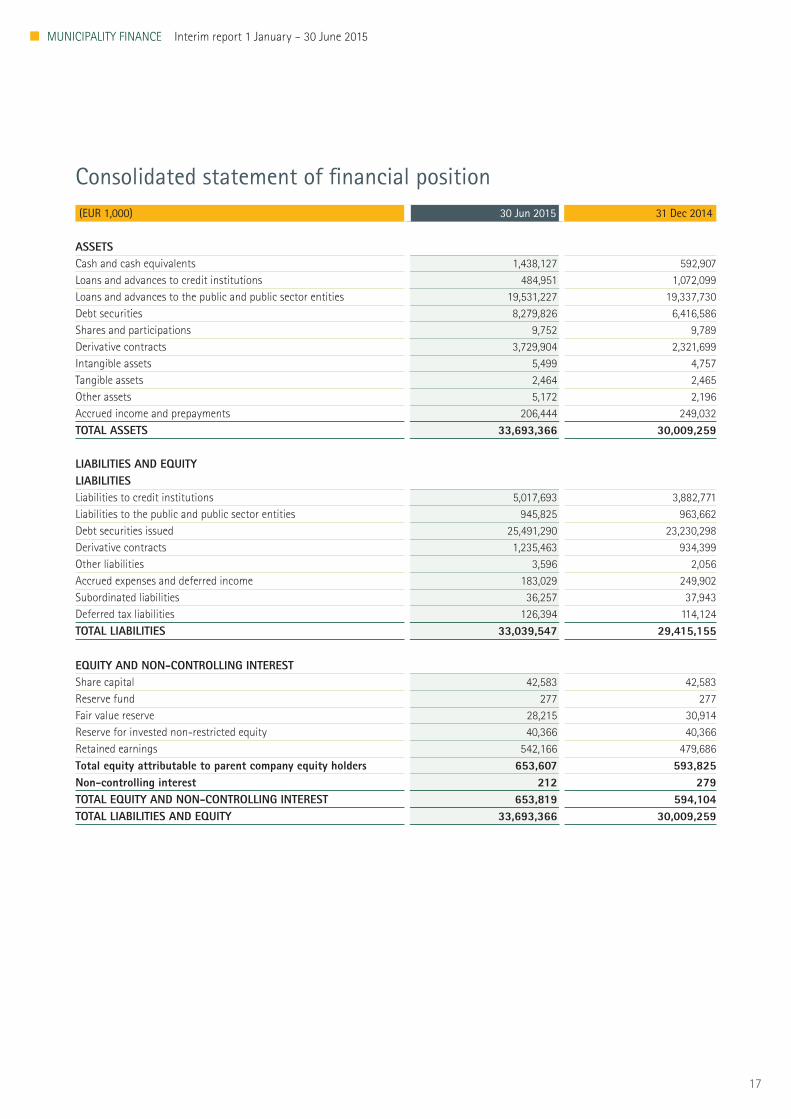
Consolidated statement of financial position(EUR 1,000) 30 Jun 2015 31 Dec 2014
ASSETSCash and cash equivalents 1,438,127 592,907Loans and advances to credit institutions 484,951 1,072,099Loans and advances to the public and public sector entities 19,531,227 19,337,730Debt securities 8,279,826 6,416,586Shares and participations 9,752 9,789Derivative contracts 3,729,904 2,321,699Intangible assets 5,499 4,757Tangible assets 2,464 2,465Other assets 5,172 2,196Accrued income and prepayments 206,444 249,032TOTAL ASSETS 33,693,366 30,009,259
LIABILITIES AND EQUITYLIABILITIESLiabilities to credit institutions 5,017,693 3,882,771Liabilities to the public and public sector entities 945,825 963,662Debt securities issued 25,491,290 23,230,298Derivative contracts 1,235,463 934,399Other liabilities 3,596 2,056Accrued expenses and deferred income 183,029 249,902Subordinated liabilities 36,257 37,943Deferred tax liabilities 126,394 114,124TOTAL LIABILITIES 33,039,547 29,415,155
EQUITY AND NON-CONTROLLING INTERESTShare capital 42,583 42,583Reserve fund 277 277Fair value reserve 28,215 30,914Reserve for invested non-restricted equity 40,366 40,366Retained earnings 542,166 479,686Total equity attributable to parent company equity holders 653,607 593,825Non-controlling interest 212 279TOTAL EQUITY AND NON-CONTROLLING INTEREST 653,819 594,104TOTAL LIABILITIES AND EQUITY 33,693,366 30,009,259

18
MUNICIPALITY FINANCE Interim report 1 January – 30 June 2015
Consolidated income statement(EUR 1,000) 1 Jan–30 Jun 2015 1 Jan–30 Jun 2014
Interest income 84,308 109,939Interest expense –208 –30,926NET INTEREST INCOME 84,100 79,012Commission income 2,670 1,786Commission expense –1,767 –1,823Net income from securities and foreign exchange transactions 1,086 –3,048Net income from available-for-sale financial assets 2,312 170Net income from hedge accounting 1,660 –2,490Other operating income 7 8Administrative expenses –8,210 –6,686Depreciation and impairment on tangible and intangible assets –748 –728Other operating expenses –2,828 –2,843NET OPERATING PROFIT 78,283 63,360Income tax expense –15,691 –12,705PROFIT FOR THE PERIOD 62,591 50,655Profit attributable to:
Equity holders of the parent company 62,480 50,575Non-controlling interest 111 80
Statement of comprehensive income(EUR 1,000) 1 Jan–30 Jun 2015 1 Jan–30 Jun 2014
Profit for the period 62,591 50,655Components of other comprehensive income
Items to be reclassified to profit or loss in subsequent periods Available-for-sale financial assets (fair value reserve): Net change in fair value –1,777 8,998 Net amount transferred to profit or loss –1,642 –133 IAS 39 reclassification adjustment 46 46
Taxes related to components of other comprehensive income 675 –1,782TOTAL COMPREHENSIVE INCOME FOR THE PERIOD 59,893 57,784Total comprehensive income attributable to:
Equity holders of the parent company 59,782 57,704Non-controlling interest 111 80

19
MUNICIPALITY FINANCE Interim report 1 January – 30 June 2015
Consolidated statement of cash flows(EUR 1,000) 1 Jan–30 Jun 2015 1 Jan–30 Jun 2014
CASH FLOW FROM OPERATING ACTIVITIES 633,003 4,476Net change in long-term funding 849,601 2,020,992Net change in short-term funding 309,352 –750,831Net change in long-term loans –276,265 –506,515Net change in short-term loans –337,061 –413,304Net change in investments –1,141,847 –946,041Net change in collateral 1,155,960 537,260Interest paid –5,443 –29,915Interest received 84,350 102,566Other income 17,974 11,944Payments of operating expenses –20,872 –18,746Taxes paid –2,747 –2,934
CASH FLOW FROM INVESTING ACTIVITIES –1,489 –390Acquisition of tangible assets –334 –241Acquisition of intangible assets –1,155 –149
CASH FLOW FROM FINANCING ACTIVITIES –1,206 –10,000Change in subordinated liabilities –1,009 –10,000Dividends paid –197 –
CHANGE IN CASH FUNDS 630,307 –5,914CASH FUNDS AT 1 JANUARY 3,181,659 1,885,173CASH FUNDS AT 30 JUNE 3,811,966 1,879,259
Cash funds include the following balance sheet items:Cash and cash equivalents, loans and advances to credit institutions and debt securities maturing within three months.
(EUR 1,000) 30 Jun 2015 30 Jun 2014Cash and cash equivalents 1,438,127 27,877Loans and advances to credit institutions 484,951 495,177Debt securities maturing within three months 1,888,888 1,356,205TOTAL CASH FUNDS 3,811,966 1,879,259
20
MUNICIPALITY FINANCE Interim report 1 January – 30 June 2015
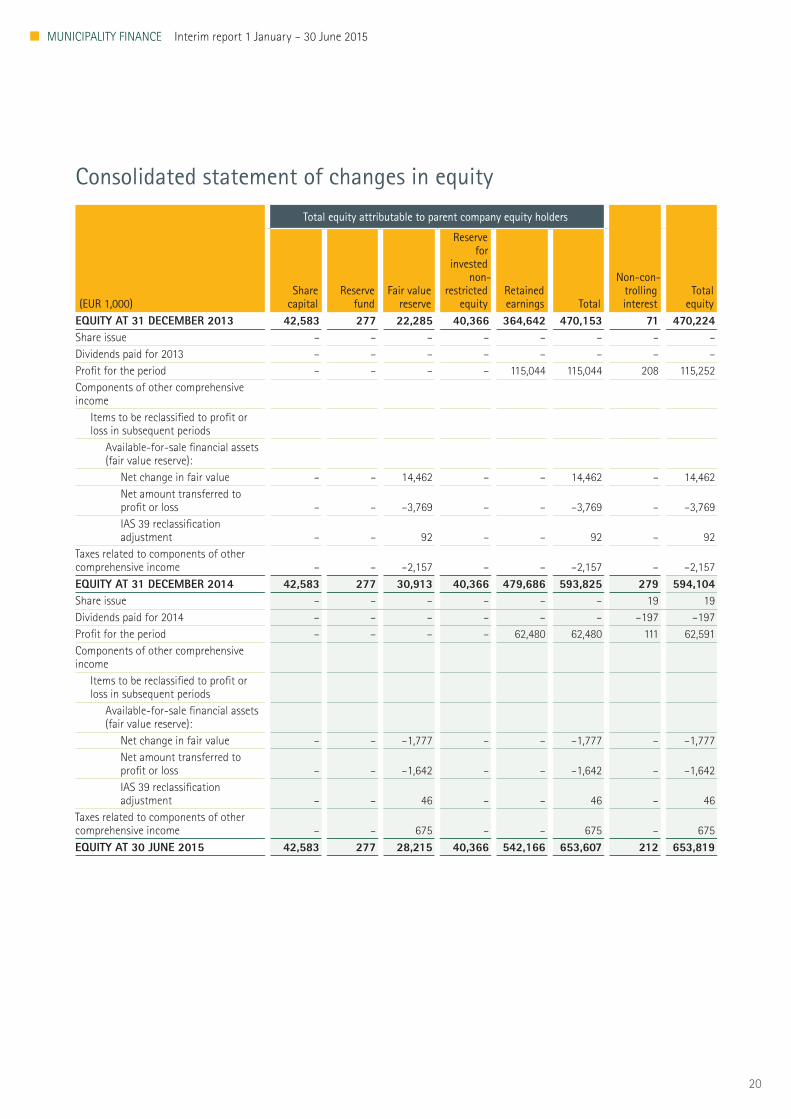
Consolidated statement of changes in equity
(EUR 1,000)
Total equity attributable to parent company equity holders
Share capital
Reserve fund
Fair value reserve
Reserve for
invested non-
restricted equity
Retained earnings Total
Non-con-trolling interest
Total equity
EQUITY AT 31 DECEMBER 2013 42,583 277 22,285 40,366 364,642 470,153 71 470,224Share issue – – – – – – – –Dividends paid for 2013 – – – – – – – –Profit for the period – – – – 115,044 115,044 208 115,252Components of other comprehensive income
Items to be reclassified to profit or loss in subsequent periods
Available-for-sale financial assets (fair value reserve):
Net change in fair value – – 14,462 – – 14,462 – 14,462Net amount transferred to profit or loss – – –3,769 – – –3,769 – –3,769IAS 39 reclassification adjustment – – 92 – – 92 – 92
Taxes related to components of other comprehensive income – – –2,157 – – –2,157 – –2,157EQUITY AT 31 DECEMBER 2014 42,583 277 30,913 40,366 479,686 593,825 279 594,104Share issue – – – – – – 19 19Dividends paid for 2014 – – – – – – –197 –197Profit for the period – – – – 62,480 62,480 111 62,591Components of other comprehensive income
Items to be reclassified to profit or loss in subsequent periods
Available-for-sale financial assets (fair value reserve):
Net change in fair value – – –1,777 – – –1,777 – –1,777Net amount transferred to profit or loss – – –1,642 – – –1,642 – –1,642IAS 39 reclassification adjustment – – 46 – – 46 – 46
Taxes related to components of other comprehensive income – – 675 – – 675 – 675EQUITY AT 30 JUNE 2015 42,583 277 28,215 40,366 542,166 653,607 212 653,819
21
MUNICIPALITY FINANCE Interim report 1 January – 30 June 2015
Notes to the interim reportNote 1. Basis of preparation of the interim report
The interim report has been prepared in accordance with Inter-national Financial Reporting Standards (IFRS). This interim report complies with the standard IAS 34 Interim Financial Reporting and the accounting principles presented in the 2014 consolidated financial statements.
No new IFRS standards entered into force in 2015 that would have had an impact on the presentation of the interim report.
The figures in the notes to the financial statements are presented in thousand euro. This interim report has been reviewed by auditors.
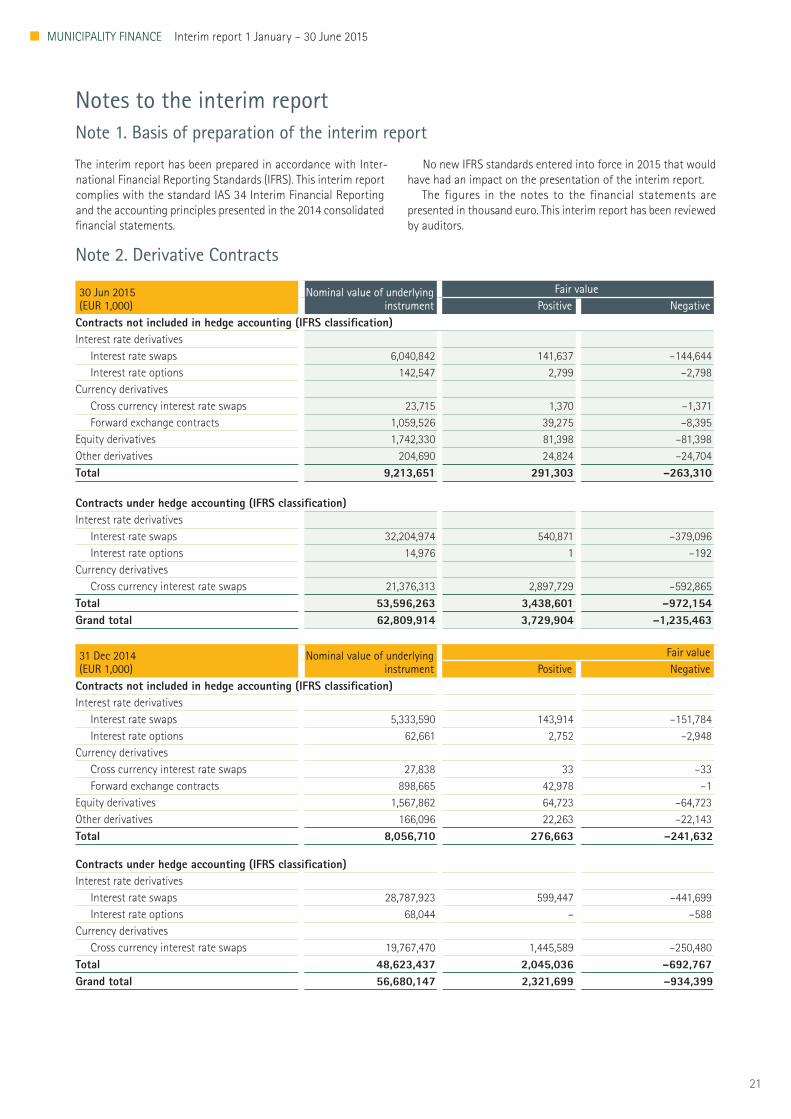
Note 2. Derivative Contracts
30 Jun 2015 (EUR 1,000)
Nominal value of underlying instrument
Fair valuePositive Negative
Contracts not included in hedge accounting (IFRS classification)Interest rate derivatives
Interest rate swaps 6,040,842 141,637 –144,644Interest rate options 142,547 2,799 –2,798
Currency derivativesCross currency interest rate swaps 23,715 1,370 –1,371Forward exchange contracts 1,059,526 39,275 –8,395
Equity derivatives 1,742,330 81,398 –81,398Other derivatives 204,690 24,824 –24,704Total 9,213,651 291,303 –263,310
Contracts under hedge accounting (IFRS classification)Interest rate derivatives
Interest rate swaps 32,204,974 540,871 –379,096Interest rate options 14,976 1 –192
Currency derivativesCross currency interest rate swaps 21,376,313 2,897,729 –592,865
Total 53,596,263 3,438,601 –972,154Grand total 62,809,914 3,729,904 –1,235,463
31 Dec 2014(EUR 1,000)
Nominal value of underlying instrument
Fair valuePositive Negative
Contracts not included in hedge accounting (IFRS classification)Interest rate derivatives
Interest rate swaps 5,333,590 143,914 –151,784Interest rate options 62,661 2,752 –2,948
Currency derivativesCross currency interest rate swaps 27,838 33 –33Forward exchange contracts 898,665 42,978 –1
Equity derivatives 1,567,862 64,723 –64,723Other derivatives 166,096 22,263 –22,143Total 8,056,710 276,663 –241,632
Contracts under hedge accounting (IFRS classification)Interest rate derivatives
Interest rate swaps 28,787,923 599,447 –441,699Interest rate options 68,044 – –588
Currency derivativesCross currency interest rate swaps 19,767,470 1,445,589 –250,480
Total 48,623,437 2,045,036 –692,767Grand total 56,680,147 2,321,699 –934,399
22
MUNICIPALITY FINANCE Interim report 1 January – 30 June 2015
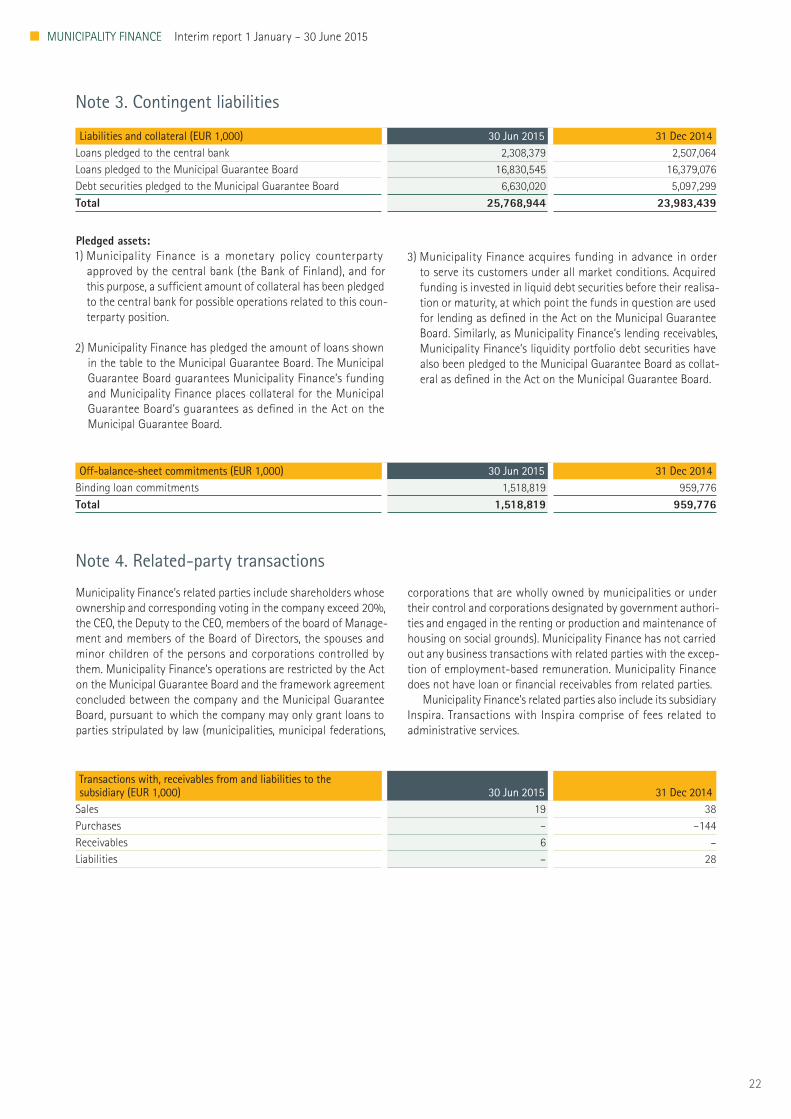
Note 3. Contingent liabilities
Liabilities and collateral (EUR 1,000) 30 Jun 2015 31 Dec 2014Loans pledged to the central bank 2,308,379 2,507,064Loans pledged to the Municipal Guarantee Board 16,830,545 16,379,076Debt securities pledged to the Municipal Guarantee Board 6,630,020 5,097,299Total 25,768,944 23,983,439
Note 4. Related-party transactions
Municipality Finance’s related parties include shareholders whose ownership and corresponding voting in the company exceed 20%, the CEO, the Deputy to the CEO, members of the board of Manage-ment and members of the Board of Directors, the spouses and minor children of the persons and corporations controlled by them. Municipality Finance’s operations are restricted by the Act on the Municipal Guarantee Board and the framework agreement concluded between the company and the Municipal Guarantee Board, pursuant to which the company may only grant loans to parties stripulated by law (municipalities, municipal federations,
corporations that are wholly owned by municipalities or under their control and corporations designated by government authori-ties and engaged in the renting or production and maintenance of housing on social grounds). Municipality Finance has not carried out any business transactions with related parties with the excep-tion of employment-based remuneration. Municipality Finance does not have loan or financial receivables from related parties.
Municipality Finance’s related parties also include its subsidiary Inspira. Transactions with Inspira comprise of fees related to administrative services.
Transactions with, receivables from and liabilities to the subsidiary (EUR 1,000) 30 Jun 2015 31 Dec 2014
Sales 19 38Purchases – –144Receivables 6 –Liabilities – 28
Pledged assets:1) Municipality Finance is a monetary policy counterparty
approved by the central bank (the Bank of Finland), and for this purpose, a sufficient amount of collateral has been pledged to the central bank for possible operations related to this coun-terparty position.
2) Municipality Finance has pledged the amount of loans shown in the table to the Municipal Guarantee Board. The Municipal Guarantee Board guarantees Municipality Finance’s funding and Municipality Finance places collateral for the Municipal Guarantee Board’s guarantees as defined in the Act on the Municipal Guarantee Board.
3) Municipality Finance acquires funding in advance in order to serve its customers under all market conditions. Acquired funding is invested in liquid debt securities before their realisa-tion or maturity, at which point the funds in question are used for lending as defined in the Act on the Municipal Guarantee Board. Similarly, as Municipality Finance’s lending receivables, Municipality Finance’s liquidity portfolio debt securities have also been pledged to the Municipal Guarantee Board as collat-eral as defined in the Act on the Municipal Guarantee Board.
Off-balance-sheet commitments (EUR 1,000) 30 Jun 2015 31 Dec 2014Binding loan commitments 1,518,819 959,776Total 1,518,819 959,776
23
MUNICIPALITY FINANCE Interim report 1 January – 30 June 2015
Note 5. Financial assets and liabilities
Financial assets
30 Jun 2015 (EUR 1,000)
Loans and receivables
Available-for-sale
financial assets
Held-to-maturity
investmentsFair value
option
Fair value through
profit or loss
Derivatives in hedge
accounting Total Fair valueCash and cash equivalents 1,438,127 – – – – – 1,438,127 1,438,127Loans and advances to credit institutions 484,951 – – – – – 484,951 484,970Loans and advances to the public and public sector entities 19,311,576 – – 219,651 – – 19,531,227 20,952,441Debt securities – 6,000,021 1,261,310 1,018,495 – – 8,279,826 8,273,482Shares and participations – 9,752 – – – – 9,752 9,752Derivative contracts – – – – 291,303 3,438,601 3,729,904 3,729,904Total 21,234,654 6,009,773 1,261,310 1,238,146 291,303 3,438,601 33,473,787 34,888,676
Loans and advances to the public and public sector entities includes EUR 152,854 thousand receivables based on leasing agreements.Fair value hedge accounting for interest rate risk is applied to EUR 3,518,372 thousand of debt securities available-for-sale in 2015.
Loans and advances to the public and public sector entities includes EUR 6,547,066 thousand in loans and receivables included in fair value hedge accounting for interest rate risk.
Financial liabilities
30 Jun 2015 (EUR 1,000)
Other financial liabilities
Fair value option
Fair value through
profit or loss
Derivatives in hedge
accounting Total Fair valueLiabilities to credit institutions 5,017,693 – – – 5,017,693 5,088,209Liabilities to the public and public sector entities 945,825 – – – 945,825 948,294Debt securities issued 23,990,627 1,500,663 – – 25,491,290 25,499,303Derivative contracts – – 263,309 972,154 1,235,463 1,235,463Subordinated liabilities 36,257 – – – 36,257 36,330Total 29,990,402 1,500,663 263,309 972,154 32,726,528 32,807,599
Fair value hedge accounting for interest rate risk is applied to EUR 25,068,528 thousand of other financial liabilities in 2015.
24
MUNICIPALITY FINANCE Interim report 1 January – 30 June 2015
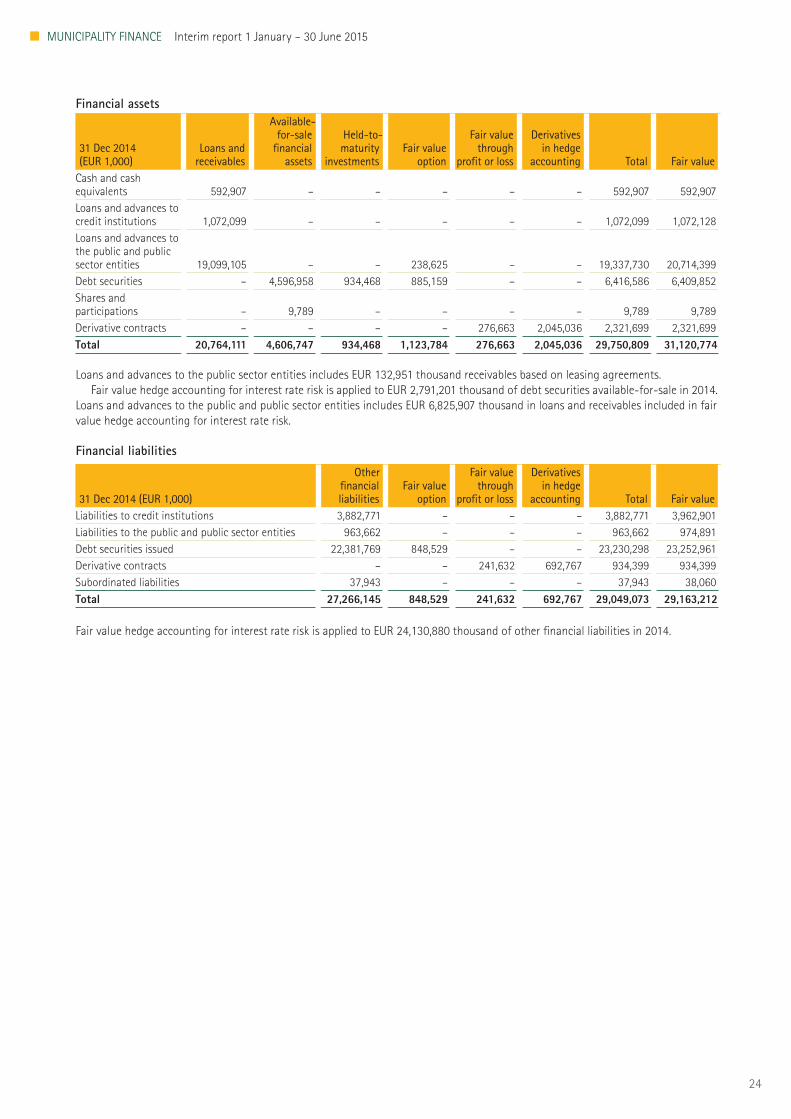
Financial assets
31 Dec 2014 (EUR 1,000)
Loans and receivables
Available-for-sale
financial assets
Held-to-maturity
investmentsFair value
option
Fair value through
profit or loss
Derivatives in hedge
accounting Total Fair valueCash and cash equivalents 592,907 – – – – – 592,907 592,907Loans and advances to credit institutions 1,072,099 – – – – – 1,072,099 1,072,128Loans and advances to the public and public sector entities 19,099,105 – – 238,625 – – 19,337,730 20,714,399Debt securities – 4,596,958 934,468 885,159 – – 6,416,586 6,409,852Shares and participations – 9,789 – – – – 9,789 9,789Derivative contracts – – – – 276,663 2,045,036 2,321,699 2,321,699Total 20,764,111 4,606,747 934,468 1,123,784 276,663 2,045,036 29,750,809 31,120,774
Loans and advances to the public sector entities includes EUR 132,951 thousand receivables based on leasing agreements.Fair value hedge accounting for interest rate risk is applied to EUR 2,791,201 thousand of debt securities available-for-sale in 2014.
Loans and advances to the public and public sector entities includes EUR 6,825,907 thousand in loans and receivables included in fair value hedge accounting for interest rate risk.
Financial liabilities
31 Dec 2014 (EUR 1,000)
Other financial liabilities
Fair value option
Fair value through
profit or loss
Derivatives in hedge
accounting Total Fair valueLiabilities to credit institutions 3,882,771 – – – 3,882,771 3,962,901Liabilities to the public and public sector entities 963,662 – – – 963,662 974,891Debt securities issued 22,381,769 848,529 – – 23,230,298 23,252,961Derivative contracts – – 241,632 692,767 934,399 934,399Subordinated liabilities 37,943 – – – 37,943 38,060Total 27,266,145 848,529 241,632 692,767 29,049,073 29,163,212
Fair value hedge accounting for interest rate risk is applied to EUR 24,130,880 thousand of other financial liabilities in 2014.
25
MUNICIPALITY FINANCE Interim report 1 January – 30 June 2015
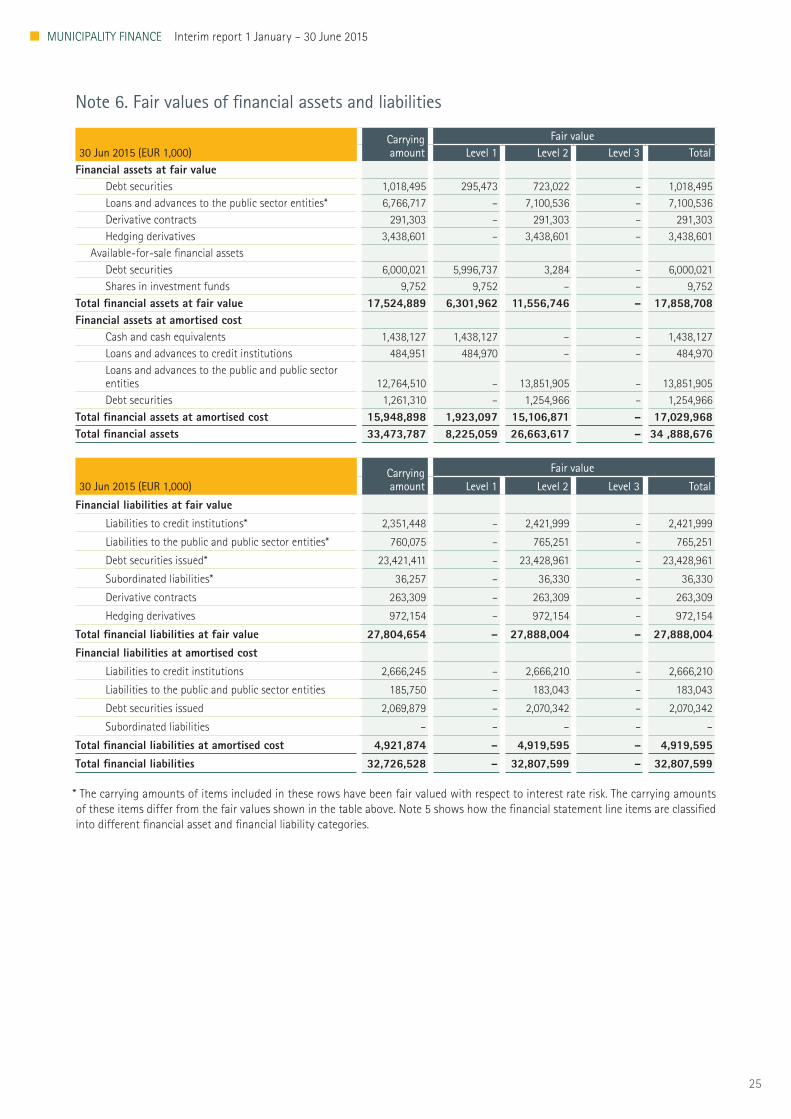
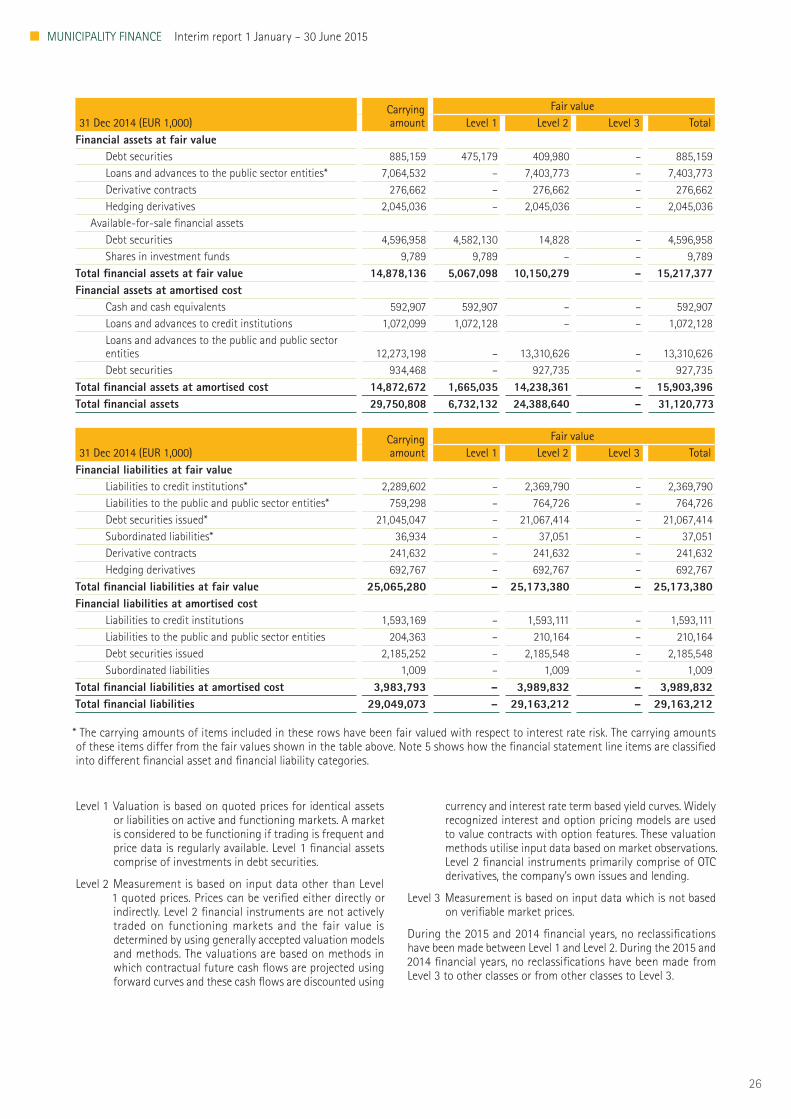
Note 6. Fair values of financial assets and liabilities
30 Jun 2015 (EUR 1,000)Carrying amount
Fair valueLevel 1 Level 2 Level 3 Total
Financial assets at fair valueDebt securities 1,018,495 295,473 723,022 – 1,018,495Loans and advances to the public sector entities* 6,766,717 – 7,100,536 – 7,100,536Derivative contracts 291,303 – 291,303 – 291,303Hedging derivatives 3,438,601 – 3,438,601 – 3,438,601
Available-for-sale financial assetsDebt securities 6,000,021 5,996,737 3,284 – 6,000,021Shares in investment funds 9,752 9,752 – – 9,752
Total financial assets at fair value 17,524,889 6,301,962 11,556,746 – 17,858,708Financial assets at amortised cost
Cash and cash equivalents 1,438,127 1,438,127 – – 1,438,127Loans and advances to credit institutions 484,951 484,970 – – 484,970Loans and advances to the public and public sector entities 12,764,510 – 13,851,905 – 13,851,905Debt securities 1,261,310 – 1,254,966 – 1,254,966
Total financial assets at amortised cost 15,948,898 1,923,097 15,106,871 – 17,029,968Total financial assets 33,473,787 8,225,059 26,663,617 – 34 ,888,676
30 Jun 2015 (EUR 1,000)Carrying amount
Fair value
Level 1 Level 2 Level 3 Total
Financial liabilities at fair valueLiabilities to credit institutions* 2,351,448 – 2,421,999 – 2,421,999
Liabilities to the public and public sector entities* 760,075 – 765,251 – 765,251
Debt securities issued* 23,421,411 – 23,428,961 – 23,428,961
Subordinated liabilities* 36,257 – 36,330 – 36,330
Derivative contracts 263,309 – 263,309 – 263,309
Hedging derivatives 972,154 – 972,154 – 972,154
Total financial liabilities at fair value 27,804,654 – 27,888,004 – 27,888,004Financial liabilities at amortised cost
Liabilities to credit institutions 2,666,245 – 2,666,210 – 2,666,210
Liabilities to the public and public sector entities 185,750 – 183,043 – 183,043
Debt securities issued 2,069,879 – 2,070,342 – 2,070,342
Subordinated liabilities – – – – –
Total financial liabilities at amortised cost 4,921,874 – 4,919,595 – 4,919,595Total financial liabilities 32,726,528 – 32,807,599 – 32,807,599
* The carrying amounts of items included in these rows have been fair valued with respect to interest rate risk. The carrying amounts of these items differ from the fair values shown in the table above. Note 5 shows how the financial statement line items are classified into different financial asset and financial liability categories.
26
MUNICIPALITY FINANCE Interim report 1 January – 30 June 2015
31 Dec 2014 (EUR 1,000)Carrying amount
Fair valueLevel 1 Level 2 Level 3 Total
Financial assets at fair valueDebt securities 885,159 475,179 409,980 – 885,159Loans and advances to the public sector entities* 7,064,532 – 7,403,773 – 7,403,773Derivative contracts 276,662 – 276,662 – 276,662Hedging derivatives 2,045,036 – 2,045,036 – 2,045,036
Available-for-sale financial assetsDebt securities 4,596,958 4,582,130 14,828 – 4,596,958Shares in investment funds 9,789 9,789 – – 9,789
Total financial assets at fair value 14,878,136 5,067,098 10,150,279 – 15,217,377Financial assets at amortised cost
Cash and cash equivalents 592,907 592,907 – – 592,907Loans and advances to credit institutions 1,072,099 1,072,128 – – 1,072,128Loans and advances to the public and public sector entities 12,273,198 – 13,310,626 – 13,310,626Debt securities 934,468 – 927,735 – 927,735
Total financial assets at amortised cost 14,872,672 1,665,035 14,238,361 – 15,903,396Total financial assets 29,750,808 6,732,132 24,388,640 – 31,120,773
31 Dec 2014 (EUR 1,000)Carrying amount
Fair valueLevel 1 Level 2 Level 3 Total
Financial liabilities at fair valueLiabilities to credit institutions* 2,289,602 – 2,369,790 – 2,369,790Liabilities to the public and public sector entities* 759,298 – 764,726 – 764,726Debt securities issued* 21,045,047 – 21,067,414 – 21,067,414Subordinated liabilities* 36,934 – 37,051 – 37,051Derivative contracts 241,632 – 241,632 – 241,632Hedging derivatives 692,767 – 692,767 – 692,767
Total financial liabilities at fair value 25,065,280 – 25,173,380 – 25,173,380Financial liabilities at amortised cost
Liabilities to credit institutions 1,593,169 – 1,593,111 – 1,593,111Liabilities to the public and public sector entities 204,363 – 210,164 – 210,164Debt securities issued 2,185,252 – 2,185,548 – 2,185,548Subordinated liabilities 1,009 – 1,009 – 1,009
Total financial liabilities at amortised cost 3,983,793 – 3,989,832 – 3,989,832Total financial liabilities 29,049,073 – 29,163,212 – 29,163,212
* The carrying amounts of items included in these rows have been fair valued with respect to interest rate risk. The carrying amounts of these items differ from the fair values shown in the table above. Note 5 shows how the financial statement line items are classified into different financial asset and financial liability categories.
Level 1 Valuation is based on quoted prices for identical assets or liabilities on active and functioning markets. A market is considered to be functioning if trading is frequent and price data is regularly available. Level 1 financial assets comprise of investments in debt securities.
Level 2 Measurement is based on input data other than Level 1 quoted prices. Prices can be verified either directly or indirectly. Level 2 financial instruments are not actively traded on functioning markets and the fair value is determined by using generally accepted valuation models and methods. The valuations are based on methods in which contractual future cash flows are projected using forward curves and these cash flows are discounted using
currency and interest rate term based yield curves. Widely recognized interest and option pricing models are used to value contracts with option features. These valuation methods utilise input data based on market observations. Level 2 financial instruments primarily comprise of OTC derivatives, the company’s own issues and lending.
Level 3 Measurement is based on input data which is not based on verifiable market prices.
During the 2015 and 2014 financial years, no reclassifications have been made between Level 1 and Level 2. During the 2015 and 2014 financial years, no reclassifications have been made from Level 3 to other classes or from other classes to Level 3.
27
MUNICIPALITY FINANCE Interim report 1 January – 30 June 2015
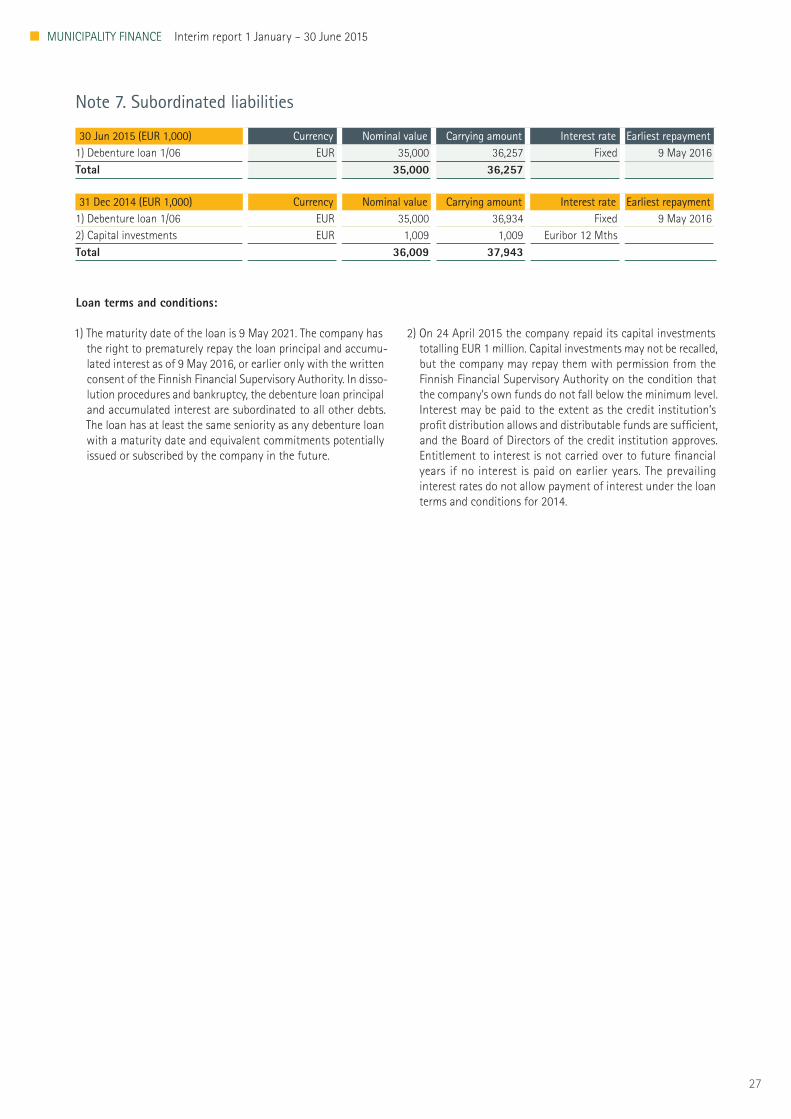
Note 7. Subordinated liabilities
30 Jun 2015 (EUR 1,000) Currency Nominal value Carrying amount Interest rate Earliest repayment1) Debenture loan 1/06 EUR 35,000 36,257 Fixed 9 May 2016Total 35,000 36,257
31 Dec 2014 (EUR 1,000) Currency Nominal value Carrying amount Interest rate Earliest repayment1) Debenture loan 1/06 EUR 35,000 36,934 Fixed 9 May 20162) Capital investments EUR 1,009 1,009 Euribor 12 MthsTotal 36,009 37,943
Loan terms and conditions:
1) The maturity date of the loan is 9 May 2021. The company has the right to prematurely repay the loan principal and accumu-lated interest as of 9 May 2016, or earlier only with the written consent of the Finnish Financial Supervisory Authority. In disso-lution procedures and bankruptcy, the debenture loan principal and accumulated interest are subordinated to all other debts. The loan has at least the same seniority as any debenture loan with a maturity date and equivalent commitments potentially issued or subscribed by the company in the future.
2) On 24 April 2015 the company repaid its capital investments totalling EUR 1 million. Capital investments may not be recalled, but the company may repay them with permission from the Finnish Financial Supervisory Authority on the condition that the company’s own funds do not fall below the minimum level. Interest may be paid to the extent as the credit institution’s profit distribution allows and distributable funds are sufficient, and the Board of Directors of the credit institution approves. Entitlement to interest is not carried over to future financial years if no interest is paid on earlier years. The prevailing interest rates do not allow payment of interest under the loan terms and conditions for 2014.

28
MUNICIPALITY FINANCE Interim report 1 January – 30 June 2015
TRANSLATIONReport on review of the interim report of Municipality Finance Plc as of and for the six-month period ending June 30, 2015
To the Board of Directors of Municipality Finance PlcIntroductionWe have reviewed the consolidated balance sheet as of 30 June 2015, the consolidated income statement, the statement of comprehensive income, the statement of changes in equity and the cash flow statement of Municipality Finance Plc for the six-month period then ended, as well as a summary of significant accounting policies and other explanatory notes to the financial statements. The Board of Directors and the Managing Director are responsible for the preparation and fair presentation of this interim financial information in accordance with the International Financial Reporting Standards (IFRS), as adopted by the EU, and other Finnish rules and regulations governing the preparation of interim reports. We will express our conclusion on the interim report based on our review.
Scope of reviewWe conducted our review in accordance with the Standard on Review Engagements ISRE 2410, “Review of Interim Financial Information Performed by the Independent Auditor of the Entity”. A review of interim financial information consists of making inquiries, primarily of persons responsible for financial and accounting matters, and applying analytical and other review
procedures. A review is substantially less in scope than an audit conducted in accordance with the standards on auditing and other generally accepted auditing practices and consequently does not enable us to obtain a level of assurance that would make us aware of all significant matters that might be identified in an audit. Accordingly, we do not express an audit opinion.
Conclusion Based on our review, nothing has come to our attention that causes us to believe that the interim report does not give a true and fair view of the consolidated financial position as at 30 June 2015 and the consolidated result of its operations and cash flows for the six-month period then ended, in accordance with the International Financial Reporting Standards (IFRS), as adopted by the EU and other applicable rules and regulations governing interim financial reporting preparation in Finland.
Helsinki 11 August 2015
KPMG OY ABMarcus TöttermanAuthorized Public Accountant

Municipality Finance PlcP.O. BOX 744, Jaakonkatu 3 A
FI-00101 HELSINKITel. +358 9 6803 5666