Municipal Solid Waste Management in Brazil: Conditions ... · Table of Contents 1. CONDITIONS AND...
22
Municipal Solid Waste Management in Brazil: Conditions, Problems and Solutions Eduardo Castagnari, President of ABRELPE – Brazilian Association of Urban Cleaning and Special Solid Waste Companies – ISWA National Member CONTACT Eduardo Castagnari Av. Paulista, 807 – cj. 207 São Paulo – SP – Brazil CEP 01311-915 Phone: +55 11 3254-3566 e-mail: [email protected] ABSTRACT
Transcript of Municipal Solid Waste Management in Brazil: Conditions ... · Table of Contents 1. CONDITIONS AND...

Municipal Solid Waste Management in Brazil: Conditions, Problems and Solutions
Eduardo Castagnari, President of ABRELPE – Brazilian Association of Urban Cleaning and Special Solid Waste
Companies – ISWA National Member
CONTACT Eduardo Castagnari Av. Paulista, 807 – cj. 207 São Paulo – SP – Brazil CEP 01311-915 Phone: +55 11 3254-3566 e-mail: [email protected]
ABSTRACT

Table of Contents
1. CONDITIONS AND PROBLEMS REGARDING MUNICIPAL SOLID WASTE
1.1. Domestic and Public Solid Waste
1.1.1 Number of Municipalities with Solid Waste Collection Services
1.1.2 Coverage of Collection Services
1.1.3 Quantity of Collected Solid Waste per Macroregion
1.1.4 Growth of Collected Solid Waste Quantity per Macroregion 2000 / 2004
1.1.5 Final Disposal of Collected Solid Waste
1.1.6 Adequacy of Final Disposal per Macroregion
1.1.7 Financial Resources Made Available by Brazilian Municipalities
1.1.8 Municipalities with Specific Charge for Collection or Urban Cleaning
Services
1.1.9 Reference Data about the Sector (2004)
1.1.10 Private Initiative Participation
1.1.11 Concessions of Urban Cleaning and MSW Final Disposal Public
Services to the Private Initiative
1.1.12 Summary of Main Problems to Solve regarding Domestic and Public
Solid Waste
1.2. Healthcare Waste
1.2.1 Quantity of Healthcare Waste per Macroregion
1.2.2 Percentage of Treated HW per Macroregion
1.2.3 HW Generation and Treatment versus Treatment Installed Capacity
1.2.4 Summary of Main Problems to Solve regarding Healthcare Waste
1.3. Recycling and Collection of Recyclables
1.3.1 Evolution of Main Recyclables Recycling Rates in Brazil
1.3.2 Evolution of Aluminum Recycling Rates in Brazil and Comparison to
other Countries

1.3.3 Evolution of Steel Cans, PET containers, Paper and Glass Recycling
Rates
1.3.4 Evolution of the Number of Municipalities with Recyclables Collection
and Average Composition of Collected Material
1.3.5 Sampling of Recyclables Collection Evolution in 16 Municipalities and
Comparison of the Collected Material Share in terms of Weight and
Revenue
1.3.6 Summary of Main Problems to Solve regarding Recycling and
Recyclables Collection
2. SCENARIOS FOR SOLUTIONS DEVELOPMENT
2.1. Legal Scenario
2.1.1 Federal Law No. 11.079 / 2004 – Public-Private Partnerships
2.1.2 Federal Law No. 11.107 / 2005 – Public Consortiums
2.2. Political and Social Scenario
2.2.1 New Municipal Administrations
2.2.2 Environmental Control and Public Health Organizations
2.2.3 Non Governmental Organizations, Press and Society in General
2.3. Market Scenario
2.3.1 Private Initiative
2.3.2 Financial Institutions
2.3.3 Clean Development Mechanisms - CDM
3. PREDICTED SOLUTIONS AND PATHS
3.1. Domestic and Public Solid Waste
3.2. Healthcare Waste
3.3. Recycling and Collection of Recyclables
3.4. Municipal Solid Waste in General

1. CONDITIONS AND PROBLEMS REGARDING MUNICIPAL SOLID WASTE
1.1 Domestic and Public Solid Waste
Concerning public services which are responsibility of Municipal Governments,
data that allows a clear and comprehensive understanding of the achievements in
domestic and public municipal solid waste management are presented.
1.1.1 Number of Municipalities with Solid Waste Collection Services
Figure 1 shows that almost all Brazilian municipalities have public services of
municipal solid waste collection, which represents a very positive point. However,
this quantitative aspect does not characterize that the universalization of these
services is about to be attained, as it can be observed in the following item 1.1.2.
1.1.2 Coverage of Collection Services
In fact, 2,204 municipalities offer collection services for less than 80% of their
households. In the north and northeast regions, as indicated in Figure 2, most of
the municipalities, i.e. 1,325 of them have these conditions. However, even in the
south and southeast regions, 802 municipalities have this service level. The mid-
west region, the less populated in the country, have only 77 municipalities with this
service level.
99.40% 0.60%
BBrraazziill:: 55550077 mmuunniicciippaalliittiieess
With Collection
Without Collection
Figure 1 – Number of Municipalities with Solid Waste Collection Services

Also, important qualitative factors to be expanded in offered services shall be
considered, such as expansion and frequency increase of areas with sweeping
services, increase of containered collection and replacement of equipments in
precarious conservation conditions.
1.1.3 Quantity of Collected Solid Waste per Macroregion
In Brazil, the significant amount of 162,232 tons of municipal solid waste are daily
collected, and the southeast and northeast regions together represent three fourths
of this amount. Figure 3 shows the whole distribution per macroregion.
1.1.4 Growth of Collected Solid Waste Quantity per Macroregion 2000 / 2004
In the past four years, the average growth of collected solid waste amount in the
country was of 8.22%, with distribution per macroregion shown in Figure 4. The
southeast region with a 8.16% growth is closer to the national average and the
mid-west region recorded the highest growth with 12.74%. This is probably due to
72%
28%
NORTH 449 Municipalities
56%
44%
NORTHEAST
1787 Municipalities
83%
17%
MID-WEST
446 Municipalities
79%
21%
SOUTHEAST
1666 Municipalities
39%
61%
SOUTH
1159 Municipalities
With (+) than 80% of Households with Collection
With (-) than 80% of Households with Collection
12,209 t/d
(7.53%)
41,136 t/d (25.36%)
79,950 t/d (49.28%)
19,381 t/d (11.95%)
9,557 t/d (5.89%)
Southeast
South
Mid-west
North
Northeast
Figure 2 – Coverage of Collection Services
Figure 3 – Quantity of Collected Solid Waste per Macroregion (ton/day)

the fact that this region, which is featured as the new Brazilian agricultural frontier,
has cities going through a period of significant increase of income.
1.1.5 Final Disposal of Collected Solid Waste
That is no doubt the biggest problem to solve in municipal solid waste
management in Brazil. 96,550 tons per day of municipal solid waste are dumped
into dumpsites and into water bodies. To worsen the problem, approximately half of
the almost 65,700 tons daily disposed of in conditions officially considered
appropriate, are in fact disposed of in controlled landfills and not in sanitary landfills
and, apart from that, a significant number of existing sanitary landfills are close to
the end of their useful life.
Figure 5 indicates the qualitative general conditions of collected solid waste final
disposal and shows another equally impacting data. The final disposal
universalization, using as solution sanitary landfills, will demand global pre-
operational investments of about US$ 550 million and will consume another US$
59.51% 40.49%
Without Proper Disposal
With Proper Disposal
10,62
6,97
8,15
7,62
12,74
8,22
0,00 2,00 4,00 6,00 8,00 10,00 12,00 14,00
1
Ma
cro
reg
ion
Growth in the Period (%)
Brazil
South
Mid-west
North
Northeast
Southeast
Figure 4 – 1.1.4 Growth of Collected Solid Waste Quantity per Macroregion 2000 / 2004 (%)
Pre Operational: US$ 550 million Operational: US$ 420 million / year
Necessary investments for Universalization and Replacement of existing landfills at the end of their useful lives
* Sanitary Landfills with basic solution
Figure 5 – Final Disposal of Collected Solid Waste

420 million per year in the environmentally appropriate operation of these landfills.
This shows that an extremely relevant factor of the solution is to set a long-term
economic-financial sustainability.
1.1.6 Adequacy of Final Disposal per Macroregion
Observing the final disposal problem per macroregion in Figure 6, we see that in
absolute terms the southeast and northeast regions are those presenting the
largest solid waste quantities to be properly disposed of, although the same
regions record the most significant indicators of a correct disposal.
1.1.7 Financial Resources Made Available by Brazilian Municipalities
An important aspect for the problem understanding and development of
sustainable solutions is shown in Table 1. Among the 5475 municipalities
researched, approximately 80% apply less than 5% of their budget in municipal
solid waste management, and another 16% of them apply between 5 and 10% of
their budget, both equally insufficient. Only 4% of the municipalities apply values
10% above their budget.
No
rte
No
rde
ste
Su
de
ste
Su
l
Ce
ntr
o-O
este
Bra
sil
Com Destinação
Adequada (t/dia)
Total (t/dia)0
20000
40000
60000
80000
100000
120000
140000
160000
180000
Large Regions
Without Proper Disposal (t/day)
With Proper Disposal (t/day)
Vo
lum
e (
t/d
ay)
Figure 6 – 1.1.6 Adequacy of Final Disposal per Macroregion

Percentage of Budget applied in
Solid Waste Management
Less than
5%
5% to
10%
10% to
20%
15% to
20%
More than
20%
Municipalities
Total
Number of Municipalities 4338 872 123 33 31 5475
1.1.8 Municipalities with Specific Charge for Collection or Urban Cleaning
Services
The number of municipalities with specific sources of funds for municipal solid
waste management is also small, less than 50% according to Figure 7, which
certainly help us understanding why so few municipalities make budgetary
resources available in correspondence to what these services need.
1.1.9 Reference Data about the Sector (2004)
Despite the fact that there is still a lot to do, the reference data about the municipal
solid waste management sector in Brazil are very expressive, as shown in the
following Tables 2, 3 and 4.
Generation of Direct Job Positions
Item Job
Positions
46%
54%
With Charge
Without Charge
Table 1 – 1.1.7 Financial Resources Made Available by Brazilian Municipalities
Figure 7 – 1.1.8 Municipalities with Specific Charge for Collection or Urban Cleaning Services
Economic Activity in the Sector
Item Annual Value (US$ million /
year)
Total Revenue 2,200
Collection of Social and Labor related Taxes
650
Federal Taxes 170
Investment in Compacting Trucks
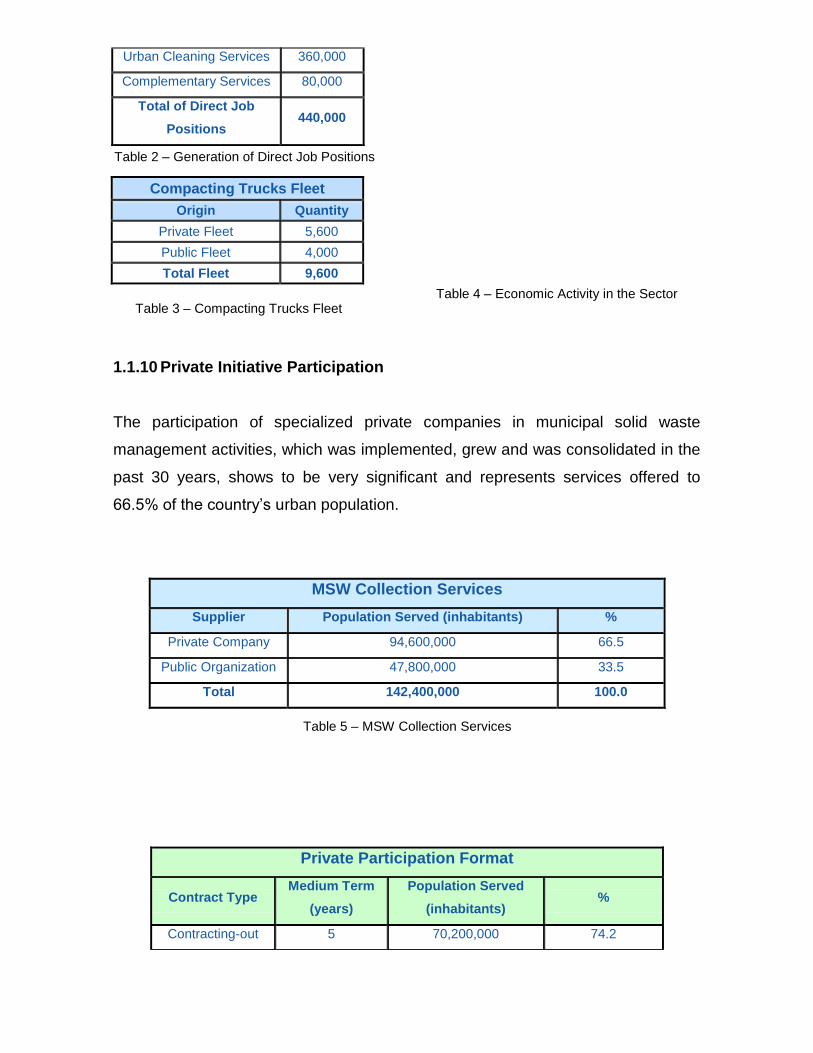
Urban Cleaning Services 360,000
Complementary Services 80,000
Total of Direct Job
Positions 440,000
1.1.10 Private Initiative Participation
The participation of specialized private companies in municipal solid waste
management activities, which was implemented, grew and was consolidated in the
past 30 years, shows to be very significant and represents services offered to
66.5% of the country’s urban population.
MSW Collection Services
Supplier Population Served (inhabitants) %
Private Company 94,600,000 66.5
Public Organization 47,800,000 33.5
Total 142,400,000 100.0
Private Participation Format
Contract Type Medium Term
(years)
Population Served
(inhabitants) %
Contracting-out 5 70,200,000 74.2
Compacting Trucks Fleet
Origin Quantity
Private Fleet 5,600
Public Fleet 4,000
Total Fleet 9,600
Table 2 – Generation of Direct Job Positions
Table 3 – Compacting Trucks Fleet Table 4 – Economic Activity in the Sector
Table 5 – MSW Collection Services

Concession 20 24,400,000 25.8
Total - 94,600,000 100.0
Tables 5 and 6 respectively indicate the private initiative participation and, within
this, the significant role played by concession contracts of these public services.
1.1.11 Concessions of Urban Cleaning and MSW Final Disposal Public
Services to the Private Initiative
These concession contracts signed until 2004, most of them in the past five years
and serving 17% of the Brazilian urban population, present a very diversified and
interesting geographical distribution and composition as shown in Table 7.
Municipalities Population
Served
Quantity per Service type
State Number Urban Cleaning
+ Final Disposal
Urban
Cleaning
Final
Disposal
R.G. do Sul 4 508,369.00 3 - 1
Santa Catarina 9 943,384.00 9 - -
Paraná 1 291,356.00 1 - -
São Paulo 3 10,420,087.00 3 - -
Rio de Janeiro 3 7,023,260.00 1 - 2
Minas Gerais 1 227,415.00 1 - -
Bahia 1 2,630,778.00 - - 1
R.G. Norte 1 766,081.00 - - 1
Amazonas 1 1,582,203.00 - 1 -
TOTAL 24 24,392,933.00 18 1 5
Some significant facts call the attention among these concession contracts
showing that the “concession” solution is generically applied to various types of
municipalities:
• Smaller Municipality: 10,487 inhabitants;
• Bigger Municipality: 10,192,602 inhabitants;
• Municipalities with important tourism activity: 6
Table 6 – Private Participation Format
Table 7 – Concessions of Urban Cleaning and MSW Final Disposal Public Services to the Private Initiative
• State Capital municipalities: 5
• Coastal municipalities: 7
• Countryside municipalities: 17
However, the most significant fact to be highlighted is that this group of concession
contracts gathers private investments of US$ 1.2 billion in total.
1.1.12 Summary of Main Problems to Solve regarding Domestic and Public
Solid Waste
Table 8 presents the main problems to solve regarding domestic and public solid
waste.
IITTEEMM PPRROOBBLLEEMMSS
Collection Services Universalize services for all households.
Improve services coverage and quality – Institute an
uniform standard;
Progressively implement containerization.
Final Disposal
(major problem)
Universalize the environmentally correct disposal;
Replace landfills at the end of their useful lives.
General Implement long-term solutions with environmental and
economic-social sustainability.
1.2 Healthcare Waste
The Brazilian federal legislation lays to generators the responsibility for treatment
and final disposal of Healthcare waste, which has a significant influence on its
conditions in Brazil.
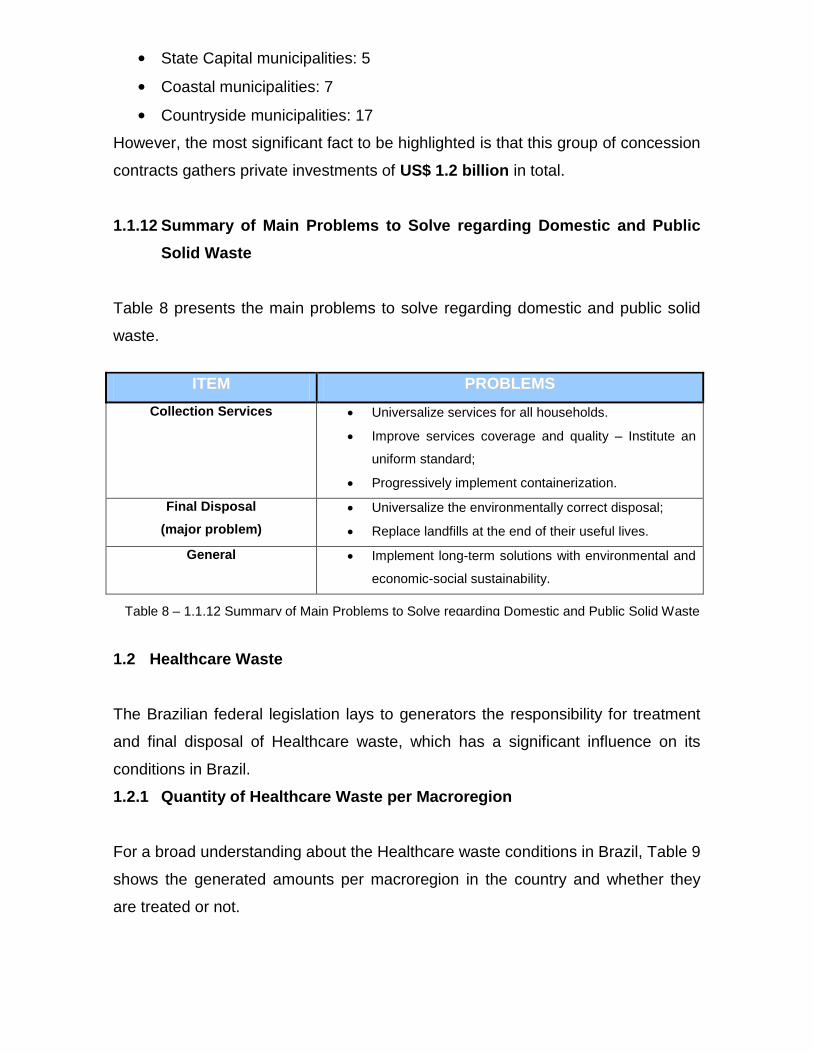
1.2.1 Quantity of Healthcare Waste per Macroregion
For a broad understanding about the Healthcare waste conditions in Brazil, Table 9
shows the generated amounts per macroregion in the country and whether they
are treated or not.
Table 8 – 1.1.12 Summary of Main Problems to Solve regarding Domestic and Public Solid Waste
Macroregion Quantity of HW (t/day)
Generated Treated Not treated
North Region 56.33 0.00 56.33
Northeast Region 261.40 40.07 221.33
São Paulo 210.90 166.67 44.23
Southeast Region 435.13 176.83 258.30
South Region 161.94 32.00 129.94
Mid-West Region 110.03 38.33 71.70
Brazil 1,024.84 287.23 737.61
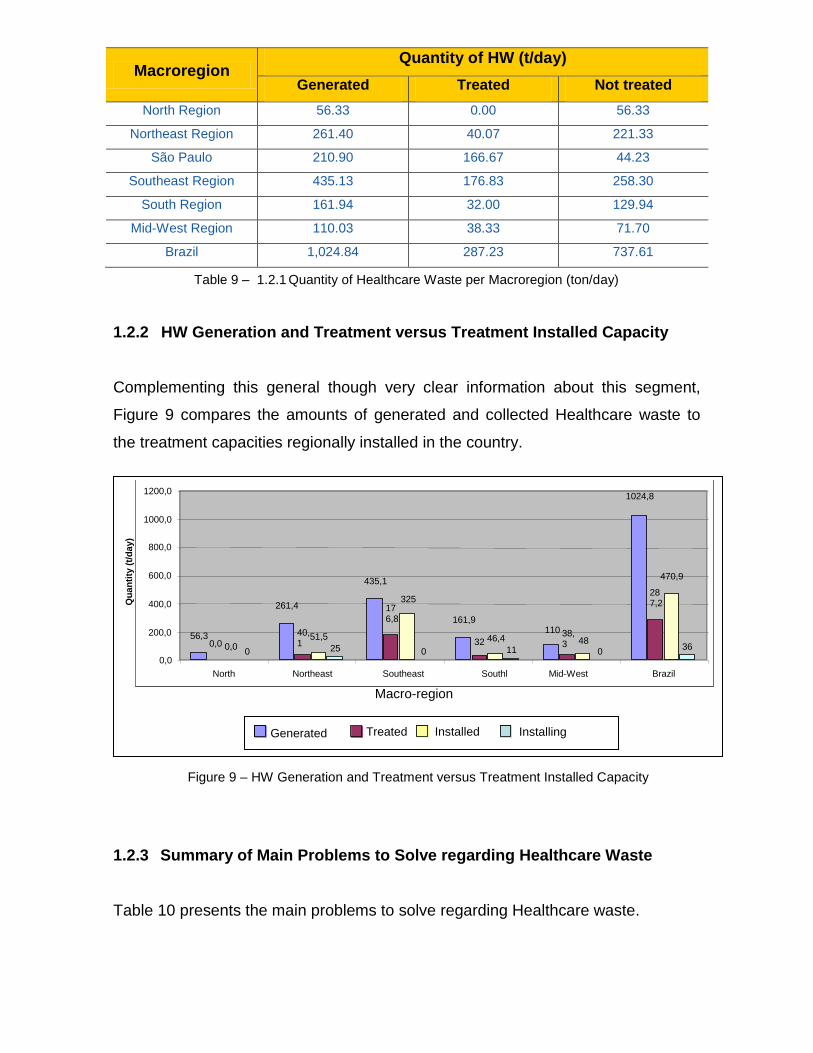
1.2.2 HW Generation and Treatment versus Treatment Installed Capacity
Complementing this general though very clear information about this segment,
Figure 9 compares the amounts of generated and collected Healthcare waste to
the treatment capacities regionally installed in the country.
1.2.3 Summary of Main Problems to Solve regarding Healthcare Waste
Table 10 presents the main problems to solve regarding Healthcare waste.
Table 9 – 1.2.1 Quantity of Healthcare Waste per Macroregion (ton/day)
56,3
261,4
435,1
161,9 110
1024,8
0,0 40,1
176,8
32 38,3
287,2
0,0 51,5
325
46,4 48
470,9
0 25 0 11 0 36 0,0
200,0
400,0
600,0
800,0
1000,0
1200,0
Norte Nordeste Sudeste Sul Centro-Oeste Brasil
Qu
an
tity
(t/
day)
Installing
56,3
261,4
435,1
161,9 110
1024,8
0,0 40,1
176,8
32 38,3
287,2
0,0 51,5
325
46,4 48
470,9
0 25 0 11 0 36 0,0
200,0
400,0
600,0
800,0
1000,0
1200,0
North Northeast Southeast Southl Mid-West Brazil
Macro-region
Generated
Treated
Installed
Figure 9 – HW Generation and Treatment versus Treatment Installed Capacity

IItteemm PPrroobblleemmss
MSW Treatment Universalization. However, the responsibility is
legally of the generators.
Management Most of the Municipalities, except the São Paulo
State ones, don’t assume responsibility for
MSW management.
Legislation Incomplete federal legislation causing
inadequate state and municipal legislations and
actions.
1.3 Recycling and Collection of Recyclables
The logical order of these activities was inverted on purpose, placing collection of
recyclables in second, because most of the recycling activities in Brazil are carried
out in an informal fashion and the expressive figures regarding some recyclable
materials are not related to structured programs.
1.3.1 Evolution of Main Recyclables Recycling Rates in Brazil
Four materials – aluminum, paper, glass and PET – are pointed out as the most
recycled in Brazil, and the evolution of their respective rates can be seen in Figure
10.
Table 10 – Summary of Main Problems to Solve regarding Healthcare Waste
0,00 10,00
20,00
30,00 40,00
50,00 60,00
70,00
80,00 90,00
1 2 3 4 5 6 7 8 9 10 11
Papéis recicláveis Latas de alumínio Embalagens de PET Vidro
Recycli
ng
Rate
s (
%)
1993 1994 1995 1996 1997 1998 1999 2000 2001 2002 2003 2004 0,00
10,00
20,00
30,00 40,00
50,00 60,00
70,00
80,00 90,00
1 2 3 4 5 6 7 8 9 10 11
Paper Aluminium Cans PET Packages Glass
1993 1994 1995 1996 1997 1998 1999 2000 2001 2002 2003 2004
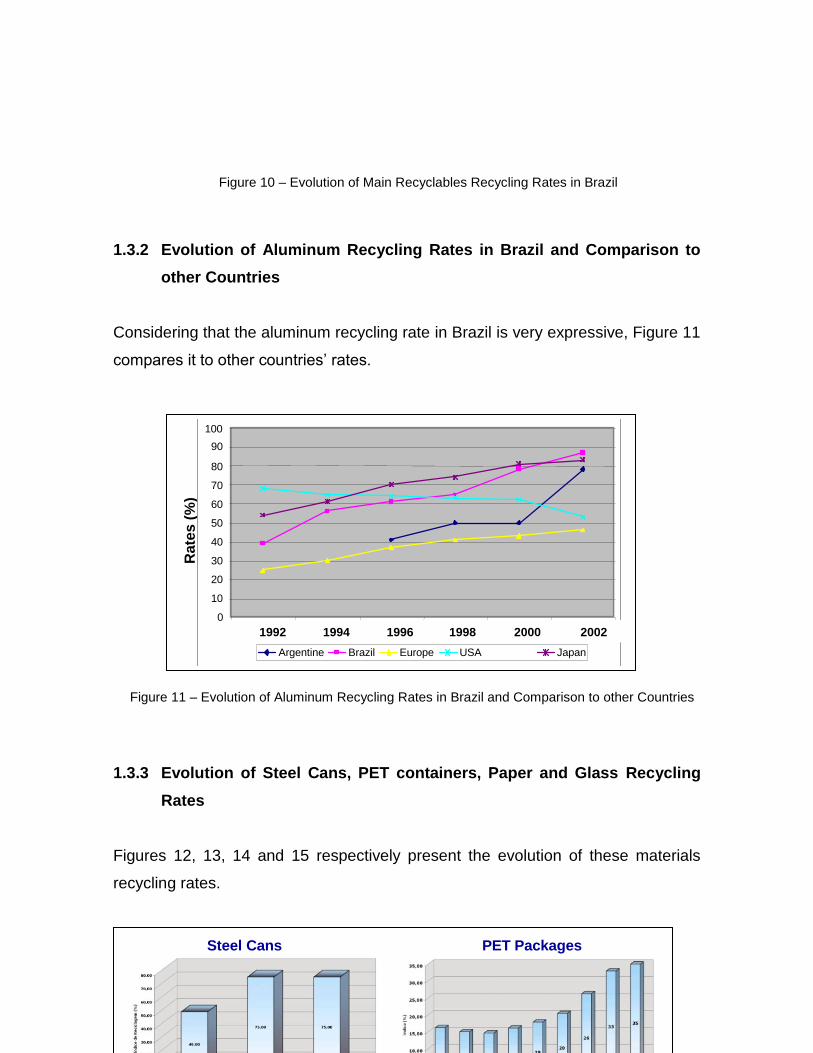
1.3.2 Evolution of Aluminum Recycling Rates in Brazil and Comparison to
other Countries
Considering that the aluminum recycling rate in Brazil is very expressive, Figure 11
compares it to other countries’ rates.
1.3.3 Evolution of Steel Cans, PET containers, Paper and Glass Recycling
Rates
Figures 12, 13, 14 and 15 respectively present the evolution of these materials
recycling rates.
Figure 10 – Evolution of Main Recyclables Recycling Rates in Brazil
0
10
20
30
40
50
60
70
80
90 100
1 2 3 4 5 6
Argentina Brasil Europa Estados Unidos
Japão
Ano 1992 Ano 1994 Ano 1996 Ano 1998 Ano 2000 Ano 2002
Rate
s (
%)
0
10
20
30
40
50
60
70
80
90 100
1 2 3 4 5 6
Argentina Brasil Europa Estados Unidos
Japão
Ano 1992 Ano 1994 Ano 1996 Ano 1998 Ano 2000 Ano 2002 0
10
20
30
40
50
60
70
80
90 100
1 2 3 4 5 6
Argentine Brazil Europe USA Japan
1992 1994 1996 1998 2000 2002
Figure 11 – Evolution of Aluminum Recycling Rates in Brazil and Comparison to other Countries
Steel Cans PET Packages

1.3.4 Evolution of the Number of Municipalities with Recyclables Collection
and Average Composition of Collected Material
The evolution of recyclables collection in Brazilian municipalities, in the past ten
years, is shown in Figure 16. Although the graph shows that the number of
municipalities quadruplicated in the period, the fact that they only represent
approximately 4.5% of the country’s total number of municipalities reveals that
there is still a lot to be done.
Figures 12 and 13 – Evolution of Steel Cans and PET Packages Recycling Rates
RecyclablePaper Glasso
Figures 14 and 15 – Evolution of Recyclable Paper and Glass Recycling Rates
Municipalities with Separate Collection
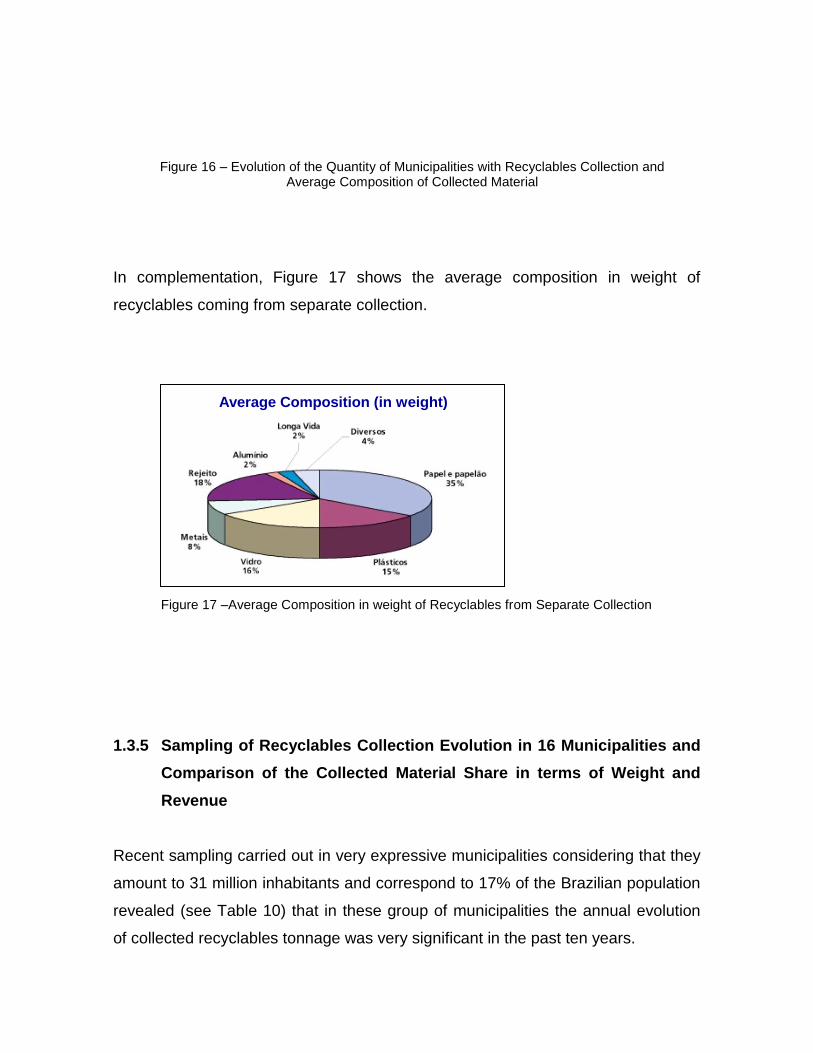
In complementation, Figure 17 shows the average composition in weight of
recyclables coming from separate collection.
1.3.5 Sampling of Recyclables Collection Evolution in 16 Municipalities and
Comparison of the Collected Material Share in terms of Weight and
Revenue
Recent sampling carried out in very expressive municipalities considering that they
amount to 31 million inhabitants and correspond to 17% of the Brazilian population
revealed (see Table 10) that in these group of municipalities the annual evolution
of collected recyclables tonnage was very significant in the past ten years.
Figure 16 – Evolution of the Quantity of Municipalities with Recyclables Collection and Average Composition of Collected Material
Average Composition (in weight)
Figure 17 –Average Composition in weight of Recyclables from Separate Collection

Recyclables Collection Year
1994 1999 2002 2004
Collected Quantity (t) 18,456 75,864 103,800 130,212
The collected recyclables share in terms of weight and revenue is presented in
Figure 18.
1.3.6 Summary of Main Problems to Solve regarding Recycling and
Recyclables Collection
Table 11 presents the summary of main problems to solve regarding recycling and
recyclables collection activities.
IItteemm PPrroobblleemmss
Recycling Most of the recycling activities are informally carried out. They consequently lack management;
Restrained demand for various potentially recyclable materials.
Recyclables Collection Small number of municipalities with recyclables collection programs and small collection rates in most of them;
Municipalities have no or little resources for this activity.
Table 10 – Evolution of Collection in 16 Municipalities
Participation in weight and revenue Weight Revenue
Figure 18 – 1.3.5 Sampling of Recyclables Collection Evolution in 16 Municipalities and
Comparison of the Collected Material Share in terms of Weight and Revenue

Legislation Lack of legislation to give these activities sustainability;
The tributary legislation does not privilege recyclables.
2 SCENARIOS FOR SOLUTIONS DEVELOPMENT
2.1 Legal Scenario
In the past twelve months this scenario presented a remarkable evolution since two
new federal laws – Law of Public-Private Partnerships and Law of Public
Consortiums – were enacted creating interesting perspectives for municipal solid
waste management.
2.1.1 Federal Law No. 11.079 / 2004 – Public-Private Partnerships
The main aspects of this law regarding its applicability to the concerning segment
are presented as follows:
• Public-private partnership is the concession contract which one of the
modalities is the administrative concession.
• Administrative concession is the services performance contract in which the
Public Administration is the direct or indirect user of services.
• The guidelines of public-private partnerships contracts are as follows:
Respect to interests and rights of services beneficiaries and of private
organizations responsible for their execution;
Fiscal responsibility in contracting and executing partnerships;
Transparence of procedures and decisions;
Objective share of risks between the parties;
Financial sustainability and socioeconomic advantages of partnership
projects.
• Public-Private Partnership Contracts shall have:
Value above R$ 20 million;
Table 11 – Summary of Main Problems to Solve regarding Recycling and Recyclables Collection

Services performance periods from 5 to 35 years.
• Possibility of establishing objective guarantees such as:
Binding of revenues;
Institution or utilization of special funds foreseen in laws.
Comment: The potentially more positive contribution brought by this law was the
ratification of the concept in which the municipality acts as the “only user”, very
much used by the segment in modeling concessions. Public services regarding
municipal solid waste management can not be directly offered to households
considering that these services are essential and can not be interrupted and,
cumulatively, can not be stopped due to the lack of payment.
2.1.2 Federal Law No. 11.107 / 2005 – Public Consortiums
The highlights of this law are presented as follows:
• The Consortium can:
Set covenants, contracts and agreements;
Receive social and economic support, contributions and subventions; Promote expropriations and institute free passages; Issue charging documents and collect tariffs and other public prices; Grant concessions.
• Strengthens the union among federate bodies and facilitates the solution of common problems.
• Creates reciprocal rights and duties among federate bodies.
• Allows economies of scale gains through shared solutions.
• Have no economic purposes, aiming at the services improvement. Comment: Solutions for municipal solid waste management many times depend on economies of scale to express economic-financial feasibility. This law allows the Municipalities to get united, also with States and the Federation, in juridical-legal conditions of commitment to allow the structuring of concessions to the private initiative providing security and guarantees to the investor. It equally combines with the public-private partnerships law.
2.2 Political and Social Scenario A proper combination of factors, detailed as follows, set a favorable scenario for solutions implementation.
2.2.1 New Municipal Administrations
• The mandates started in 2005 which for a while allows the implementation
of consistent solutions;
• A significant amount of new mayors is showing to be aware of the necessity
for implementing integral solutions for MSW.
2.2.2 Environmental Control and Public Health Organizations
Pressure on municipal administrations is continually intensifying.
2.2.3 Non Governmental Organizations, Press and Society in General
Denounces about improper MSW management are constant;
Congresses and seminars promoted by sectoral NGOs frequently debate
the MSW issue.
2.3 Market Scenario
As well as the political and social scenario, the marketing scenario is positive for
the implementation of solutions based on private investments, as shown as follows.
2.3.1 Private Initiative
In face of the prognosis of more consistent and safe business models, the
sector’s companies show enthusiasm in carrying out bigger investments
with longer repayment periods.
2.3.2 Financial Institutions
Caixa Econômica Federal (CEF) and Banco Nacional de Desenvolvimento
Econômico e Social (BNDES) offer financing lines with special conditions for
environmentally friendly projects;
World Bank and IFC and other foreign institutions also offer financings with
attractive conditions.
2.3.3 Clean Development Mechanisms - CDM

The commercialization of carbon credits due to the Kyoto Protocol means
extra and important revenue to make MSW final disposal projects feasible.
3 PREDICTED SOLUTIONS AND PATHS
3.1 Domestic and Public Solid Waste
In face of the main problems identified and of the existing scenarios for the
implementation of sustainable solutions for domestic and public solid waste
management, the following solutions are prognosticated:
3.2 Healthcare Waste
In consideration of the sector’s characteristics determined by federal legislation, for
the desired universalization the following solutions and paths are prognosticated:
3.3 Recycling and Collection of Recyclables
The Concession of services to the Private initiative shall be imposed as the main solution to solve the problems related to larger coverage, quality of urban cleaning general services and universalization of proper solid waste final disposal.
The Public-Private participation will occupy a significant portion of these
concessions. Public Consortium among Municipalities will contribute to make solutions with
better economies of scale feasible.
Legislations similar to the already existent in the State of São Paulo, which is being reinforced by the State Policy of Solid Waste now being analyzed by the State Congress, shall be enacted by other federation states making mandatory the effective treatment of MSW.
Slowly, municipalities of various states are assuming totally or partially the
management of MSW. The intensification of these procedures is the trend. The National Policy of Solid Waste, elaboration in progress, shall contain MSW
management instruments inspired by São Paulo State Policy of Solid Waste.

It is acknowledged that informal initiatives prevail in recycling activities, which
poses serious limitations. In parallel, without specific resources, the necessary
collection of recyclables promoted by municipal governments will not progress. For
the desired increment of these activities, the following solutions and paths are
prognosticated:
3.4 Municipal Solid Waste in General
The concept of adopting integrated solutions is gaining space day-by-day among
public and private managers and, therefore, it is perfectly valid to prognosticate the
following path for municipal solid waste in general:
Policies adopted in reference cities, such as São Paulo, Curitiba and Porto Alegre, indicate that the recycling promoted and managed by the Public Power gains space over the still predominant informal chain.
New legislations in elaboration present a strong trend of instituting instruments
based on the polluter-payer principle, which will create revenues for increasingly support the recyclables collection activities.
Alterations in Tributary Policy aiming at the reduction of recyclables related
taxes, consequence of a more and more strong pressure of the organized society, will increase the demand for the utilization of a larger amount and a
broader diversity of these materials.
Solutions already adopted or with adoption in progress by several Municipalities
indicate a clear trend for an increasing use of the concession model comprehending the integral management of municipal solid waste, including domestic and public solid waste, Healthcare waste and recyclables collection
and recycling.