Munich Personal RePEc Archive - uni-muenchen.de Personal RePEc Archive Does Consumer Con dence ......
22
Munich Personal RePEc Archive Does Consumer Confidence Forecast Household Spending? The Euro Area Case David Pascal Dion 22. November 2006 Online at http://mpra.ub.uni-muenchen.de/911/ MPRA Paper No. 911, posted 24. November 2006
-
Upload
nguyenxuyen -
Category
Documents
-
view
215 -
download
1
Transcript of Munich Personal RePEc Archive - uni-muenchen.de Personal RePEc Archive Does Consumer Con dence ......

MPRAMunich Personal RePEc Archive
Does Consumer Confidence ForecastHousehold Spending? The Euro AreaCase
David Pascal Dion
22. November 2006
Online at http://mpra.ub.uni-muenchen.de/911/MPRA Paper No. 911, posted 24. November 2006

1
"DOES CONSUMER CONFIDENCE FORECAST HOUSEHOLD SPENDING?
THE EURO AREA CASE"
David-Pascal DION12
ABSTRACT
The following analysis, based on error correction models, suggests that consumer confidence, together with traditional macroeconomic variables, contains a forecasting and explicative power on consumption. By including consumer confidence in a consumption function, consumer confidence releases a significant coefficient. Such a confidence-augmented consumption model provides good forecasting results.
Keywords: Consumer confidence; consumption function; forecasting; consumer attitudes and
behaviour; households
JEL classification: C52, C53, D11, D12, E21, E27
1 The main thrust of this work was carried out while I was at EURIsCO, Department of Applied Economics, University of
Paris Dauphine, France. I am currently at the European Commission, Brussels, Belgium. Tel.: (00 32) 2 29 88 269; fax: (00 32) 2 29 62 456. E-mail address: [email protected]
2 For helpful comments I thank participants at seminars at the European Central Bank and at the European Commission.
2
INTRODUCTION
According to the business press but also more and more economists, consumer spending depends not
only on current income and wealth but also on consumer confidence. Confidence measures specific
attitudes related to particular events and/or uncertainty about future financial and economic situation.
The CCI is constructed to measure these attitudes but an assessment of its eventual explicative and
predictive value is complex.
This paper studies the causes and effects of consumer confidence in the euro-area as measured by the
European Commission. It seeks to answer the following issues:
[In the 1st Part]
- Does consumer confidence provide information about current and/or future consumption?
- If it does, is consumer confidence an independent explicative variable of consumption over
traditional macroeconomic variables or a simple catalyst of broader economic variables?
[In the 2nd Part]
- What are the determinants of consumer confidence?
- Can these explicative factors help us explain the few temporary deviations between the CCI and
consumption growth?
Among the three main roles usually attached to consumer confidence (causal factor, catalyst for other
shocks, summary for other variables), we want to determine in the first part how informative consumer
confidence is relatively to other macroeconomic variables. As a summary of already known data, the
indicator would be redundant and thus irrelevant as a specific forecasting instrument. However, as a
summary of not yet available data, the CCI would have a limited although important use. Finally, as an
independent variable in predicting consumption, confidence would have an obvious explicative
interest. In spite of the increasing evidence accepting the explicative power of confidence brought by
recent studies (mostly in the USA but also in several European countries), there is still no broad
consensus about its ability to explain consumption in the euro area beyond the traditional explicative
power of economic fundamentals.
In the second part we plan to determine the variables which relate systematically and in a causative
way with consumer confidence. This paper should make it clear that consumer confidence is a
synthesis of both macroeconomic variables and psychological factors (see also Katona, 1975, 1960,
1951 and Dion, 2006). The case for temporary divergence between the CCI and consumption growth
may be explained by these psychological factors. For instance in the case of sudden special events

3
strongly affecting confidence, and forcing it to diverge from current and expected economic
conditions. If the impact of these events on confidence progressively decrease they might not affect
households’ future decision to buy and thus not be reflected in consumer spending. The questions
raised in this second part are important since if we can forecast consumer confidence, then we do not
need it anymore to predict consumption (to the extent, that consumer confidence was apparently able
to predict consumption). Conversely, if consumer confidence can predict consumer spending but
cannot be predicted, then confidence contains independent information of evident use in predicting
consumption. Discussing the predictive power of attitudes and expectations indeed requires
recognising these psychological factors both as complements and substitutes to objective variables.
PART I – HOW USEFUL IS THE CCI TO FORECAST AND EXPLAIN CONSUMPTION SPENDING?
This part assesses whether and to what extent changes in the CCI cause consumption (as the “animal
spirits” depicted by Keynes explained prospects for investment). The chart below plots consumption
growth (year on year quarterly growth rates) and consumer confidence indicating a relatively close
relationship which leads to think that confidence may have some valuable information for inference of
current and near-future consumption.
Private consumption growth and consumer confidence
-3
-2.5
-2
-1.5
-1
-0.5
0
0.5
1
1.5
2
Mar
-85
Mar
-86
Mar
-87
Mar
-88
Mar
-89
Mar
-90
Mar
-91
Mar
-92
Mar
-93
Mar
-94
Mar
-95
Mar
-96
Mar
-97
Mar
-98
Mar
-99
Mar
-00
Mar
-01
Private consumption Old CCI New CCI
4
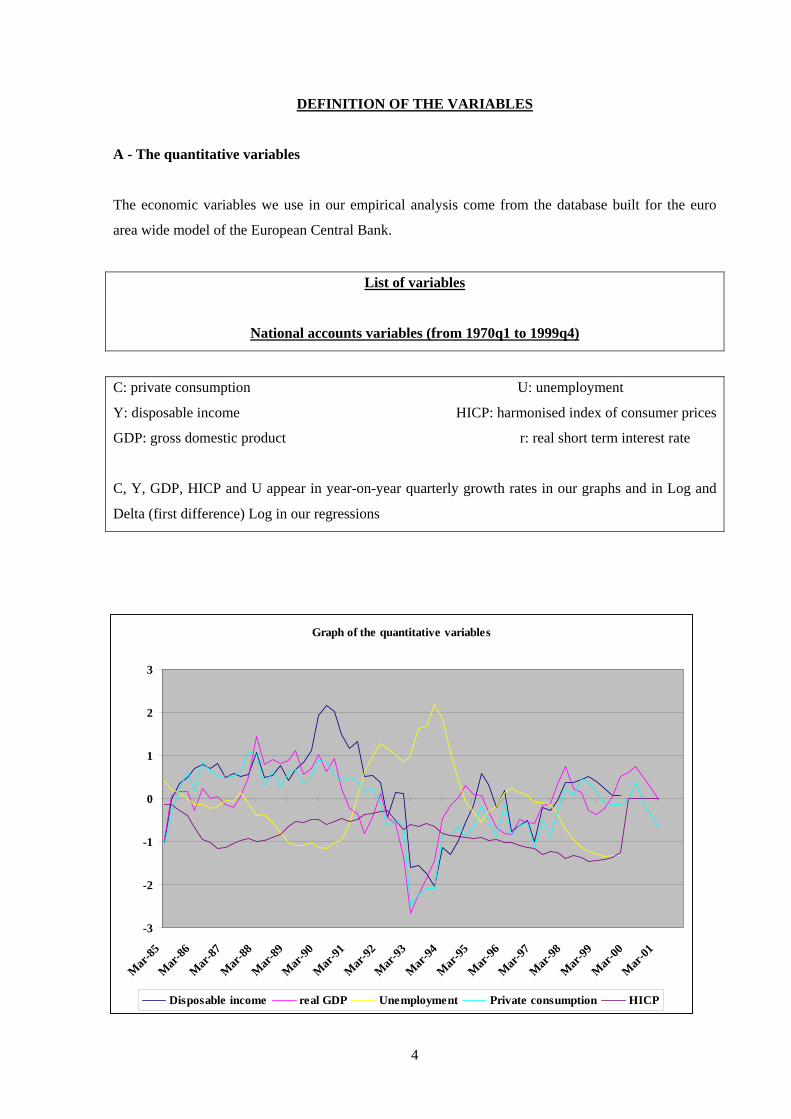
DEFINITION OF THE VARIABLES
A - The quantitative variables
The economic variables we use in our empirical analysis come from the database built for the euro
area wide model of the European Central Bank.
List of variables
National accounts variables (from 1970q1 to 1999q4)
C: private consumption U: unemployment
Y: disposable income HICP: harmonised index of consumer prices
GDP: gross domestic product r: real short term interest rate
C, Y, GDP, HICP and U appear in year-on-year quarterly growth rates in our graphs and in Log and
Delta (first difference) Log in our regressions
Graph of the quantitative variables
-3
-2
-1
0
1
2
3
Mar
-85
Mar
-86
Mar
-87
Mar
-88
Mar
-89
Mar
-90
Mar
-91
Mar
-92
Mar
-93
Mar
-94
Mar
-95
Mar
-96
Mar
-97
Mar
-98
Mar
-99
Mar
-00
Mar
-01
Disposable income real GDP Unemployment Private consumption HICP

5
Unfortunately, no long series measuring consumption of durable goods in the euro area exist. This is
regrettable, since the indexes of consumer confidence were meant to predict consumption of this type
of goods mainly. The rationale is that purchasing of durable goods usually requires more time and
money than spending on non-durable goods and services and would therefore be more closely linked
to confidence. Moreover, the necessary use of an aggregated series for consumption means that it will
have a smaller variance since possibly divergent developments in its components will cancel each
other out (Kumar and al., 1995). Total consumption growth would therefore be closer to a random
walk than consumption of durable goods, therefore potentially harder to forecast. Even working with
total consumption, interesting conclusions can be drawn however.
B – The qualitative variables
The construction of the CCI
Consumer surveys are released on a monthly basis and provide qualitative data. Indeed, they give
directions (improvement, worsening, no change) and not levels. The responses are then balanced and
an index is constructed taking into account the weighted average of five of the survey answers:
concerning the present and expected households’ financial situation, the present and expected
economic situation and the eventuality of major purchases. The selection of these five questions is
based on principal-component analysis. The Commission has released a new CCI in 2001 that focuses
on the four forward-looking questions of the survey concerning financial, economic, saving and
unemployment situation. “A rise in the confidence indicator implies an improvement in the
expectations of future personal and general situation and/or a decrease in the degree of consumers’
subjective uncertainty, which should induce an increase in consumption” (Parigi and Schlitzer, 1995).
Confidence indicator, although bounded by construction, displays a trend over our sample (confirmed
by a DF/DFA unit root test).

6
The old CCI is an arithmetic average of the 5 following questions:
We present on the graph below the indicator with its five components showing their close pattern
Q1: How does the financial situation of your household now compare with what it was 12 months
ago?
Q2: How do you think the financial position of your household will change over the next 12 months?
Q3: How do you think the general economic situation in this country has changed over the last 12
months?
Q4: How do you think the general economic situation in this country will develop over the next 12
months?
Q8: Do you think that there is an advantage for people to make major purchases at the present time?
The old CCI and its components
-2.5
-2
-1.5
-1
-0.5
0
0.5
1
1.5
2
Mar-85
Mar-86
Mar-87
Mar-88
Mar-89
Mar-90
Mar-91
Mar-92
Mar-93
Mar-94
Mar-95
Mar-96
Mar-97
Mar-98
Mar-99
Mar-00
Mar-01
Financial situation last 12 months Financial situation next 12 months Economic situation last 12 monthsEconomic situation next 12 months Old CCI Major purchases now

7
The new CCI is an arithmetic average of the 4 following questions:
We present on the graph below the indicator with its four components showing their close pattern
Q2: How do you think the financial position of your household will change over the next 12 months?
Q4: How do you think the general economic situation in this country will develop over the next 12
months?
Q7: How do you think the level of unemployment in the country will change over the next 12 months?
Q11: Over the next 12 months, how likely are you going to be able to save any money?
The new CCI and its components
-3
-2.5
-2
-1.5
-1
-0.5
0
0.5
1
1.5
2
2.5
Mar-
85M
ar-86
Mar-
87M
ar-88
Mar-
89M
ar-90
Mar-
91M
ar-92
Mar-
93M
ar-94
Mar-
95M
ar-96
Mar-
97M
ar-98
Mar-
99M
ar-00
Mar-
01
Financial situation next 12 months Economic situation next 12 months Unemployment next 12 monthsNew CCI Saving next 12 months

8
The other questions of the consumer survey
We present on the graph below the other survey results
Q5: Compared with what it was 12 months ago, do you think the cost of living is now?
Q6: By comparison with what is happening now, do you think that in the next 12 months (prices in the
future)?
Q9: Over the next 12 months, how do you think the amount of money you will spend on major
purchases will compare with what you spent over the last 12 months? Will it be?
Q10: In view of the general economic situation, do you think this is (saving now)?
Consumption and the other questions
-7
-6
-5
-4
-3
-2
-1
0
1
2
3
Mar-85
Mar-86
Mar-87
Mar-88
Mar-89
Mar-90
Mar-91
Mar-92
Mar-93
Mar-94
Mar-95
Mar-96
Mar-97
Mar-98
Mar-99
Mar-00
Mar-01
Private consumption Saving now Major purchases next 12 monthsPrices last 12 months Prices next 12 months
9
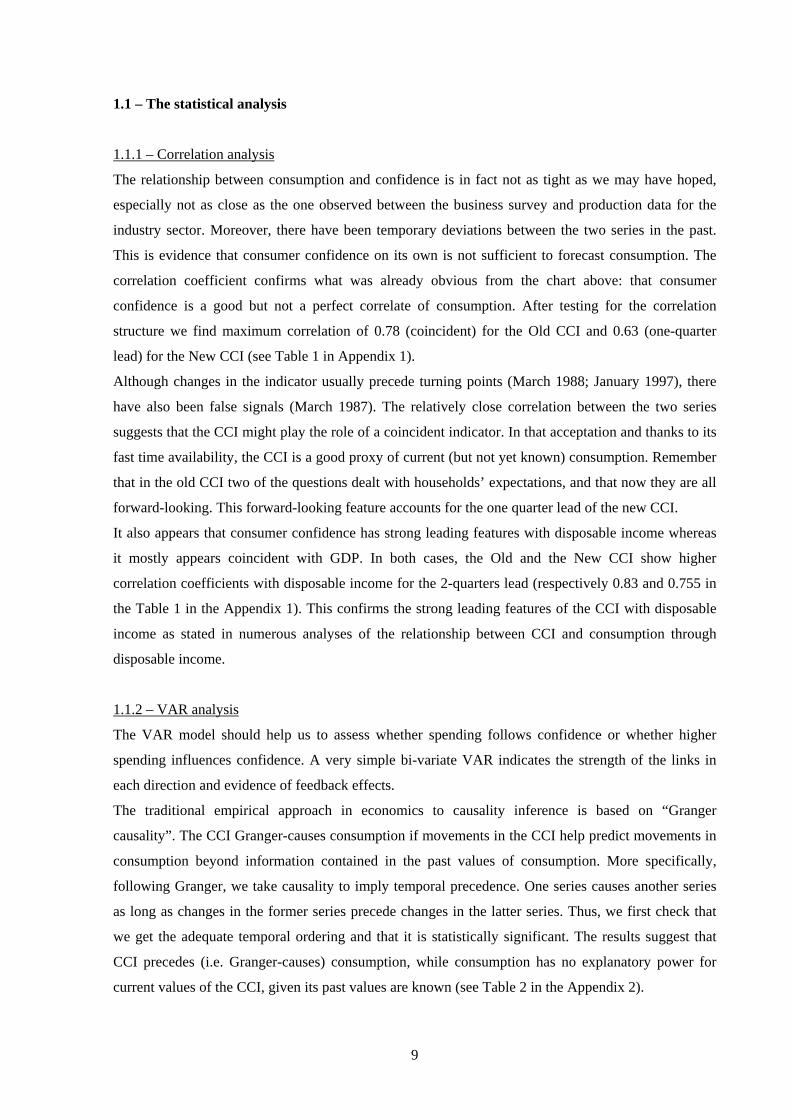
1.1 – The statistical analysis
1.1.1 – Correlation analysis
The relationship between consumption and confidence is in fact not as tight as we may have hoped,
especially not as close as the one observed between the business survey and production data for the
industry sector. Moreover, there have been temporary deviations between the two series in the past.
This is evidence that consumer confidence on its own is not sufficient to forecast consumption. The
correlation coefficient confirms what was already obvious from the chart above: that consumer
confidence is a good but not a perfect correlate of consumption. After testing for the correlation
structure we find maximum correlation of 0.78 (coincident) for the Old CCI and 0.63 (one-quarter
lead) for the New CCI (see Table 1 in Appendix 1).
Although changes in the indicator usually precede turning points (March 1988; January 1997), there
have also been false signals (March 1987). The relatively close correlation between the two series
suggests that the CCI might play the role of a coincident indicator. In that acceptation and thanks to its
fast time availability, the CCI is a good proxy of current (but not yet known) consumption. Remember
that in the old CCI two of the questions dealt with households’ expectations, and that now they are all
forward-looking. This forward-looking feature accounts for the one quarter lead of the new CCI.
It also appears that consumer confidence has strong leading features with disposable income whereas
it mostly appears coincident with GDP. In both cases, the Old and the New CCI show higher
correlation coefficients with disposable income for the 2-quarters lead (respectively 0.83 and 0.755 in
the Table 1 in the Appendix 1). This confirms the strong leading features of the CCI with disposable
income as stated in numerous analyses of the relationship between CCI and consumption through
disposable income.
1.1.2 – VAR analysis
The VAR model should help us to assess whether spending follows confidence or whether higher
spending influences confidence. A very simple bi-variate VAR indicates the strength of the links in
each direction and evidence of feedback effects.
The traditional empirical approach in economics to causality inference is based on “Granger
causality”. The CCI Granger-causes consumption if movements in the CCI help predict movements in
consumption beyond information contained in the past values of consumption. More specifically,
following Granger, we take causality to imply temporal precedence. One series causes another series
as long as changes in the former series precede changes in the latter series. Thus, we first check that
we get the adequate temporal ordering and that it is statistically significant. The results suggest that
CCI precedes (i.e. Granger-causes) consumption, while consumption has no explanatory power for
current values of the CCI, given its past values are known (see Table 2 in the Appendix 2).

10
Of course, this information is far from answering our more ambitious question about the eventual
forecasting and explicative power of the CCI. In order to disentangle these two possibilities, we would
have to estimate different models that include not only consumption spending and consumer
confidence, but also other macroeconomic variables. Bi-variate estimates are by definition unable to
take into account the eventuality of a third variable affecting both consumer confidence and
consumption spending.
1.2 – The econometric analysis
It is proposed to test whether consumer confidence can help forecast the changes in consumption even
after controlling for a broad set of macroeconomic variables. To do so, we use a two-step approach.
We first consider a baseline forecasting equation for consumption growth without the series for the
CCI. In a second step, we add the CCI to the baseline equation building an augmented form in order to
check if the CCI improves the forecasting power of the model (all the detailed results are presented in
the appendices).
1.2.1 – The baseline forecasting equation of consumption
In the baseline regressions, we consider a number of traditional macroeconomic variables known for
their ability to help forecast consumption growth. We have followed, at each step, a general to specific
approach starting with a model including all variables and then progressively eliminating non-
significant ones and non-significant lags based on F and t-tests.
• a) The use of the REPIH model (cf. Euler approach)
The consumption model relates consumption spending to current and lagged traditional
macroeconomic determinants of consumption. Following the existing literature, we include a measure
of current and lagged income (Flavin, 1981). At this stage, we need to make one remark. Although
lagged confidence is absent from this specification, it can still have an indirect impact on
consumption. The Campbell-Mankiw version of the REPIH does not reject the forecasting ability of
confidence to predict consumption, at least at one condition. The condition is that the predictive power
of lagged confidence for current consumption simply reflects the predictive ability of lagged
confidence for current growth in income. We should also notice that lagged wealth is missing since it
was not significant. As evidenced in several studies, its presence in short-term forecasting models is
not necessary.
The role of inflation on consumption is not clear-cut. If consumers wish to keep a constant amount of
assets relatively to their income, then higher inflation will lead them to save more and consume less.
The uncertainty related to price increases would also encourage that movement towards more saving.

11
Alternatively, if as a consequence of rising inflation or expected higher inflation, real interest rates
decrease, consumers may increase their consumption.
It appears that in the long run there is a constant ratio between consumption and income, since the
coefficients on the lagged levels terms are equal in magnitude but opposite in sign. We tested for it
(Wald test) and thus impose the unit elasticity restriction on the long-term equilibrium between
consumption and income. The equations appear in their error correction form. We can then separate
between the long run relationship and the short run dynamics. The short run relationships are captured
by the terms in first differences while the long run relationships are captured by the terms in levels.
• b) The use of the solved-out consumption function (Muellbauer/Lattimore approach)
According to Berg and Bergstrom (1996), the main distinction between the Euler equation and the
solved-out consumption equation lies in the role of uncertainty that allows precautionary savings.
Uncertainty can be proxied by financial variables that would represent the discount rates applied by
households to future income. An increase in uncertainty should lead to a higher discount rate on future
income, thereby increasing the importance of current income relatively to forthcoming or permanent
income.
The solved-out consumption function aimed at improving the Euler approach in different ways (c.f.
Muellbauer and Lattimore, 1994). These authors used an error correction model in order to take into
account of the long-term determinants of consumption and, in the short-term part of the equation, a
measure of uncertainty based on data on liquidity constraints, proxied by data on indebtedness. The
change in unemployment and the change in inflation could also play a role as uncertainty factors. The
latter is of specific value since the potential impact of inflation on the real value of households’
financial assets might modify the behaviour of the consumers. Thus, inflation might also be a measure
of income uncertainty (see also Part II, Part A, Section 1 for the role of unemployment and inflation in
affecting consumer confidence). This is the approach that we will follow here because of the lack of
series on households’ debts.
As proposed by Throop (1992), a nominal interest rate, rather than the real one, better reflects the
liquidity constraints faced by the consumer. In fact, it appears that both the real short-term interest rate
and the harmonised index of consumer prices (HICP) are significant. So, a measure combining both
(the nominal interest rate) provides an interesting insight into the effect of the financial sector and its
monetary component on private consumption. We might also think of consumer confidence as the
variable that best measures this uncertainty. This is what our solved-out consumption function tries to
assess in integrating financial variables as proxy for uncertainty other than the CCI (and then, in the
following section, the CCI in the confidence-augmented equation).
Augmented consumption function with financial data:

12
∆ log (Ct) = 0.04 + 0.6 ∆ log (Yt) – 0.16 ∆ log (Ct-1) – 0.013 [ log (Ct-1) - log (Yt-1) ] – 0.012 i t-2 (7)
Augmented consumption function with financial and unemployment (U) data:
∆ log (Ct) = 0.04 – 0.17 ∆ log (Ct-1) + 0.62 ∆ log (Yt) – 0.02 ∆ log (Ut) – 0.09 [ log (Ct-1) - log (Yt-1) ]
– 0.02 rt-1 (8)
These two equations perform well (see Appendix 2, equations 7 and 8). The last one, thanks to its
better performance as forecaster, will be our benchmark equation. Its better results obviously stem
from its ability to capture uncertainty thanks to unemployment.
1.2.2 – The confidence-augmented forecasting equation of consumption
Our alternative to the previous specification is the direct introduction of lagged sentiment as an
independent explicative variable of current consumption over its predictive power for income. Our
results, in line with the most recent studies, lead to the rejection of both the traditional REPIH and the
revised version of Campbell-Mankiw, since confidence contains an independent predictive and
explicative power for consumption.
• a) The statistical and economic significance of the predictive power of the CCI
One way to assess the quantitative influence of the CCI is to compare the coefficients of correlation
between the baseline and augmented equations. If the augmented version shows a higher coefficient of
correlation, then we might say that this equation predicts more of the variation in the forthcoming
quarter’s consumption than the baseline equation. Not only does the CCI replace financial (HICP and
real interest rates) and macroeconomic (GDP growth) variables but it also brings additional
information as suggested by a higher coefficient obtained on normalised data, lower standard error of
regression, higher R2.
Consumer confidence may thus be a proxy for uncertainty. In that case, a measure of precautionary
saving might show a high correlation with consumption (much as consumer confidence does).
According to Caroll and al. (1994), an increase in uncertainty will force consumption to decline as
consumers rebuild their stock of assets. However Caroll and al. go further (too far in our view) when
they consider that, while the level of consumption will stay lower than before the rise in uncertainty,
its growth rate will increase as the urge to build stocks of assets fades away. In effect, consumption
will be positively correlated with lagged uncertainty (or lagged confidence indicator) and negatively
correlated with current uncertainty (or current confidence). So, a high indicator should reflect low
uncertainty and then implying that lagged confidence be negatively correlated with consumption.
However, we observe the contrary, since lagged confidence is correlated positively (and we may add
logically) with consumption.

13
An ECM was used to investigate the relationship between consumer spending and consumer
confidence. In equilibrium, consumer spending depends on both the ability [as measured by disposable
income and partly consumer confidence] and the willingness [measured by consumer confidence] to
buy. Consumption theory teaches us that households must act on their expectations. These
expectations in turn are the device through which macro uncertainties affect behaviour. These
expectations measure then the macroeconomic risk based on the reported unemployment and CCI. The
expected probability of the occurrence of the contingency depends then on unemployment and CCI.
Our equation provides evidence that consumer expectations are formed from data of the previous
quarters (lagged unemployment and CCI) and from data from the current period. Both the changes in
the CCI and its lagged level are statistically and economically significant and meaningful. The
presence of the short lags on unemployment and CCI expresses the gradual formation of consumer
expectations. Our empirical results show that this formation process last a couple of quarters. We can
also see the presence of the lags of unemployment and CCI as the sums of coefficients on lagged
variables. This learning process by which consumers build their expectations provide, when added to
their capacity to suddenly change their purchasing behaviour, a good explanation of the volatility of
consumption. Consumer confidence and unemployment describe thus the degree of uncertainty and
the way that this uncertainty affects spending. The reduction in the standard error of the regression
equation achieved when including the CCI is substantial (see Appendix 2, equation 9).
In the short and long run, consumption is a function of disposable income (ability to buy),
unemployment and consumer confidence (willingness to buy).
∆ log (Ct) = 0.04 – 0.23 ∆ log (Ct-1) + 0.58 ∆ log (Yt) – 0.08 ∆ log (Ut) + 0.05 ∆ CCI OLDt – 0.18 [ log
(C t-1) - log (Yt-1)] + 0.12 log (Ut-1) – 0.1 log (Ut-2) + 0.03 CCI OLDt-2 (9)
The results in terms of test statistics are satisfactory for the specification with the old CCI and they
show that the presence of confidence in a consumption function helps to improve the specification of
the model. However, in the case of the new CCI, the coefficients are not significant. It seems that the
presence of unemployment in the equation captures much of the content of the new CCI. We have
already seen that over our sample, the new CCI does not perform as well as the old one in terms of
correlation coefficient. Using another sample could modify the predictive power of the new CCI.
According to the European Commission, the new CCI displays better results when used over the
1990’s.
• b – The forecasting exercise
14
The above results indicate that the CCI may contain valuable information for forecasts of
consumption. This hypothesis can be more thoroughly assessed by means of out-of-sample forecasts.
We use recursive regressions to re-estimate the model, adding one quarter at a time and calculating a
series of one-step-ahead forecasts. The different models are evaluated by computing the root-mean-
squared error from the set of one-step-ahead forecasts. We also performed dynamic forecasts. By
comparing the root-mean-squared errors of the two models – baseline and augmented – we can
compare the forecasting accuracy of the model with and without the CCI. The first 10 years are used to
estimate the ECM parameters and the following 5 years are used as the out of sample test period. In
both the static and dynamic cases, the root mean squared errors are smaller in the equation using the
CCI, implying that the CCI has a good independent ability to forecast consumption (see Appendix 2,
equation 9).
Conclusion Part I
Thus, the first contribution of this part is a theoretical and empirical demonstration that consumer
confidence represents an important independent factor in explaining consumption spending. Consumer
confidence reflects not only changes in income but also changes in the general situation (both
economic and political). In that case, consumer confidence is very difficult to predict, since some
unpredicted exogenous events (recorded by the CCI) may shift consumer behaviour without being
previously noticed by economic data (Mueller, 1963).

15
Part II – What explains the CCI and the temporary divergences between the CCI and
consumption?
This part addresses the issue of the determinants of consumer confidence and of the lack of correlation
between consumer confidence and consumption growth in particular periods. We have seen in the
previous part that confidence contains specific information absent from the macroeconomic data?
However, we had not study thoroughly what the determinants of confidence where. We look here
more closely into the determinants of confidence. If consumer confidence can be explained by
standard economic variables, then its role as predictor of consumption is limited, since by relying
simply upon these standard data, we could as well predict consumption. The value of the CCI would
then only lies in its early availability. Conversely, if consumer confidence is only partly explained by
macroeconomic data, then it keeps its specificity and predictive or causal power.
2.1 – Which are the determinants of the CCI?
Our main assumption in looking for explicative variables is that if (as for more traditional economic
variables) consumer expectations are not unique occurrences with unique causations, then we might be
able to find a systematic relationship between confidence and a set of explicative variables. The
selection of explicative variables of the CCI can follow two parallel routes. The structural approach
suggests using variables present in the traditional consumption function whereas the reduced form
approach proposes using only exogenous variables. A common approach is followed here where the
chosen variables are both present and absent from the traditional consumption function. By measuring
the impact of objective variables, such as GDP or unemployment, we will be better able to understand
the way households construct their opinions. Moreover, we will see which other variables (subjective)
may help explain their expectations.
Although the CCI may reflect independent information, it may also partly depend on macroeconomic
data. Not only the ones used in the first part to explain consumption but also some others as a “general
to specific” methodology shows. Past values of the CCI, real interest and inflation rates, financial
resources, change in unemployment, all in their current valuation could play a role in explaining the
CCI.
Our model shows that, in the short run, confidence increases as national income rises and
unemployment decreases (inflation and interest rates are rather insignificant in our model). A part of
the variation in confidence can thus be explained by these variables. We then can say that the CCI
partly reflects consumers’ economic knowledge of the current situation. The ECM aims to measure the
long-term relationship (or trend) between confidence and its explicative variables. The presence of the
inflation rate should be straightforward since it affects both income and wealth. However, in periods
of low inflation that variable may lose most of its influence and actually it is non-significant over the
whole sample. Stock prices, as an element of wealth, should play a much smaller role in the euro area

16
than in the US, since share-ownership remains limited to a small proportion of households. Indeed,
and although developments in share prices are extensively publicised, even to households who do not
hold stocks, they are not significant in our model.
The long run determinants of the CCI are lagged values of itself. The lagged values of the CCI aim to
capture two types of persistent factors. First, persistent negative economic conditions will affect
strongly the mood of households and second the more the bad news last, the more households will be
aware of it (Lovell, 1975). Lagged confidence also refers to the adjustment process or social learning
and helps to control for auto-correlation.
Because of the incapacity of economic variables to fully predict the CCI, it can be inferred that other
variables could help explain changes in the CCI. The socio-political environment might play a role.
The consumer confidence decompositions lay indeed emphasis on the strong exogeneity feature of the
CCI. The CCI explains 86 percent of its own innovation variance 10 quarters ahead. Although some
macroeconomic variables do affect the CCI, they can simply explain a minority of the variance of the
CCI. This reinforces the independence of the CCI and underlines its specific predictive and explicative
power.
∆ CCI OLD t = 0.06 ∆ log (GDP t) – 0.08 ∆ log (U t) + 0.4 CCI OLDt-1 – 0.5 CCI OLDt-2 (10)
∆ CCI NEW t = - 0.12 ∆ log (U t) + 0.38 CCI NEWt-1 – 0.57 CCI NEWt-2 (10’)
The difference (the drop of GDP as an explanatory variable) between the two CCI stems from the
absence of the question 3 concerning the general economic situation over the last 12 months in the
new CCI. We have used the previous equation and combine it with the confidence-augmented
consumption function from the previous part to build a short-term forecasting consumption model (c.f.
Appendix 2, equation 10 and Appendix 3), whose results provide a very good fit with the actual data.
2.2 – Which are the variables able to explain the temporary differences between consumer
confidence and consumption?
There are periods of divergence between the CCI and consumption that lead us to wonder whether
they show a real loss of predicting power or simply a longer horizon of forecasting ability because of
special events. For instance peaks in spending not coinciding with peaks in confidence. Obviously, it
is always possible that the respondents do not always act as implied by the answers in a survey. A
second reason might be that the survey questions are not directly related to actual consumption but
describe the environment for consumption. This might be also a difference with the business surveys
where the answers appear to be more closely related to underlying actual production variables.

17
A third reason might be that the indicator performs differently in different periods displaying some
asymmetry. For instance, in a weak economic situation, changes in consumer confidence might have a
stronger impact on consumer spending than in a fast growing situation. [In the Annex 1 we display
graphs and correlation matrices in order to assess the closeness and consistency between the survey
questions and their underlying variable and the consistency within the consumer survey responses].
We first present the sub-sample periods when the CCI and consumption exhibited divergence before
presenting the reasons of these temporary discrepancies.
2.2.1 - Selection of the sub-samples that reveal the divergence
• a - Category 1: 1st and 3rd periods (1986q4 – 1987q4; 1995q3 – 1996q1)
These two periods are characterised by the increase in consumption and decrease in confidence. The
quantitative data show an increase in disposable income (similar as in the case of consumption), but
also a rise in unemployment and inflation. The qualitative data show pessimistic views for all the
questions, even the ones dealing with personal financial situation. That last observation is surprising
since we would expect the expectations on personal financial situation to correlate with disposable
income and thus show an increasing curve.
• b - Category 2: 2nd and 4th periods (1994q1 – 1995q1; 1998q1 – 1999q1)
These two periods are characterised by the relative flatness of consumption whilst confidence
continues to increase. The quantitative data show a similar pattern for disposable income as for
consumption and a sharp decrease in unemployment and in prices. The qualitative data all display
optimistic views including the ones reflecting private financial situation. That last observation is again
surprising since we would have thought that expectations on personal financial situation would have
followed the same pattern as disposable income and show a flat curve.
It appears that in the two different categories of periods, the CCI is strongly influenced by all its
components behaving in the same direction. Both the old and new CCI are similarly affected although
the new one seems even more influenced. We do not observe a contradiction within the components
where some would be overly optimistic while others would display more gloomy feelings. So the
answers are consistent within the surveys, but some of them (the ones dealing with personal financial
situation) lose temporarily their usual strong correlation with their underlying variable (the real
disposable income figures).
2.2.2 - Determination of the stylised conditions to explain the divergence

18
We seek to find a set of stylised conditions under which the CCI shows divergence vis-à-vis
consumption. We want indeed to stress the fact that the four periods of divergence occurred in specific
times. They can in fact be analysed around two lines since they are characterised by two different
situations. First, divergence occurs at times of slowing growth (occurring after high growth) and more
precisely at the point where consumption begins to slow and unemployment (and prices) pursue their
decrease whilst consumer confidence continues its sharp increase (Category 2: 2nd and 4th periods).
Second, divergence occurs at times of sudden and temporary sharp growth in consumption with
coincident increase in unemployment while confidence goes down (Category 1: 1st and 3rd periods). In
both cases, the situation of unemployment (and in a less significant way the one for prices) is key,
since it determines the direction taken by the indicator. The results of our regressions (equations 16
and 16’) stressed that very fact. Although unemployment is unable to explain solely the evolution of
the CCI, it helps to figure out the direction of the whole set of components of the survey in specific
periods.
• a - Determinants of consumption
Consumption usually follows disposable income. When consumption failed to follow the pattern
drawn by disposable income such as in the 2nd period (where consumption first increased and then
decreased whereas income grew slightly), it may be explained by a new and temporary repartition
between consumption and saving. The saving ratio during that period followed strictly and negatively
the evolution of consumption. The combination of these two is reflected in the evolution of disposable
income. Moreover, if the decrease in unemployment is mainly due to an increase in part-time work,
this could explain the better mood reflected in the CCI. We know that during the first periods of
accelerating growth, firms prefer to hire part-time or temporary workers since they are still uncertain
about their future prospects. It may also explain the relative flatness in consumption since these jobs
with relatively low wages might not lead to a rise in consumption equivalent to the previous decrease
in unemployment.
• b - Determinants of confidence
The impact of unemployment (whether the related question appears in the indicator or not) is
straightforward. Its presence in the new CCI simply reinforces the evolution of the indicator in the
same direction as unemployment. We have seen in the regressions that the main determinant of the
new CCI in the short run is unemployment. However, the old CCI is supposed to be partly explained
by unemployment and GDP. Whereas in normal times, GDP has the biggest short-term impact on
confidence, it seems that in periods of sharp rise in unemployment, it loses part of its explanatory
power in favour of unemployment.

19
It also seems that the CCI used to “overshoot” consumption in periods of strong growth (2nd category)
(when growth is accompanied by a strong decrease in unemployment and (in a less obvious manner) in
prices). However, since the perspective about unemployment keeps being good, there is no reason why
people should react and answer the surveys in a sudden pessimistic way. This is consistent with the
time lag we observe for each of these periods between consumption slowing down and unemployment
increasing but after a few quarters only. This time lag of 2-3 quarters is also observed between
national income growth and unemployment growth. This time lag appears to be slightly longer in the
sub-periods we have selected. The divergence leads then to the appearance of a gap between the series,
in the same way as between consumption and confidence. In these conditions, we ought to determine
which other components not currently in the CCI may have been better at predicting the point where
consumption began to “escape” confidence.
2.2.3 - Utilisation of other surveys to correct the divergence
As in Bram and Ludvigson (1998), in order to get rid off the temporary discrepancy we check the
predictive power of each question on the selected sub-sample. Indeed, we want here to enquire
whether the presence of other survey questions would have avoided this discrepancy. It appears that
some survey questions have sometimes more predictive power than other ones since a usual good
predictor (expectations about the financial situation) suddenly lost its grip. For each of the sub-periods
displaying the divergence, the discrepancy could have been corrected or at least diminished by taking
into account three questions that do not appear in the current CCI (major purchases now/next 12
months and saving now). Both questions going of course in opposite directions. Although their
correlation with consumption is in the average on the whole sample lower than the one provided by
the other questions, they seem to better perform at times of divergence. At times of confusion due to
contradictory data (income and unemployment situations following opposite patterns), they seem to
better predict consumption thanks apparently to their “durable” features at times of uncertainty.
These temporary divergences are thus due to the divergence between disposable income and
unemployment. It creates a gap between consumption and confidence whose filling requires a
convergence between income and unemployment (usually occurring during the following year).
CONCLUSION
Our paper has used an ECM framework to analyse the origins and consequences of consumer
confidence. It appears that confidence affects consumption in a causal way. Its forecasting power
stems from its ability as measuring uncertainty, rather than just being a mood factor.

20
Usually, the expectations of future economic conditions move in the same direction as the perceptions
of current economic conditions, reducing (although not eliminating) somehow their specific power.
The role of unemployment and inflation, for instance also reveal some predictive power although less
than the indicator. However, the occurrence of a specific event, let it be economic or political, might
be translated into the behaviour of consumers through their consumer confidence. In that case,
expectations might depart from current conditions. In such an event, consumer confidence increases its
forecasting power, better assessing the forthcoming economic situation than the traditional
macroeconomic variables unable to predict sudden events. A forecasting model in that case shows that
the forecasting errors of the CCI decrease. Affected by unusual variables, the CCI would depart from
its traditional determinants and the use of the latter to forecast confidence would then break up.
According to some studies (Howrey, 2001; Souleles, 2001), the indicator is also better at forecasting
turning points. Its impact is in effect stronger in case of extreme conditions.
Moreover, different measures of the CCI would give different results and different forecasts of the
evolution of consumption. For instance a distinction between high and low income households should
bring a better assessment not only of the direction but also the level of future spending. Another issue
relates to the nature of the data used in our regressions. Whereas the households use real-time data to
make their responses, we used revised data to make our regressions. Moreover, as in the BUSY model
of the European Commission, the adding of the survey on retail could allow us to better take into
account the non-durable part in the consumption function. This provides another use for survey results.
Finally, we have made clear that confidence indicators are a synthesis of economic and non-economic
factors. We expect consumer confidence to have an independent power of its own in explaining
consumption. In effect, in the US, consumer confidence did not fully follow the evolution of
unemployment or inflation while still pursuing its high correlation with private consumption. It
provides then evidence that although consumer confidence is related to these two variables, it still has
an idiosyncratic component, strong enough to make confidence deviate from unemployment or
inflation. It hence contains extra additional power reinforced by its timely availability as leading,
forecasting and causing factor of consumption. An interesting question in terms of monetary strategy
would be to analyse the impact of monetary and fiscal policy on consumer confidence. If such a
relationship exists then economic policy could affect consumption (and thus GDP) through its impact
on confidence.
References Berg, L. and Bergstrom, R. (1996), “Consumer confidence and consumption in Sweden,” Uppsala universitat / Working paper N. 7, p. 2-30. Bram, J. and Ludvigson, S. (1998), “Does consumer confidence forecast household expenditure? A sentiment index horse race,” Economic policy review (Federal Reserve Bank of New York), Vol. 4, N. 2, p.59-78.

21
Campbell, J. and Mankiw, N. G. (1991), “The response of consumption to income. A cross-country investigation,” European Economic Review, vol. 35. Carroll, C. D., Fuhrer, J. C. and Wilcox, D. W. (1994), “Does consumer sentiment forecast household spending? If so, why?,” American economic review, Volume 85, N. 5, p. 1397-1408. Dion, D-P. (2006), “Does consumer confidence forecast household spending?”, mimeo. --- and Kolodjiezak, A. (2001), “The BUSY modelling project and the construction of the BUSY III macro-econometric model: Towards a powerful short-term forecasting tool on the basis of survey data”, European Commission – Economic Paper. Flavin, M. (1981), “ The adjustment of consumption to changing expectations about future income,” Journal of political economy, N. 89, p. 974-1009. Howrey, E. P. (2001), “The predictive power of the index of consumer sentiment,” Brookings Papers on Economic Activity, Vol. 1, p. 175-216. Katona, G. (1975), Psychological Economics, New York, Elsevier.
--- (1960), The powerful consumer: Psychological studies of American economy, McGraw Hill, New
York.
--- (1951), Psychological analysis of economic behaviour, McGraw Hill, New York. Keynes, J. M. (1936), The general theory of employment, interest, and money, New York, N. Y. Harcourt Brace Jovanovich. Kumar, V., Leone, R. P. and Gaskins, J. N. (1995), “Aggregate and disaggregate sector forecasting using consumer confidence measures,” International journal of forecasting, Vol. 11, N. 3, p. 361-77. Lovell, M. C. (1975), “Why was the consumer feeling so bad?,” Brookings Papers on Economic Activity, N. 2, p. 473-79. Muellbauer, J. and Lattimore, R. (1995), “The consumption function: A theoretical and empirical overview,” in Handbook of Applied Econometrics: Macroeconomics, edited by M. H. Pesaran and M. R. Wickens, p. 221-311. Oxford: Blackwell. Mueller, E. (1963), “Ten years of consumer attitude surveys: Their forecasting record,” Journal of the American statistical association, Vol. 58, p. 899-917. Parigi, G. and Schlitzer, G. (1995), “Quarterly forecasts of the Italian business cycle by means of monthly economic indicator,” Journal of forecasting, N. 14, p. 117-41. Souleles, N. (2001), “Consumer sentiment: Its rationality and usefulness in forecasting expenditure – Evidence from the Michigan Micro Data,” NBER Working Paper 8410. Throop, A. W. (1992), “Consumer sentiment: its causes and effects,” Economic review (Federal Reserve Bank of San Francisco), N. 1, p. 35-59.