Munich Personal RePEc Archive - uni-muenchen.de 3 5 $ Munich Personal RePEc Archive A Comparative...
25
Munich Personal RePEc Archive A Comparative Study On Financial Performance Of Public Sector Banks In India: An Analysis On Camel Model Kishore Meghani Kishore Meghani and Hari Krishna Karri Hari Krishna Karri and Bharti Meghani Mishra Bharti Meghani Mishra 5 March 2015 Online at https://mpra.ub.uni-muenchen.de/62844/ MPRA Paper No. 62844, posted 17 March 2015 13:21 UTC
-
Upload
duongkhanh -
Category
Documents
-
view
216 -
download
0
Transcript of Munich Personal RePEc Archive - uni-muenchen.de 3 5 $ Munich Personal RePEc Archive A Comparative...

MPRAMunich Personal RePEc Archive
A Comparative Study On FinancialPerformance Of Public Sector Banks InIndia: An Analysis On Camel Model
Kishore Meghani Kishore Meghani and Hari Krishna Karri
Hari Krishna Karri and Bharti Meghani Mishra Bharti
Meghani Mishra
5 March 2015
Online at https://mpra.ub.uni-muenchen.de/62844/MPRA Paper No. 62844, posted 17 March 2015 13:21 UTC
A COMPARATIVE STUDY ON FINANCIAL PERFORMANCE OF
PUBLIC SECTOR BANKS IN INDIA: AN ANALYSIS ON CAMEL
MODEL.
Hari Krishna Karri
Research Scholor
Jawaharlal Nehru Technological University, Hyderabad
Lecturer, Business Studies Department
Higher College of Technology, Muscat, Oman
Kishore Meghani
Research Scholar
Galgotia Institute of Mgt & Tech, Greater Noida
Bharti Meghani Mishra
Research Scholar
MohanLal Sukhadia University,Udaipur
Abstract:
Banking sector is one of the fastest growing sectors in India. Today’s banking
sector becoming more complex. The objective of this study is to analyze the
Financial Position and Performance of the Bank of Baroda and Punjab National
Bank in India based on their financial characteristics. This study attempts to
measure the relative performance of Indian banks. For this study, we have used
public sector banks. We know that in the service sector, it is difficult to quantify
the output because it is intangible. We have chosen the CAMEL model and t-
test which measures the performance of bank from each of the important
parameter like capital adequacy, asset quality, management efficiency, earning
quality, liquidity and Sensitivity.
Keywords: CAMELS Model, Bank of Baroda, Punjab National Bank, Financial
performance
INTRODUCTION
As soon the bottom lines of Domestic Banks come under increasing pressure
and the options for organic growth exhaust themselves, Indian Banks will
need to explore ways for inorganic expansion. This, in turn, is likely to
unleash the forces of consolidation in Indian banking.
C. Rangarajan
EX-Chairman of Economic Advisory Council of the Prime Minister
Banks are playing crucial and significant role in the economy in capital
formation due to the inherent nature, therefore banks should be given more
attention than any other type of economic unit in an economy. CAMEL
approach is significant tool to assess the relative financial strength of a bank and
to suggest necessary measures to improve weaknesses of a bank. In India, RBI
adopted this approach in 1996 followed on the recommendations of
Padmanabham Working Group (1995) committee. The Reserve Bank of India
has taken several measures since Independence to improve access to affordable
financial services through financial education, leveraging technology, and
generating awareness. The banking sectors performance is perceived as
economic activities of an economy. The banking sector reforms were aimed at
making banks more efficient and viable as one who had a role initiating these
reforms
These Public Sector banks penetrate every corner of the country and have been
extending a helping hand in the growth of the economy.
LITERATURE REVIEW
Literature review is a study involving a collection of literatures in the selected
area of research in which the scholar has limited experience. In the past, various
studies relating to the financial performance of banks have been conducted by
researchers.
A study conducted by Barr et al. (2002) viewed that “CAMEL rating criteria
has become a concise and indispensable tool for examiners and regulators”.
This rating criterion ensures a bank’s healthy conditions by reviewing different
aspects of a bank based on variety of information sources such as financial
statement, funding sources, macroeconomic data, budget and cash flow.
Said and Saucier (2003) examined the liquidity, solvency and efficiency of
Japanese Banks using CAMEL rating methodology, for a representative sample
of Japanese banks for the period 1993- 1999, they evaluated capital adequacy,
assets and management quality, earnings ability and liquidity position.
Prasuna (2003) analyzed the performance of Indian banks by adopting the
CAMEL Model. The performance of 65 banks was studied for the period 2003-
04. The author concluded that the competition was tough and consumers
benefited from better services quality, innovative products and better bargains.
Nurazi and Evans (2005) investigated whether CAMEL(S) ratios could be
used to predict bank failure. The results suggested that adequacy ratio, assets
quality, management, earnings, liquidity and bank size are statistically
significant in explaining bank failure.
Bhayani (2006) analyzed the performance of new private sector banks through
the help of the CAMEL model. Four leading private sector banks – Industrial
Credit & Investment Corporation of India, Housing Development Finance
Corporation, Unit Trust of India and Industrial Development Bank of India -
had been taken as a sample.
Gupta and Kaur (2008) conducted the study with the main objective to assess
the performance of Indian Private Sector Banks on the basis of Camel Model
and gave rating to top five and bottom five banks. They ranked 20 old and 10
new private sector banks on the basis of CAMEL model. They considered the
financial data for the period of five years i.e., from 2003-07.
R.C.Dangwal and Reetu Kapoor (2010) conducted a study on financial
performance of commercial banks. In this study they compared financial
performance of 19 commercial banks with respect to eight parameters and they
classified the banks as excellent, good, fair and poor categories.
K.V.N.Prasad and Dr.A.A.Chari (2011) conducted a study to evaluate
financial performance of public and private sector banks in India. In this study
they compared financial performance of top four banks in India viz., SBI, PNB,
ICICI and HDFC and concluded that on overall basis HDFC rated top most
position.
Dr.D.Maheshwara Reddyand K.V.N. Prasad (2011) conducted a study to
evaluate performance of regional rural banks:An Application of Camel model.
Dr.K.Srinivas and L.Saroja (2013) conducted a study to compare the financial
performance of HDFC Bank and ICICI Bank. From the study it is clear that
there is no significance difference between the ICICI and HDFC bank’s
financial performance but we conclude that the ICICI bank performance is
slightly less compared with HDFC.
Deepti Tripathi and Kishore Meghani (2014) conducted a study to compare the financial performance of Axis and Kotak Mahindra bank (Private Sector banks). The CAMELS’ analysis and t-test concludes that there is no significance difference between the Axis and Kotak Mahindra bank’s financial performance but the Kotak Mahindra bank performance is slightly less compared with Axis Bank.

OBJECTIVES
1) To Analyze and compare the Financial Position and Performance of the
Public sector Banks by Applying CAMEL Modal.
2) To give recommendation and suggestion for improvement of efficiency in
Bank of Baroda and Punjab National Bank.
METHODOLOGY
Sources of Data:
The study is based on secondary data. The data were collected from the official
directory, Indian Banking Association, RBI Bulletins, Dion Global Solutions
Limited and data base of Centre for Monitoring Indian Economy ( CMIE )
namely PROWESS. The Published Annual Reports of Bank of Baroda and
Punjab National Bank taken from their websites, Magzines and Journals on
finance have also been used a sources of data
To evaluate the comparative financial performance of Bank of Baroda and
Punjab National Bank, the study adopted the world-renowned: Capital
Adequacy, Asset Quality, Management, Earning Quality and Liquidity
(CAMEL) model (with minor modification) with the statistical tools used are
arithmetic mean, t-test using SPSS 19
Period of Study:
The study covers a period of Five year from 2010-2014.
Sampling:
Two leading public sector banks- Bank of Baroda and Punjab National Bank-
had been taken as a sample.
Hypothesis:
From the above objectives of the following hypothesis is formulated to test the
financial performance and efficiency of the Bank of Baroda and Punjab
National Bank.

H0: There is no significant difference between financial position and
performance of Bank of Baroda and Punjab National Bank.
Research Modal:
FIGURE1: RESEARCH MODEL BASED ON THE ARTICLE
PRESENTED BY PROFESSOR SANGMI AND DOCTOR NAZIR (2011),
CAMER MAGAZINE
I. CAPITAL ADEQUECY:
Capital Adequacy indicates whether the bank has enough capital to absorb
unexpected losses. It is required to maintain depositors’ confidence and
preventing the bank from going bankrupt. It is important for a bank to maintain
depositors’ confidence and preventing the bank from going bankrupt. It reflects
the overall financial condition of banks and also the ability of management to
meet the need of additional capital.
The following ratios measure capital adequacy:
1. Capital Adequacy Ratio (CAR):
Capital adequacy ratio is defined as:
CAR = (Tier 1 Capital + Tier 2 Capital) / Risk weighted Assets
TIER 1 CAPITAL - (paid up capital + statutory reserves + disclosed free
reserves) - (equity investments in subsidiary + intangible assets + current and
b/f losses)

TIER 2 CAPITAL – i. Undisclosed Reserves, ii. General Loss reserves, iii.
hybrid debt capital instruments and subordinated debts where risk can either be
weighted assets (a) or the respective national regulator's minimum total capital
requirement.
If using risk weighted assets,
CAR = [(T1 + T2) / a] _ 10%
percent threshold varies from bank to bank (10% in this case, a common
requirement for regulators conforming to the basel accords) is set by the
national banking regulator of different countries. But As per the latest RBI
norms, the banks should have a CAR of 9 per cent.
TABLE – 1 CAPITAL ADEQUACY RATIO
Group Statistics
BANKS N Mean Std. Deviation Std. Error Mean
CAPITAL_ADEQUACY_RATIO BOB 5 13.8260 1.01808 .45530
PNB 5 12.8440 .75494 .33762
Independent Samples Test
Levene's Test for
Equality of
Variances t-test for Equality of Means
F Sig. t Df
Sig. (2-
tailed)
Mean
Differenc
e
Std.
Error
Differenc
e
95% Confidence
Interval of the
Difference
Lower Upper
CAPITAL_ADE
QUACY_RATIO
Equal variances
assumed 1.139 .317 1.732 8 .121 .98200 .56682 -.32508 2.28908
Equal variances
not assumed
1.732 7.378 .125 .98200 .56682 -.34453 2.30853
*Findings: The Significant p value is 0.317 ≥ 0.05 than equal variance assumed
is 0.121 ≥ 0.05 than hypothesis is accepted.

2. Debt Equity Ratio
This ratio thus indicates the bank‘s financial leverage. In the case of
manufacturing sector the ideal ratio is 2:1. However, in the case of
commercial banks, there is no standard norm for debt – equity ratio this
ratio indicates how much of the bank business is financed through debt
and how much through equity. It is the proportion of total outside liability
to net worth. Higher ratio indicates less protection for the creditors and
depositors in the banking system. This ratio indicates the degree of
leverage of a bank.
1. TABLE – 2 Debt Equity Ratio
Group Statistics
BANKS N Mean Std. Deviation Std. Error Mean
DEBT_EQUITY_RATIO BOB 5 .0500 .01871 .00837
PNB 5 .0600 .01414 .00632
Independent Samples Test
Levene's Test for
Equality of
Variances t-test for Equality of Means
F Sig. t df
Sig. (2-
tailed)
Mean
Differenc
e
Std.
Error
Differenc
e
95% Confidence
Interval of the
Difference
Lower Upper
DEBT_EQUIT
Y_RATIO
Equal variances
assumed 1.600 .242 -.953 8 .368 -.01000 .01049 -.03419 .01419
Equal variances
not assumed
-.953 7.446 .370 -.01000 .01049 -.03450 .01450
*Findings: The Significant p value is 0.242 ≥ 0.05 than equal variance assumed
is 0.368 ≥ 0.05 than hypothesis is accepted.

II. Asset Quality:
This indicates what types of advances the bank has made to generate interest
income. When loans are given to highly rated companies, the rates attracted are
lower than that of lower rated doubtful companies. Thus asset quality indicates
the type of debtors of the bank. Banks determine how many of their assets are
at financial risk and how much allowance for potential losses they must make.
1. Total Assets Turnover Ratio:
This ratio measures the efficiency in utilization of the assets. It is arrived at by
dividing sales by total assets. Total Assets Turnover Ratio=Sales/Total Assets
TABLE – 3 TOTAL ASSETS TURNOVER RATIO
Group Statistics
BANKS N Mean Std. Deviation Std. Error Mean
TOTAL_ASSETS_TURNOVER_R
ATIO
BOB 5 .0700 .00707 .00316
PNB 5 .0860 .00548 .00245
Independent Samples Test
Levene's Test for
Equality of
Variances t-test for Equality of Means
F Sig. t df
Sig. (2-
tailed)
Mean
Differenc
e
Std.
Error
Differenc
e
95% Confidence
Interval of the
Difference
Lower Upper
TOTAL_ASSET
S_TURNOVER
_RATIO
Equal variances
assumed .103 .757 -4.000 8 .004 -.01600 .00400 -.02522 -.00678
Equal variances
not assumed
-4.000 7.529 .004 -.01600 .00400 -.02533 -.00667
*Findings: The Significant p value is 0.757 ≥ 0.05 than equal variance assumed
is 0.004 ≤ 0.05 than hypothesis is rejected.

2. Loan Ratio: The ratio provides a general measure of the financial position of a bank,
including its ability to meet financial requirements for outstanding loans.
Loan Ratio = Loans/Total Assets.
TABLE – 4 LOAN RATIO
Group Statistics
BANKS N Mean Std. Deviation Std. Error Mean
LOAN_RATIO BOB 5 .1140 .00548 .00245
PNB 5 .1900 .07450 .03332
Independent Samples Test
Levene's Test for
Equality of
Variances t-test for Equality of Means
F Sig. t df
Sig. (2-
tailed)
Mean
Differenc
e
Std. Error
Differenc
e
95% Confidence
Interval of the
Difference
Lower Upper
LOAN_R
ATIO
Equal variances
assumed 40.638 .000 -2.275 8 .052 -.07600 .03341 -.15304 .00104
Equal variances
not assumed
-2.275 4.043 .085 -.07600 .03341 -.16836 .01636
*Findings: The Significant p value is 0.00 ≤ 0.05 than equal variance assumed
is 0.085 > 0.05 than hypothesis Ho is accepted.
III. Management Efficiency:
The bank management efficiency guarantees the growth and survival of a bank.
This parameter is used to evaluate management quality so as to assign premium
to better quality banks and discount poorly managed ones. It involves analysis
of efficiency of management in generating business (top-line) and in
maximizing profits (bottom-line).

1. Credit Deposit Ratio:
It indicates the ability of a bank to convert its deposits into higher earning
advances. It is the ratio of how much a bank lends out of the deposits it has
mobilized.
Credit Deposit Ratio=Total Advances/Customer Deposit.
TABLE – 5 CREDIT DEPOSIT RATIO
Group Statistics
BANKS N Mean Std. Deviation Std. Error Mean
CREDIT_DEPOSIT_RATIO BOB 5 72.6900 2.08854 .93402
PNB 5 61.5020 19.90782 8.90305
Independent Samples Test
Levene's Test for
Equality of
Variances t-test for Equality of Means
F Sig. t df
Sig. (2-
tailed)
Mean
Differenc
e
Std.
Error
Differenc
e
95% Confidence
Interval of the
Difference
Lower Upper
CREDIT_DEPO
SIT_RATIO
Equal variances
assumed 64.318 .000 1.250 8 .247 11.18800 8.95191 -9.45514 31.83114
Equal variances
not assumed
1.250 4.088 .278 11.18800 8.95191 -13.4568 35.83280
*Findings: The Significant p value is 0.000 ≤ 0.05 than equal variance assumed
is 0.278 > 0.05 than hypothesis Ho is accepted.

2. Total Income/Capital employed Ratio:
This measure narrows the focus to gain a better understanding of a company's
ability to generate returns from its available capital base.
TABLE – 6 TOTAL INCOME /CAPITAL EMPLOYED RATIO
Group Statistics
BANKS N Mean Std. Deviation Std. Error Mean
TOTALINCOME_CAPITALEMPLO
YED_RATIO
BOB 5 7.7680 .37036 .16563
PNB 5 9.4380 .32950 .14736
Independent Samples Test
Levene's Test for
Equality of
Variances t-test for Equality of Means
F Sig. t df
Sig. (2-
tailed)
Mean
Differenc
e
Std. Error
Differenc
e
95% Confidence
Interval of the
Difference
Lower Upper
TOTALINCOME
_CAPITALEMP
LOYED_RATIO
Equal variances
assumed .116 .743 -7.533 8 .000 -1.67000 .22169 -2.18123 -1.15877
Equal variances
not assumed
-7.533 7.893 .000 -1.67000 .22169 -2.18243 -1.15757
*Findings: The Significant p value is 0.743 > 0.05 than equal variance assumed
is 0.000 < 0.05 than hypothesis Ho is rejected.

IV. Earning Quality: This parameter lays importance on how a bank earns its profits. This also
explains the sustainability and growth in earnings in the future. Earning quality
represents the quality of a bank’s profitability and its capability to maintain
quality and earn consistently. This ratio measures the profitability or the
operational efficiency of the banks.
1. Net Profit Ratio: Net profit ratio shows the operational efficiency of the business. Decreases in
the ratio indicate managerial inefficiency and excessive selling and distribution
expenses and Increase shows better performance.
Net Profit Ratio= (Net Profit/Total Income)*100
TABLE – 7 NET PROFIT RATIO
Group Statistics
BANKS N Mean Std. Deviation Std. Error Mean
NET_PROFIT_RATIO BOB 5 13.9320 2.81693 1.25977
PNB 5 11.8840 3.44083 1.53879
Independent Samples Test
Levene's Test for
Equality of
Variances t-test for Equality of Means
F Sig. T df
Sig. (2-
tailed)
Mean
Differenc
e
Std. Error
Differenc
e
95% Confidence
Interval of the
Difference
Lower Upper
NET_PROFIT
_RATIO
Equal variances
assumed .070 .799 1.030 8 .333 2.04800 1.98869 -2.53792 6.63392
Equal variances
not assumed
1.030 7.700 .334 2.04800 1.98869 -2.56923 6.66523
*Findings: The Significant p value is 0.799 > 0.05 than equal variance not
assumed is 0.333> 0.05 than hypothesis Ho is accepted.
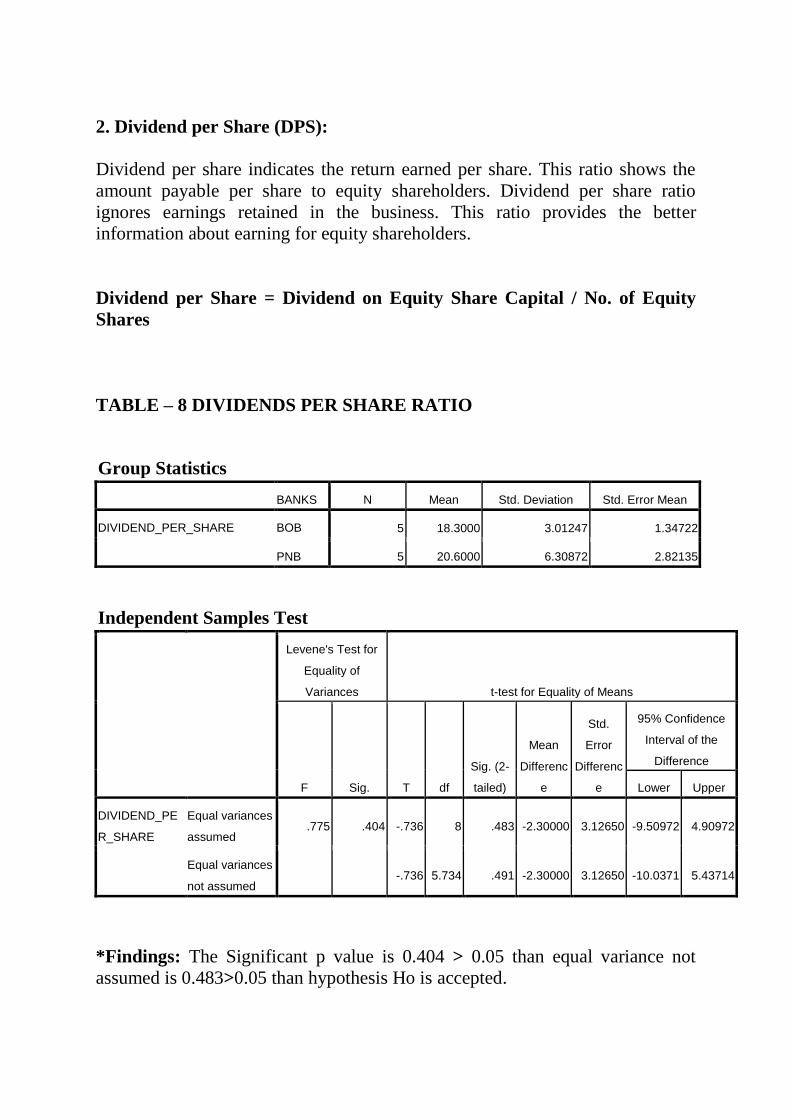
2. Dividend per Share (DPS):
Dividend per share indicates the return earned per share. This ratio shows the
amount payable per share to equity shareholders. Dividend per share ratio
ignores earnings retained in the business. This ratio provides the better
information about earning for equity shareholders.
Dividend per Share = Dividend on Equity Share Capital / No. of Equity
Shares
TABLE – 8 DIVIDENDS PER SHARE RATIO
Group Statistics
BANKS N Mean Std. Deviation Std. Error Mean
DIVIDEND_PER_SHARE BOB 5 18.3000 3.01247 1.34722
PNB 5 20.6000 6.30872 2.82135
Independent Samples Test
Levene's Test for
Equality of
Variances t-test for Equality of Means
F Sig. T df
Sig. (2-
tailed)
Mean
Differenc
e
Std.
Error
Differenc
e
95% Confidence
Interval of the
Difference
Lower Upper
DIVIDEND_PE
R_SHARE
Equal variances
assumed .775 .404 -.736 8 .483 -2.30000 3.12650 -9.50972 4.90972
Equal variances
not assumed
-.736 5.734 .491 -2.30000 3.12650 -10.0371 5.43714
*Findings: The Significant p value is 0.404 > 0.05 than equal variance not
assumed is 0.483>0.05 than hypothesis Ho is accepted.
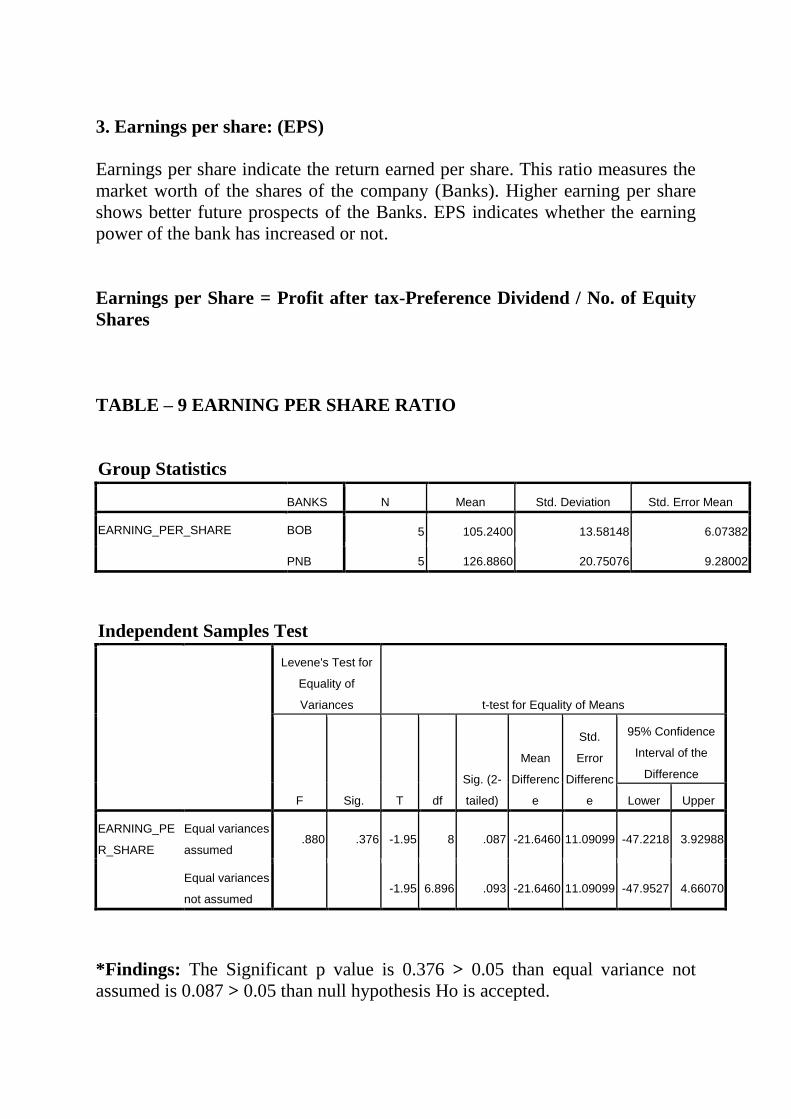
3. Earnings per share: (EPS)
Earnings per share indicate the return earned per share. This ratio measures the
market worth of the shares of the company (Banks). Higher earning per share
shows better future prospects of the Banks. EPS indicates whether the earning
power of the bank has increased or not.
Earnings per Share = Profit after tax-Preference Dividend / No. of Equity
Shares
TABLE – 9 EARNING PER SHARE RATIO
Group Statistics
BANKS N Mean Std. Deviation Std. Error Mean
EARNING_PER_SHARE BOB 5 105.2400 13.58148 6.07382
PNB 5 126.8860 20.75076 9.28002
Independent Samples Test
Levene's Test for
Equality of
Variances t-test for Equality of Means
F Sig. T df
Sig. (2-
tailed)
Mean
Differenc
e
Std.
Error
Differenc
e
95% Confidence
Interval of the
Difference
Lower Upper
EARNING_PE
R_SHARE
Equal variances
assumed .880 .376 -1.95 8 .087 -21.6460 11.09099 -47.2218 3.92988
Equal variances
not assumed
-1.95 6.896 .093 -21.6460 11.09099 -47.9527 4.66070
*Findings: The Significant p value is 0.376 > 0.05 than equal variance not
assumed is 0.087 > 0.05 than null hypothesis Ho is accepted.

4. Return on Net worth (RON):
This ratio measures the overall profitability, the operational efficiency and
borrowing policy of the enterprise. It indicates the relationship of net profit with
capital employed in the business. The primary objective of business is to
maximize its earnings and this ratio indicates the extent to which this primary
objective of business is being achieved.
Return on Net Worth = Net Profit / Net-worth
TABLE – 10 RETURN ON NET WORTH RATIO
Group Statistics
BANKS N Mean Std. Deviation Std. Error Mean
RETURN_ON_NET_WORTH BOB 5 17.0460 3.53943 1.58288
PNB 5 17.2100 5.66225 2.53223
Independent Samples Test
Levene's Test for
Equality of
Variances t-test for Equality of Means
F Sig. T df
Sig. (2-
tailed)
Mean
Differenc
e
Std.
Error
Differenc
e
95% Confidence
Interval of the
Difference
Lower Upper
RETURN_ON_
NET_WORTH
Equal
variances
assumed
.708 .425 -.055 8 .958 -.16400 2.98625 -7.05032 6.72232
Equal
variances not
assumed
-.055 6.712 .958 -.16400 2.98625 -7.28729 6.95929
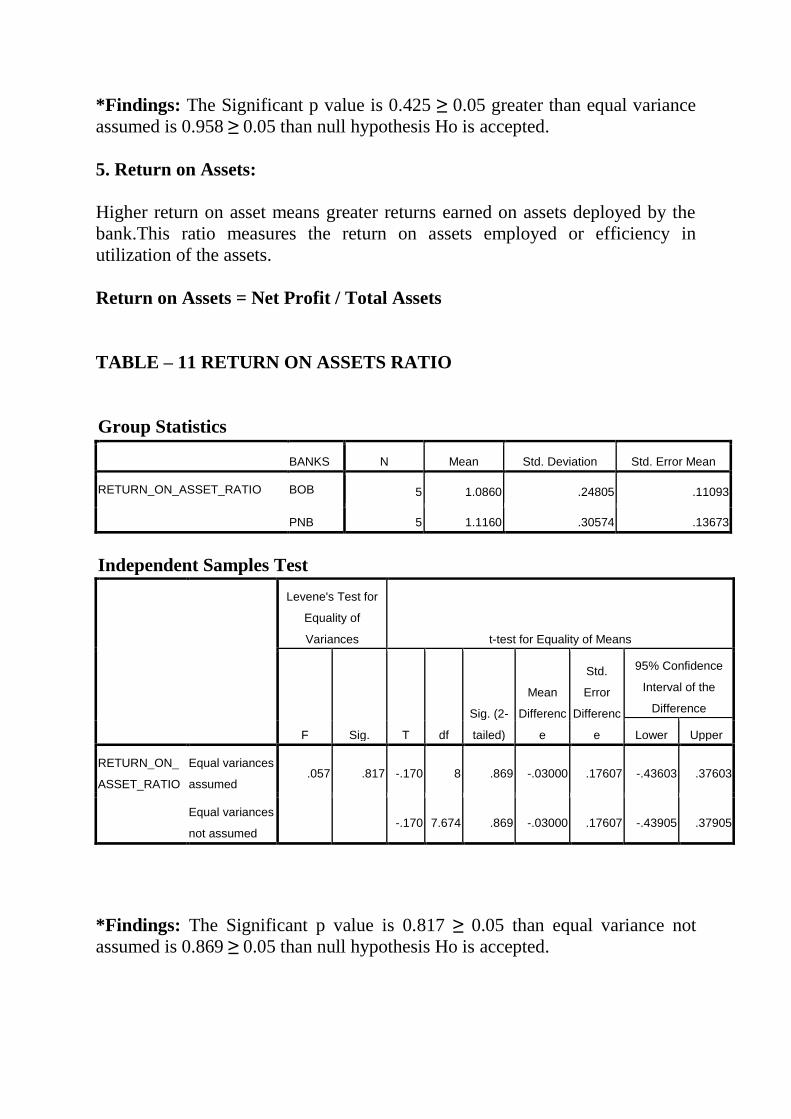
*Findings: The Significant p value is 0.425 ≥ 0.05 greater than equal variance
assumed is 0.958 ≥ 0.05 than null hypothesis Ho is accepted.
5. Return on Assets:
Higher return on asset means greater returns earned on assets deployed by the
bank.This ratio measures the return on assets employed or efficiency in
utilization of the assets.
Return on Assets = Net Profit / Total Assets
TABLE – 11 RETURN ON ASSETS RATIO
Group Statistics
BANKS N Mean Std. Deviation Std. Error Mean
RETURN_ON_ASSET_RATIO BOB 5 1.0860 .24805 .11093
PNB 5 1.1160 .30574 .13673
Independent Samples Test
Levene's Test for
Equality of
Variances t-test for Equality of Means
F Sig. T df
Sig. (2-
tailed)
Mean
Differenc
e
Std.
Error
Differenc
e
95% Confidence
Interval of the
Difference
Lower Upper
RETURN_ON_
ASSET_RATIO
Equal variances
assumed .057 .817 -.170 8 .869 -.03000 .17607 -.43603 .37603
Equal variances
not assumed
-.170 7.674 .869 -.03000 .17607 -.43905 .37905
*Findings: The Significant p value is 0.817 ≥ 0.05 than equal variance not
assumed is 0.869 ≥ 0.05 than null hypothesis Ho is accepted.
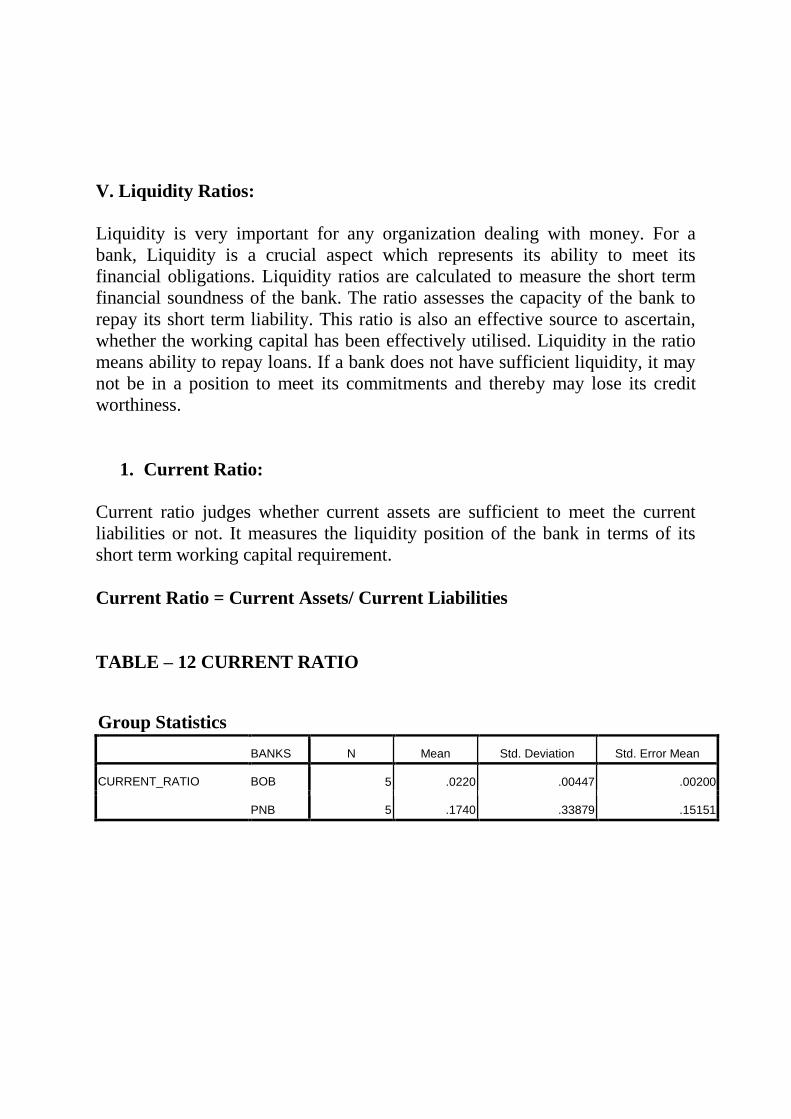
V. Liquidity Ratios:
Liquidity is very important for any organization dealing with money. For a
bank, Liquidity is a crucial aspect which represents its ability to meet its
financial obligations. Liquidity ratios are calculated to measure the short term
financial soundness of the bank. The ratio assesses the capacity of the bank to
repay its short term liability. This ratio is also an effective source to ascertain,
whether the working capital has been effectively utilised. Liquidity in the ratio
means ability to repay loans. If a bank does not have sufficient liquidity, it may
not be in a position to meet its commitments and thereby may lose its credit
worthiness.
1. Current Ratio:
Current ratio judges whether current assets are sufficient to meet the current
liabilities or not. It measures the liquidity position of the bank in terms of its
short term working capital requirement.
Current Ratio = Current Assets/ Current Liabilities
TABLE – 12 CURRENT RATIO
Group Statistics
BANKS N Mean Std. Deviation Std. Error Mean
CURRENT_RATIO BOB 5 .0220 .00447 .00200
PNB 5 .1740 .33879 .15151
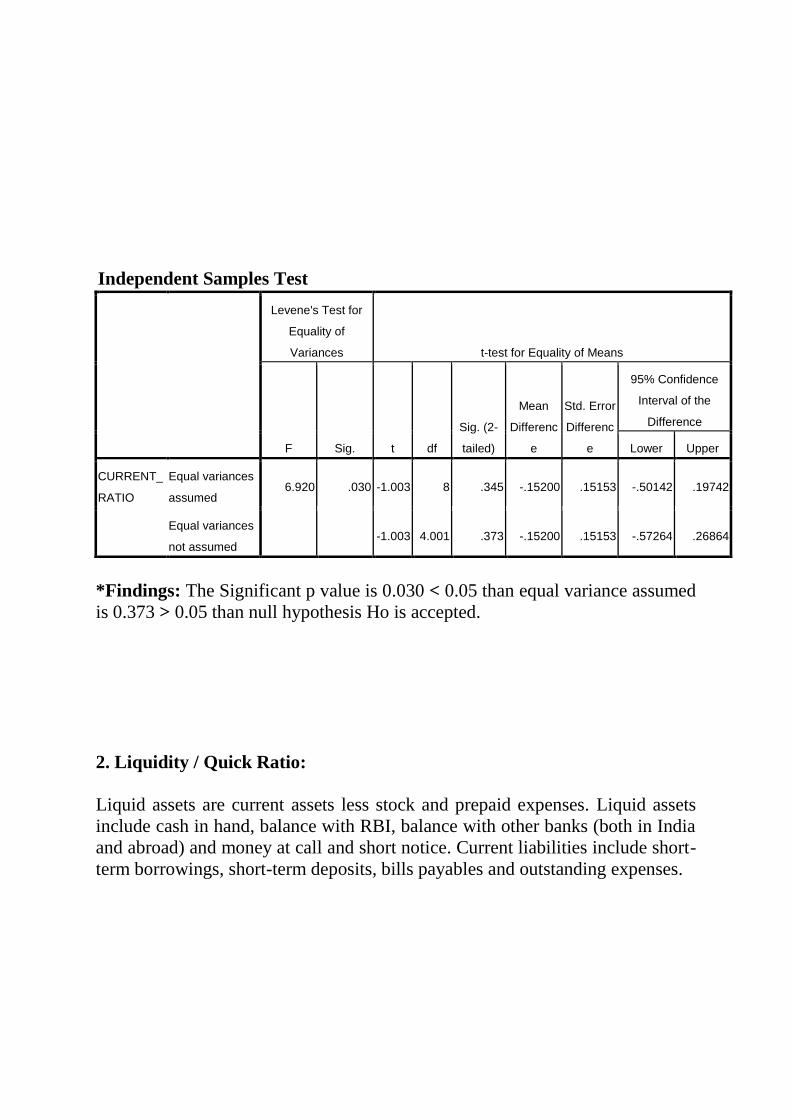
Independent Samples Test
Levene's Test for
Equality of
Variances t-test for Equality of Means
F Sig. t df
Sig. (2-
tailed)
Mean
Differenc
e
Std. Error
Differenc
e
95% Confidence
Interval of the
Difference
Lower Upper
CURRENT_
RATIO
Equal variances
assumed 6.920 .030 -1.003 8 .345 -.15200 .15153 -.50142 .19742
Equal variances
not assumed
-1.003 4.001 .373 -.15200 .15153 -.57264 .26864
*Findings: The Significant p value is 0.030 < 0.05 than equal variance assumed
is 0.373 > 0.05 than null hypothesis Ho is accepted.
2. Liquidity / Quick Ratio:
Liquid assets are current assets less stock and prepaid expenses. Liquid assets
include cash in hand, balance with RBI, balance with other banks (both in India
and abroad) and money at call and short notice. Current liabilities include short-
term borrowings, short-term deposits, bills payables and outstanding expenses.

TABLE – 13 QUICK RATIOS
Group Statistics
BANKS N Mean Std. Deviation Std. Error Mean
QUICK_RATIO BOB 5 24.8680 2.39999 1.07331
PNB 5 22.8220 1.77710 .79474
Independent Samples Test
Levene's Test for
Equality of
Variances t-test for Equality of Means
F Sig. t df
Sig. (2-
tailed)
Mean
Differenc
e
Std. Error
Differenc
e
95% Confidence
Interval of the
Difference
Lower Upper
QUICK_R
ATIO
Equal variances
assumed .763 .408 1.532 8 .164 2.04600 1.33552 -1.03371 5.12571
Equal variances
not assumed
1.532 7.372 .167 2.04600 1.33552 -1.07994 5.17194
*Findings: The Significant p value is 0.408 > 0.05 than equal variance assumed
is 0.164 > 0.05 than null hypothesis Ho is accepted.
VI. Sensitivity to Market Risk:
Sensitivity focuses on an institution's ability to identify, monitor, manage and
control its market risk, and provides institution management with a clear and
focused indication of supervisory concerns in this area.
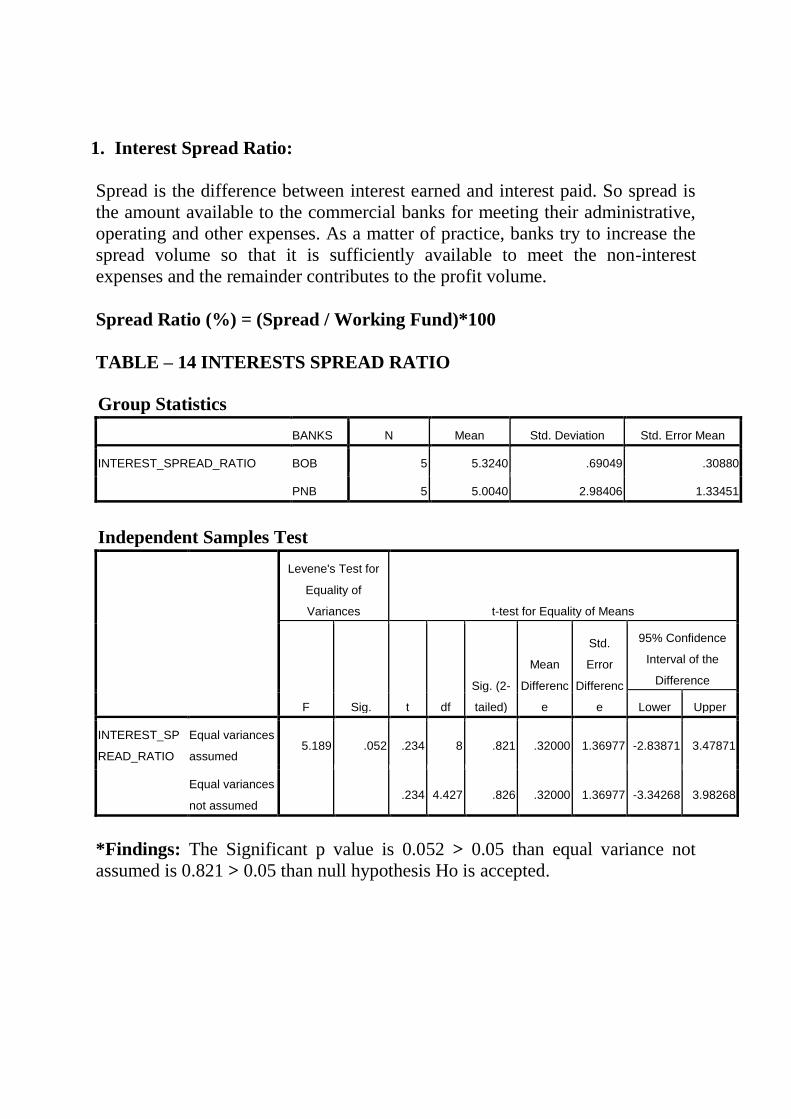
1. Interest Spread Ratio:
Spread is the difference between interest earned and interest paid. So spread is
the amount available to the commercial banks for meeting their administrative,
operating and other expenses. As a matter of practice, banks try to increase the
spread volume so that it is sufficiently available to meet the non-interest
expenses and the remainder contributes to the profit volume.
Spread Ratio (%) = (Spread / Working Fund)*100
TABLE – 14 INTERESTS SPREAD RATIO
Group Statistics
BANKS N Mean Std. Deviation Std. Error Mean
INTEREST_SPREAD_RATIO BOB 5 5.3240 .69049 .30880
PNB 5 5.0040 2.98406 1.33451
Independent Samples Test
Levene's Test for
Equality of
Variances t-test for Equality of Means
F Sig. t df
Sig. (2-
tailed)
Mean
Differenc
e
Std.
Error
Differenc
e
95% Confidence
Interval of the
Difference
Lower Upper
INTEREST_SP
READ_RATIO
Equal variances
assumed 5.189 .052 .234 8 .821 .32000 1.36977 -2.83871 3.47871
Equal variances
not assumed
.234 4.427 .826 .32000 1.36977 -3.34268 3.98268
*Findings: The Significant p value is 0.052 > 0.05 than equal variance not
assumed is 0.821 > 0.05 than null hypothesis Ho is accepted.

*
(If variances are equal p value will be greater than 0.05 use equal variance
assumed) (If variances are unequal p value will be greater than 0.05 use equal
variance not assumed)
If (sig.2 tailed) ≤ 0.05: significant difference – reject hypothesis.
If (sig.2 tailed) ≤ 0.05: no significant difference NS
Group means are significantly different as the value in the sig. (2 tailed) low is
less than 0.05
H0: μ1 = μ2 (Null hypothesis: mean of two banks are equal)
Ha: μ1 < μ2 (Alternate hypothesis: mean of two banks are not equal)
SUMMARY OF FINDINGS, CONCLUSIONS AND SUGGESTIONS:
Based on the above analysis, the following are the summary of findings;
conclusions and suggestions about the comparative financial performance of the
Bank of Baroda and Punjab national bank are drawn:
1. The capital adequacy and Tier I capital ratio of Bank of Baroda and Punjab
national Bank is more than the Basel Accord norms .We conclude that both the
banks are good with respect capital adequacy because it is above the Basel
norms.
2. The loans to total assets of Punjab National Bank are more compared with
Bank of Baroda. Hence, we can say that the risk is more in Punjab National
Bank compared with Bank of Baroda.
3. The total advances to customer deposit of Punjab National Bank are less
compared with Bank of Baroda. Hence, Bank of Baroda is managing more
efficiently for converting deposits to advances.
4. The net profit ratio of Bank of Baroda is more compared with Punjab
National Bank.
5. The Average current assets and quick assets of Bank of Baroda is more
compared with Punjab National Bank. So, we can conclude that the Bank of
Baroda liquidity has well compared with Punjab National Bank. and the t-test
has also proved the same in the case of all the liquidity ratios.
6. The debt-equity ratio of Punjab National Bank. 6.00 % is more compared
with Bank of Baroda 5.00 %; hence long term solvency is well in Punjab
National Bank.

7. The spread ratio of Bank of Baroda is more compared with Punjab National
Bank. Hence, we can say that the Punjab National Bank Interest income more
compared with interest expenses. Hence Punjab National Bank earns more
profits.
From the CAMELS’ analysis it clears that there is no significance difference
between the Bank of Baroda and Punjab National Bank’s financial performance
but we conclude that the Punjab National Bank performance is slightly less
compared with Bank of Baroda.
CONCLUSION:
All the two banks have succeeded in maintaining CRAR at a higher level than
the prescribed level, 10%. But the Bank of Baroda has maintained highest
across the duration of last five years. It is very good sign for the banks to
survive and to expand in future.
Out of 14 ratios used in the CAMEL model the average figures of Bank Of
Baroda is the best for (6 ratios) followed by Punjab National Bank (5 ratios).
Thus it is established that Bank of Baroda is the best bank in the selected public
sector banks.
In nutshell it can be concluded that transparency and good governance would
work as principal guiding force in present scenario.
Limitations of the study:
The study is based on secondary data collected from the secondary data source,
internet and websites of various banks concerned. Therefore, the quality of the
study depends upon the accuracy, reliability, and quality of secondary data
source. The published data is not uniform and not properly disclosed by the
banks.
Scope for Further Research:
Capital Adequacy ratio (CAR) is a ratio that regulators in the banking system
use to watch bank’s health, specifically bank’s capital to its risk. Regulators in
most countries define and monitor CAR to protect depositors, thereby
maintaining confidence in the banking system. This research paper and its
findings may be of considerable use to banking institutions, policy makers and
to academic researchers in the area of banking performance evaluation with
special reference to capital adequacy.
REFERENCES:
1. Sathya and Bhattacharya et el (1997) : “Impact of Privatization on the
Performance of the Public Sector Banks, Journal of Management Review: pp
45-55.
2. K. SRINIVAS (2010): “Pre and Post Merger Financial Performance of
Merged Banks- A Select Study”, Indian Journal of Finance, May 2010.
3. Chowdari Prasad and K.S. Srinivasa Rao (2004) : “Private Sector Banks in
India - A SWOT Analysis, Bankers Profession, pp 28-33.
4. Sanjay J. Bhayani (2006): “Performance of the New Indian Private Banks –
A Comparative Study, Banking Review: pp 55 – 59.
5. Chidambaram R.M and Alamelu (1994): “Profitability in Banks – A matter of
Survival, The Banker: pp 1-3 May.
6. Das A. (1997): “Technical, Allocative and Scale Efficiency of Public Sector
Banks in India, RBI Occasional Papers, June to September.
7. Barman R. B. and Samanta G. P “Banking Services Price Index: An
Exploratory Analysis for India” (www.financialindia.com)
8. Bhadury Prof. Subrato (2007) conducted study on “Commercial banking in
India new challenges and opportunities after liberalization” South Asian Journal
of Socio-Political Studies (Vol No-2, Jan-June 2007).
9. Board John Sutcliffe, Ziemba Charles, William T.(2003) “Applying
Operations ResearchTechniques to Financial Markets” Interfaces;
(Mar/Apr2003, vol. 33 issue 2), (Pg12 24).
10. Brown Craig O. and Dinc I. Serdar (2005) “The Politics of Bank Failures:
Evidence from Emerging Markets” Quarterly Journal of Economics, (November
2005) (Pg-1413-1443).
11. Batra Mr. Sumant & Dass Kesar (2003) “Maximising value of Non
Performing Assets” Forum for Asian Insolvency Reform (FAIR) (Seoul, Korea
10 - 11 November 2003).
12. Chhikara Dr. Sudesh (2007) “Causes and Impact of Non Performing Assets
in Public Sector Banks: A state level Analysis” Amity Management Analyst (
Vol 1, No 2) (2007) ( Pg. No. 48-56).
13. Chipalkatti Niranjan , Rishi Meenakshi (2007) “Do Indian banks understate
their bad loans?” The Journal of Developing Areas. Nashville: (Spring 2007.
Vol. 40, Issue. 2) ;( Pg. 75-91).
14. Chakrabarti Rajesh and Chawla Gaurav (2005) “Bank Efficiency in India
since the Reforms: An Assessment” Money & Finance ICRA Bulletin, (July-
Dec’05) (Pg.-31-42).
15. Deolalkar G.H “The Indian Banking Sector On the road to progress” Article
from (www.fedral.co.in) 15. Derviz Alexis and Podpiera Jiri “Predicting Bank
CAMEL ad S&P ratings: The Caste of Czech Republic” Working Paper Series,
printed and distributed by Czech National Bank (http://www.cnb.cz.).

16. Das, Abhima, Ghosh, Saibal (2006) “Financial Deregulation and Efficiency:
An Empirical Analysis of Indian Banks during the Post Reform Period” Review
of Financial Economics; (Sep2006, Vol. 15 Issue 3), (Pg193-221).
17. Dhar V Ganga and Reddy G Nares (2007) “Mergers and acquisitions in the
Banking Sector- an Empirical Analysis”ICFAI Reader, (March 2007), (Pg: 42-
50).
18. Frierson, Robert DeV (2007) “Orders Issued under section 4 of the Bank
holding Company Act” Federal Reserve Bulletin; (3/1/2007), (Pg44-48).
19. Dr.D.Maheshwara Reddyand K.V.N. Prasad (2011) conducted a study to
evaluate performance of regional rural banks:An Application of Camel model.
Journal of Arts , Science and commerce.Volume 2, Isue-4,Oct 2011
20. K. Srinivasl, Saroja (2013) “Comparative Financial Performance of HDFC
BANK and ICICI BANK” Scholars world-International Refereed
Multidisciplinary Journal of Contemporary Research Volume.1, Issue.2, July
2013 [107]
21. Kishore Meghani , Deepti Tripathi and Swati Mahajan (2014) “ FINANCIAL
PERFORMANCE OF AXIS BANK AND KOTAK MAHINDRA BANK IN
THE POST REFORM ERA: ANALYSIS ON CAMEL MODEL.” International
Journal of Business Quantitative Economics and Applied Management Research
Volume 1, Issue 2, July 2014 (Pg.-108-141).