
Munich Personal RePEc Archive - uni-muenchen.de€¦ · · 2017-04-21Munich Personal RePEc...
21
Munich Personal RePEc Archive Study of Relationship of Company’s Performance with Internal and External Factors on Maxis Berhad Way Han Koh Universiti Utara Malaysia 17 April 2017 Online at https://mpra.ub.uni-muenchen.de/78475/ MPRA Paper No. 78475, posted 21 April 2017 07:42 UTC
Transcript of Munich Personal RePEc Archive - uni-muenchen.de€¦ · · 2017-04-21Munich Personal RePEc...
MPRAMunich Personal RePEc Archive
Study of Relationship of Company’sPerformance with Internal and ExternalFactors on Maxis Berhad
Way Han Koh
Universiti Utara Malaysia
17 April 2017
Online at https://mpra.ub.uni-muenchen.de/78475/MPRA Paper No. 78475, posted 21 April 2017 07:42 UTC

Study of Relationship of Company’s Performance with Internal and External
Factors on Maxis Berhad
Koh Way Han
Universiti Utara Malaysia
Abstract
The purpose of the study is to investigate how the Maxis Berhad internal factors and
external factors influence the company’s performance. The financial information is
obtained from annual report of Maxis Berhad starting from year 2011 to 2015. The
measurement of return on assets is used to see the overall performance of Maxis Berhad
in 5 years which beyond benchmark. The additional measurement is the corporate index
score, board remuneration, asset size, net profit margin, GDP growth rate, inflation,
unemployment rate and exchange rate. To see the relationship of risk factors to the
profitability, this paper is utilizing liquidity (current ratio), leverage (debt to equity ratio)
and market risk (standard deviation). Data was analysed by utilizing regression and
correlation. The regression analysis and correlation shows only one variable is
significant to ROA which is market risk with the highest impact to the company’s
performance. However, the liquidity risk is not significant to ROA with p value = 0.130.
While for the macroeconomic factor, GDP growth rate is also not significant to the
company’s performance with low impact to the return on assets.
Keywords: Liquidity risk, Market risk, Leverage, Return on Assets

1.0 Introduction
Maxis Berhad was established by its founder, Ananda Krishnan in year 1993.
On 19 November 2009, Maxis Berhad was listed in Bursa Malaysia. It is the leading
communications service provider in Malaysia. Through its subsidiaries, the company
provides mobile telecommunications products and services, wireless internet access,
broadband services, multimedia related services, Global System Mobile (GSM) cellular
services, and telecommunications consultancy services.
From the year 2011 to 2015, Maxis Berhad is changing, regardless of the size
of the board of directors or the chief executive director or the performance of Maxis.
Before the year 2013, the CEO of Maxis is Sandip Das, which is an Indian citizen.
Morten Lundal, which is a Norwegian has been hired as CEO on 1 October 2013 after
Sandip Das resign his position. He has more than 16 years of experience in the
telecommunications industry and once was the CEO of the DiGi.Com Berhad Group.
During this 5 years, the stock price of the Maxis remaining stable between 6.2 and 7.2.
It has indicated Maxis Berhad is having a good performance although they is facing
varied type of risk.
By having a good corporate governance structure, Maxis will be able to perform
better when comparing to its competitors. Different types of committee within the
corporate will improve the efficiency and independence of the company. At the same
time, it will helps the company to excel in financial risk management. The existing risk
such as credit risk, liquidity risk, operational risk, legal risk and market risk will be
avoid, mitigate or transfer in the efficient ways. Without a proper understanding about
risk and proper management of the risk will leads to an undesired consequences.
2.0 Literature Review
The aim of this study is to investigate the relationship of company’s financial
risk and the company’s performance. The performance of the company will be
measured by using the varied types of ratios according to the financial information that
can be obtained from the annual reports. This study will also relate to the corporate
structure and the risk management of the company.
(Dr. Majed Abdel Majid, Dr. Said Mukhled Ahmed, & Dr. Firas Naim, 2012)
stated that financial ratios were used by internal and external financial data users for
making their economic decisions; including investing, and performance evaluation
decisions. Profitability ratios measure earning capacity of the firm, and it is considered
as an indicator for its growth, success and control. Activity ratios are another measure

of operational efficiency and performance. (Zaid, Ibrahim, & Zulqernain, 2014)
presented that profit is the residual of sales revenue once all costs, including interest
payments on debt, have been deducted, it thus constitutes the return to equity holders.
(Hwang, 2015) mentioned that in financial markets, risk emanates from both
natural and man-made phenomena. According to (Waeibrorheem & Suriani, Bank
Specific and Macroeconomics Dynamic Determinants of, 2015) presented that banks
assets mainly consist of loan while liabilities are deposit payable where any mismatch
in asset and liability would contribute to liquidity risk and credit risk. (Waeibrorheem
& Suriani, Systematic and Unsystematic Risk Determinants of Liquidity, 2016) stated
that liquidity could throw solvent bank into insolvency since it has to sell its assets far
below their value to fulfill its current financial obligations. It has indicated worst
consequences if the company doesn’t implement a good financial risk management with
the objective to mitigate the financial risk. Based on the (Jafari, Chadegani, & Biglari,
2011) indicated that is a significant positive relationship between performance level as
a behavioral function and total risk management. If companies try to control
unfavorable conditions that result from exposure to risk, they can improve corporate
performance.
Besides of financial risk management, the corporate governance will also
influence the performance of the company. (Abdussalam Mahmoud, 2006) presented
that firm structure emerges as an important factor affecting profitability. From the
analysis of (Waeibrorheem & Suriani, Mode of Islamic Bank Financing: Does
Effectiveness of Shariah Supervisory Board Matter?, 2015), an effective Shariah
Supervisory Board does not have significant bearing towards the choice of Islamic
mode of financing in Malaysia but their remuneration have. (Subramaniam, McManus,
& Zhang, 2009) proposed that the risk committee is in charge of identify the risks, and
also opportunities, identified on a timely basis and that the group’s objectives and
activities are aligned with the risks and opportunities identified by the board.
3.0 Descriptive Analysis
3.1 Trend Analysis
The study employed a model specification in order to measure the Maxis Berhad’s
performance, using profitability measured by the return on assets (ROA) along with
other independent variables. Based on the annual report, the ROA can be obtained by
using the formula below:
ROA = Net profit after taxes / Total average assets

Graph 1: Return on assets of Maxis from the year 2011-2015
Based on the graph, the return on assets has a downward trend from year 2011 to year
2015. It implied that the efficiency of Maxis in utilizing its assets to make profits has
become lower. The reasons of the downward trend of ROA are the Maxis making less
net profit after taxes and the rise of total assets during this 5 years. Maxis faced a
significant drop in ROA in the year 2012 as the huge amount of cost of sales,
operational and administration cost increasing. While the total assets is decreasing in
term of property, plant and equipment.
Size of the company
Graph 2: Total asset of the Maxis from the year 2011-2015
The graph indicates the decreasing of total assets of Maxis in the year 2011 to 2013 and
rise back until the year 2015. Since more than 80% of the total assets in Maxis are non-
current assets, the changes of non-current assets have a significant impacts to the
company’s size. For the further information, the decreasing of the total assets at the
beginning of the first 3 years is mainly affected by the depreciation, amortization or
impairment of the property plant and equipment. For the last 2 years, the total assets
14.07%
10.45% 10.23% 9.52% 9.20%
0.00%
5.00%
10.00%
15.00%
2011 2012 2013 2014 2015
YEAR
ROA
2011 2012 2013 2014 2015
Total Assets 17,990,519, 17,802,179, 17,329,585, 18,109,608, 18,984,945,
16,500,000,000
17,000,000,000
17,500,000,000
18,000,000,000
18,500,000,000
19,000,000,000
19,500,000,000
Total Assets

rise back is because of the increasing of receivables, deposits and prepayments and
derivative financial assets that included cash flow hedge.
Liquidity risk
Since liquidity ratio is measuring the company’s ability to meet day to day operating
expenses and satisfy short term obligations. The current ratio has been chosen as the
measurement to evaluate the liquidity risk. Below is the formula to form the current
ratio:
Current Ratio= Current assets / Current liabilities
Graph 3: Current ratio of Maxis for the year 2011-2015
Based on the graph above, there is an irregular rising and falling from the year 2011 to
2015. However, the Current ratio has increased to 0.58 at the end of the year 2015 if
compared to 2011 which is 0.42. For the year of 2012, Maxis achieve a 0.74 Current
ratio is because of the dramatic drop in the amount of borrowing. The current ratio is
lesser than 1 from the year 2011 to 2015 also indicated the Maxis is facing a high
liquidity risk due to the increasing of current assets is lesser than the increasing of
current liabilities. It also means that Maxis will struggle to pay short-term financial
obligations.
Leverage risk
In order to measure the leverage risk of Maxis, debt to equity ratio has been chosen as
the financial measurement which can access the ability to meet the financial obligations.
The formula for debt to equity ratio is:
Debt to Equity Ratio = Total liabilities / Total equity
0.42
0.74
0.510.62 0.58
0.00
0.20
0.40
0.60
0.80
2011 2012 2013 2014 2015
YEAR
Current ratio

Graph 4: The leverage ratio of the Maxis from 2011-2015
According to the graph above, there is an uptrend movement of the debt to equity ratio.
It indicated that the Maxis use a lot of debt to finance its company’s operations and
investment in order to generate shareholders’ wealth. For the further information the
rising of the leverage is due to the increasing in the borrowing and the decreasing of the
retain earnings. The rise of the leverage implied that the Maxis has high credit issues
and high burden in term of obligations.
Market Risk
Market risk is the risk related to the market prices of currencies, interest rate instruments,
equities or commodities which may affect the market volatility and lead the companies
to financial losses. Market risk can be measured by using the changing on the share
prices and the mean which can determine the degree of the risk.
Graph 5: The price movement of the stock of Maxis from the year 2011 to 2015
According to the graph, the price is less volatile at the beginning of the first 5 years
until the end of year 2014. The price started to fluctuate dramatically due to the currency
exposure and interest rate risk which caused by the unstable local currency. The average
1.221.52
1.88
2.823.50
0.00
1.00
2.00
3.00
4.00
2011 2012 2013 2014 2015
YEAR
Debt to Equity Ratio
-0.3
-0.2
-0.1
0
0.1
0.2
0.3
0.4
0.5
0.6
1
51
10
1
15
1
20
1
25
1
30
1
35
1
40
1
45
1
50
1
55
1
60
1
65
1
70
1
75
1
80
1
85
1
90
1
95
1
10
01
10
51
11
01
11
51
12
01
12
51
PR
ICE
Price Movement of Maxis Stock
Price
Changes
Linear
(Price
Changes)

mean of the price changes is 0.0032 and the standard deviation is 5.33%. It means the
range of price movements are not huge and implied the stability of the share price.
For the further investigation, standard deviation has been chosen as the indicator to
measure the volatility of company’s share prices year by year, which affected by the
market risk during the year of 2011 to 2015. High fluctuation of the share price will
affects the confidence of investors toward Maxis stock.
The relationship between the ROA and Financial Risks
Graph 6: Relationships between the ROA and the market risk, leverage and liquidity
risk
From the graph, the Maxis experienced decrease in return on assets during this 5 years.
Moreover, the debt to equity ratio has increase apparently from 1.22 to 3.50 and
indicating a serious credit issues existing. The overall of the current ratio is increasing
although there is an up and down trend. While the market risk which measure by using
standard deviation of yearly price changing, shows an upward trends in overall,
although there is a slightly drop in the year of 2013. This situation shows that the return
on assets is having a negative relationship with leverage ratio and market risk. However
the current ratio does not have a significant impact on the return on assets.
2011 2012 2013 2014 2015
ROA 0.14 0.10 0.10 0.10 0.09
Market risk 0.03 0.05 0.04 0.06 0.07
Leverage 1.22 1.52 1.88 2.82 3.50
Current Ratio 0.42 0.74 0.51 0.62 0.58
0.000.501.001.502.002.503.003.504.00
ROA, market risk, leverage and liquidity risk
ROA Market risk Leverage Current Ratio

The relationship between the ROA and the total assets
Graph 7: Relationship between the ROA and total assets
The Graph above shows the overall trend of the ROA is decreasing, while the total
assets which representing the company’s size has irregular downward and upward
trend. The rebound of total assets at the year 2014 is due to the increasing of account
receivables, deposits, prepayments and financial derivative instruments. These trends
indicate the performance of a company will be influenced by the company’s size but
not comprehensive. This is because there are significant elements in total assets which
has negative relationships with the return on assets such as the account receivables,
deposits and prepayments which will reduce the net profit after taxes.
3.2 SPSS Analysis
3.2.1 Descriptive Statistics
Based on the appendix 1, it shows the average of the return on assets of Maxis is 10.69%
during the year or 2011 to 2015. While the 1.95% standard deviation means there is
less vary so much from the average in the five years. While the average from index
score is 76%. While the net profit margins which is most significant to ROA is having
21.98% average and the 3.82% standard deviation. Higher the standard deviation,
greater the variables vary from the average. The second significant variable to ROA is
market risk which has an average of 0.0513 and standard deviation 1.53% in this 5 years.
3.2.2 Correlation
The study involved the variables from external and internal factors for the purpose to
evaluate the company’s performance. Examples of internal factor are index score, board
-
0.02
0.04
0.06
0.08
0.10
0.12
0.14
0.16
16,500,000,000
17,000,000,000
17,500,000,000
18,000,000,000
18,500,000,000
19,000,000,000
19,500,000,000
2011 2012 2013 2014 2015
ROA and the total assets
total assets ROA

remuneration, company’s size, net profit margin, leverage, market risk, and liquidity
risk. External factors included GDP growth rate, inflation, unemployment rate and
exchange rate. The study used return on assets (ROA) as a proxy for the performance
of Maxis. The influence of these external factors and internal factors will be discussed
in the regression results.
i) Internal factors
From the results of appendix 2. The index score from the board of the company is -
0.732 is having a strong negative relationship with the ROA. When there is an
improvement or increases of board committees, the cost will incur and reduces the ROA
of the company. Significant 0.08 means that the changing of the board structure is
significant relate to the ROA. For the variables of board’s remuneration, it is -0.501
which indicates the negative correlation with the ROA. It means that the increases in
the remuneration of Board of directors will reduce the ROA as the net profit after taxes
will be used as compensation for board of directors. However it has no statistically
significant to ROA. Besides that, the company’s size, which is -0.269 shows a weak
negative relationship to the ROA, but not significant related to company’s performance.
It means that the increases of the total assets will reduces a less portion of return on
assets as there are some of the total assets does not being used effectively in generate
profits.
For the net profit margin, which has positively a strong relationship and definitely
significant related to ROA as the correlation is +0.954 and sig. 0.006. It indicates the
increase of net profit margins will directly improve the performance of the company.
The Pearson correlation of the leverage is -0.763, indicates the strong but negative
correlation with ROA and has significant relationship as sig. less than 0.1. Increases of
debt-equity ratio will reduce the ROA due to the payment in interest rate, exposure to
the drop of currency values. For the market risk, it is having a negatively strong
relationship with the company’s performance as the -0.829 correlation and sig. 0.041.
At the same time, it is significant related to the ROA. The increasing of market exposure
risk is having a strong impact on the company’s performance. In addition to the market
risk, current ratio, which has -0.625 indicates negative correlation with the ROA and
significant to ROA. The reason of increasing in liquidity ratio but reducing in ROA is
probably because of the increasing of the account receivables, prepayment and the
deposits which will reduce the net profits.

ii) External factors
For the external variables, Gross Domestic Product (GDP) shows that -0.036 in
correlation with ROA and sig. 0.477. It implied a weak negative relationship with
company’s performance, which means increasing of GDP has a few impacts which will
reduce the Maxis performance. Since the GDP is involving different industry’s
contribution, so it is not significant related to Maxis. The correlation of inflation with
the ROA is 0.469 but not significant related. It indicates the return on assets will
increase when having a high inflation rate as the repurchase intention or loyalty of
customers on the best services provided by Maxis regardless on the incline of the
products’ prices. The unemployment rate, shows the negative relationship with the
ROA but no statistically significant. Since the unemployment happens, purchasing
power of citizens reduce, and the net profit after taxes will decline. For the last variable,
exchange rate is having -0.542 strong negative relationship with company’s
performance and not significant relation as sig. 0.173 greater than 0.1. The negative
relationship implied that the increase in exchange rate or the decrease in value of
Ringgit Malaysia has reduced the net profit of the company as the costly foreign
products or the high interest and principal to pay back for the foreign loans.
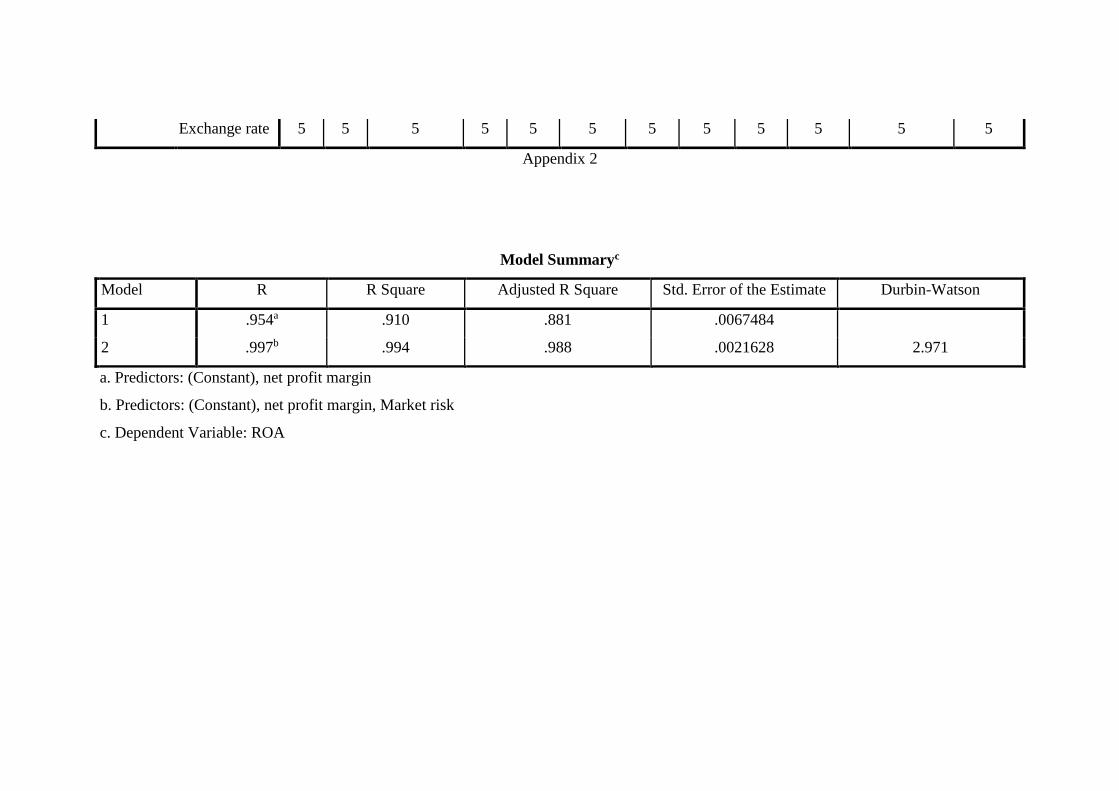
3.2.3 Model Summary
Based on the appendix 3, the R Square of the market risk is 99.4%, indicates that this
variable is more reliable and significant in influencing the ROA of the company.
Therefore, market risk is the best model that significant to company’s performance as
its lowest p value, 0.006 in Anova table.
4.0 Discussion
The most significant variable is market risk due to its lowest p value = 0.006 in Anova
table. At the same time, it is the most reliable variable due to 99.4% R-square in model
summary table. The existing of market risk has negative strong correlation (-0.829) with
the ROA and significant related to ROA as the p value = 0.041 lesser than 0.1. Therefore,
the performance of the Maxis is vulnerable to the internal factor, market risk which
involves the movements of market price of currency, interest rate, commodities and
equities. In order to reduce the market exposure risk of the company’s performance, the
company is necessary to pay more attention and using different methods to avoid,
reduce and transfer this risk.

5.0 Recommendation
First of all, Maxis should establish a risk committee in the boards in order to assessing
the different types of risk, such as serious liquidity issues, credit risk, currencies
exposures, interest rate exposures within the years of 2011 to 2015. By having risk
committee in executing the risk management policy and oversight of the company’s
performance, the ROA of the Maxis will increase as ROA is having negative correlation
with the liquidity, leverage and market risks exposure.
Besides of improvement in Board committee, Maxis should improve the efficiency in
collecting the account receivables. This is because the major component that caused the
total assets increase is account receivables, deposits and prepayments which may
indirectly reduce the net profit after taxes of the company. In order to reduce the
liquidity risk which the current ratio remaining lesser than 0.8 from 2011 to 2015 and
high leverage at the last 3 years in this 5 years, Maxis is suggested to reduce the short
term and long term borrowing before both of this risks bring disastrous impacts to the
company.
For the purpose to reduce the market risk which is most significant related to company’s
performance, Maxis is recommended to hedge against the foreign exchange risk by
using different types of derivative instruments. For example, Maxis can use the forward
foreign exchange contracts to hedge against the movement in exchange rates. So, the
price of commodities which denominated in foreign currency will not affected by the
arising of foreign exchange exposures. For the currency exposure from the financial
liabilities which denominated in foreign currency, Maxis is suggested to use cross
currency interest rate swap contracts. It is use to hedge against the fluctuation of interest
rate in the foreign currency denominated loans at the maturity of the loan borrowings.
Besides of the transactional hedging, Maxis is recommended to apply the natural
hedging which is low cost and easier to implement due to only changing the internal
structure. For example, Maxis is having high leverage due to the long term borrowing
which denominated in foreign currency, Maxis can use matching assets and liability
exposures to match the future inflows with borrowing or match the future outflows with
lending. Maxis can use the increase the future inflows in USD dollars to against the
long term borrowing which denominated in USD. Besides that, Maxis can implement

the asset and liability adjustments by holding monetary assets in strong currencies and
monetary liabilities in weak currencies.
In order to reduce the leverage level which increased dramatically, Maxis can issues
the shares to the public instead of borrowing. It can rise the company’s equity while
reduce the leverage ratio. So the borrowing can be reduce by using the capital gain from
public offering. Maxis also can use debt to equity swaps to reduce the amounts of
liabilities by agreeing to subscribe new shares to the creditors to reduce the amount of
debt.
6.0 Conclusion
In conclusion, Maxis is remaining as a top performing telecommunication company in
telecommunication industry due to the services and products provided by them.
However, based on the data from annual reports of the year 2011 to 2015, the ROA of
the Maxis is declined while the financial risks exposure is increasing. It indicates the
situation of company’s underperformed. Instead of the existing risks, there are having
another external and internal factors which will influence the performance of Maxis.
From the study, it shows the rise of leverage risk, market risk and net profit margin
have significant impact on the company’s ROA. Whilst the finding shows market risk
is the variable which has highest impact to the Maxis performance if compared to others
variables. Therefore, Maxis should focus on the alternatives which can avoid, mitigate,
or transfer the market risk which come from the foreign exchange risk and interest rate
risk. Types of alternatives should be included the improvement in corporate structures
and also the financial instruments. For examples, natural hedging, transactional hedging,
and establish the risk committee. The liquidity risk which the current ratio remaining
lesser than 0.8 from the year 2011 to 2015 has indicated inability to meet the short term
obligation when due date. In order to rise the Maxis performance, Maxis should focus
on the liquidity management although the study shows the current ratio is not significant
to the company performance.

References
Abdussalam Mahmoud, A.-T. (2006). An Empirical Study of Firm Structure and
Profitability. Journal of Economic and Administrative Sciences, 41-59.
Dr. Majed Abdel Majid, K., Dr. Said Mukhled Ahmed, A.-N., & Dr. Firas Naim, D.
(2012, June). The Relationship between the ROA, ROE and ROI Ratios with
Jordanian Insurance Public Companies Market Share Prices.
Hwang, J. H. (2015). Risk quanta: an approach to understanding modern financial risk.
Journal of Financial Regulation and Compliance, 179-195.
Jafari, M., Chadegani, A. A., & Biglari, V. (2011). Effective risk management and
company’s performance: Investment in innovations and intellectual capital
using behavioral and practical approach. Journal of Economics and
International Finance, 780–786.
Subramaniam, N., McManus, L., & Zhang, J. (2009). Corporate governance, firm
characteristics and risk management committee formation. Managerial
Auditing Journal, 316 - 339.
Waemustafa, W., & Suriani, S. (2015). Bank Specific and Macroeconomics Dynamic
Determinants of. International Journal of Economics and Financial Issues,
476-481.
Waemustafa, W., & Suriani, S. (2015). Mode of Islamic Bank Financing: Does
Effectiveness of Shariah Supervisory Board Matter? 458.
Waemustafa, W., & Suriani, S. (2016). Systematic and Unsystematic Risk
Determinants of Liquidity. International Journal of Economics and Financial
Issues, 1321-1327.
Zaid, N. A., Ibrahim, W. M., & Zulqernain, N. S. (2014, February). The Determinants
of Profitability: Evidence from Malaysian Construction Companies.

Appendix
Descriptive Statistics
Mean Std. Deviation N
ROA .106945 .0195265 5
Index score .760 .0548 5
Board-Remuneration 17609000.00 9546208.619 5
Size 18043367200.00 604443195.457 5
net profit margin .219785570894007 .038202342461398 5
Leverage 2.189519 .9467901 5
Market risk .051339 .0153814 5
Current ratio .570894 .1197197 5
GDP growth rate 5.30000 .494975 5
Inflation 2.43600 .681124 5
Unemployment rate 3.06000 .134164 5
Exchange rate 3.460000 .4916808 5
Appendix 1

Correlations
ROA
Inde
x
score
Board-
Remuneratio
n Size
net
profit
margi
n
Leverag
e
Marke
t risk
Curren
t ratio
GDP
growt
h rate
Inflatio
n
Unemploymen
t rate
Exchang
e rate
Pearson
Correlatio
n
ROA 1.00
0 -.732 -.501 -.269 .954 -.763 -.829 -.625 -.036 .469 -.427 -.542
Index score -.732
1.00
0 .478 .222 -.663 .787 .664 -.055 -.184 .028 .408 .641
Board-
Remuneration -.501 .478 1.000 .958 -.237 .905 .899 .139 .104 .027 .886 .944
Size -.269 .222 .958
1.00
0 .004 .746 .758 .076 .120 .068 .871 .862
net profit
margin .954 -.663 -.237 .004 1.000 -.556 -.634 -.629 .098 .605 -.244 -.329
Leverage -.763 .787 .905 .746 -.556 1.000 .966 .201 .055 -.033 .773 .920
Market risk -.829 .664 .899 .758 -.634 .966 1.000 .423 .100 -.224 .785 .877
Current ratio -.625 -.055 .139 .076 -.629 .201 .423 1.000 .433 -.582 .024 -.021

GDP growth
rate -.036 -.184 .104 .120 .098 .055 .100 .433 1.000 .470 -.339 -.198
Inflation .469 .028 .027 .068 .605 -.033 -.224 -.582 .470 1.000 -.276 -.071
Unemploymen
t rate -.427 .408 .886 .871 -.244 .773 .785 .024 -.339 -.276 1.000 .944
Exchange rate -.542 .641 .944 .862 -.329 .920 .877 -.021 -.198 -.071 .944 1.000
Sig. (1-
tailed)
ROA . .080 .195 .331 .006 .067 .041 .130 .477 .213 .237 .173
Index score .080 . .208 .360 .111 .057 .111 .465 .383 .482 .248 .122
Board-
Remuneration .195 .208 . .005 .350 .017 .019 .412 .434 .483 .023 .008
Size .331 .360 .005 . .497 .074 .069 .452 .424 .457 .027 .030
net profit
margin .006 .111 .350 .497 . .165 .125 .128 .438 .140 .346 .295
Leverage .067 .057 .017 .074 .165 . .004 .373 .465 .479 .063 .013
Market risk .041 .111 .019 .069 .125 .004 . .239 .436 .359 .058 .025
Current ratio .130 .465 .412 .452 .128 .373 .239 . .233 .152 .485 .487
GDP growth
rate .477 .383 .434 .424 .438 .465 .436 .233 . .212 .289 .375
Inflation .213 .482 .483 .457 .140 .479 .359 .152 .212 . .327 .455

Unemploymen
t rate .237 .248 .023 .027 .346 .063 .058 .485 .289 .327 . .008
Exchange rate .173 .122 .008 .030 .295 .013 .025 .487 .375 .455 .008 .
N ROA 5 5 5 5 5 5 5 5 5 5 5 5
Index score 5 5 5 5 5 5 5 5 5 5 5 5
Board-
Remuneration 5 5 5 5 5 5 5 5 5 5 5 5
Size 5 5 5 5 5 5 5 5 5 5 5 5
net profit
margin 5 5 5 5 5 5 5 5 5 5 5 5
Leverage 5 5 5 5 5 5 5 5 5 5 5 5
Market risk 5 5 5 5 5 5 5 5 5 5 5 5
Current ratio 5 5 5 5 5 5 5 5 5 5 5 5
GDP growth
rate 5 5 5 5 5 5 5 5 5 5 5 5
Inflation 5 5 5 5 5 5 5 5 5 5 5 5
Unemploymen
t rate 5 5 5 5 5 5 5 5 5 5 5 5
Exchange rate 5 5 5 5 5 5 5 5 5 5 5 5
Appendix 2
Model Summaryc
Model R R Square Adjusted R Square Std. Error of the Estimate Durbin-Watson
1 .954a .910 .881 .0067484
2 .997b .994 .988 .0021628 2.971
a. Predictors: (Constant), net profit margin
b. Predictors: (Constant), net profit margin, Market risk
c. Dependent Variable: ROA

ANOVAa
Model Sum of Squares df Mean Square F Sig.
1 Regression .001 1 .001 30.489 .012b
Residual .000 3 .000
Total .002 4
2 Regression .002 2 .001 162.022 .006c
Residual .000 2 .000
Total .002 4
a. Dependent Variable: ROA
b. Predictors: (Constant), net profit margin
c. Predictors: (Constant), net profit margin, Market risk

Coefficientsa
Model
Unstandardized Coefficients
Standardized
Coefficients
t Sig.
Collinearity Statistics
B Std. Error Beta Tolerance VIF
1 (Constant) .000 .020 -.012 .991
net profit margin .488 .088 .954 5.522 .012 1.000 1.000
2 (Constant) .051 .012 4.364 .049
net profit margin .367 .037 .717 10.010 .010 .598 1.673
Market risk -.474 .091 -.374 -5.216 .035 .598 1.673
a. Dependent Variable: ROA
Appendix 3


