Munich Personal RePEc Archive - uni-muenchen.de€¦ · · 2017-04-19Corporate Governance of Digi...
19
Munich Personal RePEc Archive Firm Risk and Performance: The Role of Corporate Governance of Digi Telecommunication Berhad sockyan Kiew UNIVERSITY UTARA MALAYSIA 16 April 2017 Online at https://mpra.ub.uni-muenchen.de/78313/ MPRA Paper No. 78313, posted 19 April 2017 11:21 UTC
Transcript of Munich Personal RePEc Archive - uni-muenchen.de€¦ · · 2017-04-19Corporate Governance of Digi...

MPRAMunich Personal RePEc Archive
Firm Risk and Performance: The Role ofCorporate Governance of DigiTelecommunication Berhad
sockyan Kiew
UNIVERSITY UTARA MALAYSIA
16 April 2017
Online at https://mpra.ub.uni-muenchen.de/78313/MPRA Paper No. 78313, posted 19 April 2017 11:21 UTC

BWRR3123 CORPORATE GOVERNANCE
1
BWRR 3123 CORPORATE GOVERNANCE
INDIVIDUAL ASSGINMENT
TITLE: CORPORATE GOVERNANCE, IMPACT OF FIRMS PERFORMANCES
AND RISK OF DIGI TELECOMMUNICATION BERHAD
NAME: KIEW SOCK YAN
MATRIX NO: 237772
GROUP: A
LECTURER NAME: DR. WAEIBRORHEEM WAEMUSTAFA

BWRR3123 CORPORATE GOVERNANCE
2
Firm Risk and Performance: The Role of Corporate Governance of Digi
Telecommunication Berhad
Kiew Sock Yan
University Utara Malaysia
ABSTRACT
The purpose of this study is to examine the corporate governance, the impacts of firm
performances and risk for telecommunication industry. This review additionally analysis the
value of profitability and liquidity ratio. The research involved the relationship between the
corporate governance, performances of company and the risk of Digi Telecommunication
Berhad within a five year period which from 2011 until 2015. The companies were from the
telecommunications sector and the data was obtained from the Digi company annual report.
The ratios examined were the return on assets (ROA), return on equity (ROE) and current
ratio, profitability, liquidity ratio and leverage of the company. A conclusion based solely on
the profitability and liquidity ratios of company. The results support the proposition that
analysis based on the profitability and liquidity ratios is best before reaching any conclusions
regarding the financial liquidity positions and have significant relationship between the firm
performances and risk of Digi companies.
Keywords: Macroeconomic, Performance, Profitability, Liquidity, Liquidity Risk
1.0 INTRODUCTION
Most recently, corporate governance has given a lot of attention in different industry.
Institutional investors have started evaluating which role corporate governance should play in
their investment policies. Policy makers began to concern the issues of corporate governance.
Some of the corporate governance mechanisms are viewed as the most crucial element for
effective corporate governance mechanisms for Malaysian companies such as the role,
composition, and structure of the board of directors (Hashim & Devi, 2008).
Besides, Malaysia economy was badly affected by 1997 financial crisis; many major
corporations in Malaysia have shut down. Corporate failure on financial crisis was a result of
poor corporate governance (Mitton, 2002). Due to this failure, some regulators in Malaysia
have taken effort to improve the corporate governance. There are Companies Commission of

BWRR3123 CORPORATE GOVERNANCE
3
Malaysia (CCM), Securities Commission (SC), Bursa Securities Malaysia (BM), Malaysia
Institute of Corporate Governance (MICG), and Malaysia Accounting Standards Board
(MASB).
The telecommunications sector has undergone a number of changes as a result of the
emergence of new technologies the demand to keep pace with these changes has in turn
meant that firms have had to invest heavily in order to remain competitive (Berg, 2004). The
Digi Telecommunication Sdn. Bhd. industry were analysis the effect of corporate governance
on firm performance that use two earnings based ratios to approximate firm performance that
is Return on Assets (ROA) and Return on Equity (ROE) and the liquidity ratio. It’s examines
the impact of a complete set of governance standards on firm performance approximated by
profitability ratios.
Digi Telecommunications Sdn. Bhd. was formerly known as Mutiara
Telecommunications Sdn. Bhd. and changed its name to Digi Telecommunications Sdn Bhd
in December 1998. The company was incorporated in 1990 and is based in Subang Jaya,
Malaysia. Digi Company is a part of the Telenor Group become a global telecommunications
provider and is listed on the main board of Bursa Malaysia Securities Berhad. This company
provides difference services like mobile voice, internet and digital services to 11 million
customers in Malaysia. In addition, Digi company also offers a mobile card payment solution
that allows SME and enterprise customers to accept payments and use the service at any
location where there is 2G, 3G, or 4G connectivity. Digi create value for their customers by
selecting the most appropriate cutting edge technology so that they benefit from products and
services that give them choice, convenience and control.
Furthermore, Digi Telecommunications Sdn Bhd (Digi) was announced as the winner
of the 'Best Malaysian Organisation' category for the LIFE@WORK Awards 2016, which
recognises and celebrates employers who champion diversity and inclusion in their
workplace. It is an honour to be recognised for Digi employee’s commitment to diversity and
inclusion in the workplace. Digi companies believed that the mix of talent, gender, culture,
experience, thoughts and values are what make the company better, stronger and more unique
Digi.
Vision of Digi Sdn Bhd is to be a company that is always “Changing the Game”. We
do this by constantly pushing boundaries, defining new standards and ensuring continuous
improvements in all parts of our business. While mission is deliver Internet for all as part of
our commitment to building a connected Malaysia enabling access to Mobile Internet

BWRR3123 CORPORATE GOVERNANCE
4
services and applications by offering customers the right combination of devices and value
pricing, as well as the best usage experience.
2.0 LITERATURE REVIEW
The main purpose of this research is to examine and investigate the relationship
between corporate governance, Digi firm performance and risk of telecommunication
industry. The dependent variable of this research study is the firm performance which is
measured by two financial ratios, Return on Assets (ROA) and Return on Equity (ROE)
while independent variable is current ratio. The investors care much on the ratios as these are
fundamental analysis of a company’s value.
According to Bairathi (2009), corporate governance can be defined as a set of systems
and processes which embrace how things are done within structural organization. Good
corporate governance is an integral part of the company’s management and business
philosophy. It goes beyond statutory form and is the key in building confidence of
stakeholder thereby key to long-term success.
According to Meyer (2003), definition of performance is assumed to be measured by
current financial results, while the performance in term of economic is defined by share
prices. Kothari (2005) suggested that performance matching on Return on Assets (ROA)
controls for the effect of performance on measured discretionary accruals. The results suggest
that performance-matched discretionary accrual measures enhance the reliability of
inferences from earnings management research when the hypothesis being tested does not
imply that earnings management will vary with performance, or where the control firms are
not expected to have engaged in earnings management.
For the purpose of the regression, the profitability measure was Return on Asset
(ROA) is calculated using Net Profit after Tax over Total Assets. Bashir (2000) suggested
that Return on asset (ROA) is what percentage of every dollar invested in the business was
returned to you as profit. Digi Berhad taking everything they own in the business such as any
assets like cash, inventory, facilities, equipment, machinery, vehicles and comparing that to
what you made these years in terms of profit. Furthermore, ROA simply shows how effective
your company is at using those assets to generate profit. In fact, an ROA that is higher than
the industry norm may suggest that the company did not renewing its assets for the future,
which will damage its long-term prospects.

BWRR3123 CORPORATE GOVERNANCE
5
However, Return on Equity (ROE) is what percentage of profit you make for every
dollar of equity invested in your company that suggest by Gallon, 2016. ROE calculated
using Net profit before tax divide shareholder’s equity. ROE using to measure the rate of
return on the ownership interest (shareholder's equity) of the common stock owners. If one of
the companies may have a higher ROE than another company because it borrowed more
money and therefore has greater liabilities and proportionately less equity invested in the
company. Whether this is a positive or a negative depends on whether the first company is
using its borrowed money judiciously (Gallon, 2016).
According Soenen (1993) indicates that operating cash flows generate by assets will
affect continuing firm liquidity. It is not only because of the value of liquidation firms with
fewer current assets will having problem in continuing their operations while if the current
assets are too much, it shows the return on investment is not in perfect condition. (Van Horne
and Wachowicz, 2000).
Morris and Shin (2010) conceptually defines the liquidity ratio as “realizable cash on
the balance sheet to short term liabilities.” Liquidity ratios measure a business' ability to meet
the payment obligations by comparing the cash and near-cash with the payment obligations
(Investopedia, 2017). If the coverage of the latter by the former is insufficient, it indicates
that the business might face difficulties in meeting its immediate financial obligations. This
can affect the company's business operations and profitability which suggests that empirical
evidence regarding the relationship between liquid ratios holdings and profitability for Digi
telecommunication.
Gallo (2016) suggest that the current ratio is simply determined by dividing the total
current assets by the total current liabilities to arrive at a ratio between the two amounts. The
analysis is a simple term relies on the ratio being an indicator or the benchmark of the ability
to pay for every dollar that is currently liable. The current ratio relied on the values identified
as current assets and current liabilities in the Statement of Financial Position.
According Stoica (2000) suggest that liquidity risk consist in the probability that the
organization should not be able to make its payments to creditors, as a result of the changes in
the proportion of long term credits and short term credits and the un-correlation with the
structure of organization's liability. According Waemustafa, W., & Sukri, S. (2016), the result
showed that Islamic bank dominates the liquidity performance result compared to Conventional
bank which represented with the mean percentage. The calculation of liquid variable measured by
cash plus short term market securities to total bank asset. The factor of this domination is due to

BWRR3123 CORPORATE GOVERNANCE
6
the lack of lender last resort and interbank money market and another one is the asset and liability
structure of Islamic bank.
3.0 DESCRIPTIVE ANALYSIS
Quantitative analysis techniques were adopted for this study. These included
profitability and liquidity ratios analysis, regression analysis and correlation analysis.
Absolute profit or income and liquid assets figures of the listed for telecommunications
industry were analysed and compared to see the trend within the period 2011 until 2015.
Using these types of the measurement can give company a general sense, especially in
comparison with competitors. In some industries it will use ROA to make decisions because
it is more useful to predict and to measure efficiency of each company. Furthermore,
adequate liquidity helps the telecommunication industry minimize liquidity risk and financial
crises. With clear understand of the risk creation process in equity-based financing, it allows
risk committee to come up with prudent and suitable risk management process.
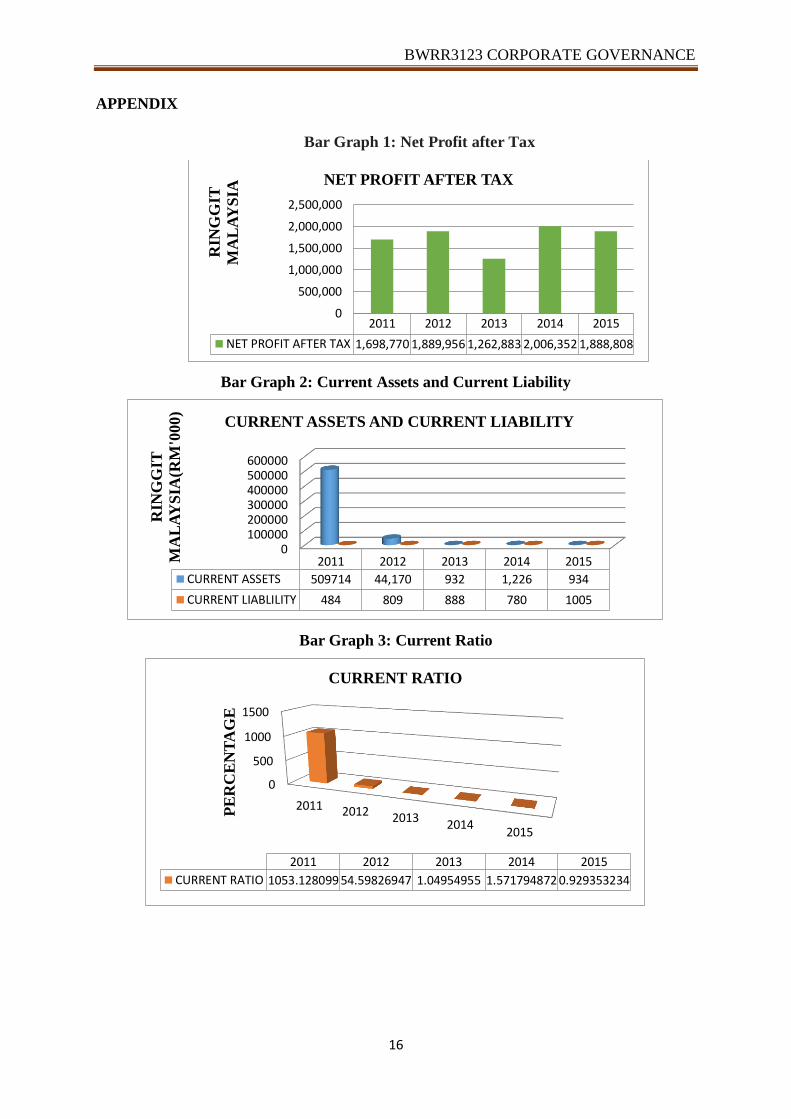
From bar graph 1 (refer appendix), in 2011 until 2015, the financial trends of net
profit after tax for Digi Sdn Bhd is fluctuated from 2011 until 2015 which from 2011 increase
the profit until 2012 but decreased in 2013 which from RM1889956 decline to RM1262883.
But in 2017 the net profit raise significantly which from RM1262883 to RM2006352 that
increase RM743469 but drop again in 2015 from RM2006352 to RM1888808. Generally, the
trends in Profit after Tax (PAT) of the average Digi Company had been increasing within the
period 2011-2014 that means the net profit after tax is stable for Digi companies. The
relationship of net profit will affect the investor to invest in this company.
Current assets are the value of all assets that can easily to be converted into cash
within one year. Current assets include cash and cash equivalents accounts receivable,
inventory, marketable securities, prepaid expenses and other liquid assets that can be readily
converted to cash. Current assets are important to businesses because they can be used to
fund day-to-day operations and pay ongoing expenses. Based on bar graph 2 (refer appendix),
the trends of financial current assets of Digi Sdn Bhd are decline dramatically from 2011
until 2015. It means that, the cash and cash equivalents in 2011 and 2012 which is
RM638000 in 2011 while in 2012 is RM2157000 that are better than the cash and cash
equivalents of 2013 until 2015 because it have high credit quality and are highly liquid and

BWRR3123 CORPORATE GOVERNANCE
7
company is able to pay its bills throughout a short period of time compare in year of 2013
until 2015 which just achieve RM923000 in 2013 and RM1216000 in 2014.
Current liabilities are a company's debts or obligations that are due within one year
which includes short term debt, account payables, accrued liabilities and other debts. The
trends of financial current liabilities of Digi Companies is increased from 2011 until 2013 but
decline back in 2014 and then incline back in 2015 which is RM1005. This fluctuated trend is
because of the trade and other payables which paid off the short term debt to the creditors.
Generally, from 2011 until 2015, Digi Sdn Bhd have a unique current assets and
current liabilities but it is represent the company have a good financial performance because
the current liabilities is smaller than the current assets.
The current ratio is a liquidity ratio that measures a company's ability to pay short-
term obligations. Based on bar graph 3 (refer appendix), Digi Sdn Bhd has a lower current
ratio of 0.929353234 in 2015. It’s indicates that the company may have difficulty meeting its
current obligations. A ratio under 1 indicates that a company’s liabilities are greater than its
assets and suggests that the company in question would be unable to pay off its obligations if
they came due at that point. While a current ratio below 1 show that the company is not in
good financial health, it does not necessarily mean that it will go bankrupt but it is definitely
not a good sign for company.
While, in 2011, the current ratio is greater than the other years which is 1053.128099
that is a very huge current ratio it is because the current assets RM509714 is more than
current liabilities RM484000. The higher the current ratio, the more capable the company is
of paying its obligations. Furthermore, a high ratio which is over 3 does not necessarily
indicate that a company is in a state of financial well-being either. This is depending on how
the company’s assets are allocated and a high current ratio may suggest that that company is
not using its current assets efficiently, is not securing financing well or is not managing its
working capital well.
Digi Sdn Bhd faced the liquidity risk from 2011 until 2015. Liquidity risk often
compare with short-term liabilities and liquid assets listed on the company’s financial
statements. Digi Berhad has too much liquidity risk which has RM509714 in 2011 current
assets that mean it must sell assets and bring in additional revenue or find another method of
shrinking the difference between available cash and debt obligations. So, the group monitors
and maintains a level of cash and cash equivalents deemed adequate by management, for
working capital purposes and to mitigate the effects of fluctuations in cash flows.

BWRR3123 CORPORATE GOVERNANCE
8
Bar Graph 4: Return on Assets and Return on Equity
Bar graph 4 (refer appendix) shows the Return on Assets (ROA) and Return on Equity
(ROE). It indicates that the profitability of the Digi Telecommunication Berhad has been
fluctuated from 2011 until 2015 which is show in the chart and table. These are shown by the
trend chart of Return on Assets and Return on Equity. Return on assets (ROA) is the Net
profit before tax over Total assets while, Return on equity (ROE) is the Net profit before tax
over Shareholder’s equity.
Based on bar graph 4, Digi Sdn Bhd recorded the higher ROA in 2014 which is
2.592263078. That mean the higher ratio will have the higher profitability and risk will
become higher. This is because when the profit is high or the more we get, the more risk will
face by company. Hence, Digi Sdn Bhd has the management’s efficiency at using assets
compare another years. Digi Sdn Bhd recorded the higher ROE in 2014 (2.594878149). That
mean the higher ratio, the amount of profit earned on each dollar invested by stockholders is
high. Hence, Digi Sdn Bhd is efficiency in uses investment funds at generating profits from
every unit of shareholders' equity also known as net assets or assets minus liabilities.
Bar Graph 5: Total Assets, Total Liabilities and Shareholder’s Equity
2011 2012 2013 2014 2015
ROA 1.324613147 2.313511343 1.632300309 2.592263078 2.441313971
ROE 1.325113243 2.315804693 1.634175946 2.594878149 2.44448931
00.5
11.5
22.5
3
ROA and ROE
2011 2012 2013 2014 2015
TOTAL ASSETS 1,282,465 816,921 773,683 773,977 773,685
SHAREHOLDERS' EQUITY 1,281,981 816,112 772,795 773,197 772,680
TOTAL LIABILITIES 484 809 888 780 1005
0200,000400,000600,000800,000
1,000,0001,200,0001,400,000
Rig
git
Mala
ysi
a (
RM
)
TOTAL ASSETS, TOTAL LIABILITIES AND
SHAREHOLDER'S EQUITY

BWRR3123 CORPORATE GOVERNANCE
9
Bar graph 5 shows the Total Assets, Total Liabilities and Shareholder’s Equity of the
average Digi Telecommunications Berhad from 2011 until 2015. It clearly indicates that the
Total Assets of the average Digi Telecommunications Berhad increased in 2011 then
decrease in the same pace which from RM1282465 decline to RM773685. While the trend of
the Total Liabilities generally increased within the period 2011-2015 which is from RM484
incline to RM880 for 2013 and then drop to RM780 and increase back to RM1005. It meant
that a very huge proportion of Digi Company with the total assets was financed by external
debt.
Generally, total assets for Digi Sdn Bhd is remained from 2011 until 2015 this is
because current assets of this company almost same in 2013 until 2015. Overall, total
liabilities from 2011 until 2015 almost the same amount. Shareholders' equity is calculated by
subtracting a company total liabilities from its total assets. From 2011 which is decreased to
RM816112 until 2015. This is influence by the total assets and total liabilities.
Line graph 1 (refer appendix) shows in appendix that the price change of Digi Sdn
Bhd is fluctuated from 2011 until 2015 which have upward and downward trends within
these 5 years. It meant that Digi price change is volatility which is more changes within 5
years. The highly of volatile stock or bond that can be a profitable investment if caught near
a bottom of price. When calculating daily volatility, the analyst calculates the percentage
price change from one business day to the next. Standard Deviation higher is more volatile
which is 0.135629735 movement fluctuated mean of Digi Sdn Bhd within 5 years is -
0.00027603. While the variance is 0.018395425.
Table Results 1: Descriptive Statistics Analysis for Digi Telecommunication Berhad
Mean Std. Deviation
Return on Assets (ROA) 2.060800369722815 .551518353155824
Return on Equity (ROE) 2.062892268129620 .552427721479892
Current Ratio 222.255413259441700 465.047539632519260
Leverage .000965473660706 .000351522869435
Size 884146.20 223449.179
Average Collection Period 99.7280 96.62214
Inflation Rate 2.580 .7463
Unemployment Rate 3.060 .1342
GDP 5.300 .4950
Exchange Rate 3.4600 .49168
Index Score .977777780 .0496903945
Remuneration
(Remuneration Committee) 547184.8140 82399.03440
The results of descriptive statistics for the variables are shown in Table 1. The mean
score of ROA is 2.060800369722815 indicates that Digi Company using assets effectively.

BWRR3123 CORPORATE GOVERNANCE
10
The mean score of 222.26 for current ratio indicates that on average current ratio in Digi
company have ability to paid short-term obligation. In addition, mean score of average
collection period is 99.7280 which is the average number of days it takes to convert
receivables into cash and it also marks the average number of days it takes customers to pay
their credit accounts which is a challenge on the prepaid market for Digi Berhad.
Table Results 2: Correlation Matrix Digi Telecommunication Berhad Determinants the
Profitability and Liquidity
PEARSON
CORRELATION ROA ROE CR LV S ACP IR UR GDP ER IS
ROA 1.000
ROE 1.000 1.000
Current Ratio -.742 -.742 1.000
Leverage .659 .660 -.944 1.000
Size -.737 -.738 .999 -.948 1.000
Average Collection
Period -.427 -.428 .650 -.727 .676 1.000
Inflation Rate -.479 -.479 .269 -.115 .237 -.514 1.000
Unemployment Rate .386 .386 -.266 .533 -.276 -.418 .090 1.000
GDP .518 .517 .012 -.252 .020 .150 -.393 -.339 1.000
Exchange Rate .486 .486 -.357 .589 -.375 -.655 .261 .944 -.198 1.000
Index Score .746 .747 -.999 .935 -.996 -.612 -.315 .250 .000 .330 1.000
Remuneration
(Remuneration
Committee)
.917 .918 -.853 .838 -.860 -.745 -.150 .499 .258 .657
Results 3: Coefficient Stepwise Regression analysis for Digi Telecommunication Berhad
Determinants the Profitability and Liquidity.
Model
Predicted
sign t Sig.
Current ratio + .001 1.611 .248
Leverage -.001 -5.042 .037
Size +.001 1.682 .235
Average Collection
Period +.001 1.242 .340
Inflation Rate +.000 -.579 .621
Unemployment Rate -.001 -1.156 .367
GDP +.001 6.240 .025
Exchange Rate -.001 -1.143 .371
Index Score -.001 -1.498 .273
Remuneration
(Remuneration
Committee)
-.002 -1.821 .210

BWRR3123 CORPORATE GOVERNANCE
11
a. Dependent Variables: Return on Assets (ROA)
b. Predictors in the Model (Constant): Return on Equity (ROE)
c. Predictors in the Model (Constant): Return on Equity(ROE), GDP
The results show from linear regression analysis ROA is significantly affected by only
ROE and GDP. Table 2 presents the outcomes of the regression analysis between the ROA,
ROE, current ratio and other variables. Beta of current ratio, size, averages collection period,
inflation rate and GDP has the positive relationship with ROE while beta of leverage,
unemployment rate, exchange rate, index score and remuneration has the negative
relationship with ROE. GDP has biggest number that influence by the T-value which is 6.240
significant. Positive significant relation that indicates the growth in GDP will accelerate the
overall profitability. This implies that the economic growth will increase the demand for Digi
services. This could generate more income which eventually it boosts profitability.
The Variance Inflation Factor (VIF) statistics indicate that multicollinearity does not
exist in the model as the values are less than 10. The finding of this study shows that liquidity
ratio is positively significant with ROA this implies that Digi Berhad adopt a strategy in
managing liquidity problem by maintaining sufficient cash reserve and at the same time Digi
Berhad are able to generate profit. The finding is consistent with previous studies Ghazali
(2008), who found a positive relationship between liquidity and ROA. Bourke (1989),
Kosmidou and Pasiouras (2005) also found a significant positive relationship between
liquidity and ROA.
From table 2, the correlation of ROE have positive relationship with ROA, leverage,
GDP, unemployment rate but have negative relationship with current ratio which is -0.742.
ROA and ROE significantly to GDP at 0.186. While, current ratio has negative relationship
with ROA and ROE which is same with -0.742 and has negative relationship with leverage
which is -0.944. According Waemustafa and Sukri (2015) suggest that the negative relation
could relate to the cash conversion which this company is mostly maintaining cash in reserve
with a conservative strategy.
But, current ratio has significantly to GDP at 0.076. For GDP have positive
relationship with ROA, ROE, current ratio, average collections period but have negative
relationship with inflation rate which -0.393, unemployment rate -0.339 and exchange rate -
0.198. Remuneration has positive relationship with ROA, ROE, leverage, GDP, exchange
rate and index score. Which have negative relationship with current ratio -0.853, average
collection period -0.745 and inflation rate -0.150. Leverage significantly to ROA and ROE
which at 0.113. Index score and remuneration have significantly to ROA and ROE which is

BWRR3123 CORPORATE GOVERNANCE
12
0.074 and 0.014 respectively. That is because the committee of company in operation
management will affect the assets and equity whether have play the major role or not in
company.
4.0 DISCUSSION AND RECOMMENDATION
Overall, the profitability and liquidity will give a big effect to Digi companies which
the profitability is higher will let financial performance of company become more stable.
However, since the GDP has the result with the highest t-value which are 6.240 indicates that
this variable impacted much on profitability measurements which are ROE. One of
profitability measurement has a significant relationship which is ROE to operate variable.
Therefore, the attention of the company into the profitability factor should become priority on
2015 onwards beside the GDP and liquidity to enhance the profitability.
If Digi Sdn Bhd has good long-term target, it may be able to borrow against those
prospects to meet current obligations or debt. The current ratio can give a sense of the
efficiency of a company's operating cycle or its ability to turn its product into cash.
Companies that have trouble getting paid on their receivables or have long inventory turnover
can run into liquidity problems because they are unable to alleviate their obligations. Because
business operations differ in each industry, it is always more useful to compare companies
within the same industry.
Corporate governance and firm performance which these two reasons why good
corporate governance increases firm value. First, good governance increases investor trust.
Investors might perceive well-governed firms as less risky and apply a lower expected rate of
return, which leads to a higher firm valuation. Secondly, as shown for example by Jensen and
Meckling (1976), better-governed firms might have more efficient operations, resulting in a
higher expected future cash-flow stream. Furthermore, adequate liquidity helps the
telecommunication industry minimize liquidity risk and financial crises. With clear
understand of the risk creation process in equity-based financing, it allows risk committee to
come up with prudent and suitable risk management process.
Therefore, this company should concern more to the corporate governance to reduce
any inefficiency or wastefulness that reducing the ability of a company in generating more
profit. Also, to keep up and enhance consistent productivity of this organization, the
implementation of liquidity management and inventory control with following the trend of

BWRR3123 CORPORATE GOVERNANCE
13
market should put into consideration as a part of profitability contribution although the
findings shows liquid as well as GDP is significant to profitability.
5.0 CONCLUSION
In conclusion, the objective of this study is to examine the corporate governance and
its impact for firm performance and the risk of telecommunication industry. There was a
good positive relationship between the profitability and the GDP of Digi Sdn Bhd. When
companies hold adequate liquid assets, their profitability would improve. The more generally,
this paper marks to address the relationship between profitability and liquidity ratio. So it is
concluded that profitability ratios which is ROA and ROE affect the GDP.
The analysis shows that an effective of ROE have significant bearing towards the
GDP. In addition, to maintain the performance in 2015 onwards, from the findings, one of
variable is significant (ROA) as a profitability variable to the operation with the highest
impact compared to all of variables.
This study provides evidence of the importance relationship between liquidity and
profitability. The analysis highlights the impacts of firm performance of the profitability ratio
and liquidity ratio in conducting an investigation of the financial statements of companies.
The implications of this study are that in essence the determination of firm performance that
provides a more holistic approach to the analysis of the liquidity position and profitability of
companies and in doing so becomes a means for making better decisions based on the data.
REFERENCES
A Euromoney Instituitional Investment Company. (2016). Company Profile of Digi Berhad.
Retrieved 5 March 2017, from https://www.emis.com/php/company-
profile/MY/DigiCom_Berhad_en_1660871.html
Bairathi, V. (2009). Corporate governance: A suggestive code. International
Research Journal, 11(6), 753-754.
Bashir, A. (2000). Determinants of Profitability and Rates of Return Margins in Islamic
Banks: Some Evidence from the Middle East, Grambling State University, Mimeo.
Bauer, Rob, Nadja Guenster, and Roger Otten. "Empirical evidence on corporate governance
In Europe: The effect on stock returns, firm value and performance." Journal of Asset
management 5.2 (2004): 91-104.
Berg, C. (2004).The Revolution in Telecommunications, Review-Institute of Public Affairs,
vol. 56. No. 4, 18-19.

BWRR3123 CORPORATE GOVERNANCE
14
Berhad, D.T.B (1995) Digi Telecommunication Berhad: Private company information.
Retrieved March 05, 2017 from
http://www.bloomberg.com/research/stocks/private/snapshot.asp?privcapId=5756504
Bursa Malaysia. (2017). Listed Companies: Company Profile. Retrieved March 03, 2017
From http://www.bursamalaysia.com/market/listed-companies/list-of-companies/plc-
profile.html?stock_code=6947
Digi Telecommunications Berhad. (2012). Annual Report. Retrieved 5 March 2017, from
http://www.digi.com.my/aboutus/media/annual_report.do
Gallo, A. (2016). A Refresher on Return on Assets and Return on Equity. Harvard
Business
Ghazali, M. (2008). The Bank-Specific and Macroeconomic Determinants of Islamic Bank
Profitability: Some International Evidence. Faculty of Business and Accountancy.
University of Malaya.
Hashim, H. A., & Devi, S. S. (2008). Board independence, CEO duality and accrual
management: Management evidence. Journal of Business and Accounting,
1(1), 27-46.
Jensen, M. C. and Meckling, W. H. (1976) ‘Theory of the Firm: Managerial Behavior,
Agency Costs and Ownership Structure’, Journal of Financial Economics, 3, 305–60
Kirkham, Ross. "Liquidity analysis using cash flow ratios and traditional ratios: The
Telecommunications sector in Australia." The Journal of New Business Ideas &
Trends 10.1 (2012): 1.
Kosmidou, K., Pasiouras, F. (2005). The Determinants of Profits and Margins in the Greek
Commercial Banking Industry: Evidence from the Period 1990-2002. Financial
Engineering Laboratory, Department of Production Engineering and Management,
Technical University of Crete Working Paper.
Kothari, Sagar P., Andrew J. Leone, and Charles E. Wasley. "Performance matched
Discretionary accrual measures." Journal of accounting and economics 39.1 (2005):
163-197.
Lartey, Victor Curtis, Samuel Antwi, and Eric Kofi Boadi. "The relationship between
Liquidity and profitability of listed banks in Ghana." International Journal of
Business and Social Science 4.3 (2013).
Liquidity Ratios, (2017). Retrieved 5 March 2017, from
http://www.investopedia.com/terms/l/liquidityratios.asp
Manzler, D. (2004). Liquidity, liquidity risk and the closed-end fund discount. Working paper,
University of Cincinnati

BWRR3123 CORPORATE GOVERNANCE
15
Meyer, M. W. (2003). Rethinking performance measurement: beyond the balanced
scorecard. United Kingdom: The press syndicate of The University of
Cambridge.
Mitton, T. (2002), A cross-firm analysis of the impact of corporate governance on the
East Asian financial crisis, Journal of Financial Economics, 64, 215-241
Return on Assets, (2017). Retrieved 5 March 2017, from
http://www.investopedia.com/terms/r/returnonassets.asp
Saleem, Qasim, and Ramiz Ur Rehman. (2011) "Impacts of liquidity ratios on
Profitability." Interdisciplinary Journal of Research in Business 1.7 (2011): 95-98.
Soenen, L. A. (1993), “Cash conversion cycle and corporate profitability”, Journal of Cash
Management, Vol. 13 No. 4 pp. 53-58
Van Horne, J. C. & Wachowicz, J. M. (2000), “Fundamentals of Financial Management”,
11thEd. New Jersy: Prentice Hall Inc.
Waemustafa, W., & Abdullah, A. (2015). Mode of Islamic bank financing: does effectiveness
Of shariah supervisory board matter?. Aust. J. Basic & Appl. Sci., 9(37): 458
Waemustafa, W., & Sukri, S. (2015). Bank specific and macroeconomics dynamic
Determinants of credit risk in Islamic banks and conventional banks. International
Journal of Economics and Financial Issues, 5(2), pp. 476-481.
Waemustafa, W., & Sukri, S. (2016). Systematic and unsystematic risk determinants of risk
between Islamic and Conventional banks. International Journal of Economics and
Financial Issues, issue 4, vol. 6, pp.1321-1327
Yahoo! Finance. (2017). Historical Data of Digi Telecommunications Berhad. Retrieved 19
March 2017, from
https://sg.finance.yahoo.com/quote/6947.KL/history?period1=1293811200&period2=
1451491200&interval=1mo&filter=history&frequency=1mohttps://www.emis.com/p
hp/company-profile/MY/DigiCom_Berhad_en_1660871.html
BWRR3123 CORPORATE GOVERNANCE
16
APPENDIX
Bar Graph 1: Net Profit after Tax
Bar Graph 2: Current Assets and Current Liability
Bar Graph 3: Current Ratio
2011 2012 2013 2014 2015
NET PROFIT AFTER TAX 1,698,770 1,889,956 1,262,883 2,006,352 1,888,808
0
500,000
1,000,000
1,500,000
2,000,000
2,500,000R
ING
GIT
MA
LA
YS
IA NET PROFIT AFTER TAX
0100000200000300000400000500000600000
2011 2012 2013 2014 2015
CURRENT ASSETS 509714 44,170 932 1,226 934
CURRENT LIABLILITY 484 809 888 780 1005
RIN
GG
IT
MA
LA
YS
IA(R
M'0
00
)
CURRENT ASSETS AND CURRENT LIABILITY
0
500
1000
1500
2011 2012 20132014
2015
PE
RC
EN
TA
GE
2011 2012 2013 2014 2015
CURRENT RATIO 1053.128099 54.59826947 1.04954955 1.571794872 0.929353234
CURRENT RATIO

BWRR3123 CORPORATE GOVERNANCE
17
LINE GRAPH 1: PRICE CHANGE OF DIGI SDN BERHAD FROM 2011 UNTIL
2015(DAILY)
Table Result 4: Coefficient Stepwise Regression Analysis for Digi Telecommunication
Berhad
-2
-1.5
-1
-0.5
0
0.5
1
1.51
50 99
148
197
246
295
344
393
442
491
540
589
638
687
736
785
834
883
932
981
1030
1079
1128
1177
1226
PRICE CHANGE
Model Summaryc
Model R
R
Square
Adjusted
R
Square
Std. Error of the
Estimate
Change Statistics
R
Square
Change F Change df1 df2
Sig. F
Change
1 1.000a 1.000 1.000 .000503218087545 1.000 4804709.923 1 3 .000
2 1.000b 1.000 1.000 .000136216341727 .000 38.943 1 2 .025
a. Predictors: (Constant), Return on Equity (ROE)
b. Predictors: (Constant), Return on Equity (ROE), GDP
c. Dependent Variable: Return on Assets (ROA)
Table Result 5: Anova Regression Analysis for Digi Telecommunication Berhad
ANOVAa
Model
Sum of
Squares df
Mean
Square F Sig.
1 Regression 1.217 1 1.217 4804709.923 .000b
Residual .000 3 .000
Total 1.217 4
2 Regression 1.217 2 .608 32786231.093 .000c
Residual .000 2 .000
Total 1.217 4
a. Dependent Variable: Return on Assets (ROA)
b. Predictors: (Constant), Return on Equity (ROE)
c. Predictors: (Constant), Return on Equity (ROE), GDP

BWRR3123 CORPORATE GOVERNANCE
18
Table Result 6: Descriptive Analysis for Digi Telecommunication Berhad
YEARS 2011 2012 2013 2014 2015
Net Profit After Tax 1,698,770 1,889,956 1,262,883 2,006,352 1,888,808
Total Assets RM'000 1,282,465 816,921 773,683 773,977 773,685
Total Liabilities RM'000 484 809 888 780 1005
Shareholder's Equity 1,281,981 816,112 772,795 773,197 772,680
Return on Assets (ROA) 1.324613147 2.313511343 1.632300309 2.592263078 2.441313971
Return on Equity (ROE) 1.325113243 2.315804693 1.634175946 2.594878149 2.44448931
Current Assets RM'000 509714 44,170 932 1226 934
Current Liabilities RM'000 484 809 888 780 1005
Current Ratio 1053.128099 54.59826947 1.04954955 1.571794872 0.929353234
Leverage 0.000377541 0.000991286 0.001149076 0.001008799 0.001300668
Size 1,282,465 816,921 773,683 773,977 773,685
Average Collection Period 205.48 205.48 35.62 24.66 27.4
Inflation Rate 3 1.3 3.2 2.7 2.7
Unemployment Rate 3 3 3 3 3.3
GDP 5.3 5.5 4.7 6 5
Exchange Rate 3.17 3.06 3.28 3.5 4.29
Index Score 0.8888889 1 1 1 1
Remuneration
(Remuneration committee) 423194 540000 527710 624244.07 620776
![ROA ROE[1]](https://static.fdocuments.net/doc/165x107/5571fab2497959916992dee8/roa-roe1.jpg)