
Multisubject fMRI Studies and Conjunction Analyses · the how conjunction analyses, employing...
12
Multisubject fMRI Studies and Conjunction Analyses K. J. Friston,* A. P. Holmes,* C. J. Price,* C. Bu ¨ chel,* and K. J. Worsley² *The Wellcome Department of Cognitive Neurology, Institute of Neurology, Queen Square, London, WC1N 3BG, United Kingdom; and ²Department of Mathematics and Statistics, McGill University, Montreal, Quebec H3A 2K6, Canada Received February 5, 1999 In this paper we present an approach to making inferences about generic activations in groups of sub- jects using fMRI. In particular we suggest that activa- tions common to all subjects reflect aspects of func- tional anatomy that may be ‘‘typical’’ of the population from which that group was sampled. These commonali- ties can be identified by a conjunction analysis of the activation effects in which the contrasts, testing for an activation, are specified separately for each subject. A conjunction is the joint refutation of multiple null hypotheses, in this instance, of no activation in any subject. The motivation behind this use of conjunc- tions is that fixed-effect analyses are generally more ‘‘sensitive’’ than equivalent random-effect analyses. This is because fixed-effect analyses can harness the large degrees of freedom and small scan-to-scan vari- ability (relative to the variability in responses from subject to subject) when assessing the significance of an estimated response. The price one pays for the apparent sensitivity of fixed-effect analyses is that the ensuing inferences pertain to, and only to, the subjects studied. However, a conjunction analysis, using a fixed- effect model, allows one to infer: (i) that every subject studied activated and (ii) that at least a certain propor- tion of the population would have shown this effect. The second inference depends upon a meta-analytic formulation in terms of a confidence region for this proportion. This approach retains the sensitivity of fixed-effect analyses when the inference that only a substantial proportion of the population activates is sufficient. r 1999 Academic Press Key Words: functional neuroimaging; fMRI; fixed and random effects; conjunctions; statistical inference INTRODUCTION This paper concerns the detection of common activa- tion foci in multisubject or single-subject multisession functional magnetic resonance imaging (fMRI) studies and addresses the issue of how to make inferences about activation effects when the degree of activation may differ from subject to subject or from session to session. This differential responsiveness, or differential sensitivity to evoked hemodynamic responses, means that the ‘‘fixed-effect’’ statistical analyses, commonly used in fMRI time-series analysis, may not be appropri- ate when trying to generalize inferences to the popula- tion from which the group was sampled. In what follows we describe one approach to this problem that ensures the validity of inferences while retaining the sensitivity of fixed-effect analyses. This approach uses conjunction analyses (Price and Friston, 1997) and depends upon recent advances in Gaussian field theory (Worsley, 1999). This paper is divided into two sections. In the first we introduce the distinction between fixed- and random- effect models, in relation to multisubject fMRI studies and differential subject- or session-specific responses. After considering the sources of these ‘‘session effects’’ we review conjunction analyses and how they can be used to make inferences about the particular subject studied and, using a meta-analytic strategy, the popula- tion from which they came. The second section is an empirical example of the approach as applied to a fMRI study of evoked responses in the visual system. These data have been used previously to demonstrate the feasibility of multisubject analyses with statistical parametric mapping (Bu ¨ chel et al., 1997). RANDOM- AND FIXED-EFFECT ANALYSES In Friston et al. (1995a) we presented a general framework for the analysis of functional neuroimaging time series that employs the general linear model, to create statistical parametric maps or SPMs and, in Worsley et al. (1996), a unified theory of Gaussian fields used in their interpretation. In fMRI data analysis the general linear model is variously known as Anova, AnCova, or multiple linear regression (Friston et al., 1995b). The general linear model has been elaborated to deal with temporal or serial correlations in fMRI time series (Friston et al., 1995b; Worsley and Friston, 1995) and has been applied in the analysis of blocked designs and event-related fMRI (Josephs et al., 1997; Friston et al., 1998). These approaches model the observed hemodynamic responses in terms of a linear NeuroImage 10, 385–396 (1999) Article ID nimg.1999.0484, available online at http://www.idealibrary.com on 385 1053-8119/99 $30.00 Copyright r 1999 by Academic Press All rights of reproduction in any form reserved.
Transcript of Multisubject fMRI Studies and Conjunction Analyses · the how conjunction analyses, employing...

ijttftaachst‘TlasaaesestTfpfiss
r
tfaams
NeuroImage 10, 385–396 (1999)Article ID nimg.1999.0484, available online at http://www.idealibrary.com on
Multisubject fMRI Studies and Conjunction Analyses
K. J. Friston,* A. P. Holmes,* C. J. Price,* C. Buchel,* and K. J. Worsley†*The Wellcome Department of Cognitive Neurology, Institute of Neurology, Queen Square, London, WC1N 3BG, United Kingdom;
and †Department of Mathematics and Statistics, McGill University, Montreal, Quebec H3A 2K6, Canada
Received February 5, 1999
stuatwtoar1
ieaAwustesdfp
ftcWugA1tt1dF
In this paper we present an approach to makingnferences about generic activations in groups of sub-ects using fMRI. In particular we suggest that activa-ions common to all subjects reflect aspects of func-ional anatomy that may be ‘‘typical’’ of the populationrom which that group was sampled. These commonali-ies can be identified by a conjunction analysis of thectivation effects in which the contrasts, testing for anctivation, are specified separately for each subject. Aonjunction is the joint refutation of multiple nullypotheses, in this instance, of no activation in anyubject. The motivation behind this use of conjunc-ions is that fixed-effect analyses are generally more‘sensitive’’ than equivalent random-effect analyses.his is because fixed-effect analyses can harness the
arge degrees of freedom and small scan-to-scan vari-bility (relative to the variability in responses fromubject to subject) when assessing the significance ofn estimated response. The price one pays for thepparent sensitivity of fixed-effect analyses is that thensuing inferences pertain to, and only to, the subjectstudied. However, a conjunction analysis, using a fixed-ffect model, allows one to infer: (i) that every subjecttudied activated and (ii) that at least a certain propor-ion of the population would have shown this effect.he second inference depends upon a meta-analytic
ormulation in terms of a confidence region for thisroportion. This approach retains the sensitivity ofxed-effect analyses when the inference that only aubstantial proportion of the population activates isufficient. r 1999 Academic Press
Key Words: functional neuroimaging; fMRI; fixed andandom effects; conjunctions; statistical inference
INTRODUCTION
This paper concerns the detection of common activa-ion foci in multisubject or single-subject multisessionunctional magnetic resonance imaging (fMRI) studiesnd addresses the issue of how to make inferencesbout activation effects when the degree of activationay differ from subject to subject or from session to
ession. This differential responsiveness, or differential o
385
ensitivity to evoked hemodynamic responses, meanshat the ‘‘fixed-effect’’ statistical analyses, commonlysed in fMRI time-series analysis, may not be appropri-te when trying to generalize inferences to the popula-ion from which the group was sampled. In what followse describe one approach to this problem that ensures
he validity of inferences while retaining the sensitivityf fixed-effect analyses. This approach uses conjunctionnalyses (Price and Friston, 1997) and depends uponecent advances in Gaussian field theory (Worsley,999).This paper is divided into two sections. In the first we
ntroduce the distinction between fixed- and random-ffect models, in relation to multisubject fMRI studiesnd differential subject- or session-specific responses.fter considering the sources of these ‘‘session effects’’e review conjunction analyses and how they can besed to make inferences about the particular subjecttudied and, using a meta-analytic strategy, the popula-ion from which they came. The second section is anmpirical example of the approach as applied to a fMRItudy of evoked responses in the visual system. Theseata have been used previously to demonstrate theeasibility of multisubject analyses with statisticalarametric mapping (Buchel et al., 1997).
RANDOM- AND FIXED-EFFECT ANALYSES
In Friston et al. (1995a) we presented a generalramework for the analysis of functional neuroimagingime series that employs the general linear model, toreate statistical parametric maps or SPMs and, inorsley et al. (1996), a unified theory of Gaussian fields
sed in their interpretation. In fMRI data analysis theeneral linear model is variously known as Anova,nCova, or multiple linear regression (Friston et al.,995b). The general linear model has been elaboratedo deal with temporal or serial correlations in fMRIime series (Friston et al., 1995b; Worsley and Friston,995) and has been applied in the analysis of blockedesigns and event-related fMRI (Josephs et al., 1997;riston et al., 1998). These approaches model the
bserved hemodynamic responses in terms of a linear1053-8119/99 $30.00Copyright r 1999 by Academic Press
All rights of reproduction in any form reserved.

casefttr
fejafbaacspjost
dsrrrefwftifsetiteavsgqaittsaos
v(semac
rvataod(riwocrttfvb
gsbttfmifittafmtmatptaaoosav
386 FRISTON ET AL.
ombination of expected effects (i.e., explanatory vari-bles, regressors, or covariates that comprise the ‘‘de-ign matrix’’) up to the level of autocorrelated residualrrors. These effects can range from stimulus wave-orms (inferred on the basis of changing task condi-ions) convolved with a hemodynamic response func-ion to basis functions of peristimulus time in event-elated fMRI.To date the application of the general linear model to
MRI time series has been largely restricted to fixed-ffect analyses. These analyses assume that each sub-ect makes the same, fixed contribution to the observedctivation and therefore discount random variationsrom subject to subject. The activation effect is assessedy comparing the contribution of the explanatory vari-bles, in terms of a linear compound or contrast of thessociated parameter estimates (i.e., regression coeffi-ients), and the residual or error variance to produce auitable statistic, usually the T or F statistic. Theroblem with using fixed-effect analyses in multisub-
ect designs is acutely apparent when comparing groupsf subjects. However, this paper is concerned with theimpler problem of making inferences about activa-ions in a single group of subjects.
For a given group of subjects, there is a fundamentalistinction between saying that the average response isignificant in relation to the variability of the subjects’esponses and that there is a significant response inelation to the variability about those subject-specificesponses. This distinction relates directly to the differ-nce between fixed- and random-effect analyses. Theollowing example tries to make this clear: Considerhat would happen if we scanned six subjects with
MRI during the performance of a single task, relativeo a baseline. We then constructed a statistical model,n which task-specific effects were modeled separatelyor each subject. Unknown to us, only one of theubjects activated a particular brain region. When wexamine the contrast of parameter estimates, assessinghe mean activation over all the subjects, we see that its greater than zero by virtue of this subject’s activa-ion. Furthermore because that model fits the dataxtremely well (modeling no activation in five subjectsnd a substantial activation in the sixth) the errorariance, on a scan-to-scan basis, is small and the Ttatistic is very significant. Can we then say that theroup shows an activation? On the one hand we can say,uite properly, that the mean group response embodiesn activation but clearly this does not constitute annference that the group’s response is significant (i.e.,hat this sample of subjects shows a consistent activa-ion). The problem here is that we are using thecan-to-scan error variance and this is not necessarilyppropriate for an inference about group responses. Inrder to make the inference that the group showed a
ignificant activation one would have to assess the fiariability in activation effects from subject to subjectusing the contrast of parameter estimates for eachubject). This variability now constitutes the properrror variance. In this instance the variance of these sixeasurements would be large relative to their mean
nd the corresponding T statistic would not be signifi-ant.The distinction between the two approaches above
elates to how one computes the appropriate errorariance. The first represents a fixed-effect analysisnd the second a random-effect analysis. In the formerhe error variance is estimated on a scan-to-scan basis,ssuming that each scan represents an independentbservation (ignoring serial correlations). Here theegrees of freedom are essentially the number of scansminus the rank of the design matrix). Conversely, inandom-effect analyses, the appropriate error variances based on the activation from subject to subject inhich the effect per se constitutes an independentbservation and the degrees of freedom fall dramati-ally to the number of subjects (minus one). The termandom-effect indicates that we have accommodatedhe randomness of differential responses by comparinghe mean activation to the variability in activationsrom subject to subject. Both analyses are perfectlyalid but only in relation to the inferences that areeing made.Let us assume that we want to make inferences that
eneralize to the population from which the subjectstudied were taken. The problem then is to chooseetween a fixed-effect and a random-effect analysis. Onhe one hand fixed-effect analyses will be more sensi-ive because they have substantially more degrees ofreedom and the scan-to-scan variability is typicallyuch less than the subject-to-subject response variabil-
ty. On the other hand, if there are random effects, thexed-effect analysis will be inappropriate and is likelyo be capricious if we want to generalize the inference tohe population from which our cases came. We havelready described the implementation of random ef-ects analyses in the context of statistical parametricapping (Holmes et al., 1998). In this paper we focus on
he how conjunction analyses, employing fixed-effectodels, can be used to make population inferences
bout qualitative responses (e.g., activated or not) inerms of confidence intervals for the proportion of theopulation showing an effect. The proposal here is noto substitute conjunction analyses for random-effectnalyses. Where the latter are indicated there is nolternative. This paper simply presents a formal devel-pment of the intuition that a careful characterizationf a small number of subjects, in a case-study sense, istill useful in establishing typical aspects of functionalnatomy. The use of conjunctions provides for a conser-ative approach to case studies that makes those
ndings, which may generalize, explicit.
srctofpsrtetad
tcdcsedtijigahtsotietrsMitifi
titw
esohte(
mepteanmaaisdiac
tsui
P
wpteptsttasis
wpsii
387MULTISUBJECT fMRI STUDIES AND CONJUNCTION ANALYSES
SOURCES OF SESSION-BY-CONTRASTINTERACTIONS
If one wants to make inferences about a group ofubjects the presence of random effects (i.e., differentialesponses or subject-by-condition interactions) must beonsidered. The variations in response from one subjecto another represent subject-by-condition interactionsr, more generally, session-by-contrast interactions (re-erred to colloquially as ‘‘session effects’’). They arerevalent in fMRI and their characterization repre-ents one of the current challenges in methodologicalesearch. Session effects are a important because (i)hey violate the assumptions of conventional fixed-ffect analyses and (ii) they confound differential activa-ions elicited by the experimental design (e.g., beforend after a drug, under different cognitive sets, or inifferent groups of subjects).From now on we refer to session-by-contrast interac-
ions, or session effects, and note that subject-by-ondition interactions are a special case in which aifferent subject is scanned in each session and theontrast specifies a condition-specific activation. Ses-ion effects can be divided into (i) physiological differ-nces in evoked responses and (ii) instrumentation-ependent differences in sensitivity when measuringhose responses. Differences in evoked responses can bentrinsic to a subject or reflect differences among sub-ects. Within-subject differences can be further dividednto task-specific (e.g., adaptation, learning, and strate-ic changes in cognitive or sensorimotor processing)nd nonspecific [e.g., variations in pCO2 secondary toyperventilation or global perfusion changes secondaryo changes in antidiuretic hormone secretion in theupine position]. Changes in sensitivity to a given bloodxygenation level-dependent effect can be attributableo many factors (e.g., radio-frequency and gradientnstabilities, recalibration of the scanner, repositioningffects, or differential shimming effects) and to interac-ions among all these factors. In short there are manyeasons to suppose that the activation measured in oneession could differ from that measured in another.any of these effects can be minimized or accounted for
n terms of post hoc modeling; however, their potentialo introduce session-by-contrast interactions makes itmportant to ensure the validity of inferences based onxed-effect analyses by accommodating them explicitly.
CONJUNCTION ANALYSES ANDSESSION-BY-CONTRAST INTERACTIONS
In Price and Friston (1997) we introduced a simpleechnique that was designed to identify context-nsensitive activations in a series of cognitive subtrac-ions, in other words, a technique that could identify
here several activations, in a series of subtractions, pach performed in a different context, were jointlyignificant (and not significantly different). The essencef this approach is to test for the conjunction of severalypotheses (each specified by a contrast) by assessinghe significance of the combined contrasts and thenliminating voxels that evidence significant differencesi.e., interactions) among the contrasts.
The present application of conjunction analysis isotivated from a slightly different perspective and
mploys some new results (see Worsley, 1999) thatrovide corrected P values for conjunction analyses. Inhe current application ‘‘jointly significant’’ implies thatach contrast survives some common threshold. Thepproach is, however, predicated on the same basicotion of jointly refuting a set of null hypotheses. Theotivation for conjunction analyses here is that they
llow for (i) an inference at the level of the fixed-effectnalysis based on the null hypotheses of no activationn any of the subjects studied and (ii) an inference at aecond level, about the population, in terms of a confi-ence interval for the proportion of the population thats likely to show the regionally specific effect identifiedt the first level. This second level inference is nowonsidered.If, for any given contrast, one can establish a conjunc-
ion of effects over n subjects using a test with apecificity of 1 2 a and sensitivity b, the probability,nder the null hypotheses, of this occurring by chance
s
1n2 5 ok50
n
P1n 0 k2 ? P1k2 5 ok50
n
1nk2 11 2 g2kgn2kakbn2k
5 [a (1 2 g) 1 bg]n,
(1)
here k is the number of subjects sampled that actuallyossess the effect and g is the proportion of the popula-ion (from which the subjects were sampled) with theffect. Here P(n) is the probability that n subjects testositive and is simply the sum of the probabilities ofhis happening for each possible selection in which kubjects actually have the effect. In turn this is given byhe binomial expansion above, where the probabilityhat a subject sampled at random shows the effect is gnd the probability of a positive test is a or b given theubject does or does not show the effect, respectively. as the P value of the test and b is its power orensitivity.1
1 It is of course possible to derive the probability of a conjunction inhich n is less than the number of subjects studied (e.g., therobability of obtaining a positive test in four, or more, of sixubjects). However, we do not pursue this here because the correspond-ng developments in Gaussian field theory, required for correctednferences, deal only with the situation in which all subjects test
ositive (see text).-
rw
PiitcfioltgtPs
wtgvt
ssarcacdayocws
stoqcet
s
ecscr
o
igvcesoti
rapavbotZcasec(t
om(rIpsaefmtiigp
388 FRISTON ET AL.
Now the probability above has an upper bound, inelation to some critical proportion gc, that is realizedhen (the generally unknown) b 5 1,
P1n 0 g # gc2 # 3a 11 2 gc2 1 gc4n. (2)
(n 0g # gc) is effectively a P value corresponding to annference about how typical the effect is. This inferences at a meta-analytical level and pertains to the popula-ion. This second-level inference is based on the classifi-ation of subjects (as being significant or not) using arst level of inference pertaining to each subject. Inther words, under the null hypothesis [at the secondevel] that the proportion of the population evidencinghis effect is less than or equal to gc, the probability ofetting a conjunction over n subjects is equal to, or lesshan, the left-hand side of Eq. (2). By setting(n 0g # gc) 5 ac (where ac . a) one obtains an expres-ion for this critical proportion,
gc $ac
1/n 2 a
1 2 a(3)
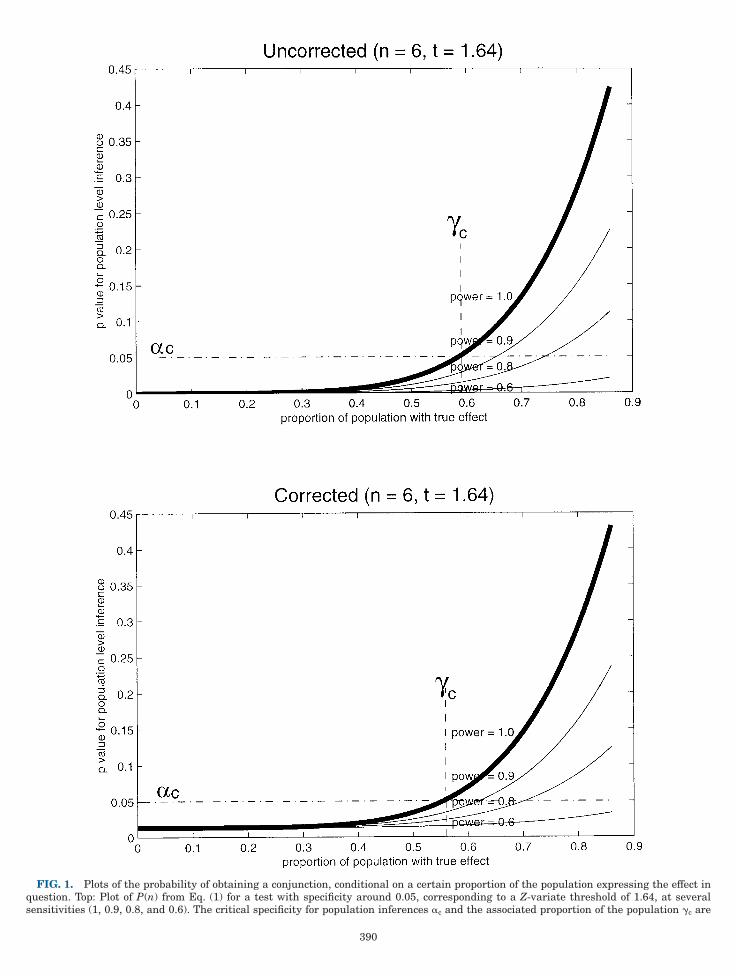
hich approaches unity as n gets large. ac correspondso specificity at the population level. Its relationship toc is depicted in the top of Fig. 1, which plots the Palues in Eq. (1) against the proportion of the popula-ion showing the effect.
In short a conjunction allows one to say, with apecificity of 1 2 ac, that more than gc of the populationhows the effect in question. Formally, we can view thisnalysis as a conservative 100(1 2 ac)% confidenceegion for the unknown parameter g. Specifically, theonfidence region is g . gc if the conjunction occurs, andll values of g if it does not. It can be checked that theoverage probability, i.e., the probability that the confi-ence region contains g, is at least (1 2 ac). Thispproach retains the sensitivity of fixed-effect analyseset still serves inferences about the population in termsf the proportion affected. These inferences can beonstrued as statements about how typical the effect isithout saying that it is necessarily present in every
ubject.
POPULATION LEVEL INFERENCESIN THE CONTEXT OF SPM
The above arguments pertain to the analysis of aingle test result (i.e., a single voxel). In a SPM analysishe inference may have to accommodate the fact thatne does not know in advance where the effect inuestion will arise. In this section we consider how aorrection for the search volume enters into the infer-nce about the proportion of individuals that are likely
o show that effect.A conjunction analysis of a multisubject/session fMRItudy comprises the following steps:(i) A design matrix is constructed in which the
xplanatory variables pertaining to each experimentalondition are replicated for each session. This subject-eparable design matrix implicitly models session-by-ondition interactions (i.e., different condition-specificesponses among sessions).(ii) Contrasts are then specified that test for the effect
f interest in each session to obtain a set of SPM5T6.(iii) These SPM(T ) are thresholded at u (correspond-
ng to some uncorrected specificity a) and combined toive the conjunction.2 If this combination is on aoxel-by-voxel basis a new SPM that tests for theonjunction is created. The ensuing SPM has twoquivalent interpretations: First it represents the inter-ection of the excursion sets, defined by the threshold u,f the subject-specific SPM5T6. Second it is an SPM ofhe minimum value of the T values, thresholded at u,.e., a SPM5Tmin6.
(iv) The corrected (for search volume) and uncor-ected P values associated with each voxel in SPM5Tmin6re now computed as described in the Appendix. These
values correspond to the null hypotheses of noctivation in any subject in which the uncorrected Palue is simply amin
n , where amin is the specificity giveny the threshold Tmin. The corrected P value Pn is basedn the new results of Worsley (1999; see Appendix). Forabular reporting of significant maxima we use the-variate equivalent of the uncorrected P value. Theseorrected or uncorrected P values provide for inferencesbout the particular subjects studied based on a subject-eparable fixed-effect analysis (the first level). How-ver, because we have demonstrated regionally specificonjunctions, we can now proceed to make an inferenceat a second level) about the population from whichhese subjects came.
2 This combination can be either in terms of the minimum T value,ver the set of contrasts, at each voxel (Tmin) or in terms of theinimum of the maximum T values in some volume of each SPM5T 6
Tmax). The former is a special case of the latter in which the volumeeduces to one voxel and is the case considered in the main text.nferences about the ensuing conjunction are then based on therobability of obtaining a maximum Tmin in a search volume of S. Theecond case, considered here, is when the minimum of Tmax is used asstatistic: For example, say one expected hippocampal responses in
very subject but wanted to allow for individual variations inunctional anatomy within the hippocampus. One could take the
aximum T values in a prespecified hippocampal volume and usehese Tmax to make an inference at the population level. In thisnstance the specificity a in Eq. (2) becomes the probability that anyndividual Tmax exceeds the threshold, in the specified volume, and isiven by Pn in the appendix, where n 5 1, i.e., P1. The criticalroportion is simply given by [cf. Eq. (3)]
gc $ac
1/n 2 P1.
1 2 P1

ec
btlwpbcccfoitpoctsw
P
TtataipsE
Iscwttcpctic
VMo9toydTsficpcrtftctdiasm
D.cnTtaw
p(
wicew
389MULTISUBJECT fMRI STUDIES AND CONJUNCTION ANALYSES
(v) For uncorrected or anatomically specified infer-nces the minimum proportion of the population impli-ated is simply
gc $ac
1/n 2 amin
1 2 amin, (4)
y Eq. (3). Note that for this proportion to be substan-ially bigger than zero the uncorrected P value must beess than ac. This will, of course, always be the casehen n is greater than one. To make inferences at theopulation level, which are corrected for the volume ofrain analyzed, the situation is a little more compli-ated and is based on the probability of getting aonjunction anywhere in the brain. In this instance theorrected P values Pn, at the subject level, enter asollows. The outcome space, subtending a conjunctionver the entire brain, has two partitions, a conjunctionn some region in which g of the population truly showhis effect and a chance conjunction elsewhere. Therobability of finding a conjunction anywhere is simplyne minus the probability that neither of these out-omes occurs. The probability of a positive outcome inhe true region of the effect (assuming this region ismall3) is P(n). The probability of a conjunction else-here is Pn, giving
1n2corrected 5 1 2 11 2 P1n22 11 2 Pn2
5 P1n2 11 2 Pn2 1 Pn $ P1n2.(5)
he bottom of Fig. 1 shows examples of P(n)corrected usinghe same threshold, range of population proportions,nd sensitivities as in the top (the equivalent probabili-ies for a single voxel). It can be seen that the correctiont the population level corresponds to a slight reductionn the critical proportion if, and only if, the chancerobability of a conjunction somewhere (Pn) is small. Byubstituting the corrected probability from Eq. (5) intoq. (2) the critical proportion is [cf. Eq. (4)]
gc $1ac 2Pn
1 2 Pn21/n
2 amin
1 2 amin. (6)
3 A more conservative assumption is that the true effect is ex-ressed over a large region. In the limit of the largest region possiblei.e., the search region) P(n) corrected becomes the first component of
[A 11 2 g2 1 Ibg4nb,
here A and b are defined in the Appendix. Although interesting forts symmetry with Eq. (1), this expression is based on unnecessarilyonservative and biologically implausible assumptions about the trueffect in the sense that regionally specific effect could occur ‘‘any-
shere’’ from subject to subject.
n summary the conjunction of a series of session-pecific contrasts represents the conjunction of signifi-ant effects among several sessions or subjects. In otherords they identify activations that are common to all
he sessions, in which these activations are inferred onhe basis of a fixed-effects model. The presence of aonjunction can be used to infer that at least someroportion of the population from which the subjectsame shows this effect. This inference about the popula-ion is made on the basis of establishing a confidencenterval for the proportion of subjects affected, given aonjunction.
AN fMRI EXPERIMENT
Experimental Design and Data Acquisition
The experiment was performed on a 2-T MagnetomISION (Siemens, Erlangen, Germany) whole-bodyRI system equipped with a head volume coil. Contigu-
us multislice T2* weighted fMRI images (TE 5 40 ms;0 ms/image; 64 3 64 3 32 3-mm3 voxels) were ob-ained with echoplanar imaging using an axial slicerientation. The effective repetition time was 3.22 s. Sixoung right-handed subjects were scanned under fourifferent conditions, each presented in 10-scan blocks.wo hundred image volumes were acquired for eachubject. During all conditions the subjects looked at axation point in the middle of a screen. In alternateonditions subjects viewed radially moving dots back-rojected on the screen by an LCD video projector. Inonditions with visual motion 250 white dots movedadially from the fixation point in random directionsoward the border of the screen, at 4.7° per second. Theour experimental conditions were ‘‘fixation,’’ ‘‘atten-ion,’’ ‘‘no attention,’’ and ‘‘stationary.’’ In the ‘‘attention’’ondition the subject was asked to ‘‘detect changes’’ inhe speed of the dots (which did not actually occur) anduring the ‘‘no attention’’ condition the subjects werenstructed to ‘‘just look.’’ The fourth condition, ‘‘station-ry,’’ consisted of 250 stationary dots. The first fewcans of each session were discarded to eliminateagnetic saturation effects.
Data Preprocessing
The data were analyzed with SPM96 (Wellcomeepartment of Cognitive Neurology, http://www.fil-
ion.ucl.ac.uk/spm). The time series were realigned,orrected for movement-related effects, and spatiallyormalized into the standard space of Talairach andournoux (1988) using the subject’s coregistered struc-ural T1 scan and nonlinear deformations (Friston etl., 1995c, 1996). The data were spatially smoothedith a 6-mm isotropic Gaussian kernel and temporally
moothed with a 6-s Gaussian kernel.
qs
FIG. 1. Plots of the probability of obtaining a conjunction, condiuestion. Top: Plot of P(n) from Eq. (1) for a test with specificity a
tional on a certain proportion of the population expressing the effect inround 0.05, corresponding to a Z-variate threshold of 1.64, at several
ensitivities (1, 0.9, 0.8, and 0.6). The critical specificity for population inferences a and the associated proportion of the population g are
c c390

cT2clmipamsosbsac‘taTata
jiiucgtsT22histsaw
tlTa
fibt(tcnct(gciotcao
mmtopcatspeatitw
tnsawcsaeen
dvT2
391MULTISUBJECT fMRI STUDIES AND CONJUNCTION ANALYSES
Statistical Analysis
The contrasts specified compared the visual motiononditions (‘‘attention’’ and ‘‘no attention’’) to ‘‘fixation.’’he design matrix and contrasts used are shown in Fig.(upper right). A design matrix is simply a matrix that
ontains the explanatory variables in its columns. Ainear compound of these columns that best approxi-
ates the observed time series in a least squares senses determined. The coefficients of this compound are thearameter estimates. Effects of interest are specified aslinear compound or contrast of the parameter esti-ates. Note that the explanatory variables (condition-
pecific stimulus functions convolved with an estimatef the hemodynamic response function) are replicatedeparately for each subject, therein modeling all subject-y-condition interactions. In Fig. 2 the contrasts arehown above the design matrix, in register with theirssociated explanatory variables. For each subject theseontrasts were [22, 1, 1, 0] pertaining to ‘‘fixation,’’‘attention,’’ ‘‘no attention,’’ and ‘‘stationary,’’ respec-ively. Furthermore note that subject-specific effectsre also included on the right of the design matrix.hese represent another source of random effects andre generally treated as confounds. Other confounds inhis design include low-frequency artifacts and globalctivity.The ensuing SPM5Tmin6 testing for a significant con-
unction of evoked responses in these subjects is shownn Fig. 2 (top left).All the voxels shown in this maximum-ntensity projection expressed a significant (P , 0.05ncorrected) activation in each of the subject-specificontrasts. It is pleasing to note that both lateraleniculate nuclei (LGN) were significant in this conjunc-ion analysis at a corrected level. The bottom of Fig. 2hows significant voxels rendered onto a T1 MRI scan.he locations of the associated LGN maxima were 24,30, 3 mm (Z 5 6.62, P , 0.001 corrected) and 224,27, 0 mm (Z 5 8.01, P , 0.001 corrected). The crossairs are over the right LGN. At the second level of
nference, according the Eq. (4), we can infer with apecificity of 0.05 that more than 60.6% of the popula-ion will activate the left LGN under these circum-tances. This proportion is very conservative in that itssumes that we are able to detect any such activationith 100% sensitivity (see Fig. 1).The contrast of parameter estimates corresponding
o visual activation are shown in the top of Fig. 3 for theeft LGN and a voxel in right V1/V2 (26, 296, 6 mm).he units are dimensionless and correspond to percent-ge of the whole-brain mean. The raw (adjusted) and
enoted by the broken lines. Bottom: As for the top, but in this caseolume (that of the fMRI example used in this paper) of 45,415 voxelhis corresponds to P(n)corrected in Eq. (5) where Pn was computed as
705].tted responses in the V1/V2 voxel are shown in theottom of Fig. 3 to demonstrate the reproducibility ofhe response over subjects. This degree of consistencyi.e., absence of session effects) is largely attributable tohe conjunction analysis. Consider the example timeourse in Fig. 4. Here the second subject clearly domi-ates the responses and there is no evidence for aonjunction. This voxel was identified using a contrasthat tested for an average activation over subjectsupper right) and represents a characterization ofroup responses using a fixed-effect analysis withoutonjunctions. This voxel came from the right posteriornferior frontal gyrus (48, 6, 24 mm) and had a Z scoref 8.13 (P , 0.001 corrected). It is important to notehat this region may still be ‘‘activated’’ according to theontrast used; however, in this instance a fixed-effectnalysis is not appropriate for population inference andne would have to use a random-effect analysis.
DISCUSSION
We have presented one approach to the problem ofaking inferences about activations in multisubject orultisession single-subject designs with fMRI. Activa-
ions common to all the subjects studied reflect aspectsf functional anatomy that may be ‘‘typical’’ of theopulation from which the group was sampled. Theseommonalities can be identified with a conjunctionnalysis. The motivation behind this use of conjunc-ions is that fixed-effect analyses are generally moreensitive than equivalent random-effect analyses. Therice one pays for the increased sensitivity of fixed-ffect analyses is that the ensuing inferences pertain to,nd only to, the subjects studied. However a conjunc-ion analysis, using a fixed-effect model, allows one tonfer: (i) that every subject studied activated and (ii)hat at least a certain proportion of the populationould have shown this effect.The relationship between conjunction analyses, of
he sort proposed here, and random-effect analyseseeds to be pursued. However, any comparison will beomewhat complicated by the fact that the questionssked by the two approaches are framed in differentays. The conjunction approach effectively finds the
onfidence region for the proportion of the populationhowing a categorical effect, whereas the random-effectnalysis asks whether the effect is significantly differ-nt from zero in quantitative terms. The critical differ-nce is that conjunction analyses allow some subjectsot to show an effect and only requires that a substan-
conditional probability P(n)corrected is corrected for a typical searchith a FWHM smoothness of 2.6 voxels (i.e., 2705 resels) in a SPM5Z6.cribed in the Appendix giving Pn 5 0.0133 and R 5 [1 34.57 469.43
thes wdes

cc
FIG. 2. Upper right: Design matrix employed in the conjunctionorresponds to stimulus functions for each of the four photic stimulatio
analysis. The left-hand partition contains the effects of interest andn conditions convolved with a hemodynamic response function. The four
onditions are replicated for each of the six subjects. The order of the conditions is ‘‘fixation,’’ ‘‘attention’’ to visual motion, ‘‘no attention’’ to
392

ttifddpsaT
aapsoepr
aattaPiieeftesiosdb
isfeei
aesafiauiiaa
aascciTai
tmtaeWiiamt
wm1ma
vfmppSser
393MULTISUBJECT fMRI STUDIES AND CONJUNCTION ANALYSES
ial proportion do. The random-effect analysis positshat the average effect will be bigger than zero. Compar-ng the sensitivity of the two approaches would there-ore involve assessing the power or sensitivity of ran-om-effect analyses, in relation to the probability ofetecting a conjunction, for a specified proportion of theopulation evidencing the effect. This would involve thepecification of this proportion, the size of the effect,nd the within- and between-subject error variances.his sort of comparison is the subject of future work.It is important to reiterate that conjunction analyses
re not a substitute for random-effect analyses, theyre simply an extension of fixed-effect analyses thatrovide a confidence interval for the proportion of allubjects showing the effect. One application (pointedut by one of the reviewers) is that pilot studiesmploying conjunction analyses might be a usefulrelude to studies of large numbers of subjects that areequired by random-effect analyses.In this paper we have restricted our comments to the
nalysis of fMRI time series. It is of course possible topply exactly the same approach to multisubject posi-ron emission tomography (PET) studies. The advan-age of doing this is that robust inferences can be madebout group effects. Why has this not been an issue forET? The main reason is that the scan-to-scan variabil-
ty within a PET session and the session-by-contrastnteractions are about the same in PET and the differ-nce between inferences based on fixed- and random-ffect analyses is greatly attenuated. Conversely inMRI the scan-to-scan variability can be much less thanhe session-to-session differences because (i) fMRI isxquisitely sensitive to small scan-to-scan changes inignal (cf. PET, in which a new bolus of radiotracer isnjected at each scan), (ii) there are many more sourcesf session effects in fMRI (as noted above), and (iii) thecan-to-subject ratio is much higher for fMRI (this ratioictates the relative weights given to the within- andetween-subject variance in random-effect analyses).It is likely that random-effect analyses will become
ncreasingly important in fMRI, especially when thephere of inference has to be extended to the populationrom which subjects were selected (or a subject’s gen-ral response when scanned on any occasion). A goodxample of the danger of using fixed-effect analyses isn the study of gender-related differences in functional
isual motion, and ‘‘stationary.’’ The remaining partitions (left to rrequency confounds (a discrete cosine set), and whole brain activity. Tatrix. There is one contrast per subject. Upper left: SPM5Tmin6 testi
rojection of a statistical process of the minimum T statistic over arojections in an anatomical space conforming to that described inPM5Tmin6 has been thresholded at 1.65 (P , 0.05 uncorrected). Bottomcan to demonstrate the location of the LGN responses in this analysffects were 24, 230, 3 mm (Z 5 6.62, P , 0.001 corrected) and 224,
ight LGN.natomy (Price and Friston, 1996). To make an infer-nce that men and women activate differently in re-ponse to the same cognitive challenge one has to adoptrandom-effect analysis or qualify the validity of the
xed-effect analysis as proposed in this paper. Onedvantage of the fixed-effect analysis is that, with these of appropriate contrasts, the subject-by-contrast
nteractions can be examined explicitly. This may be ofnterest when trying to characterize intersubject vari-bility. From the perspective of the random effectsnalysis this variability simply constitutes error.The proposal here is not to substitute conjunction
nalyses for random-effect analyses. Where the latterre indicated there is no alternative. This paper isimply an endorsement of the intuition that carefulharacterizations of small numbers of subjects, in aase-study or fixed-effect analysis sense, are still usefuln establishing typical aspects of functional anatomy.he use of conjunctions provides for a conservativepproach to these case studies that makes those find-ngs, that may generalize, explicit.
APPENDIX
In this Appendix we present the equations that givehe corrected P value Pn for a conjunction of effects inultiple SPMs of any statistic using (i) the unified
heory described in Worsley et al. (1996) that can bepplied to any specified search volume and (ii) thextension for intersections of multiple SPMs given inorsley (1999). A conjunction can be modeled as the
ntersection of the excursion sets A1, . . ., An of nsotropic random fields X1, . . ., Xn in RD (or equivalentlysingle D-dimensional field whose values comprise theinimum value of X1, . . ., Xn) conjointly thresholded at
. By the Poisson clumping heuristic
Pn 5 1 2 e2c0, (A.1)
here c0 is an estimate of the expected number ofaxima in the conjunction (Adler, 1981; Friston et al.,
994). The expected number of maxima is approxi-ated by the Euler characteristic of the conjunction
nd is the first component of (Worsley, 1999)
t) comprise session or subject-specific effects, session-specific low-contrasts used are shown above their respective effects in the designfor the significance of the conjunction. This is a maximum-intensityix subjects. The format is standard and provides three orthogonallairach and Tournoux (1988). The gray scale is arbitrary and theignificant voxels from the SPM5Tmin6 rendered onto a structural MRI
Both LGN were significant at a corrected level. The maxima of these7, 0 mm (Z 5 8.01, P , 0.001 corrected). The cross hairs are over the
ighhe
ngll sTa: S
is.22

a e extrastriate voxel plotted over all sessions and subjects (i.e., scans).
394 FRISTON ET AL.
FIG. 3. Top: Parameter estimates for a voxel in left LGN and Vnalysis. Bottom: Adjusted (dots) and fitted (solid line) responses in th
1/V2 (26, 296, 6 mm) and their standard errors from the fixed-effect

b at 48, 6, 24 mm (Z 5 8.13, P , 0.001 corrected).
395MULTISUBJECT fMRI STUDIES AND CONJUNCTION ANALYSES
FIG. 4. Top: As for Fig. 2, but in this instance there is only one conut in this instance one subject clearly dominates. The voxel here was
trast testing for an average effect over all subjects. Bottom: As for Fig. 3,

c
w
TotdfEtitsp0
TdranusfiF
rt
AB
F
F
F
F
F
H
J
P
P
T
WW
W
396 FRISTON ET AL.
5 (c0, c1, ? ? ?, cD2 An ? b
5 1h0r0 1t2, h1r1 1t2,· · ·, hDrD 1t2
0, h0r0 1t2,· · ·, hD21rD21 1t2···
······
···0, 0, · · ·, h0r0 1t2
2n
1R0 /h0
R1 /h1···
RD /hD2 ,
here
hi 5 Îp/G1i 1 1
2 2 5i 5 0, . . . , D6. (A.2)
he expected diameter, area, volume, etc., can bebtained from the remaining components. These expec-ations are functions of the Euler characteristic (EC)ensities ri(t) and the Resel counts Rj. Both are definedor a variety of statistics in Worsley et al. (1996). TheC densities in matrix A are a function of, and only of,
he statistical value t and play a role analogous to thentegral under the statistic’s probability density func-ion pdf(t) under the null hypothesis in conventionaltatistics (i.e., the expected number of false positiveser i-dimensional volume. For a point (i.e., one test) i 5and
r0 5 et
`
pdf1t2.dt. (A.3)
he Resel counts Rj in vector b are simply the j-imensional volume of the search expressed in terms ofesolution elements or Resels. This can be construed asvolume measure normalized by the spatial smooth-
ess. This smoothness is estimated in the usual way,sing the variances of the first partial derivatives of thetatistic’s component fields (in practice the residualelds that ensue during the computation of the SPM).or a point R 5 1 and the P value for a conjunction
0educes to r0n, as one might expect for a single statistical
est.
ACKNOWLEDGMENT
This work was funded by the Wellcome Trust.
REFERENCES
dler, R. J. 1981. The Geometry of Random Fields. Wiley, New York.uchel, C., Turner, R., and Friston, K. 1997. Lateral geniculateactivations can be detected using intersubject averaging and fMRI.Magn. Reson. Med. 38:691–694.
riston, K. J., Frith, C. D., Turner, R., and Frackowiak, R. S. J. 1995a.Characterising evoked hemodynamics with fMRI. NeuroImage2:157–165.
riston, K. J., Holmes, A. P., Poline, J.-B., Grasby, P. J., Williams,S. C. R., Frackowiak, R. S. J., and Turner, R. 1995b. Analysis offMRI time-series revisited. NeuroImage 2:45–53.
riston, K. J., Ashburner, J., Frith, C. D., Poline, J.-B., Heather, J. D.,and Frackowiak, R. S. J. 1995c. Spatial registration and normalisa-tion of images. Hum. Brain Mapp. 2:165–189.
riston, K. J., Williams, S., Howard, R., Frackowiak, R. S. J., andTurner, R. 1996. Movement related effects in fMRI time series.Magn. Reson. Med. 35:346–355.
riston, K. J., Josephs, O., Rees, G., and Turner, R. 1998. Nonlinearevent-related responses in fMRI. Magn. Reson. Med. 39:41–52.olmes, A. P., and Friston, K. J. 1998. Generalizability, randomeffects, and population inference. NeuroImage 7:S754.
osephs, O., Turner, R., and Friston, K. J. 1997. Event-related fMRI.Hum. Brain Mapp. 5:243–248.
rice, C. J., and Friston, K. J. 1996. Getting sex into perspective.NeuroImage 3:S34.
rice, C. J., and Friston, K. J. 1997. Cognitive conjunction: A newapproach to brain activation experiments. NeuroImage 5:261–270.
alairach, J., and Tournoux, P. 1988. A Co-planar Stereotaxic Atlas ofa Human Brain. Trieme, Stuttgart.orsley, K. J. 1999. Tests for conjunctions. Submitted for publication.orsley, K. J., and Friston, K. J. 1995. Analysis of fMRI time-seriesrevisited—Again. NeuroImage 2:173–181.orsley, K. J., Marrett, S., Neelin, P., Vandal, A. C., Friston, K. J., andEvans, A. C. 1996. A unified statistical approach for determiningsignificant signals in images of cerebral activation. Hum. BrainMapp. 4:58–73.


![Constraint Modelling Challenge 2005 In conjunction with ...and Beldiceanu & Carlsson [3] both impose a fixed order on the first two variables selected, corresponding in both cases](https://static.fdocuments.net/doc/165x107/60b02e3db7694759931ca7bd/constraint-modelling-challenge-2005-in-conjunction-with-and-beldiceanu-.jpg)


