Multiplexing with Multispectral Imaging: From Mice to Microscopy
10
Seeing life in a new light Nuance TM and Maestro TM Imaging Systems Richard M Levenson 1 , David T. Lynch 1 , Hisataka Kobayashi 2 , Joseph M. Backer 3 , Marina V. Backer 3 1 CRI Inc., 35B Cabot Road Woburn, MA 01801, 2 Molecular Imaging, NIH, Bethesda, MD, 3 SibTech Inc. Newington, CT Multiplexing with Multispectral Imaging: From Mice to Microscopy Microscope-based multispectral techniques form an excellent complement to in-vivo imaging. ABSTRACT Increasing sophistication in the design and interrogation of biological models, and the advent of novel fluorescent probes have led to new demands on molecular imaging systems to deliver enhanced sensitivity, reliable quantitation, and the ability to resolve multiple simultaneous signals. Sensitivity is limited, especially in the visible spectral range, by the presence of ubiquitous autofluorescence signals (mostly arising from skin and gut), which need to be separated from those of targeted fluorophores. Fluorescence-based imaging is also affected by absorbing and scattering properties of tissue in the visible and to a lesser extent in the near-infrared (NIR). However, the small size of typical animal models (usually mice) often permit the detection of enough light arising even from relatively deep locations to allow capture of signals with acceptable signal-to-noise. Multispectral imaging, through its ability to separate autofluorescence from the label fluorescence, can increase sensitivity by as much as 300 fold compared to conventional approaches, and concomitantly improves quantitative accuracy. In the NIR region, autofluorescence, while still significant, poses less of a problem. However, the task of disentangling signals from multiple fluorophores remains. Multispectral imaging allows the separation of five or more fluorophores, with each signal quantitated and visualized separately. Preclinical small-animal imaging is often accompanied by microscopic analysis, both before and after the in-vivo phase. This can involve tissue- culture manipulations and/or histological examination of fixed or frozen tissue. Due to the same advantages already discussed with respect to sensitivity, quantitation and multiplexing, microscopy-based multispectral techniques form an excellent complement to in-vivo imaging. Key Words: in-vivo imaging, fluorescence, autofluorescence, multiplexing, reagents Abbreviations used in this article: MSI, multispectral imaging; LCTF, liquid crystal tunable filter; NIR, near-infrared; RGB, red-green-blue; CCD, charge-coupled device; QD, quantum dot OVERVIEW Fundamental research of biological processes at the cellular level has transformed our understanding of disease pathology. However, while many of the biochemical pathways involved in disease processes are being elucidated in isolated cellular systems, the complexities of biomolecular signaling pathways and their pathogenic contribution at the tissue, organ, and system level may be more appropriately studied in intact vertebrate systems. Accordingly, with the advent of molecular and functional in-vivo imaging, the scientific community is extending cell-based assays into small-animal models to provide system-level contexts. While there is certainly a basic-science aspect to this work, clinical drug development increasingly relies on small-animal imaging for many facets of lead qualification, efficacy assessments, toxicity determinations, and biomarker discover and validation. Small mammals, typically mice and rats, thus play an important role in biomedical research. These models are desirable due to low cost of maintenance and housing, short reproductive cycle, availability, and portability. Over the last decade, a dramatic increase in mouse utilization has occurred, in part because of the flexibility of the mouse genome. The mouse genotype can be manipulated almost at will, providing a unique tool in evaluating the effects of targeted manipulations on the phenotype of a mammalian system. The widespread use of transgenic murine systems, along with the development of ‘smart’ molecular reagents that can visualize and track probes in vivo, has spurred the development of numerous preclinical imaging systems. The ability to perform relevant, minimally or non-invasive imaging helps reduce Combined macro- and micro-imaging of bidirectional axillary lymphatic flows from the mammary pad (Figure 6)
Transcript of Multiplexing with Multispectral Imaging: From Mice to Microscopy
Seeing life in a new lightNuanceTM and MaestroTM Imaging Systems
Richard M Levenson1, David T. Lynch1, Hisataka Kobayashi2, Joseph M. Backer3, Marina V. Backer3
1CRI Inc., 35B Cabot Road Woburn, MA 01801, 2Molecular Imaging, NIH, Bethesda, MD, 3SibTech Inc. Newington, CT
Multiplexing with Multispectral Imaging: From Mice to Microscopy
Microscope-based multispectral techniques form an excellent complement to in-vivo imaging.
ABSTRACT
Increasing sophistication in the design and interrogation of biological models, and the advent of novel fluorescent probes have led to new demands on molecular imaging systems to deliver enhanced sensitivity, reliable quantitation, and the ability to resolve multiple simultaneous signals. Sensitivity is limited, especially in the visible spectral range, by the presence of ubiquitous autofluorescence signals (mostly arising from skin and gut), which need to be separated from those of targeted fluorophores. Fluorescence-based imaging is also affected by absorbing and scattering properties of tissue in the visible and to a lesser extent in the near-infrared (NIR). However, the small size of typical animal models (usually mice) often permit the detection of enough light arising even from relatively deep locations to allow capture of signals with acceptable signal-to-noise. Multispectral imaging, through its ability to separate autofluorescence from the label fluorescence, can increase sensitivity by as much as 300 fold compared to conventional approaches, and concomitantly improves quantitative accuracy. In the NIR region, autofluorescence, while still significant, poses less of a problem. However, the task of disentangling signals from multiple fluorophores remains. Multispectral imaging allows the separation of five or more fluorophores, with each signal quantitated and visualized separately. Preclinical small-animal imaging is often accompanied by microscopic analysis, both before and after the in-vivo phase. This can involve tissue-culture manipulations and/or histological examination of fixed or frozen tissue. Due to the same advantages already discussed with respect to sensitivity, quantitation and multiplexing, microscopy-based multispectral techniques form an excellent complement to in-vivo imaging.
Key Words: in-vivo imaging, fluorescence, autofluorescence,
multiplexing, reagents
Abbreviations used in this article: MSI, multispectral imaging; LCTF, liquid crystal tunable filter; NIR, near-infrared; RGB, red-green-blue; CCD, charge-coupled device; QD, quantum dot
OVERVIEW
Fundamental research of biological processes at the cellular level has transformed our understanding of disease pathology. However, while many of the biochemical pathways involved in disease processes are being elucidated in isolated cellular systems, the complexities of biomolecular signaling pathways
and their pathogenic contribution at the tissue, organ, and system level may be more appropriately studied in intact vertebrate systems. Accordingly, with the advent of molecular and functional in-vivo imaging, the scientific community is extending cell-based assays into small-animal models to provide system-level contexts. While there is certainly a basic-science aspect to this work, clinical drug development increasingly relies on small-animal imaging for many facets of lead qualification, efficacy assessments, toxicity determinations, and biomarker discover and validation.
Small mammals, typically mice and rats, thus play an important role in biomedical research. These models are desirable due to low cost of maintenance and housing, short reproductive cycle, availability, and portability. Over the last decade, a dramatic increase in mouse utilization has occurred, in part because of the flexibility of the mouse genome. The mouse genotype can be manipulated almost at will, providing a unique tool in evaluating the effects of targeted manipulations on the phenotype of a mammalian system. The widespread use of transgenic murine systems, along with the development of ‘smart’ molecular reagents that can visualize and track probes in vivo, has spurred the development of numerous preclinical imaging systems. The ability to perform relevant, minimally or non-invasive imaging helps reduce
Combined macro- and micro-imaging of bidirectional axillary lymphatic flows from the mammary pad (Figure 6)

Cambridge Research & Instrumentation, Inc. www.cri-inc.com [email protected]
Seeing life in a new lightMultiplexing with Multispectral Imaging: From Mice to Microscopy
NuanceTM and MaestroTM Imaging Systems
costs and enables longitudinal studies of multiple processes and parameters in individual animals. An excellent review of the pros and cons of each of these methodologies can be consulted for more information (Balaban, RS and Hampshire, VA 2001; Weissleder, R and Mahmood, U 2001).
Such systems, which include ultrasound, nuclear imaging (both positron and single-photon tomography), X-ray computed tomography, varieties of magnetic resonance imaging techniques, roughly be categorized as having either anatomical, functional, and/or molecular capabilities. The anatomical methods that have become the diagnostic cornerstones of clinical medicine include X-ray, CT, MRI, and ultrasound, and have all been scaled for specialty use in small-animal imaging. For the most part, however, these approaches, while useful for revealing anatomical features, are less relevant for elucidating molecular and cellular events, although this is changing rapidly due to the development of innovative chemistries and labeling strategies (Rothmann, C, Barshack, I et al. 1998).
The functional imaging technologies, which include optical techniques, can examine more dynamic processes such as perfusion, oxygenation, metabolism and other more or less generic physiological processes. These can be extremely useful, as evidenced by the success of fluoro-deoxyglucose (FDG) positron emission tomography PET, which can monitor tumor response to chemotherapy, for example, sometimes within hours after the first dose (Miller, JC, Fischman, AJ et al. 2007; Nanni, C, Di Leo, K et al. 2007; van der Weerdt, AP, Boellaard, R et al. 2007; Wolz, G, Nomayr, A et al. 2007). The generic nature of these modalities allows them to be applied in many different situations, but by the same token, they lack molecular specificity.
In-vivo molecular imaging thus involves detecting specific molecular targets. Numerous modalities are capable of this, including MRI, PET and single photon emission computed tomography (SPECT), ultrasound (using tagged microbubbles (Klibanov, AL 2005; Postema, M, Bouakaz, A et al. 2005)) and various optical approaches. Recently, instrument manufacturers have striven to develop hybrid technologies that incorporate the use of two or more single-modality systems concurrently, like fluorescence and ultrasound or PET-CT and SPECT-CT to meet the demand of those attempting to extract the most information possible about a particular biochemical process. Each of these methodologies has strengths and weaknesses from both a functional utility and practicality perspective. For example, while striking advances in MR and CT-based systems have occurred in recent years, there is still a significant cost burden associated with these approaches. Similarly, nuclear technologies such as PET or SPECT require significant investment in radiochemical capabilities.Optical methods, and particularly fluorescence-based methods, have a particular set of characteristics that, taken broadly, establish optical as one of the most versatile and effective
Optical is one of the most versatile and effective imaging modalities for preclinical animal studies
imaging modality for preclinical animal studies. This is the case for a variety of reasons, including cost and regulatory constraints, and is evidenced by the increasing utilization of optical imaging methods in small-animal-based research and development. In this article, we highlight the application of multispectral fluorescence-based imaging as a non-invasive small-animal phenotyping tool, with an emphasis on multiplexed analysis, smart reagents, and novel image processing tools for preclinical studies in mice. We focus on the mouse because it will be the dominant mammalian model over the next 5 years, and its physical scale provides both challenges and opportunities in imaging sciences. One advantage that will be touched upon is the fact that the molecular labels can be visualized on spatial scales that extend from the subcellular to the whole animal domain.
OPTICAL TECHNIQUES
BIOLUMINESCENCE AND FLUORESCENCE Optical molecular imaging systems and methodologies have been developed that use both bioluminescent (Rice, BW, Cable, MD et al. 2001) and fluorescent (Graves, EE, Ripoll, J et al. 2003) signals. Bioluminescent systems typically use luciferase genes coupled with luciferin substrates as reporters. The major attraction of this approach is that although absolute light levels generated by the targets may be low, photons are generated for the most part only where luciferase is present, leading to low background signals. In contrast, fluorescence-based imaging requires an external light source to stimulate the emission of light from the probe. In addition to bioluminescence and fluorescence, another technique known as photoacoustic imaging (Zhang, HF, Maslov, K et al. 2006; Toronov, VY, Zhang, X et al. 2007) is also under development. Based on intrinsic or extrinsic contrast mechanisms, it uses light to cause absorbers to heat up and expand rapidly, thereby generating a sound wave detected by surface acoustic transducers. Photoacoustic imaging is a very promising approach, but is still in its early days, and will not be further discussed.
Benefits and challenges of fluorescence-based imaging
Benefit: flexibility. Compared to bioluminescence, fluorescence is the more flexible technology, since it permits

Cambridge Research & Instrumentation, Inc. www.cri-inc.com [email protected]
Seeing life in a new lightMultiplexing with Multispectral Imaging: From Mice to Microscopy
NuanceTM and MaestroTM Imaging Systems
the use of a far wider range of probes, labeling methods and targets, and can be used with labels that emit in the NIR, the spectral “sweet spot” for deep tissue in-vivo imaging (Ntziachristos, V, Hielscher, AH et al. 2001; Ntziachristos, V, Bremer, C et al. 2003). Fluorescence-based methodologies can be used to image practically any of the fluorophores used in biomedical research, with best results typically achieved in-vivo when the emission wavelengths of the dye are between 500 and 950 nm (Mansfield, JR, Hoyt, CC et al. 2005), since blue and UV light signals penetrate tissue extremely poorly. These fluorophores can be genetically encoded in xenografts, or expressed in transgenic animals, they can be covalently bound to antibodies, peptides or other agents that bind to targets, or they can be fluorescent dyes introduced exogenously that are targeted by various means. An example
of antibody-targeted spectral imaging and analysis can be found in the report by Gao et al., examining the distribution of quantum-dot-labeled anti-tumor antibodies in mice (Gao, X, Cui, Y et al. 2004).
Benefit: multiplexing. Biological processes are complex, and it is become evident that, except in simple cases, it is often desirable to monitor more than one event or target at a time. For example, tumor location and expression of appropriate targetable surface markers and oxy-deoxy hemoglobin status and presence of necrosis or apoptosis and documentation of drug delivery could all conceivably be desired attributes to follow using in-vivo imaging. While such capturing such a suite of simultaneous read-outs is not yet feasible, such multiplex capabilities are not inconceivable, and in some instantiations, could be achieved using injection of a cocktail of fluorescently labeled antibodies or other targeting agents. These would be separable using either their fluorescence spectra or lifetimes and could be independently visualized and quantitated. Quantum dots, a family of nanoparticles with size-tunable emissions extending into the NIR (Gao, X, Chan, WC et al. 2002; Gao, X and Nie, S 2005) have promise in this area, although issues of toxicity and biodistribution still need to be fully addressed.
Benefit: cost and speed. The intrinsic cost of fluorescent imaging systems can be low, at least as compared to other modalities such as CT, MR and PET/SPECT, since their most simple implementation is an inexpensive camera in a light-tight box. Speed is also an advantage, at least in some
approaches, since signals can be relatively bright, and many mice (up to 5 or 6) can be imaged simultaneously and within seconds.
Benefit: extended spatial scale. As noted above, fluorescent signals are suitable for examination at the whole animal level, and either by using in-vivo microscopy or by examining tissues obtained by biopsy or necropsy. In some instances, if the in-vivo label is appropriate (reasonably photostable, positionally stable despite freezing or fixation and sectioning, and present in sufficient quantity to be visualized in thin sections) the same labels can be detected in-vivo and in-vitro, providing validation for both techniques.
Challenge: imaging at depth. Because photons are scattered and absorbed by biological tissues, most prominently in the visible range, but also in the NIR, optical imaging is easiest to accomplish when signals arise from superficial sources, for example, subcutaneous tumor deposits or inflammatory processes in extremities. Deeper structures may be detectable (depending on the wavelengths being used), but the signals can become very diffuse and hard to localize. Tomographic approaches for resolving signals at depth are being developed (Ntziachristos, V, Bremer, C et al. 2002; Ntziachristos, V, Ripoll, J et al. 2005), but these are still a work in progress, requiring relatively long exposure times, with relatively low spatial resolution and relatively long exposure and image reconstruction times, and will not be addressed in further detail here. Many studies are best accomplished using planar (single-view) imaging, and the choice of platform depends on the question being asked.
Challenge: autofluorescence. The number of photons emitted with fluorescence is orders of magnitude greater than with bioluminescence; however, it is the presence of relatively bright autofluorescence that generally limits achievable target-to-background ratios (Troy, T, Jekic-McMullen, D et al. 2004). The ubiquitous autofluorescence signals that degrades performance in conventional fluorescence-based small-animal imaging systems can primarily be attributed to components of the skin (mostly collagen which fluoresces mostly in the green), as well as to food (mostly chlorophyll-breakdown-products) and to porphyrins, both of which fluoresce mostly in the red. Thus, relatively dim green and red fluorescent molecular signals can be impossible to detect in intact small animals with conventional imaging approaches. It is possible to reduce the contribution from chlorophyll-related compounds by switching the test subjects to one of a variety of specially formulated diets (Troy, T, Jekic-McMullen, D et al. 2004). While this is certainly helpful, a more general solution is to separate autofluorescence signals from those of greater interest by using time-resolved or multispectral techniques.
Multispectral imaging (MSI) is an approach that optimizes the opportunities for multiplexing while at the same time overcoming the effects of autofluorescence

Cambridge Research & Instrumentation, Inc. www.cri-inc.com [email protected]
Seeing life in a new lightMultiplexing with Multispectral Imaging: From Mice to Microscopy
NuanceTM and MaestroTM Imaging Systems
MULTISPECTRAL IMAGING
Multispectral imaging (MSI) is an approach that optimizes the opportunities for multiplexing while at the same time overcoming the effects of autofluorescence on detectability and reliable quantitation. While it is possible to acquire multispectral datasets by simply rotating a filter wheel in front of a CCD camera, the use of electronically tunable filters (no moving parts, continuous tunability) is attractive. After a multispectral image set is captured, spectral unmixing and signal quantitation and display complete the imaging process. Examples will be shown how sensitivity in the face of autofluorescence is amplified, how multiple signals can be separated, and how microscopy can play a role in validation.
LCTF-based spectral imaging hardware
Small animal imaging. The Maestro™ system (CRi, Woburn, MA, 01801) pioneered multispectral approaches to small animal imaging. The system (see Figure 1) is based on the use of liquid crystal tunable filters (LCTFs) whose core technology has been described elsewhere (Miller, PJ and Hoyt, CC 1995; Gat, N 2000; Hoyt, CC, Levenson, RM et al. 2001) and compared in some detail to other spectral imaging techniques (Berman, JJ and Moore, GW 1994). Some of the features of LCTFs that make them suitable choices for many situations are as follows. They are band-sequential filters that are easily coupled to focal plane array detectors employing CMOS, standard CCD, or EMCCD technologies, among others. By sequentially tuning the filter and exposing the sensor, complete images are acquired at each wavelength, band by band. Unlike some other techniques, for example, those that use prisms or gratings to disperse and collect all wavelengths simultaneously, this design allows the user to vary the exposure time as a function of wavelength, thus optimizing signal-to-noise in situations where sensitivity (emitted photons convolved by imaging receiver characteristics) varies over the spectral range. Moreover, the wavelengths acquired can be arbitrarily spaced through the spectral range of interest, allowing the user to maximize signal-to-noise by acquiring only the most informative bands
(Miller, PM and Levenson, RM 2001). Other advantages include the absence of moving parts, excellent optical properties that yielding near-diffraction-limited images (of particular importance for microscopy-based applications)
spectral stability to fractions of a nanometer, and high reliability.
The remainder of the system consists of a cooled megapixel CCD, a Xenon-based excitation light source with interference-filter-selectable spectral ranges, heated stage and anesthesia manifold, and a light-tight enclosure. As many as 3 mice can be imaged simultaneously. Alternatively, the field of view can be zoomed so that 40-micron per pixel resolution is achievable.
Multispectral microscopy. The Nuance™ microscope-based imaging system (Figure 2) is similar in concept to the Maestro, except that the LCTF, optics and a cooled megapixel CCD camera are integrated into a device that mounts on any microscope equipped with a C-mount adapter (commonly used for digital cameras). The spectral ranges for either the Maestro or Nuance systems can be selected to span either 420 to 720 nm (the visible range) or 500 to 950 nm (well-suited for in-vivo imaging). While the Nuance system can be used for brightfield (non-fluorescence) microscopy, with particular application to multiplexing chromogen-based immunohistochemistry studies, this have been described elsewhere (Levenson, RM 2006; Taylor, CR and Levenson, RM 2006).
Most acquisitions involve automatically taking a series of exposures spaced 10- or 20-nm apart over the desired spectral range, and then saving the resulting spectral data “cube” in a proprietary format, or alternatively, as a series of TIFFs or raw floating point file. Typical exposure times for small animal imaging range from ~5-~50 seconds for an entire multispectral
Figure 1. Maestro™ in-vivo imaging system. An LCTF-based multispectral camera system and excitation source can capture reflectance and fluorescence images of small animals at multiple wavelengths. Spectral analysis software can then “unmix” multiple signals, removing autofluorescence contributions and increasing sensitivity and quantitative accuracy.
The metric of success in imaging is usually not total photons captured, but achievable signal-to-noise (or signla-to-background ) within a given time

Cambridge Research & Instrumentation, Inc. www.cri-inc.com [email protected]
Seeing life in a new lightMultiplexing with Multispectral Imaging: From Mice to Microscopy
NuanceTM and MaestroTM Imaging Systems
dataset (up to 10 wavelengths, from 50 ms to 5 seconds per wavelength). If multiple fluorescent species are being imaged that require changing excitation wavelengths, the imaging will of course take somewhat longer. Somewhat shorter exposure times are usually encountered in microscope-based imaging.
Tunable filters and throughput. There are some disadvantages related to band-sequential approaches in general and/or LCTFs in particular. A band-sequential approach implies that the complete image stack (or “cube”) is built up over time; thus, if significant sample- or camera-movement occurs during the acquisition, or if high temporal resolution is needed to capture certain events, like calcium signaling transients, snap-shot acquisition strategies could be more appropriate. Overall light throughput can be a concern: LCTFs use polarization in their spectral selection process, and transmission efficiencies are typically in the 30%-range, in comparison to traditional interference filters that can transmit approximately 90% of incoming light. However, the metric of success in imaging is usually not total photons captured, but achievable signal-to-noise (or signal-to-background) within a given time, and except where high speed is required, the benefit of spectral information gained generally outweighs the impact of lower transmission efficiencies. For example, compare a grayscale to a color image: as much as 2/3 or so of the available light is lost in a color sensor due to the presence of red-green-blue filter masks over individual pixels. However, the useful information content of a color image, captured ultimately with fewer photons reaching the detector, can be vastly more than that of a monochrome image of the same scene.
MULTISPECTRAL ANALYSIS
Spectral cube display. A spectral data cube is multidimensional dataset consisting of spatial information (x,y coordinates, or pixels) and individual measured spectra at each one of these pixels. There may be a lot of information contained in one of these datasets, which are amenable to analysis using a variety of straightforward or sophisticated methods. However, the two essential functions of spectral imaging software are to display the raw data in a visually interpretable image, and to unmix various signals into their own separate channels or component images. Because human vision is not able to interpret more than 3 color channels, it is necessary to display the high-dimensional spectral dataset in a red-green-blue (RGB) color image. Either true-color (in which spectral regions are mapped faithfully into their corresponding RGB channels) or false-color displays can be generated; the latter are useful when signals in the near-infrared (NIR—by definition mostly invisible to human vision) are acquired. All the images identified as RGB images in this report are derived from the spectral datasets and not from conventional color sensors.
Spectral unmixing. Spectral unmixing can take signals that may overlap both spatially and spectrally, and separate them faithfully, without crosstalk. The basic mathematical approach is part of conventional (non-imaging) spectroscopic toolbox, and is at heart a simple least-square fitting which takes the measured (experimental) spectrum at each pixel, and breaks it up as a linear combination of spectra corresponding to the signals expected to be present (Farkas, DL, Du, C et al. 1998). For this to be an accurate process, it is essential to obtain accurate spectra for each signal in the image. These can be provided to the software via established spectral libraries. However, because of the complexities of determining accurate (that is to say, pure or uncontaminated) spectra from specimens in which no pure spectra may be present in a given sample, various methods have been developed to extract such spectra from the dataset itself. Once the unmixing has taken place, the individual component images can be combined in a “composite” image, with control over the pseudo-color assigned to each plane. The process of spectral unmixing and composite image creation have been described in more detail elsewhere (Mansfield, JR, Gossage, KW et al. 2005; Mansfield, JR, Hoyt, CC et al. 2005).
Unique aspects of the methods outlined there include “pure”
Figure 2. Nuance™ Multispectral Imaging System for microscopy. A spectral imaging camera similar to that inside the Maestro imager that mounts on any C-mount equipped microscope (upright, inverted, dissecting) provides multispectral imaging at the cellular and subcellular scale. The background and inset images illustrate a “before-and-after” example of the application of spectral unmixing to a fluorescence-in-situ hybridization (FISH) analysis of a breast cancer biopsy, separating tissue autofluorescence from fluorescently labeled nuclei, and Her2 and chromosome-17 molecular signals.
Spectral unmixing can take signals that may overlap both spatially and spectrally, and separate them faithfully, without crosstalk

Cambridge Research & Instrumentation, Inc. www.cri-inc.com [email protected]
Seeing life in a new lightMultiplexing with Multispectral Imaging: From Mice to Microscopy
NuanceTM and MaestroTM Imaging Systems
spectral computation and automated spectral feature detection. “Compute Pure Spectrum” (CPS) is a manual tool used to extract the authentic spectrum of a fluorophore if it is contaminated with autofluorescence in the sample (the typical case). Automated pure spectral feature extraction (“Real Component Analysis” or RCA) is also described; this is a useful feature that not only assists in spectral library creation, but can also serve as an exploratory aid which displays images corresponding to all detected spectral features, and in some cases can reveal unexpected components in unfamiliar specimens.
Quantitation. The unmixed images are typically presented to the user scaled for display, that is to say, stretched in such a way as to make dim signals visible. However, the underlying data is quantitative in the sense that combined signal measured at each pixel is allocated to each spectral channel as determined by each species’ relative abundance. Thus, simple image analysis tools applied to each channel can be used to extract all relevant measures from regions of interest such as intensity (maximum, average, total), area, dimension, etc. In other words, while intensities measured at the camera may be related to “true” signal intensity of an emitting object inside an animal in complicated ways, after the signals are captured at the sensor, subsequent multispectral analysis yields quantitatively accurate component-specific data.
EXAMPLES
The remainder of this paper will illustrate the usefulness of multispectral imaging approaches for both macroscopic (in-vivo) and microscopic samples.
Multispectral small-animal imaging
Multiplexing and autofluorescence removal I. Shown in Figure 3 is a pair of nude mice imaged in the Maestro spectral imaging system to demonstrate the detection of faint fluorophore signals commingled with spectrally overlapping autofluorescence. The mice have been injected subcutaneously with three fluorophores (FITC, TRITC and Cy3.5) and also exhibit both skin and food autofluorescence. The task is both to detect and separate these overlapping fluorophores from each other, which, except for FITC, are barely visible in the RGB image (top left). The inset, top center, shows the spectra of all five signals: skin autofluorescence ( pink), and the “purified” spectra of FITC (green), TRITC (blue), Cy3.5 (red) and food (yellow) generated using the compute-pure-spectra (CPS) tool. These spectra are consistent with published spectra. The bottom panels are identified in the figure, and illustrate the ability of spectral unmixing to separate the signals well isolated from each other; the images are shown as they were generated in the software, and have not had brightness and contrast further adjusted. All panels show
signals which are well isolated from the others. The top-right panel is a pseudo-colored composite image of the unmixed components.
Multiplexing and autofluorescence removal II. Figure 4 shows striking results when different lymphatic drainage patterns are individually highlighted by appropriately located injections with different quantum dot species for each region. The top schematic indicates the location of each quantum dot injection in an extremity of a nude mouse. The spectral characteristics of each quantum dot (as measured in the Maestro system) are shown. The center panels illustrate unmixing results after the quantum dots have spread through the lymphatics to arrive at the major draining nodes for each distribution. The left panel is simply the unmixed skin autofluorescence image; the center shows a composite image of the lymph nodes in-situ after spectral unmixing, and the right is a composite image of these two components. The bottom panels show the results of imaging the nodes after surgical dissection (left—reflectance image; right, unmixed composite image).
Multispectral microscopy
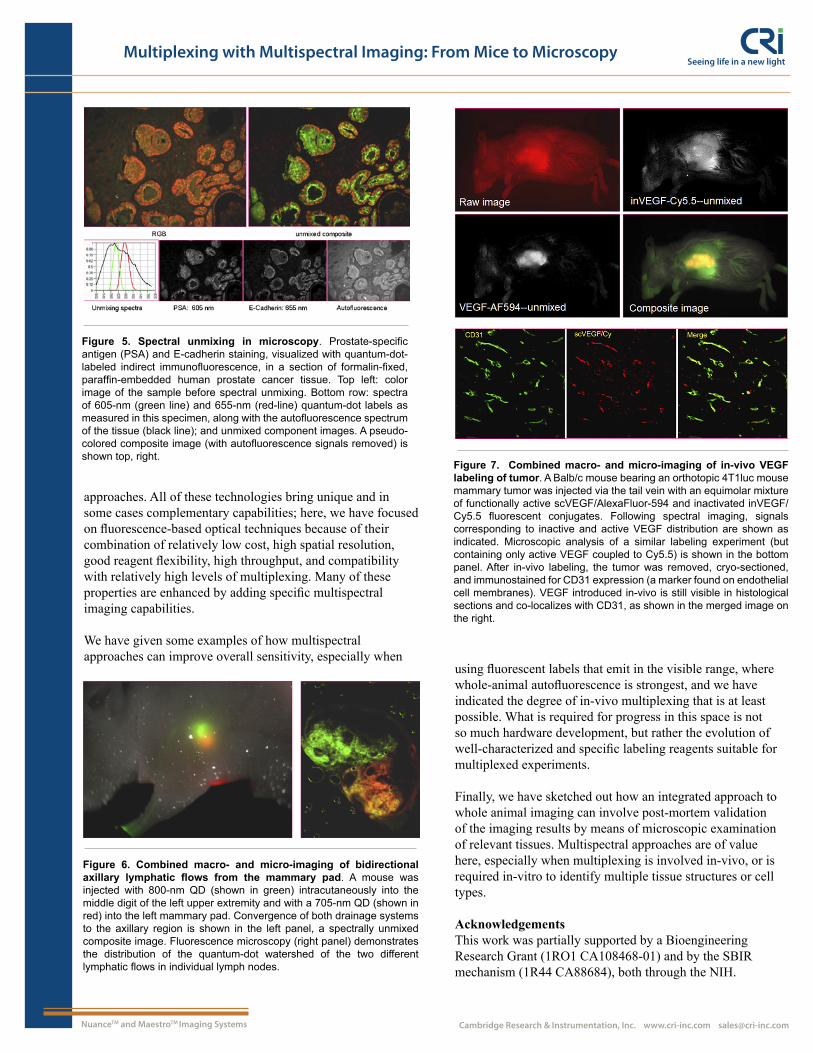
Multiplexing and autofluorescence removal in microscopy. The sample shown in Figure 5 is a section of formalin-fixed, paraffin-embedded human prostate cancer specimen immunostained for PSA (prostate-specific antigen) and E-cadherin using indirect immunofluorescence with secondary antibodies (Invitrogen) conjugated to a 605-nm quantum dot (PSA) and a 655-nm quantum dot (E-cadherin). The slide
Figure 3: Nude mice with two different species of autofluorescence and three subcutaneous fluorophore signals. Mice were injected subcutaneously with three fluorophores (FITC, TRITC and Cy3.5) and spectrally imaged in a Maestro. The color image (top, left) indicates the appearance of the mice before spectral unmixing was performed. The inset (top, center) shows the spectra of all five major signals: skin autofluorescence ( pink), and the “purified” spectra of FITC (green), TRITC (blue), Cy3.5 (red) and food (yellow) generated using the compute-pure-spectra (CPS) algorithm. Spectrally unmixed component images are shown in the bottom panels, and a pseudo-colored composite image is shown in the top row (right).

Cambridge Research & Instrumentation, Inc. www.cri-inc.com [email protected]
Seeing life in a new lightMultiplexing with Multispectral Imaging: From Mice to Microscopy
NuanceTM and MaestroTM Imaging Systems
was imaged at 10X from 500 to 800 nm. The top left panel is an RGB image the contribution of the quantum dot signals plus autofluorescence. The bottom panels show the spectrum (as derived from this image) of the two quantum dot species plus a tissue autofluorescence spectrum. Unmixing generated the three remaining bottom panels, indicating both the precise location of the two quantum dot immunolabels, and the ubiquitous presence of autofluorescence. Because these images are scaled for display, it is not possible to judge visually the relative intensities of the three channels, but quantitative analysis indicates that the autofluorescence signal is of the same order of magnitude as the PSA signals. Thus, without unmixing the contribution of the autofluorescence, accurate quantitation of each signal would have been compromised. The top right panel is a component image of the two QD signals with the autofluorescence channel removed.
Combining small animal imaging and microscopy I. The example shown in Figure 6 shows the result of lymph drainage analysis using, in this case, two QD species, one injected into the left front paw, and the other injected into the left mammary pad. The axillary lymph node received the two different lymphatic flows simultaneously. Spectral imaging was performed after the QD labels had an opportunity to reach their primary drainage nodes, and as can be seen in the left panel (in-vivo image), the two QD signals both appeared in the axillary node region. Nodes from this region were subsequently dissected, and microscopic imaging confirmed that the two QD signals arose not just from the same region, but from the same lymph node.
Combining small animal imaging and microscopy II. Figure 7 illustrates the use of presumptively active and inactive molecular reagents in in-vivo imaging. It is a good idea to try and separate molecularly targeted uptake and labeling from passive or unexpected binding. Balb/c mice bearing orthotopic 4T1luc mouse mammary tumors were injected via the tail vein with an equimolar mixture of functionally active single-chain (sc) VEGF/AlexaFluor-594 (scVEGF/Al) and inactivated
inVEGF/Cy5.5 (inVEGF/Cy) fluorescent conjugates, total of 20 µg per mouse. scVEGF, site-specifically labeled with fluorophores binds to VEGF receptors and is internalized via receptor-mediated endocytosis, while excessive random biotinylation of such conjugates completely abolish binding and internalization (Backer, MV, Levashova, Z et al. 2007). Tumor images were obtained using Maestro Imaging System and processed with CRI software to obtain unmixed and composite images. Inactive VEGF distribution is shown in the top right panel, and active VEGF distribution, localizing in the subcutaneous tumor is shown in the center left panel, and the composite pseudo-colored image is presented in the center right.
Microscopic analysis of a similar labeling experiment (but containing only active scVEGF coupled to Cy5.5) is shown in the bottom panel. After in-vivo labeling, the tumor was removed, cryo-sectioned, and immunostained for CD31 expression (a marker found on endothelial cell membranes). The bottom center panel demonstrates that the labeled VEGF introduced in-vivo is still visible in histological sections after sacrifice, and in this case also shows that its distribution mimics that of CD31, as shown in the merged image on the right. This is a good illustration on how post-mortem microscopy can and whenever possible should be used to validate in-vivo labeling experiments.
CONCLUSIONS
The world of small animal imaging is burgeoning, not only in its appeal to existing and new research constituencies, but also in the wide and growing list of technologies at its disposal. To the established techniques that have migrated from the clinical arena to the preclinical space (CT, MR, PET, SPECT, ultrasound) can be added techniques based on optical
Figure 4. Five-color spectrally unmixed quantum-dot detection of lymphatic system anatomy. Top: a schematic illustration of 5-color quantum dot lymphatic injection sites and draining destinations of spectral fluorescence imaging, with a graph of the emission spectra of each of the quantum dots used. Middle row. Five primary draining lymph nodes were simultaneously visualized with different colors as shown: autofluorescence image of mouse (left); composite pseudo-colored detection of draining lymph nodes after spectral unmixing (middle); image merge of the left and center panels (right). Bottom row: reflectance (left) and spectrally unmixed and pseudo-colored image (right) of surgically dissected lymph nodes arranged in the same geometry as in the intact mouse.
Post-mortem microscopy can and whenever possible should be used to validate in-vivo labeling experimerts.
Cambridge Research & Instrumentation, Inc. www.cri-inc.com [email protected]
Seeing life in a new lightMultiplexing with Multispectral Imaging: From Mice to Microscopy
NuanceTM and MaestroTM Imaging Systems
approaches. All of these technologies bring unique and in some cases complementary capabilities; here, we have focused on fluorescence-based optical techniques because of their combination of relatively low cost, high spatial resolution, good reagent flexibility, high throughput, and compatibility with relatively high levels of multiplexing. Many of these properties are enhanced by adding specific multispectral imaging capabilities.
We have given some examples of how multispectral approaches can improve overall sensitivity, especially when
using fluorescent labels that emit in the visible range, where whole-animal autofluorescence is strongest, and we have indicated the degree of in-vivo multiplexing that is at least possible. What is required for progress in this space is not so much hardware development, but rather the evolution of well-characterized and specific labeling reagents suitable for multiplexed experiments.
Finally, we have sketched out how an integrated approach to whole animal imaging can involve post-mortem validation of the imaging results by means of microscopic examination of relevant tissues. Multispectral approaches are of value here, especially when multiplexing is involved in-vivo, or is required in-vitro to identify multiple tissue structures or cell types.
AcknowledgementsThis work was partially supported by a Bioengineering Research Grant (1RO1 CA108468-01) and by the SBIR mechanism (1R44 CA88684), both through the NIH.
Figure 5. Spectral unmixing in microscopy. Prostate-specific antigen (PSA) and E-cadherin staining, visualized with quantum-dot-labeled indirect immunofluorescence, in a section of formalin-fixed, paraffin-embedded human prostate cancer tissue. Top left: color image of the sample before spectral unmixing. Bottom row: spectra of 605-nm (green line) and 655-nm (red-line) quantum-dot labels as measured in this specimen, along with the autofluorescence spectrum of the tissue (black line); and unmixed component images. A pseudo-colored composite image (with autofluorescence signals removed) is shown top, right.
Figure 6. Combined macro- and micro-imaging of bidirectional axillary lymphatic flows from the mammary pad. A mouse was injected with 800-nm QD (shown in green) intracutaneously into the middle digit of the left upper extremity and with a 705-nm QD (shown in red) into the left mammary pad. Convergence of both drainage systems to the axillary region is shown in the left panel, a spectrally unmixed composite image. Fluorescence microscopy (right panel) demonstrates the distribution of the quantum-dot watershed of the two different lymphatic flows in individual lymph nodes.
Figure 7. Combined macro- and micro-imaging of in-vivo VEGF labeling of tumor. A Balb/c mouse bearing an orthotopic 4T1luc mouse mammary tumor was injected via the tail vein with an equimolar mixture of functionally active scVEGF/AlexaFluor-594 and inactivated inVEGF/Cy5.5 fluorescent conjugates. Following spectral imaging, signals corresponding to inactive and active VEGF distribution are shown as indicated. Microscopic analysis of a similar labeling experiment (but containing only active VEGF coupled to Cy5.5) is shown in the bottom panel. After in-vivo labeling, the tumor was removed, cryo-sectioned, and immunostained for CD31 expression (a marker found on endothelial cell membranes). VEGF introduced in-vivo is still visible in histological sections and co-localizes with CD31, as shown in the merged image on the right.

Cambridge Research & Instrumentation, Inc. www.cri-inc.com [email protected]
Seeing life in a new lightMultiplexing with Multispectral Imaging: From Mice to Microscopy
NuanceTM and MaestroTM Imaging Systems
REFERENCES
Backer MV, Levashova Z, et al. 2007. Molecular imaging of VEGF receptors in angiogenic vasculature with single-chain VEGF-based probes. Nat Med 13: 504-509.
Balaban RS and Hampshire VA 2001. Challenges in small animal noninvasive imaging. Ilar J 42: 248-262.
Berman JJ and Moore GW 1994. Image analysis software for the detection of preneoplastic and early neoplastic lesions. Cancer Lett 77: 103-109.
Farkas DL, Du C, et al. 1998. Non-invasive image acquisition and advanced processing in optical bioimaging. Comput Med Imaging Graph 22: 89-102.
Gao X, Chan WC, et al. 2002. Quantum-dot nanocrystals for ultrasensitive biological labeling and multicolor optical encoding. J Biomed Opt 7: 532-537.
Gao X, Cui Y, et al. 2004. In vivo cancer targeting and imaging with semiconductor quantum dots. Nat Biotechnol 22: 969-976.
Gao X and Nie S 2005. Quantum dot-encoded beads. Methods Mol Biol 303: 61-71.
Gat N 2000. Imaging Spectroscopy Using Tunable Filters: A Review. Proc SPIE 4056: 50-64.
Graves EE, Ripoll J, et al. 2003. A submillimeter resolution fluorescence molecular imaging system for small animal imaging. Med Phys 30: 901-911.
Hoyt CC, Levenson RM, et al. 2001. A new high-sensitivity, high-throughput fluorescence polarization reader. Proc SPIE 4255:
Klibanov AL 2005. Molecular imaging with targeted ultrasound contrast microbubbles. Ernst Schering Res Found Workshop171-191.
Levenson RM 2006. Spectral imaging perspective on cytomics. Cytometry, Part A in press:
Mansfield JR, Gossage KW, et al. 2005. Autofluorescence removal, multiplexing, and automated analysis methods for in-vivo fluorescence imaging. J Biomed Opt 10: 41207.
Mansfield JR, Hoyt CC, et al. 2005. Distinguished photons: increased contrast with multispectral in vivo fluorescence imaging. BioTechniques 39 Supplement: S25-29.
Miller JC, Fischman AJ, et al. 2007. FDG-PET CT for Tumor Imaging. J Am Coll Radiol 4: 256-259.
1.
2.
3.
4.
5.
6.
7.
8.
9.
10.
11.
12.
13.
14.
15.
Miller PJ and Hoyt CC 1995. Multispectral imaging with a liquid crystal tunable filter. Proc SPIE 2345: 354-365
Miller PM and Levenson RM 2001. Beyond image cubes: an agile lamp for practical, near-100% photon-efficient spectral imaging. Proc SPIE 4259: 1-7.
Nanni C, Di Leo K, et al. 2007. FDG small animal PET permits early detection of malignant cells in a xenograft murine model. Eur J Nucl Med Mol Imaging 34: 755-762.
Ntziachristos V, Bremer C, et al. 2002. In vivo tomographic imaging of near-infrared fluorescent probes. Mol Imaging 1: 82-88.
Ntziachristos V, Bremer C, et al. 2003. Fluorescence imaging with near-infrared light: new technological advances that enable in vivo molecular imaging. Eur Radiol 13: 195-208.
Ntziachristos V, Hielscher AH, et al. 2001. Diffuse optical tomography of highly heterogeneous media. IEEE Trans Med Imaging 20: 470-478.
Ntziachristos V, Ripoll J, et al. 2005. Looking and listening to light: the evolution of whole-body photonic imaging. Nat Biotechnol 23: 313-320.
Postema M, Bouakaz A, et al. 2005. Ultrasound-induced gas release from contrast agent microbubbles. IEEE Trans Ultrason Ferroelectr Freq Control 52: 1035-1041.
Rice BW, Cable MD, et al. 2001. In vivo imaging of light-emitting probes. J Biomed Opt 6: 432-440.
Rothmann C, Barshack I, et al. 1998. Spectrally resolved morphometry of the nucleus in hepatocytes stained by four histological methods. Histochem J 30: 539-547.
Taylor CR and Levenson RM 2006. Quantification of immunohistochemistry--issues concerning methods, utility and semiquantitative assessment. Histopathologyin press.
Toronov VY, Zhang X, et al. 2007. A spatial and temporal comparison of hemodynamic signals measured using optical and functional magnetic resonance imaging during activation in the human primary visual cortex. Neuroimage 34: 1136-1148.
Troy T, Jekic-McMullen D, et al. 2004. Quantitative comparison of the sensitivity of detection of fluorescent and bioluminescent reporters in animal models. Mol Imaging 3: 9-23.
van der Weerdt AP, Boellaard R, et al. 2007. Accuracy of 3D acquisition mode for myocardial FDG PET studies using a BGO-based scanner. Eur J Nucl Med Mol
16.
17.
18.
19.
20.
21.
22.
23.
24.
25.
26.
27.
28.
29.

Cambridge Research & Instrumentation, Inc. www.cri-inc.com [email protected]
Seeing life in a new lightMultiplexing with Multispectral Imaging: From Mice to Microscopy
NuanceTM and MaestroTM Imaging Systems
Imaging
Weissleder R and Mahmood U 2001. Molecular imaging. Radiology 219: 316-333.
Wolz G, Nomayr A, et al. 2007. Anatomical accuracy of interactive and automated rigid registration between X-ray CT and FDG-PET. Nuklearmedizin 46: 43-48.
Zhang HF, Maslov K, et al. 2006. Functional photoacoustic microscopy for high-resolution and noninvasive in vivo imaging. Nat Biotechnol 24: 848-851.
About CRi:
Cambridge Research & Instrumentation, Inc (CRi) is a Boston-based biomedical imaging company providing innovative optical imaging solutions for more than 20 years.
CRi’s multidisciplinary team is dedicated to providing comprehensive solutions that enable our customers to produce breakthroughs in research and medical care. CRi technology helps extract new disease-specific information from biological and clinical samples in the physiological, morphological, and biochemical context of intact tissues and organisms. The complexity of disease is captured at multiple levels, from cellular to whole organism, in order to accelerate and enhance disease research and drug development and to help realize the potential for personalized medicine.
With over 80 patents pending and issued, CRi’s award-winning innovations are being utilized around the world in a wide range of settings, ranging from academic researcher to pharmaceutical drug development to clinical medicine.
CRi is headquartered in Woburn, Massachusetts, and operates a state-of-the-art manufacturing facility. We are able to rapidly design and manufacture system-level solutions for a variety of growing market applications.
30.
31.
32.