Multiple sclerosis: meeting unmet needs through … · SCIENTIFIC HIGHLIGHTS Multiple sclerosis:...
32
SCIENTIFIC HIGHLIGHTS Multiple sclerosis: meeting unmet needs through scientific discoveries and clinical practice 9-10 April 2016 – Berlin, Germany
Transcript of Multiple sclerosis: meeting unmet needs through … · SCIENTIFIC HIGHLIGHTS Multiple sclerosis:...

SCIENTIFIC HIGHLIGHTS
Multiple sclerosis: meeting unmet needs through scientific discoveries and clinical practice9-10 April 2016 – Berlin, Germany

2
Giancarlo Comi (Italy) and David Bates (UK) welcomed neurologists involved in the treatment of patients with multiple sclerosis (MS) to this live educational conference, which brought together leading international experts in neurology to review recent scientific discoveries in MS. In addition, the emerging frontiers of knowledge and current unmet medical and scientific needs in the area of MS were explored.
This newsletter highlights the important topics which were discussed at the conference, the learning objectives of which were to enable participants to:
• Describe the main advances in MS pathogenesis
• Discuss the role of different tools in MS diagnosis, monitoring and treatment choices
• Review the mechanisms of neurodegeneration and repair
Conference aims
The aims of the conference were to explore the advances that have been made from the clinic-diagnostic, scientific and therapeutic points of view in the MS field over the past few years. Although new opportunities have been offered to patients with MS, new issues are concerning the MS community. Among them, the need to better define therapeutic algorithms and to balance risks and benefits related to the new disease modifying drugs (DMDs) are still of pivotal importance. Although the relapsing-remitting form of MS can benefit from the new DMDs, an effective treatment for the progressive forms is still lacking. Therefore, basic scientists and clinicians have put great effort into trying to better understand the pathogenic mechanisms underlying progressive MS (PMS) and discover new potential therapeutic targets.
The programme offered a comprehensive overview of MS pathophysiology, diagnosis and treatment as well as giving participants the most up-to-date information in basic science, diagnostic workout, clinical management and risk stratification in order to improve globally the lives and health
care of patients with MS.

3
Amit Bar-OrNeuroimmunology UnitMontreal Neurological Institute Montreal, Canada
Stefan BittnerDepartment of NeurologyUniversity of MünsterMünster, Germany
Diego CentonzeNeurology UnitIRCSS Mediterraneo NeuromedNeurology InstituteRome, Italy
Chairs:
Andrew ChanNeurocenter InselspitalUniversity Hospital BernBern, Switzerland
Manuel ComabellaMultiple Sclerosis Centre of Catalonia (Cemcat)Neurology-Neuroimmunology DepartmentVall d’Hebron University HospitalBarcelona, Spain
Nicola De StefanoNeurology and Neurometabolic UnitDepartment of Neurologicaland Behavioral SciencesUniversity of SienaSiena, Italy
Faculty:
David BatesDepartment of NeurologyRoyal Victoria InfirmaryNewcastle upon Tyne, UK
Giancarlo ComiDepartment of NeurologyInstitute of Experimental NeurologyVita-Salute San Raffaele UniversityMilan, Italy

4
Hans LassmannDepartment of NeuroimmunologyMedical University of ViennaVienna, Austria
Letizia LeocaniInstitute of Experimental NeurologyUniversity Vita-Salute IRCCSSan Raffaele HospitalMilan, Italy
Jiwon OhDivision of NeurologyUniversity of TorontoToronto, Canada
Sven SchipplingCRPP Multiple SclerosisUniversity of ZurichZurich, Switzerland
Alan J. ThompsonDepartment of Brain Repair and RehabilitationInstitute of Neurology University College LondonNational Hospital for Neurology and NeurosurgeryLondon, UK
Per Soelberg SørensenDanish Multiple Sclerosis CenterDepartment of NeurologyRigshospitalet, University of CopenhagenCopenhagen, Denmark
Mar TintoréMultiple Sclerosis Centre of Catalonia (Cemcat)Neurology-Neuroimmunology DepartmentVall d’Hebron University HospitalBarcelona, Spain
Pablo VillosladaDepartment of NeurologyUniversity of California, San Francisco (UCSF)San Francisco, CA, USA
David HaflerWilliam S. and Lois Stiles EdgerlyDepartment of NeurologyYale School of MedicineYale New Haven HospitalNew Haven, CT, USA
Ludwig KapposDepartment of BiomedicineUniversity Hospital BaselBasel, Switzerland
Jürg KesselringDepartment of NeurorehabilitationValens Clinic Rehabilitation CenterValens, Switzerland

SESSION I: UPDATE ON PATHOGENESIS

6
Revisiting the role of T and B cells in MS
Amit Bar-Or (Canada) provided an update on the role of B and T cells in the biology of MS and reviewed the traditional view of MS as a T cell disease.
Professor Bar-Or reviewed the traditional view of MS as T cell mediated disease, drawing lessons from targeted B cell depletion (anti-CD20). He highlighted non antibody dependent functions of B cells. He presented the evolving view of the interactions between B cells, myeloid cells and T cells and the significance in the periphery and central nervous system (CNS) of patients.
Professor Bar-Or referred to the typical clinical course of MS compared with the imaging course and asked how we can revisit the interactions between different cell subsets.
Fig 1. The typical clinical and imaging course of MS
Professor Bar-Or presented a simplified model of MS immunopathogenesis:
Fig 2. The simplified model of MS immunopathogenesis
Autoimmunity is normally self-regulated, but why this sometimes goes wrong is what is interesting in MS. It has
been well known that myeloid cell:T cell interactions are important in determining their pro-inflammatory or anti-inflammatory states. For many years it has also been known that there are abnormal antibodies implicated in MS. Using molecular tools, expansion and persistence of the same B cell and plasma cell clones has been documented in the MS CNS, though the significance of these antibodies is largely unknown.
Fig 3. B cell functions of potential relevance to MS
Newer findings indicate that, in untreated MS, a defect exists in the balance of pro- and anti-inflammatory B cell cytokines. B cell depletion in MS patients decreases activation of pro-inflammatory T cells1. There is thus a change in the universal view from T cells affecting B cells to this being a two way interaction.
Moreover, interactions between B cells, myeloid cells and T cells are now recognized as important.
Fig 4. B cell:myeloid cell:T cell interactions in MS
B cell depletion leads to diminished myeloid cell pro-inflammatory responses2. Research has also provided evidence to show that B cells traffic bi-directionally across the CNS barrier, with majority of B cell maturation occurring
CNS-compartmentalized Inflammation + degeneration
Imaging Course
Clinical Course
Underlying Biologies
Peripherally-initiated Inflammatory Injury
? ?
2. Adhesion
3. Attraction
Periphery
BBBCNS
4. Invasion
Simplified Model of MS Immunopathogenesis
1. Activation Th
B Cell
5. Reactivation
B Cell
6. Neural/glial responses
Bar-Or A, ECTRIMS 2011, Amsterdam. 104
Antibody- dependent cell
mediated cytotoxicity
Target tissue
Fc Fc
C3
Pathological autoantibodies
‘Normal’ antibodies Antibody
B cell Plasma cell
Antibody production; Complement activation
Complement Macrophage
Ectopic formation of germinal centres
LT1b
LTbR dendritic
cell
Meningeal ectopic germinal centres
B
B cell
IL-10 IL-6 TNF-a
TNF-a IL-1 IL-6
Macrophage
Cytokine production
Cytokines
Cytokines Dendritic cell
Cytotoxic T cells
Target tissue
B cell
T cell
Antigen presentation
Cytokines TNF-a,IL-4, IL-10
B cell functions of potential relevance to MS
TARGET ORGAN ANTIGEN-SPECIFIC
RESPONSE
T cells Treg (nTreg; iTreg) Teff (ThIL-17; Th IL-17/IFNγ; Th GM-CSF)
B cells Breg: IL-10 / IL-35 Beff: LT / TNFα / IL-6 GM-CSF
Myeloid cells M2: IL-10 (M2a-c) M1: IL-12 / IL-23
B cell:Myeloid cell:T cell interactions
Autoimmunity and Multiple Sclerosis

7
outside of the CNS in the secondary lymphoid tissue3. Meningeal inflammation in MS can be ‘B cell rich’ and also include T cells and myeloid cells4-6.
Professor Bar-Or summarised his presentation by stating that we must face an evolving view of cascades underlying MS activity. The interactions between B cells, myeloid cells and T cells are important. Clinically, therapies can aim to target one or more limbs of these interactions.
Variability of MS evolution: the role of genetics and environment
David A Hafler (USA) reported on research to identify and characterise the causal variants driving autoimmune risk, leveraging a new generation of dense genotyping data and a novel algorithm for fine mapping single nucleotide polymorphisms (SNPs).
Professor Hafler noted that the prevailing view of MS is that it is a genetically mediated autoimmune disease initiated by infiltrating T cells and then recruiting B cells and macrophages into the CNS7. Examining the differences between people with MS and people without shows that in people without MS, regulatory T cells prevent activation of auto-reactive T cells. In people with MS, loss of immune regulation allows the activation and clonal expansion of myelin-reactive T cells followed by clonal expansion of B cells8. The disease starts in the peripheral immune system. The question is what causes MS.
Fig 5. A working model of RRMS
There is some evidence of a genetic risk in MS. The overall population risk is 0.1%, the sibling risk is 2-4%, the dizygotic twin risk is 5% and the monozygotic twin risk is 30%. The disease genetics in MS are very complex and environmental factors also have an impact.
Professor Hafler presented work completed mapping SNPs to cell types and transcription factors. It is now possible to catalogue different diseases according to their shared genetic features. This has shown that common allelic
variants associated with risk of MS are predominantly genes related to immune response9. The question of whether MS is autoimmune disease is now over, it is clear.
In order to go from “tagging” SNPs to understanding the pathways and mechanisms the following factors should be considered:
• The identification of MS genetic variants
• Mapping SNPs to cell types and transcription factors
– Fine map loci to identify SNPs in haplotype block
– Cataloguing cell population histone modifications
– Cross SNPs with these maps of human genome
• The loss of immune regulation associated with environmental factors that link to genetic loci
We can’t look at MS as just a T cell or B cell disease. Genetics of MS dictates a lower activation threshold of different cell types of the adoptive and innate immune system including Th17 and B cells, and macrophages10. However, it is not just about genetics it is about interaction between genetics and environment.
Fig 6. Which cell types cause MS?
There are defects in suppression by regulatory T cells in patients with MS. The loss of immune regulation allows for the activation of myelin reactive T cells. What leads to loss of immune regulation is not clear.
In patients with MS, the loss of immune regulation is combined with environmental factors that link to genetic loci, for example decreased vitamin D, increased body mass index, smoking, EBV infection, increased salt intake.
Research into the effect of sodium chloride has shown that a high salt diet affects salt in the gut. Looking at patients with MS shows that the number gadolinium-enhancing (Gd+) lesions was higher in patients with high salt diet, so perhaps there is an environmental factor associated with salt11. It has been shown that high levels of sodium chloride
The“Disease"startsintheperipheralimmunesystem.
Joel Stern, Kevin O’Connor et. al, Sci Transl Med, 2014
Aworkingmodelofrelapsingremi2ngMS
“Disease"
WhichcelltypecausesMS?
multiple sclerosis ulcerative colitis
Farh, et. al. Nature 518:337-43, 2015
8
induce inflammatory cytokines and make regulatory T cells dysfunctional12. Mice on a high sodium chloride diet have been shown to be more prone to more severe experimental autoimmune encephalomyelitis (EAE).
There are a number of environmental factors linked to MS which could be associated with immune activation.
The convergence of the following findings from research mean we are approaching a greater understanding of the causes of MS:
• The allelic variant location near immune genes • The location of SNPs on chromatin maps dictating
immune function-in particular NF-ƙB• Known environmental factors that link to genetic
variants• Myelin reactive T cells from MS secrete IL-17 and
GM-CSF, while T cells from healthy controls are more likely to secrete IL-10
• Autoreactive T cells in MS share similar gene expression signature to encephalitogenic T cells in EAE
• Clinical trials are looking at the effect of anti-IL-17 therapy and blocking T cell traffic to the CNS
Basic mechanisms of underlying disease “progression”
Hans Lassmann (Austria) reported on pathological analyses of brain tissues which highlight the involvement of both white and grey matter in MS and show how the pathological aspects of relapses are different from the features of the progressive form of the disease.
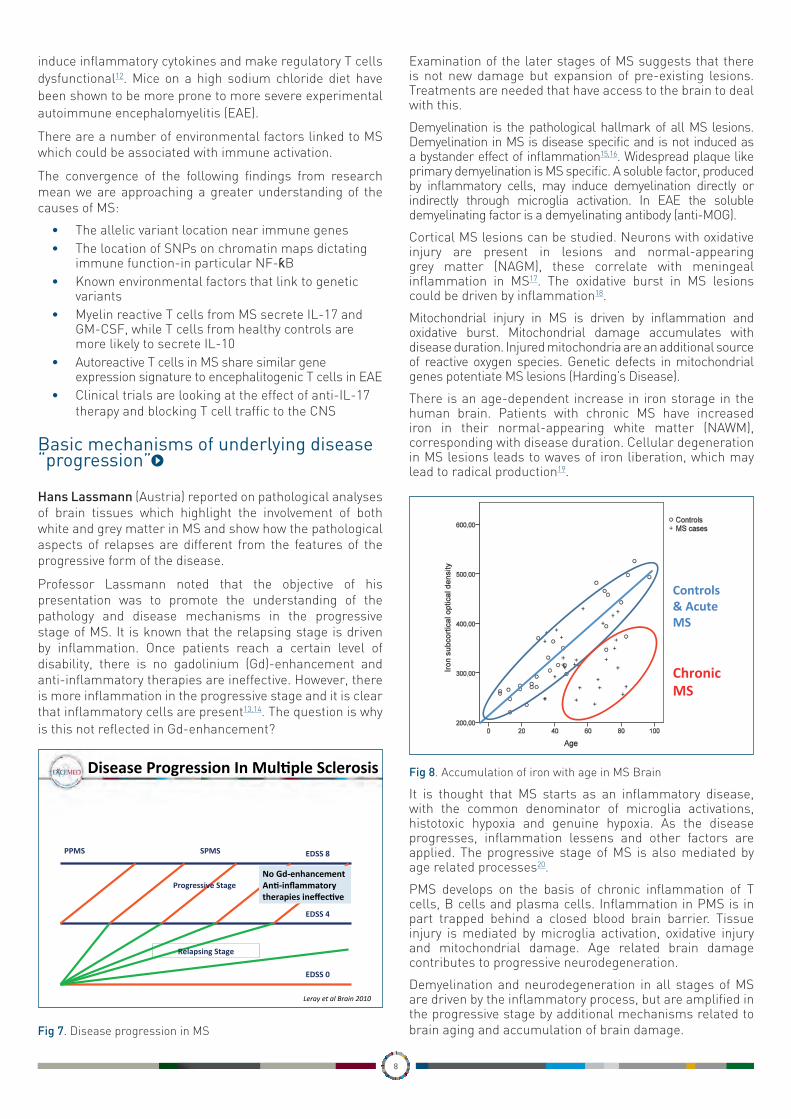
Professor Lassmann noted that the objective of his presentation was to promote the understanding of the pathology and disease mechanisms in the progressive stage of MS. It is known that the relapsing stage is driven by inflammation. Once patients reach a certain level of disability, there is no gadolinium (Gd)-enhancement and anti-inflammatory therapies are ineffective. However, there is more inflammation in the progressive stage and it is clear that inflammatory cells are present13,14. The question is why is this not reflected in Gd-enhancement?
Fig 7. Disease progression in MS
Examination of the later stages of MS suggests that there is not new damage but expansion of pre-existing lesions. Treatments are needed that have access to the brain to deal with this.
Demyelination is the pathological hallmark of all MS lesions. Demyelination in MS is disease specific and is not induced as a bystander effect of inflammation15,16. Widespread plaque like primary demyelination is MS specific. A soluble factor, produced by inflammatory cells, may induce demyelination directly or indirectly through microglia activation. In EAE the soluble demyelinating factor is a demyelinating antibody (anti-MOG).
Cortical MS lesions can be studied. Neurons with oxidative injury are present in lesions and normal-appearing grey matter (NAGM), these correlate with meningeal inflammation in MS17. The oxidative burst in MS lesions could be driven by inflammation18.
Mitochondrial injury in MS is driven by inflammation and oxidative burst. Mitochondrial damage accumulates with disease duration. Injured mitochondria are an additional source of reactive oxygen species. Genetic defects in mitochondrial genes potentiate MS lesions (Harding’s Disease).
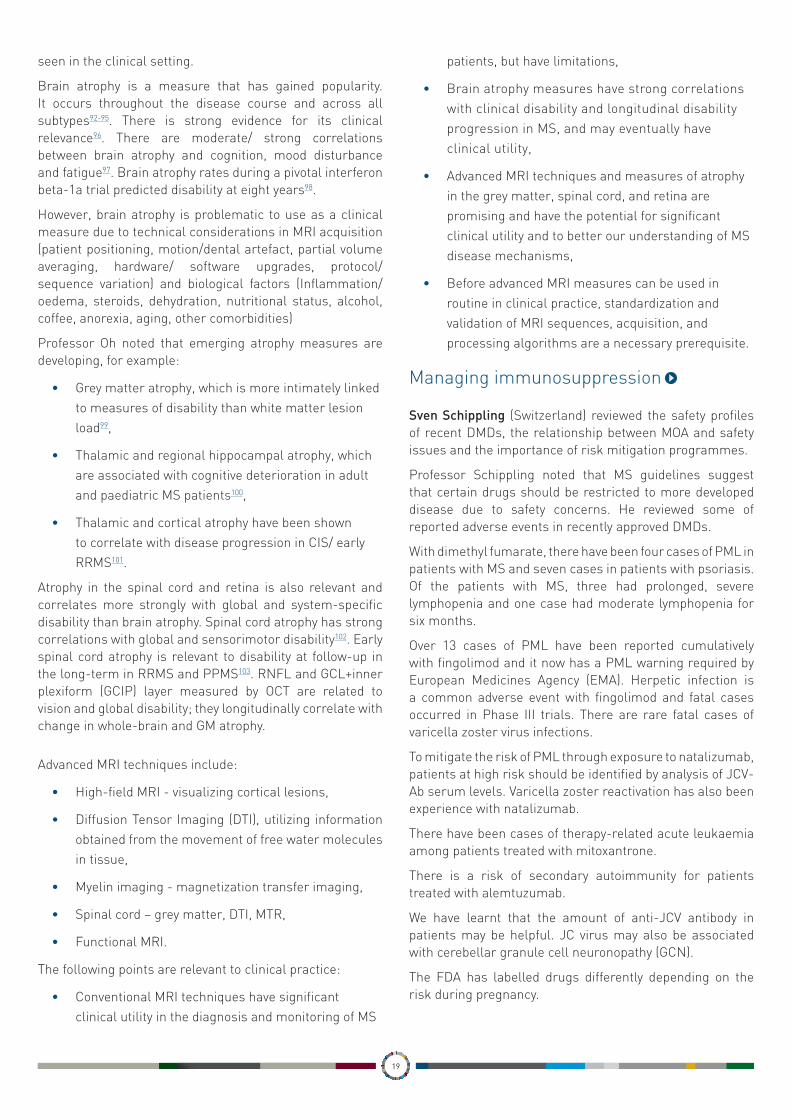
There is an age-dependent increase in iron storage in the human brain. Patients with chronic MS have increased iron in their normal-appearing white matter (NAWM), corresponding with disease duration. Cellular degeneration in MS lesions leads to waves of iron liberation, which may lead to radical production19.
Fig 8. Accumulation of iron with age in MS Brain
It is thought that MS starts as an inflammatory disease, with the common denominator of microglia activations, histotoxic hypoxia and genuine hypoxia. As the disease progresses, inflammation lessens and other factors are applied. The progressive stage of MS is also mediated by age related processes20.
PMS develops on the basis of chronic inflammation of T cells, B cells and plasma cells. Inflammation in PMS is in part trapped behind a closed blood brain barrier. Tissue injury is mediated by microglia activation, oxidative injury and mitochondrial damage. Age related brain damage contributes to progressive neurodegeneration.
Demyelination and neurodegeneration in all stages of MS are driven by the inflammatory process, but are amplified in the progressive stage by additional mechanisms related to brain aging and accumulation of brain damage.
DiseaseProgressionInMul?pleSclerosis
EDSS4
EDSS8
EDSS0
PPMS SPMS
RelapsingStage
ProgressiveStage
LerayetalBrain2010
NoGd-enhancementAn?-inflammatorytherapiesineffec?ve
7TMRI
Turnbull
Accumula6onofIronwithAgeinMSBrain
Controls&AcuteMS
ChronicMS
IronExportProteinsinMS
IroninHumanMSBrains

SESSION II: MS TREATMENT

10
Risk minimization
Per Soelberg Sørensen (Denmark) reviewed the benefit/ risk profile of treatments for MS, noting that new DMDs have a higher rate of efficacy than previous treatments, but also have a higher risk of adverse events.
Professor Soelberg Sørensen took a practical approach in discussing risk minimisation in the treatment of MS. He noted that all physicians want to find a balance between treatment efficacy and the burden of therapy (convenience, monitoring, tolerability and safety). Some treatments offer a moderate efficacy with a limited burden, whereas others are more effective but have a greater burden. Every time there is a new treatment, physicians must weigh the efficacy against the risk, whilst noting that some treatment risks can be easily minimised.
Professor Soelberg Sørensen reviewed the efficacy/ risk profile of the current available DMDs for MS:
Fig 9. Interferon beta: benefit/risk evaluation
Fig 10. Glatiramer acetate: benefit/risk evaluation
Fig 11. Teriflunomide: benefit/risk evaluation
Fig 12. Dimethyl fumate: benefit/risk evaluation
Fig 13. Fingolimod: benefit/risk evaluation
DMSC
Per Soelberg Sorensen
Interferon-beta:benefit/riskevalua6on
EstablishedBenefitsq Moderateeffectondiseaseac6vity(onaverage30%reduc6oninrelapserate)
q Lesseffectondisabilityprogressionq Excellentresponseinapproximately30%ofpa6ents
q Nolong-termsafetyconcerns
EstablishedInconveniencesandPossibleRisks
q Injectables§ Frequents.c.ori.m.injec6ons
q Trivialsideeffects§ Flu-likesymptoms(IFNβ)§ Injec6onsitereac6ons
q NeutralizingAn6bodies(NAbs)
DMSC
Per Soelberg Sorensen
Gla6rameracetate:benefit/riskevalua6on
EstablishedBenefitsq Onaverageamoderateeffectondiseaseac6vity(30%reduc6oninrelapserate)
q Lesseffectondisabilityprogressionq Excellentresponseinapproximately30%ofpa6ents
q Nolong-termsafetyconcerns
EstablishedInconveniencesandPossibleRisks
q Injectables§ Dailyinjec6onsmaydecreaseadherence
q Trivialsideeffects§ Injec6onsitereac6ons§ Systemicreac6ons
DMSC
Per Soelberg Sorensen
Teriflunomide:benefit/riskevalua6on
EstablishedInconveniencesandPossibleRisks
q Adverseeffects§ Diarrhoeaandnausea§ Hairthinning§ ALTincrease
q Poten6allyimmunosuppressiveproper6es
EstablishedBenefitsq Moderateeffectondiseaseac6vityq Moderateeffectondisabilityprogression
q EqualtoIFN-β1aSCq Onetabletdaily
DMSC
Per Soelberg Sorensen
DimethylFumarate:benefit/riskevalua6on
EstablishedInconveniencesandPossibleRisks
q Adverseeffects§ Flushing§ Abdominalpain
q Administeredastwotabletsdailyq LowriskofPML
EstablishedBenefitsq Robusteffectondiseaseac6vityq Moderateeffectondisabilityprogression
q Numericallybutnotsta6s6callysignificantbe_erthanGA
13
DMSC
Per Soelberg Sorensen
Fingolimod:Risks/Inconveniences>Benefits
EstablishedInconveniencesandPossibleRisks
q Adverseeffects§ Bradycardia,A-Vblock§ Re6naledema§ Infec6ons:dermatomalzoster
q Infrequentsevereadverseeffects§ Seriousinfec6ons:disseminatedvaricella�,herpesencephali6s�
§ Skincancers§ SinglecaseofPML
EstablishedBenefitsq SuperiortoIFN-β1aq Largeeffectondiseaseac6vityq Moderateeffectondisabilityprogression
q Onetabletdaily

11
Fig 14. Natalizumab: benefit/risk evaluation
Fig 15. Alemtuzumab: benefit/risk evaluation
MRI as a guide for treatment decisions
Nicola De Stefano (Italy) highlighted the potential benefits of new advanced MRI techniques compared with conventional MRI techniques for assessing and monitoring patients with MS.
Professor De Stefano gave an overview of how to use MRI to guide treatment decisions. He noted that physicians have used MRI since the beginning to help support decisions about initiating treatment, switching treatment and whether or not patients are responding to treatment. The purpose of MRI is to support decisions, not to make decisions. Physicians need to look at all the information they have available to make their decisions. MRI is also an important tool in identifying possible side effects of treatment.
Professor De Stefano reviewed the data on the relationship between MRI lesion activity and prognostic value for estimating disability progression in natural history cohorts21,22. Studies have shown that people with low lesions on presentation with MS have milder disease. A long term
study of patients with clinically isolated syndrome (CIS) showed that patients with low lesions had a better prognosis than those with lots of lesions on presentation23. The location of lesions can also be a factor24-26. It is important to take this into account when making treatment decisions.
Fig 16. Relationship between MRI lesion activity and prognostic value
MRI can help physicians assess whether or not a patient is responding to treatment. A review published in Neurology argued that, for patients starting interferon-beta, early MRI has the potential to provide important information when counselling patients about the likelihood of future treatment failure and to help inform decisions before clinical relapses or disease progression27.
The Canadian MS Working Group took into account the level of concern there should be for patients depending on the number of lesions. The group stressed that when thinking about assessing response using MRI, physicians should take into account the mechanism of action (MOA) of the drug. The recommendation from this group was that the baseline should be six months after starting treatment to look at changes in MRI28.
Professor De Stefano explained that looking at MRI alone tells you something that is useful, but is better to look at MRI, relapse and the Expanded Disability Status Scale (EDSS) together. Research into using clinical and MRI measures in combination to assess patient responses to interferon beta in MS showed that this combination allowed for greater accuracy in predicting treatment response29,30. This could be useful for physicians when making treatment decisions31.
Professor De Stefano noted that recently, the term disease-free status has been replaced by No Evident Disease Activity (NEDA) because of the limits in the ability to evaluate the full extent of underlying disease activity. NEDA takes account of lack of disease progression, no relapses and no MRI activity, with no MRI activity being the most heavily weighted. There is a question about whether brain atrophy and other biomarkers also be added to this concept.
NEDA has been tested in various trials, but it can be difficult to use in clinical settings in the long term. However, it does have a good long-term predictive value32.
Professor De Stefano presented the distinction between
14
DMSC
Per Soelberg Sorensen
EstablishedBenefitsq Profoundeffectondiseaseac6vity
q Significanteffectondisabilityprogression
q ImprovesQoLq Goodcost-effec6venessq Riskstra6ca6onforPMLpossible
EstablishedInconveniencesandPossibleRisks
q Intravenousinfusions§ Rareinfusionreac6ons
q RareNAbsq Infrequentsevereadverseeffects
§ PMLin2:1000peryear(aeer2years)
Natalizumab:Benefits>risks/inconveniences
15
DMSC
Per Soelberg Sorensen
Alemtuzumab:Benefits>risks/inconveniences
EstablishedInconveniencesandPossibleRisks
q Infusionassociatedreac6onsq Infec6onsq Immunethrombocytopenicpurpuraq Immunethyroiddisordersq Immunenephropa6esq Cytopenias
EstablishedBenefitsq Robusteffectondiseaseac6vityanddisabilityprogression
q Infrequentadministra6onq Long-las6ngefficacyq SuperioritytoIFN-β1asc
MRI&Prognosis
• ThereisevidencethatMRIlesionac6vityinearlydiseasehasprognos6cvaluefores6ma6ngdisabilityprogressioninnaturalhistorycohorts1,2
Pa6entsreaching
EDSSscore≥6.0(%)
≥10 4–9 1–3 0
45
35
18
6
50
40
30
20
10
0n=31 n=20 n=22
BaselineMRIlesionnumberandclinicalstatusat20years:propor6onofpa6entsreachingEDSSscore≥6.01
Numberofbaselinelesions
1.FisnikuLKetal.Brain2008;131:808–172.BrexPAetal.NEnglJMed2002;346:158−64
n=34

12
MRI and PML lesions and how to differentiate one type of lesion from the other33. He noted that patients with a high risk of PML should have an MRI every three months to allow for early recognition.
Fig 17. Distinction between MS and PML lesions
In summary, Professor De Stefano remarked that a combination of clinical and MRI measures should be used to assess treatment response. With specific treatments, MRI should be used to monitor safety as well as efficacy.
Visual platforms in clinical trials and patient monitoring
Pablo Villoslada (USA) asked if visual evoked potential (VEP) still has a role in MS monitoring. He reviewed the data available about the role of new tools including optical coherence tomography (OCT) in quantifying optic nerve damage, facilitating differential diagnosis (neuromyelitis optica [NMO] versus MS), monitoring disease progression, evaluating therapeutic efficacy and detecting novel pathology.
Professor Villoslada noted that recently it has been proposed to incorporate optic nerve among sites of damage accounting for dissemination in space (DIS). Some new tools have been proposed to study the anatomical integrity of the optic nerve and retina, among these OCT is the newer and more promising.
The visual pathway is a well-defined system and a useful model for studying CNS damage. In patients with MS, damage to the visual pathways presents clinically with optic neuritis (1/4 relapses and CIS); vision impairment along the disease course (subclinical optic nerve and primary damage to the retina). In PMS, vision is impaired with progression but less than motor function34.
Patients always rate vision as one of the top five priorities when it comes to quality of life (QOL). The validated quality of life measure for vision is the National Eye Institute Visual Functioning Questionnaire – 25 (NEI-VFQ-25) with a 10-
Item Neuro-Ophthalmic Supplement. The loss of seven letters (1.5 lines) on Low Contrast Visual Acuity (LCVA) is meaningful from a patient perspective35,36.
There are a number of assessments for visual function including visual acuity, colour vision, visual fields (perimetry), electrophysiology, and imaging. The most sensitive scale for visual acuity is 2.5% LCVA (Sloan charts)37.
Spectral domain OCT is fast and convenient, and is suitable to be used at a neurology outpatient clinic. It has high accuracy and high reproducibility. However, there are limitations; namely it is limited to imaging the central retina and it can be affected by diseases of the eye such as myopia and cataracts. In addition, each device uses different a quantification system with no interchange.
OCT is a validated marker for optic neuropathy (ON) severity. In retinal atrophy in ON, almost all the damage is established in the first three months. Retinal atrophy is a predictor of worsening disability in MS. The biomarker Peripapillary Retinal Nerve Fiber Layer (pRNFL) of less than 88 µm has been shown to correlate with an increase in EDSS next 2-5 years38. Trans-synaptic degeneration is present in the visual pathway and there is a correlation between pRNFL thickness and lesion load optic radiations39. It is not well known how well this describes damage of MS.
Electrophysiology can be used in MS monitoring. Latency delays of VEP are very sensitive as a measurement of demyelination. VEP latencies are the most sensitive for diagnosing ON. Multifocal VEP (mfVEP) is more objective than perimetry and is sensitive to sectorial damage40. VEP and mfVEP are being tested in randomised clinical trials with remyelinating drugs.
Retinal periphlebititis (PR) can also be a biomarker of MS severity. The prevalence of PR has decreased in recent decades, which possibly could be the effect of immunotherapies. It is associated with the presence of Gd+ lesions in the brain. It is easy to monitor using wide field retinography41-43.
The visual pathway can be a platform for clinical trials. In MS it is damaged in almost all patients and visual disability is a significant unmet need for patients. The design of clinical trials in ON with 2.5% LCVA as a primary end point have been agreed with the FDA in order to study this further44,45.
The following points are relevant to clinical practice:
• The damage to the visual pathway reflects overall CNS damage, so is helpful for monitoring the course of MS and in the decision making process
• OCT and VEP are validated markers of ON and should be used for monitoring and in making therapeutic decisions
• OCT has been demonstrated as a marker of disability progression in MS
Dis?nc?onBetweenMSandPMLLesions
Feature MS PML Shape Ovoid Diffuse
Borders Well-circumscribed
Ill-defined, infiltrative
Size 3–5 mm Large >5 mm
Location Periventricular/ Dawson fingers
Subcortical, finger-like projections
Mass effect Yes for large lesions
No
Persistence Resolves in approx 1 month
Progressively larger
YousryTAetal.NEnglJMed.354:924-933;dataonfile.

13
• Always use low contrast vision and colour vision (perimetry and quality of vision) for monitoring visual disability.
• ON must be considered an emergency
In addition, new technologies, including electrophysiology and laser based imaging, will be available for clinical use in the future.
How the lab could burden CD4 and CD5
Manuel Comabella (Spain) reported on the growing evidence to suggest the role of both T and B lymphocytes in MS pathogenesis. In his presentation, he focused on the cell populations which could be biomarkers.
Fig 18. B and T lymphocytes both contribute to MS pathology
B Lymphocytes expressing CD5 (CD5+ B cells) are involved in the physiopathology of different autoimmune diseases46. In MS, the percentage of peripheral blood CD5+ B cells is correlated with disease activity and earlier conversion from CIS to clinically definite MS (CDMS)47,48. Cerebrospinal fluid (CSF) CD5+ B cells are responsible for intrathecal immunoglobulin (IgM) production in MS patients49. Patients with CIS who had CSF IgM oligoclonal bands (OB) developed a second attack earlier than those without50. Presence of CSF IgM OB was associated with a more aggressive disease course and brain atrophy was higher51,52.
CSF IgM OB may have a role in primary progressive MS (PPMS) as well as in relapsing remitting MS (RRMS). CSF IgM OB are associated with more active inflammatory disease in patients with PPMS53. The presence of CSF IgG OB doubles the risk of having a second attack, independently of MRI findings54. The presence of CSF IgG OB was associated with a higher risk of the accumulation of disability (time to EDSS 3.0) independent of other variables55.
Professor Comabella reviewed the different biomarkers which have been used in clinical trials for DMDs:
For patients treated in a clinical trial for fingolimod, CD4+ central memory T cells (TCM) were used as a biomarker for disease activity. CD4+ TCM was higher in relapsed patients, which suggests this could have a predictive value for treatment56. The percentage of regulatory B cells was also studied as treatment response biomarker in patients treated with fingolimod. The percentage of IL-10 producing regulatory B cells was higher in treated patients and was higher in stable patients compared to active patients after 12 months or more of treatment57.
In studies with alemtuzumab, CD4+ T cell counts were used as a disease activity biomarker in alemtuzumab-treated patients, as CD4+ T cell counts are suppressed for prolonged periods. Patients with active disease showed an accelerated recovery of CD4+ T cells58.
In trials with natalizumab, CSF B-cell subsets were used as biomarkers of response to natalizumab. A decrease in B cell subsets was observed in natalizumab-treated patients free of disease activity. A decrease in CSF T cell subsets was observed in natalizumab-treated patients with and without disease activity59.
Peripheral blood natalizumab-induced lymphocytosis (NIL) has also been used as a biomarker for treatment response. The mean percentage of lymphocytes was high in responders compared with partial responders to natalizumab. The time to relapse was shorter in patients with low NIL60.
Hematopoietic stem and progenitor cells (HSPC) mobilization were used as biomarker of response in patients treated with natalizumab. CD34+ cells increased in natalizumab-treated patients and HSPC mobilization response varied among treated patients. HSPC nonmobilizer patients show persistent MRI activity after six months61.
With natalizumab there is a concern about an increased risk of PML. Peripheral blood CD4+ CD62L+ T cells were used as a biomarker of PML risk. It was proposed that CD62L be used as a biomarker for individual PML risk in patients treated with natalizumab in combination with the anti-JCV antibody index to improve the identification of natalizumab-treated patients at high risk of PML62. However, a recent study indicates that it is not a good biomarker for PML risk63.
CSF IgM OB has been shown to be a biomarker of PML risk in patients treated with natalizumab. It is hypothesised that high inflammatory status of patients positive for IgM OB could be PML-protective64.
Expansion of CD56bright natural killer (NK) cells were used as a biomarker for treatment response to daclizumab. They appear to mediate some of the treatment-related effects, but their numbers do not account for the full effect of daclizumab on MS-related outcomes65.
INTRODUCTION
Adapted with permission from Trends Pharmacol Sci., Vol.29(11), Linker RA, Kieseier BC, Gold R. Identification and development of new therapeutics for multiple sclerosis, pages 558-565, Copyright 2008, with permission from Elsevier.
B and T lymphocytes both contribute to MS pathology…
Cell populations
DA /TR biomarkers

SESSION III: MS TREATMENT

15
Methodological aspects in comparing treatment efficacy
Ludwig Kappos (Switzerland) reviewed the data highlighting the efficacy of new DMDs and cautioned that cross-study comparison is not possible.
Professor Kappos noted that there are now more than ten approved compounds for RRMS and CIS worldwide, with more to come. There is a better understanding of the complex interaction between the immune system, genes and environment. The question is how to decide between drugs when treating patients.
Fig 19. The Golden Era of controlled clinical trials in MS
The criteria to consider when making treatment decisions are the pathogenetic target (autoimmune attack / inflammation and/or degeneration); the comparative efficacy of treatment (short and long term effects); the risk/ convenience (short term and / or long term adverse events); and the therapeutic strategy (escalation or induction therapy). Of these, the most important consideration is the comparative efficacy
Professor Kappos reviewed the evidence that can be relied on when comparing the efficacy of different therapies. The available evidence consists of randomized controlled trials (RCTs), either placebo controlled trials or head to head studies; open-label comparative studies; single drug observational studies; cohort studies; and real world data.
Looking at the annualized relapse rates (ARR) in pivotal studies of approved MS drugs shows the problem in making comparisons across studies. In figure 20, both fingolimod and natalizumab appear to be more effective, but the placebo arms in these studies also have a lower ARR than in the other studies.
Fig 20. ARR in pivotal studies of approved MS drugs
It is important to understand the limitations of large RCTs and to consider how precise and valid the results of these trials are. The MS landscape is changing and there are partially conflicting results of nearly identically designed large phase III trials in RRMS. Similar inclusion criteria might result in different patient populations in SPMS as well as RRMS.
Head to head studies of DMDs face the problem of resources. There have only been nine out of 90 possible combinations of head to head studies conducted and the results of these were not clear. In comparative studies, much depends on the selection of patients.
Fig 21. Possible head to head studies of DMDs
With RCTs are that there is a short follow up, a limited number of exposed subjects, and a highly selected target population. Therefore, the question is how to get long term data? This can be obtained through open label extensions or cohort studies and registries.
Systematic data acquisition provides information about the short and long term adherence, adverse events,
1990
1990-2015: The «Golden Era» of controlled clinical trials in MS …
Bench to Bedside and Bedside to Bench Dates of first approval by EMEA or FDA are shown; a not approved in the EU; b voluntarily withdrawn from the market due to two cases of
progressive multifocal leukoencephalopathy; reapproval recommended by FDA and EMEA in 2006;
1992 1996 1998 2002 2004 2006 2008 2010 2012 1994 2000
IFN β-1a IM (FDA, 1996)
Mitoxantrone (FDA, 2000)a
IFN β-1b SC (FDA, 1993)
IFN β-1a SC (EMEA, 1998)
Natalizumab (FDA, 2004/2006)b
Fingolimod (FDA, 2010)
Glatiramer acetate (FDA, 1996)
Approved Disease-modifying therapies
Teriflunomide (FDA, 2012)
Di-methyl-fumarate (FDA, 2013)
2015
Alemtuzumab (EMA, 2013)
Annualized Relapse Rates in Pivotal Studies of Approved MS Drugs (all Patients with 24 M on Study)
PS
PS = Pre-Study PL = Placebo % reduction active drug vs placebo
IFNβ-1b 250µg eod
n=338
IFNβ-1a 30 µg q w n=172
GA 20 mg q d
n=215
IFNβ-1a 22 / 44µg 3xqw
n=560
Fingolimod
0.5 mg qd Natalizumab 300 mg q m
PL PS PL PS PL PS PL PS PL PS PL -68 -54
-29
-29
-32
-34
22 µg
44 µg
-32
n=1272 n=856
1.1
1.5
1.3
0.4
0.7
0.18 0.22
1.5 1.5
1.7
1.2 1.3
0.8 0.8
0.57
0.91 0.86
0.54
0.87
0
0.5
1
1.5
2
Head-to-Head Studies with the 10 actually available compounds
IFNβ-1b
IFNβ-1a IM
GA IFNβ-1a SC
NTZ Fingo Teri DMF GA TIW PEG-IFNβ
Alem-tuz
X 1b(>)1a
2X =
X X X X X X X X
IFNβ-1a IM
X X IM<SC
X X 1a<<Fi
X X X X X
GA X 1a(<)G
X =
X X X X G(<)D
X X X
IFNβ-1a SC
X X X X X =
X X X 2X 1a<A
NTZ X X X X X X X X X
Fingo X X X X X X X X X
Teri X X X X X X X X X
DMF X X X X X
GA TIW X X X X X
PEG-IFNβ
X X X X X X X X X
9 of 90 Possible Head-to-Head Studies

16
risks, prognostic factors and effectiveness in large and representative groups of patients. However, there are methodological constraints: the lack of randomised control/ placebo group, unblinding, retrospective assessment of relapses and adverse events (recall bias), changes in treatment / interruptions, and selective drop-out of patients (eg. with aggressive disease).
Bias and confounding in observational studies can be
reduced at the stage of study design and during studies by:
• Prospective, rigorous, protocol with pre-specified
reporting schedule (so that most of the potential
significant co-variates are captured),
• Defining the target population based on a minimum
set of inclusion/exclusion criteria, the comparator
group, primary endpoints, exposure and risk windows,
• Minimizing loss to follow-up by selecting sites with
the capacity to maximize participant retention,
• Adequate training of clinical site staff.
During analysis of these studies, bias and confounding can
be reduced by:
• Matching to select controls who are ‘matched’ with
the treated subjects on background covariates that
need to be adjusted for,
• Stratification to group subjects into strata
determined by observed background characteristics,
• Regression analysis after adjustment on background
covariates,
• Using propensity score as a “balancing score” to
reduce the impact of treatment selection bias,
• Using Bayesian score as a “corrective factor” when
analysing treatment effectiveness in observational
data,
• Within-subject methods whereby outcomes are
compared between periods before and after
treatment exposure within the same individuals,
• Sensitivity analyses to provide, through simulations,
direct estimates of the size and degree of imbalance
of a potential unmeasured confounder needed to
negate the results of a study,
• RECursive PArtitioning and AMalgamation
(RECPAM) for prognostic stratification, subgroups
analysis, interaction detection.
Fig 22. MS registries and databases
Professor Kappos used the example of the work with the MSBase database. Researchers have been able to use the information it contains to look at the effects of switching to interferon-beta or glatiramer acetate versus fingolimod, using methods allowing the specific matching of patients with similar prognostic scores66. They have also been able to examine the effects of switching to natalizumab versus fingolimod67.
Important clinically relevant progress has been achieved by applying the current paradigm of corporate sponsored control trials in MS, but as we are moving more towards comparative studies exploring the relative merits of more and more diverse and complex treatments we need additional prospectively planned, thoroughly conducted comprehensive observational and cohort studies; these must be investigator initiated and publicly funded studies.
How to assess treatment response
Mar Tintorè (Spain) reviewed the different criteria for response to MS therapy and asked whether NEDA was a realistic target to aspire to in the clinical setting.
Professor Tintorè asked whether, with the new DMDs available to treat MS, we should consider new treatment objectives. We need to commit ourselves to finding the best choice for each patient. What are the predictors when measuring therapeutic response? Real-world data with long-term follow-up are needed for each therapy.
There are a number of factors to use when monitoring therapeutic response68:
• Clinical predictors
– What happens in the first two years of treatment can predict the later outcome for patients
– Disease activity in the first two years clearly increases later risk
22 22
MS registries and databases International
v European Database for Multiple Sclerosis (EDMUS; Lyon) v MSBase Database (Royal Melbourne Hospital, Australia) v SUMMIT (MS Centers in Amsterdam, Basel, Boston ,
SanFrancisco) National
v Denmark (Danish MS Registry), Norway (Norwegian MS Registry), Sweden (Swedish MS Registry), Italy (Italian Imed-web MS Database), Germany (German MS Registry), Spain (Catalan MS Registry), Swiss MS Cohort Study, France
v USA (Department of Veterans’ Affairs MS Registry; North American Research Committee on MS [NARCOMS])
Regional v London Ontario Database (London, Ontario MS clinic) v British Columbia MS Database (BCMS; University of British
Columbia) v New York State MS Consortium (NYSMC; The Jacobs
Neurological Institute in Buffalo, NY) v And more…

17
• MRI predictors
– For example, having at least three active lesions has been shown to be a good predictor for future risk.
• A combination of MRI and clinical predictors
– Applying the Rio score (one or more relapses in the first year, an increase of 1 point in EDSS score confirmed at 6 months and three or more active T2 or gd+ lesions) shows that two positive variables is related to having an increased later risk.
The treatment goals of MS are changing with the arrival of new DMDs. In the early days, the goal was the management of patient’s symptoms; this moved to slowing disability progression and now we have the concept of NEDA. NEDA has emerged from the field of rheumatology where it has been implemented and accepted as a goal for clinical trials and for patient care69.
NEDA is also a prognostic indicator. For example, it has been shown that in patients who were NEDA at year two, 78% had no progression (change in EDSS ≤ 0.5) at year seven70.
NEDA does have some pitfalls, for example what can be seen might not reflect the full picture of the disease. NEDA might also be giving patients a false sense of security; they might interpret a lack of disease activity as a cure71.
The current definition of NEDA (NEDA-3) takes into account no disability progression, no relapses and no MRI activity (new/ enlarging T2 or gd+ lesions). A new definition of NEDA, NEDA-4, is being developed to include brain volume loss (BVL) in the criteria in order to better identify the disease. 0.4% BVL per year is probably the most appropriate cut off for including in NEDA-472.
Other parameters have also been proposed to add to the NEDA criteria including the Multiple Sclerosis Functional Composite Measure (MSFC), fatigue, depression and QoL. Biomarkers could also potentially be included in the criteria73.
Professor Tintorè asked whether the emerging concept of re-baselining should be considered when dealing with treatments that can take up to six months to be fully active. A change in T2 lesion might be reflective that the treatment is not yet fully active74,75.
The Magnetic Resonance Imaging in MS (MAGNIMS) guidelines standardise the MRI protocol for monitoring treatment efficacy, but these cannot always be applied in clinical practice76.
Professor Tintorè noted that research had been carried out to establish whether earlier prediction of long term disability is possible. The Rio score could differentiate patients with a probability of an increase of greater than 2 EDSS points, but NEDA could not77.
Professor Tintorè argued that follow-up MRIs are essential for monitoring response. NEDA is an important goal, but the definition will evolve. NEDA is difficult to sustain long term. Minimal clinical or MRI activity is not necessarily associated with a poor response to interferon beta. Should the aim actually be for minimal evidence of disease activity (MEDA)? Real-world data with long-term follow-up are needed for each therapy making it important that physicians contribute to registries where they can78,79.
Revisited induction
Giancarlo Comi (Italy) reviewed the concept and rationale of induction therapy and asked whether it still has a role to play in the era of new DMDs.
Professor Comi argued that the concept of induction therapy needs to be revisited. There is a treatment algorithm with the option to either follow the escalation (safety first) route or induction (efficacy first) route. Induction therapy means that the strongest treatment is used as first line therapy.
The use of induction therapy allows both T and B lymphocytes to be targeted80-83. In aggressive treatment, with the immunosuppression approach, the aim is to reset the immune system. Natalizumab has a strong effect, but it is not aiming to reset the immune system. Adequate immunosuppression, on the other hand, allows the immune system to be reset.
With the nature of MS disease progression, for a valuable period of time the patient might have a low presentation of disease because the CNS can compensate for damage84. However, by the time the effects are seen, it could already be too late. That which is lost in delaying treatment for MS is not regained.
Fig 23. MS disease progression
Professor Comi argued that it is better to take the risks early on when most benefits can be gained. For example, a study of induction with mitoxantrone followed by interferon beta vs interferon beta only, showed a better effect if the
Schoonheim,Geurts,Barkhof.Neurology2010

18
treatment was used early. Induction therapy is much better at delaying irreversible disability85.
Induction therapy should be used:
• In treatment-naive patients with an aggressive disease course
– Severe attack or cluster of attacks with rapid accumulation of disability (Marburg phenotype)
• In patients at high risk of early future disability
– High T2-T1 lesion load and high MRI activity plus other negative prognostic factors
• In patients who rebound after discontinuation of natalizumab
Recent studies in RRMS indicate that an EDSS score of 4 is a strong indicator of a high risk of transition to SPMS. There are a number of different definitions of aggressive MS:
• RRMS patients with one or more
– EDSS score greater than 4 in 5 years
– Two relapses in the last year
– Two MRI active lesions
– Treatment failure to one or more DMDs in one year
• EDSS of 6 or more in 5 years86
• Confirmed EDSS of 6 or more by age 4087
• Conversion to SPMS within 3 years
There are a number of different treatment options currently available for induction therapy:
• Immunosuppressive agents, mitoxantrone and cyclophosphamide
• Monoclonal antibodies in use, alemtuzumab and rituximab
A number of treatment options are also being investigated:
• New immunosuppressive agents, cladribine
• New monoclonal antibodies, ocrelizumab
• Hematopoietic stem cell transplantation (HSCT)
Professor Comi argued that prognostic and predictive factors should drive treatment decisions and induction therapy is recommended in patients with a high risk of aggressive disease.
Snapshots
The following snapshots provided participants with a quick overview of key topics:
Current and emerging treatments
Andrew Chan (Switzerland) gave an overview of the current and emerging DMDs available to treat patients with MS.
Professor Chan noted that there are currently many therapeutic options available. These vary according to disease activity and safety profile. The aim is to treat patients according to their individual benefit/ risk profile.
There are a plethora of different treatment guidelines available. The guidelines try to limit risk considerations to patient with the most active disease. The interpretation of data can have a high degree of subjectivity.
Potential new treatments for MS include daclizumab, a humanized (IgG1) antibody against CD25 (a-chain of high affinity IL-2 receptor), ocrelizumab, a humanized (IgG1) antibody against CD20, and cladribine, a synthetic purine-nucleosid analogue.
The possible mode of action of cladribine could explain why it has an effect on lymphocytes. This would lead to the potential adverse event of lymphocytopenia88. Phase III trials with cladribine showed a reduction in relapse rates and an increase in patients with NEDA at 96 weeks89. In the trails, there was a tendency towards malignancies90, but this was not replicated in the meta-analysis91.
Professor Chan concluded that there are still unmet medical needs in MS therapy and treatments should be tailored to individual benefit risk profiles. Emerging immunosuppressive treatments could play a role in future treatment.
Emerging MRI techniques and their relationship to clinical outcomes
Jiwon Oh (Canada) reported on the emerging advanced quantitative MRI measures which have demonstrated moderate to strong correlations with clinical disability and disease progression.
Professor Oh noted that MRI has revolutionised diagnosis and monitoring of patients with MS. This has allowed for earlier diagnosis, disease monitoring and assessment of treatment response, and has a predictive value in the clinical setting. Conventional MRI measures include T2 hyperintense lesions and Gd+ lesions.
However, conventional techniques are not without their limitations. There is insufficient sensitivity and specificity to tissue histopathology and limited quantitative neurological measures. MRI lesion load does not always relate to what is
19
seen in the clinical setting.
Brain atrophy is a measure that has gained popularity. It occurs throughout the disease course and across all subtypes92-95. There is strong evidence for its clinical relevance96. There are moderate/ strong correlations between brain atrophy and cognition, mood disturbance and fatigue97. Brain atrophy rates during a pivotal interferon beta-1a trial predicted disability at eight years98.
However, brain atrophy is problematic to use as a clinical measure due to technical considerations in MRI acquisition (patient positioning, motion/dental artefact, partial volume averaging, hardware/ software upgrades, protocol/ sequence variation) and biological factors (Inflammation/ oedema, steroids, dehydration, nutritional status, alcohol, coffee, anorexia, aging, other comorbidities)
Professor Oh noted that emerging atrophy measures are developing, for example:
• Grey matter atrophy, which is more intimately linked to measures of disability than white matter lesion load99,
• Thalamic and regional hippocampal atrophy, which are associated with cognitive deterioration in adult and paediatric MS patients100,
• Thalamic and cortical atrophy have been shown to correlate with disease progression in CIS/ early RRMS101.
Atrophy in the spinal cord and retina is also relevant and correlates more strongly with global and system-specific disability than brain atrophy. Spinal cord atrophy has strong correlations with global and sensorimotor disability102. Early spinal cord atrophy is relevant to disability at follow-up in the long-term in RRMS and PPMS103. RNFL and GCL+inner plexiform (GCIP) layer measured by OCT are related to vision and global disability; they longitudinally correlate with change in whole-brain and GM atrophy.
Advanced MRI techniques include:
• High-field MRI - visualizing cortical lesions,
• Diffusion Tensor Imaging (DTI), utilizing information obtained from the movement of free water molecules in tissue,
• Myelin imaging - magnetization transfer imaging,
• Spinal cord – grey matter, DTI, MTR,
• Functional MRI.
The following points are relevant to clinical practice:
• Conventional MRI techniques have significant clinical utility in the diagnosis and monitoring of MS
patients, but have limitations,
• Brain atrophy measures have strong correlations with clinical disability and longitudinal disability progression in MS, and may eventually have clinical utility,
• Advanced MRI techniques and measures of atrophy in the grey matter, spinal cord, and retina are promising and have the potential for significant clinical utility and to better our understanding of MS disease mechanisms,
• Before advanced MRI measures can be used in routine in clinical practice, standardization and validation of MRI sequences, acquisition, and processing algorithms are a necessary prerequisite.
Managing immunosuppression
Sven Schippling (Switzerland) reviewed the safety profiles of recent DMDs, the relationship between MOA and safety issues and the importance of risk mitigation programmes.
Professor Schippling noted that MS guidelines suggest that certain drugs should be restricted to more developed disease due to safety concerns. He reviewed some of reported adverse events in recently approved DMDs.
With dimethyl fumarate, there have been four cases of PML in patients with MS and seven cases in patients with psoriasis. Of the patients with MS, three had prolonged, severe lymphopenia and one case had moderate lymphopenia for six months.
Over 13 cases of PML have been reported cumulatively with fingolimod and it now has a PML warning required by European Medicines Agency (EMA). Herpetic infection is a common adverse event with fingolimod and fatal cases occurred in Phase III trials. There are rare fatal cases of varicella zoster virus infections.
To mitigate the risk of PML through exposure to natalizumab, patients at high risk should be identified by analysis of JCV-Ab serum levels. Varicella zoster reactivation has also been experience with natalizumab.
There have been cases of therapy-related acute leukaemia among patients treated with mitoxantrone.
There is a risk of secondary autoimmunity for patients treated with alemtuzumab.
We have learnt that the amount of anti-JCV antibody in patients may be helpful. JC virus may also be associated with cerebellar granule cell neuronopathy (GCN).
The FDA has labelled drugs differently depending on the risk during pregnancy.
20
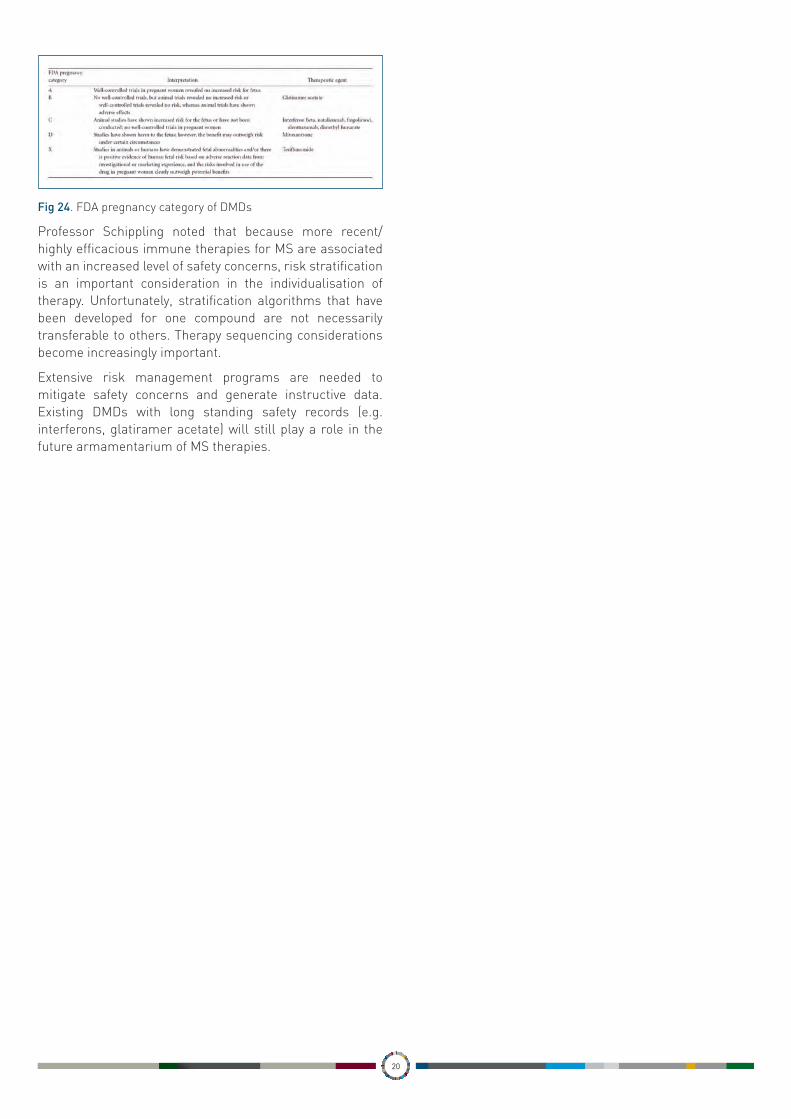
Fig 24. FDA pregnancy category of DMDs
Professor Schippling noted that because more recent/ highly efficacious immune therapies for MS are associated with an increased level of safety concerns, risk stratification is an important consideration in the individualisation of therapy. Unfortunately, stratification algorithms that have been developed for one compound are not necessarily transferable to others. Therapy sequencing considerations become increasingly important.
Extensive risk management programs are needed to mitigate safety concerns and generate instructive data. Existing DMDs with long standing safety records (e.g. interferons, glatiramer acetate) will still play a role in the future armamentarium of MS therapies.
MStherapiesandpregnancy–FDAcategories
Rommeretal.ClinExpImmunol2014

SESSION IV: RECOVERY AND REHABILITATION

22
Myelin repair
Stefan Bittner (Germany) argued for the importance of focusing on neuroregeneration as a target for MS treatment.
Professor Bittner stated that the concept of myelin repair will be one of the future topics in clinical practice. The therapeutic landscape, clinical measurements and treatment aims have changed a lot in the last few years and are continuously evolving. They started with just addressing symptoms, now the aim is to stop disease progression, and the next step is to focus on repair.
Current treatments target the immune system through depletion, blocking and modulation of the immune pathways. Even highly effective anti-inflammatory treatments cannot stop neurodegeneration and multiple drugs fail in patients with PMS104.
The basic assumptions of demyelination, neurodegeneration and clinical disability are that chronic demyelination leads to degeneration and loss of axons; neuronal loss correlates highly with clinical disability; and preservation of myelin and remyelination of axons can increase neuronal survival105.
Fig 25. Areas of remyelination exhibit reduced axonal loss compared to areas of chronic demyelination in brain tissue of MS patients
The question is whether there is a correlation between demyelination and axonal damage. A neuropathological study of 55 patients with MS showed little or no correlation between the demyelinated area and axonal loss in corticospinal and sensory tract106. However the determinants of axonal degeneration are complex and heterogeneic.
There has been evidence from animal models that myelin-interfering gene deletion results in subsequent axonal loss. Myelin is important because compact myelin surrounds axons for trophic support (axon-glia metabolic coupling) and demyelination elevates energy demands in denuded axons.
Remyelination can allow for the adequate redistribution of ion channels and restoration of saltatory conduction which partially resolves the increased energy demand. It can protect axons by restoring structural and trophic support. It can promote the production of trophic factors by oligodendrocytes107.
Fig 26. Remyelination
Remyelinated areas look different to original areas: the myelin sheaths are thinner and the internodes are shorter. So this remyelination is partial restoration not full restoration.
Endogenous remyelination is seen in MS patients. This is more prevalent in the early phase of disease and becomes less over time. The reasons limiting remyelination are uncertain. The therapeutic potential is largely unclear.
Trials have been carried out using mesenchymal stem cells for MS therapy. There are two approaches, HSCT to reboot the system or mesenchymal stem cells (MSC) expansion and reintroduction. A trial in 10 patients with SPMS showed significant improvement of visual acuity, VEP latency and optic nerve area after stem cell treatment. The problem is that the trials so far have been small and heterogeneous in their approach.
Anti-Lingo is another method currently being trialled. Preclinical models with anti-Lingo-1 showed enhanced oligodendrocyte differentiation, myelination and neuronal survival. There have been interesting results in phase II trials in AON. Further trials in RRMS are ongoing108.
It should be noted that remyelination does not always lead to functional restoration. Spontaneous remyelination restores myelin sheath and axonal transmission, but neuronal network structures remain impaired with the related loss of function109.
Current therapeutic approaches show only partial efficacy and are especially limited in the progressive forms of MS. Remyelinating approaches have a large therapeutic potential and we are just beginning to understand pathways and exploitable mechanisms.
Pharmacology for enhanced recovery
Diego Centonze (Italy) reviewed the recent evidence showing the possible effect long-term potentiation (LTP) could have in minimising the impact of neuronal damage.
Demyelina?on,neurodegenera?onandclinicaldisability
KornekBetal.,AmJPathol2000;157(1):267-76
Remyelinatedplaque(thinmyelin)
Noevidenceofacuteaxonalinjury
BASICASSUMPTIONS:=>Chronicdemyelina6onleadstodegenera6onandlossofaxons.=>Neuronallosscorrelateshighlywithclinicaldisability.=>Preserva6onofmyelinandremyelina6onofaxonscanincreaseneuronalsurvival.
Example:Areasofremyelina6onexhibitreducedaxonallosscomparedtoareasofchronicdemyelina6oninbrain6ssueofMSpa6ents.
Luessieetal.ExpertRev.Neurother.14(11),1315–1334(2014)
Remyelina?on

23
Fig 27. Neuronal damage and LTP
Professor Centonze discussed the role of LTP in the recovery of function for patients with MS110. LTP is a form of synaptic plasticity potentially able to minimize the effect of neuronal damage by restoring the excitability of neurons that have lost part of their synaptic inputs. It was first demonstrated in rats that LTP mediates clinical recovery after focal brain damage. LTP reserve correlates with clinical recovery after ischemic brain damage in humans. LTP reserve prevents clinical disability in patients with multiple sclerosis111.
Exercise has a role in promoting LTP. Rehabilitation has been shown to favour synaptic remodelling and plasticity112.
Fig 28. Role of exercise in promoting LTP
LTP can be impaired by acute inflammation, raising the possibility that effective MS treatment with DMDs favourably impacts on the effects of rehabilitation.
LTP requires the activation of N-methyl-D-aspartate (NMDA), cannabinoid and dopamine receptors, and of neurotrophins113. Pharmacological interventions aimed at favouring NMDA receptor signalling (D-aspartate), cannabinoid receptor stimulation (phytocannabinoids), dopamine receptor activation (L-dopa, amphetamine), or
BDNF release (SSRI) could enhance the beneficial effects of rehabilitation treatment by favouring synaptic plasticity.
New basis for rehabilitation
Jürg Kesselring (Switzerland) presented research showing the important role of rehabilitation in the lives of patients with MS.
Professor Kesselring argued that rehabilitation is important in the treatment of patients with MS. Fundamental to the everyday work of rehabilitation is the concept of resilience, which must be reinforced by physicians. The dimensions of resilience include physical (fitness and stamina, nutrition for energy, rest and recovery); emotional (calming and focusing, impulse control, emotional regulation, positive emotion, realistic optimism); mental (self-belief, outlook and perspective, thinking traps, sustained focus, causal analysis, control controllables); and spiritual (values and beliefs, empathy, reaching out).
Fig 29. Dimensions of resilience
As MS is a long term disease course with a complex symptomology, rehabilitation should be an organised process to empower the person with MS to maintain and regain life activities. The task is to reinforce this as much as possible.
When considering neuroplasticity in MS, we should not mix up different categories and we should not translate research immediately into patient care. The hope is to enhance benefits to patients. As well as evidence based medicine, we must really listen to patients by training language capacities and really understanding what they are saying.
It is important that the multidisciplinary team works together and works in cooperation with the patient and their caregiver. The integrated clinical care pathway must take account of:
• The patient’s description of their needs and goals,
• The therapist’s functional description of problems,
Roleofsynap?cplas?city(LTP)intherecoveryoffunc?on
AvanzinoLetal.,FrontBehavNeurosci,2015
Roleofexerciseinpromo?ngLTP
Pa_enARetal.,LearnMem,2013
BiernaskieJandCorbe_D,JNeurosci,2001RossiSetal.,NeurobiolDis,2009
Rehabilita6onfavourssynap6cremodelingandplas6city(LTP)

24
• The interdisciplinary setting of common goals (these should be clear and meaningful, realistically achievable and measurable),
• An assessment of goal achievements.
The problems in evaluating neurorehabilitation in MS include standardisation of input, reluctance to use a control group, difficulty in blinding, lack of consensus on outcome, variable choice of goals and measures114.
The benefits of rehabilitation measures for patients with MS include:
• The improvement of disability/handicap/QoL/wellbeing by multidisciplinary inpatient rehabilitation,
• The benefit of physiotherapy (inpatient/outpatient) on disability,
• The benefit of other specific components.
The long-term effects of rehabilitation measures include:
• The benefits outlasting treatment period after inpatient rehabilitation, cognitive training,
• The short-term effect of outpatient physiotherapy.
However in the long term, there is no influence on disease activity/progression.
Professor Kesselring concluded that neurorehabilitation is applied neuroplasticity, the forming of new synaptic networks and consolidation of existing ones according to requirements from the environment. Resilience must be induced, exploited and enhanced, all forces which act against and counterbalance the forces of gravity. Learning is always an activity. It does not happen just on its own or “by chance”. It is most effective in an appropriate environment under adequate guidance by good teachers and therapists.
Workshops
Instrumental techniques: MRI, functional tests (VEP)
Nicola De Stefano (Italy) and Letizia Leocani (Italy)
The different diagnostic tools to help neurologists diagnose and monitor the evolution of MS were discussed, including the crucial role of MRI.
Decision making process
Giancarlo Comi (Italy) and Mar Tintorè (Spain)
The complexity of the decision making process in the light of the advent of new DMDs, together with interferons was discussed.
Symptomatic treatments
Jürg Kesselring (Switzerland) and Per Soelberg Sørensen (Denmark)
The most appropriate rehabilitative approach for patients and the available treatments for the main MS related symptoms were discussed.
Fluids biomarkers
Amit Bar-Or (Canada) and Ludwig Kappos (Switzerland)
The available data on putative cerebrospinal fluid (CSF) and serum biomarkers of disease progression, MS type and prognosis were reviewed and discussed.

CLOSING PLENARY LECTURE

26
New challenges and new frontiers: the PMSA experience
Alan J Thompson (UK) presented the mission of the International Progressive MS Alliance (PMSA), which is to encourage organisations to work together to overcome the blocks delaying the achievement of the goal of develop effective treatments both for progression and symptom management for patients with PMS.
Professor Thompson presented the work of the PMSA and explained why there was a great unmet need in PMS, the challenges being faced and how they should be met.
PMS has a large worldwide impact, affecting at least half of all patients with MS, for whom the onset of progression is the main determinant of disability115. Although there have been a number of new treatments developed for RRMS, there is currently no effective treatment for PMS. Therefore, finding an effective treatment is a priority.
The age of onset of SPMS and PPMS tends to be similar, 40.2 for SPMS and 38.6 for PPMS and the diseases then run parallel to one another116. With increasing disability there is increased annual cost per patient.
Fig 30. Annual cost of MS per patient
Early treatment of MS is desirable in order to slow the course of the disease progression117. To achieve this, it is crucial to diagnose early, start treatment early and escalate treatment early if disease control is inadequate. As MS progresses, the protective mechanisms of the CNS become exhausted with time. In later stages of the disease, there is more structural damage and hence more disability118.
There are currently 142 clinical trials ongoing in MS with
a targeted total patient population size of 55,758 patients. However, only a small proportion of these trails are for PMS, RRMS remains the main focus for the pharmaceutical industry.
Fig 31. MS trials by clinical population
This is a very important area of concern for patients with PPMS. A survey by the MS society in the UK showed that effective treatment to slow, stop or reverse the accumulation of disability associated with MS is the most important concern.
The challenges in PMS include early diagnosis, defining the phenotype, clarifying the pathological mechanisms underpinning progression, understanding clinical outcomes/ biomarkers, and clinical trial design.
PMS also has the challenge that it is defined differently from different perspectives. For the neurologist, it is defined by the accumulation of disability and gradual change over time (progressive myelopathy); for the imager it is defined by progressive atrophy, expanding lesions and reduced MTR, NAA, fractional anisotropy; for the pathologist it is defined by axonal and oligodendrocyte pathology; and for the patient it is about the loss of independence, worsening symptoms and the inability to work. It is important to remember that the definition is different from different points of views, but the view of the patient should be central.
Standardised descriptions of the MS clinical course were published in 1996, these provided purely clinical phenotypes. In 2013, these were reviewed by the International Advisory Committee on Clinical Trials in MS and the descriptors were refined to include consideration of disease activity and disease progression119.
MSTrialsbyclinicalpopula6on
AnnualcostofMSperpa6ent
Mean annual cost per patient (PPP €)
0
10000
20000
30000
40000
50000
60000
70000
80000
90000
AU B E GE IT NL ES S E C H UK AU B E GE IT NL ES S E C H UK AU B E GE IT NL ES S E C H UK
mild (EDSS 0-3.5) - moderate (EDSS 4.0-6.5) - severe (EDSS 7.0-9.5)
PPP €
Indirec tco s tsInfo rmalC areS erv ices /Inves tmentsD irec tH ealthC are

27
Fig 32. Differences in the descriptions of the MS clinical course
1996/ 2013
The question is whether trials should be designed based on what is happening, rather than on the label of the disease.
A small proportion of people believe that inflammation is a reaction to neurodegeneration. This asks the question about whether inflammation is the driver or the response.
With clinical trials, the conventional design has a large number of patients, it is expensive and focused on inflammation not on repair. Professor Thompson suggested that new adaptive trial designs should be considered in order to increase the efficiency. The focus should be on neuroprotection/ repair.
The mission of the PMSA is to expedite the development of effective disease modifying and symptom management therapies for progressive forms of multiple sclerosis. The power of this mission has enabled many groups to work together who haven’t in the past.
The priority areas for the PMSA are underlying mechanisms/ experimental models; target pathways and drug repurposing; proof of concept trials (phase II); phase III clinical trials and outcome measures; symptom management and rehabilitation. Working groups have been set up for each, drawing on expertise from academia and industry
The following trials are currently ongoing or have been recently concluded in PMS:
• Phase II
– MS STAT – high dose simvastatin
– PROXIMUS Trial - oxcarbazepine in SPMS
– MS Smart Trial – riluzole, amiloride, fluoxetine in SPMS
– SPRINT-MS – ibudilast in PPMS/SPMS
– Biotin in SPMS
• Phase III
– INFORMS – fingolimod in PPMS
– ASCEND – natalizumab in SPMS
– ORATORIO – ocrelizumab (related to rituximab) in PPMS
– EXPAND – siponimod (related to fingolimod) in SPMS
• Others
– Mesenchymal stem cells, mastitinib, lipoic acid, erythropoietin, hydroxyurea, idebenone, minocycline, anti-Nogo, anti-lingo
In total there are 47 active clinical trials in PMS, 22 of which are industry-funded. 34 of these trials are focused on disease modification, the remainder target symptoms. 6 are stem cell trials. It might seem that there is a lot going on, but there is a lot more to be done.
The PMSA is awarding planning grants in support of the collaborative network, 11 of these were awarded in 2015. There is also a major interest in industry partnerships. In 2015, 736 trials were funded by alliance and alliance partners, half of these (385) were in in PMS. Understanding progression is by far the largest area of alliance-funded research.
The PMSA has provided multiple avenues for international experts to meet and discuss the urgent issues in PMS. There is a growing global commitment to PMS research. For the first time ever MS societies are working together to fund the research. It is also raising the profile of PMS and highlighting the unmet need.
Professor Thompson noted that while there is engagement and opportunity for collaboration, this still needs to be translated into clinical trials… There is a lot to do.
The scientific gaps include:
• Understanding mechanisms of progression,
• Translation of fundamental discoveries into application,
• Development of tools for predicting progression,
• Proof of Concept measures,
• Clinical trial designs and outcomes,
• Translating symptom management/rehab insights into clinical practice.
Lublin FD et al. Neurology. 2014;83:1-9.
LublinFDetal.Neurology.2014;83:1-9.

28
Wrap up
Professor Bates thanked all for attending and summed up the two full days of the conference. He provided a few takeaway thoughts:
• MS results from a complex interaction between B cells, myeloid cells and T cells,
• In all stages of MS, demyelination and neurodegeneration are driven by the inflammatory process,
• When deciding the right treatment, there are no safe or unsafe drugs – it is a matter of estimating the risk/ benefit and applying risk stratification and minimisation strategies,
• An appropriate environment and adequate multidisciplinary guidance are needed for successful neurorehabilitation.

REFERENCES

30
1. Bar-Or et al Ann Neurol 2010;67:452-4612. Rui et al Sciencetranslationalmedicine.org3. Stern et al Sci Transl Med. 2014 Aug 6;6(248):248ra1074. Uccelli et al, Trends Immunol 20055. Corcione et al Autoimmunity Rev 20056. Howell OW, et al Brain. 20117. Nylander and Hafler, Multiple Sclerosis. J Clin Invest, 2012 122:11808. Joel Stern, Kevin O’Connor et. al, Sci Transl Med, 20149. Hafler et al NEJM 2007;357(9)
10. Farh, et. al. Nature 518:337-43, 201511. Farez et al JNNP Online First, published on August 28, 201412. Hernandez et al JCI, 201513. Leray et al Brain 201014. Frischer et al Brain 200915. Moll et al 200816. Fischer et al Brain 201317. Haider et al; Brain 201618. Fischer et al, Brain 201319. Hametner et al Ann Neurol 201320. Mahad et al Lancet Neurology 201521. Fisniku LK et al. Brain 2008;131:808–1722. Brex PA et al. N Engl J Med 2002;346:158−6423. Tintore Brain 2015;138:1863-187424. Sombekke et al Neurology 201325. Tintore et al Neurology 201026. Calabrese et al Arch Neurol. 2007 Oct;64(10):1416-2227. Dobson et al Neurology 2014;82:248-25428. Freedman et al Can J Neurol Sci 2013;40:307-32329. Prosperini et al European Journal of Neurology 2009;16:1202-120930. Rio et al Multiple Sclerosis 2009;15:848-85331. Sormani et al Multiple Sclerosis 2012;32. Rotstein et al JAMA, Neurol 201533. Yousry TA et al. N Engl J Med. 354:924-93334. Martinez-Lapiscina et al Mult Scl, 201435. Galetta et al. Neurol Neuroimmunol Neuroinflamm, 201536. Heesen et al. Mult Scler, 200837. Galetta et al. Neurol Neuroimmunol Neuroinflamm, 201538. Martinez-Lapsicina et al. Lancet Neurol 201639. Klistorner Neurology. 2014 Jun 17;82(24):2165-7240. Galetta et al Neurol Neuroimmunol Neuroinflamm. 2015 Jul
23;2(4):e13541. Ortiz-Perez et al Neurology 201342. Sepulcre et al. Neurology 200743. Rio et al. Neurologia 199344. Gabilondo et al. Ann Neurol, 201545. Martinez-Lapsicina et al. Lancet Neurol, 2016a46. Youinou et al. Eur J Clin Invest 1993;23: 13947. Seidi et al. J Neuroimmunol 2002;133: 20548. Villar et al. MSJ 2011;17:69049. Villar et al. Clin Immunol 2010;137:5150. Villar LM et al. J Clin Invest 2005;115:187-9451. Villar et al. J Clin Invest. 2005;115:187-9452. Magraner et al. Neuroradiology 2012;54:5-1253. Villar et al., Ann Neurol 2014; 76:23154. Tintoré M et al. Neurology 2008;70:1079-8355. Tintoré M et al. Brain 2015; 138: 1863-7456. Song et al., 2015; PLoS ONE 10: e012492357. Grutzke et al., 2015; Ann Clin Transl Neurol 2:11958. Cossburn et al., 2013; Neurology 80:5559. Villar et al., 2012; Arch Neurol 69:19160. Signoriello et al., 2015; MS Journal Oct 961. Mattoscio et al., 2015; Neurology 84:147362. Schwab et al., 2013; Neurology 81:86563. Lieberman et al Neurology 2016;86:375-38164. Villar et al., 2015; Ann Neurol 77; 44765. Bielekova et al. Arch Neurol. 2009;66:48366. He et al., JAMA Neurol 2015; 9:167. Kalincik et al., Ann Neurol 2015, 77:42568. Rio J et al. Presented at ECTRIMS; 1013 September, 2014;
Boston, USA. P285.69. Rotstein DL et al. JAMA Neurol. 2015;72:152–15870. Rotstein DL et al. JAMA Neurol 201571. Giovannoni and Turner Multiple Sclerosis 2015;4:329-333
72. Kappos L et al. MSJ 201573. Stangel et al Ther Adv Neurol Disord 2015;8:3-1374. Filippi M et al. Neurol Sci. 2013;34:2085–209375. Freedman MS et al. Can J Neurol Sci. 2013;40:307–32376. Wattjes M et al. Nat Rev Neurol. 2015;11:59760677. Rio J et al. Presented at ECTRIMS;7–10 October, 201578. Rio J et al. Presented at ECTRIMS; 7–10 October, 2015; Barcelona,
Spain. P122379. Rio J et al. Presented at ECTRIMS; 1013 September, 2014; Boston,
USA. P28580. Sospedra M et al. Annu. Rev. Immunol. 2005. 23:683–747; 281. Ireland S et al. Mult Scler Int 2011:42394182. Lehmann-Horn K et al. Ther Adv Neurol Disord. 2013;6(3):161-17383. Fletcher JM et al. Clin Exp Immunol. 2010 Oct; 162(1): 1–1184. Schoonheim, Geurts, Barkhof. Neurology 201085. Edan CNS Drugs. 2013; 27(6): 403–409 201286. Gholipur et al, 201387. Menon al, 201388. Sørensen PS, et al. ECTRIMS 2009. (P472)89. Giovannoni G, et al. NEJM 2010; 362(5):416-426.90. Giovannoni G, et al. NEJM 2010; 362(5):416-42691. Pakpoor et al., 2015, Neurol Neuroimmunol Neuroinflamm 2015:e15892. Rudick et al, Neurology 1999; Simon et al Neurology 199993. Liu et al JNNP 1999; Losseff et al Brain 199694. Ge et al Radiology 200095. Fox et al Neurology 200096. Sormani et al Ann Neuro 201497. Benedict et al Arch Neuro 200498. Popescu V et al. J Neurol Neurosurg Psychiatry 2013;84:1082–9199. Zivadinov et al Brain 2013100. Till et al Neuropsych 2011101. Rocca MS J 2016102. Lukas JNNP 2015; Saster-Garriga Neurology 2005103. Oh MS J 2012104. Lublin Lancet. 2016 Mar 12;387(10023):1075-84105. Kornek B et al., Am J Pathol 2000;157(1):267-76106. Trapp and Nave. 2008 Annu Rev Neurosci 31;247-69107. Luessie et al. Expert Rev. Neurother. 14(11), 1315–1334 (2014)108. Franklin and French-Constant Nature Reviews Neuroscience 9, 839-
855 (November 2008109. Cerina et al., submitted110. Centonze D et al., Neurobiol Dis 2007111. Di Lazzaro V et al., Cereb Cortex, 2010112. Avanzino L et al., Front Behav Neurosci, 2015113. Schwenkreis P et al., BMC Neurosci, 2005114. Kesselring J: Neurorehabilitation in multiple sclerosis – what is the
evidence-base? J Neurol 2004 ; 251, Suppl 4: iv25 - iv29115. Scalfari et al Neurology 2011116. Scalfari et al Neurology 2011117. Bergamaschi R et al. Mult Scler 2012118. Schoonheim MM, Geurts JJ and Barkhof F. Neurology 2010119. Lublin et al Neurology 2014;83:278-286

Improving the patient's life through medical educationwww.excemed.org
EXCEMED - Excellence in Medical Education Headquarters14, Rue du Rhône - 1204 Geneva, SwitzerlandRepresentative OfficeSalita di San Nicola da Tolentino 1/b - 00187 Rome, ItalyT +39 06 420413 1 - F +39 06 420413 677
Copyright © EXCEMED, 2016. All rights reserved.