Multiple Regression Models Advantages of multiple regression Important preliminary analyses Parts of...
23
Multiple Regression Models • Advantages of multiple regression • Important preliminary analyses • Parts of a multiple regression model & interpretation • Raw score vs. Standardized models • Differences between r, b biv , b mult & mult • Steps in examining & interpreting a full regression model • Underspecification & Proxy Variables • Searching for “the model”
-
date post
20-Dec-2015 -
Category
Documents
-
view
234 -
download
3
Transcript of Multiple Regression Models Advantages of multiple regression Important preliminary analyses Parts of...

Multiple Regression Models
• Advantages of multiple regression• Important preliminary analyses• Parts of a multiple regression model & interpretation• Raw score vs. Standardized models• Differences between r, bbiv, bmult & mult
• Steps in examining & interpreting a full regression model• Underspecification & Proxy Variables• Searching for “the model”

Advantages of Multiple Regression
Practical issues …• better prediction from multiple predictors• can “avoid” picking/depending on a single predictor• can “avoid” non-optimal combinations of predictors (e.g., total
scores)
Theoretical issues …• even when we know in our hearts that the design will not support
causal interpretation of the results, we have thoughts and theories of the causal relationships between the predictors and the criterion -- and these thoughts are about multi-causal relationships
• multiple regression models allow the examination of more sophisticated research hypotheses than is possible using simple correlations
• gives a “link” among the various correlation and ANOVA models
Before launching into the various hypotheses tests and other types of analyses, be sure to “get familiar” with your data and determine if it has any “problems” …
1. Perform appropriate data checking & cleaning • non-normality, outliers & nonlinearities?
2. Get means and standard deviations for each variable • do they “make sense” for these measures & this population?
3. Consider the correlations of each variable with the criterion• do they “make sense” for these measures & this population?
4. Consider the correlations among the predictors (collinearities)• do they make sense for these measures & this population? • will there be a “collinearity problem” ?

raw score regression y’ = b1x1 + b2x2 + b3x3 + a
each b
• represents the unique and independent contribution of that predictor to the model
• for a quantitative predictor tells the expected direction and amount of change in the criterion for a 1-unit change in that predictor, while holding the value of all the other predictors constant
• for a binary predictor (with unit coding -- 0,1 or 1,2, etc.), tells direction and amount of group mean difference on the criterion variable, while holding the value of all the other predictors constant
a
• the expected value of the criterion if all predictors have a value of 0

Let’s practice -- Tx (0 = control, 1 = treatment)
depression’ = (2.0 * stress) - (1.5 * support) - (3.0 * Tx) + 35
• apply the formula patient has stress score of 10, support score of 4 and was in the treatment group dep’ =
• interpret “b” for stress -- for each 1-unit increase in stress, depression is expected to by , when holding all other variables constant
• interpret “b” for support -- for each 1-unit increase in support, depression is expected to by , when holding all other variables constant
• interpret “b” for tx – those in the Tx group are expected to have a mean depression score that is than the control group, when holding all other variables constant
• interpret “a” -- if a person has a score of “0” on all predictors, their depression is expected to be
46
increase 2
decrease 1.5
3.0 lower
35
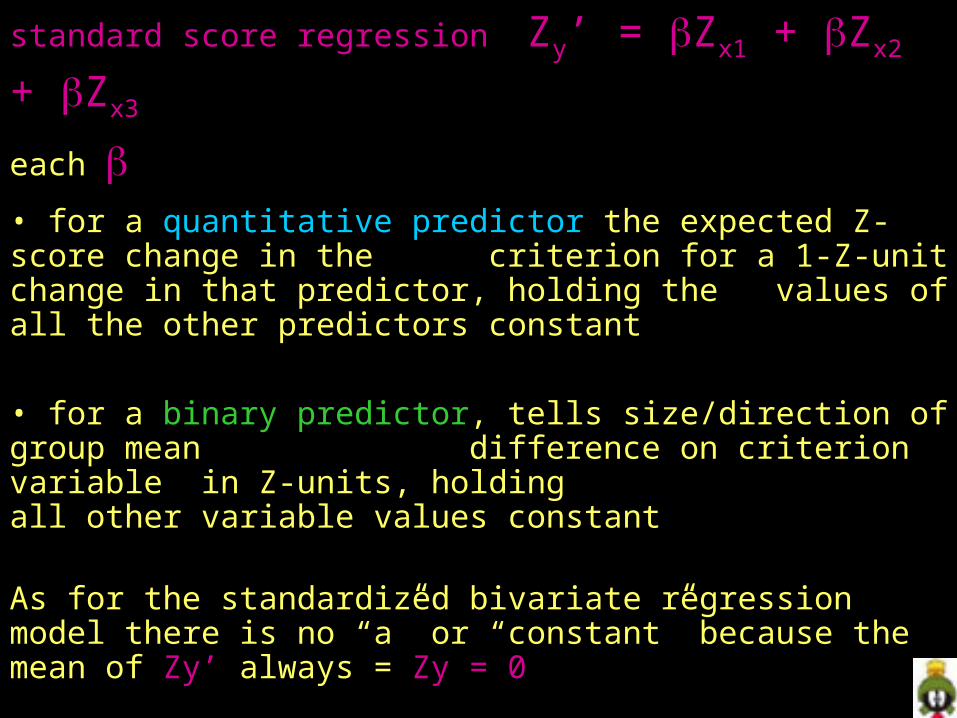
standard score regression Zy’ = Zx1 + Zx2 + Zx3 each
• for a quantitative predictor the expected Z-score change in the criterion for a 1-Z-unit change in that predictor, holding the values of all the other predictors constant
• for a binary predictor, tells size/direction of group mean difference on criterion variable in Z-units, holding all other variable values constant
As for the standardized bivariate regression model there is no “a” or “constant” because the mean of Zy’ always = Zy = 0
The most common reason to refer to standardized weights is when you (or the reader) is unfamiliar with the scale of the criterion. A second reason is to promote comparability of the relative contribution of the various predictors (but see the important caveat to this discussed below!!!).

It is important to discriminate among the information obtained from ...
bivariate r & bivariate regression model weights
r -- simple correlation
tells the direction and strength of the linear relationship between two variables (r = for bivariate models)
r2 -- squared correlation tells how much of the Y variability is “accounted for,” . “predicted from” or “caused by” X (r = for bivariate models)
b -- raw regression weight from a bivariate model
tells the expected change (direction and amount) in the criterion for a 1-unit change in the predictor
-- standardized regression wt. from a bivariate model
tells the expected change (direction and amount) in the criterion in Z-score units for a 1-Z-score unit change in that predictor, holding the value of all the other predictorsconstant
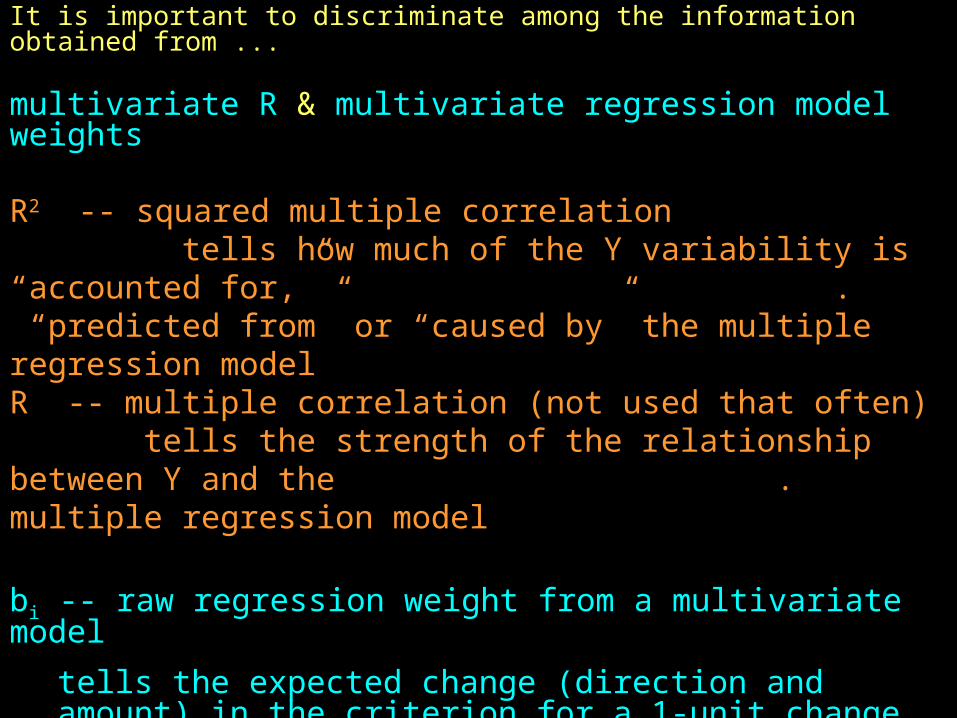
It is important to discriminate among the information obtained from ...
multivariate R & multivariate regression model weights
R2 -- squared multiple correlation tells how much of the Y variability is “accounted for,” . “predicted from” or “caused by” the multiple regression modelR -- multiple correlation (not used that often) tells the strength of the relationship between Y and the . multiple regression model
bi -- raw regression weight from a multivariate model
tells the expected change (direction and amount) in the criterion for a 1-unit change in that predictor, holding the value of all the other predictors constant
i -- standardized regression wt. from a multivariate model
tells the expected change (direction and amount) in the criterion in Z-score units for a 1-Z-score unit change in that predictor, holding the value of all the other predictors constant

y
x1
x2
x3
Venn diagrams representing r, b and R2
ry,x1ry,x2
ry,x3
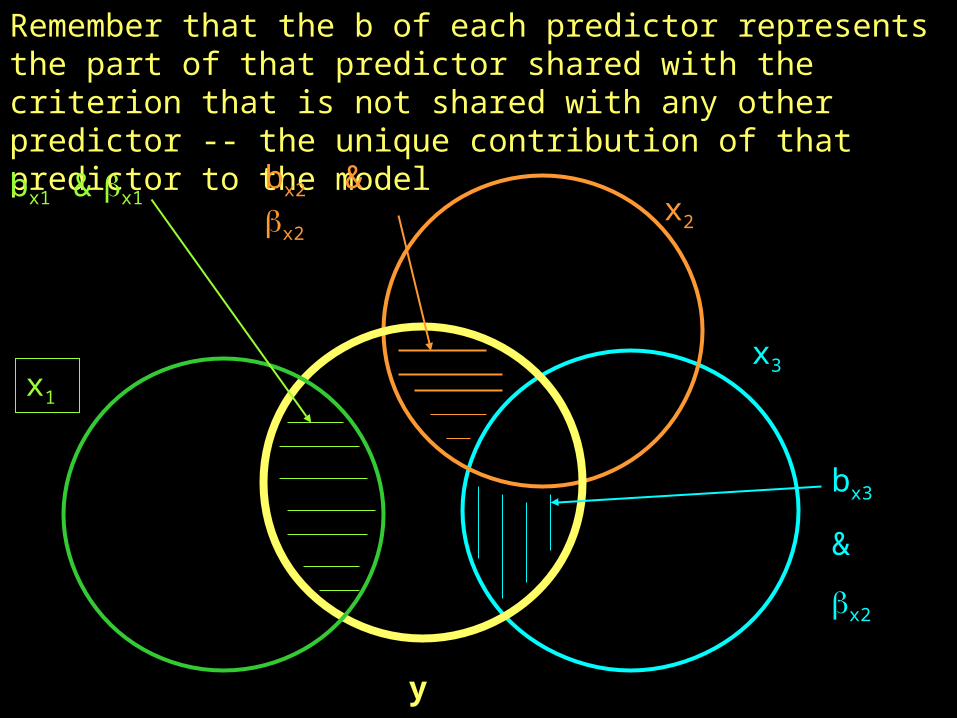
y
x1
x2
x3
Remember that the b of each predictor represents the part of that predictor shared with the criterion that is not shared with any other predictor -- the unique contribution of that predictor to the model
bx1 & x1bx2 & x2
bx3
&
x2

y
x1
x2
x3
Remember R2 is the total variance shared between the model (all of the predictors) and the criterion (not just the accumulation of the parts uniquely attributable to each predictor).
R2 = + + +

Inspecting and describing the results of a multiple regression formula …
0. Carefully check the bivariate correlations/regressions
1. Does the model work?
F-test (ANOVA) of H0: R² = 0 (R=0)
( R² ) / k F = ---------------------------------
(1 - R²) / (N - k - 1)
k = # preds of in the model
N = total number of subjects
Find F-critical using df = k N-k-1
2. How well does the model work? • R² is an “effect size estimate” telling the proportion of variance of the criterion variable that is accounted for by the model
• adjusted R² is an attempt to correct R² for the inflation possible when the number if predictors is large relative to the sample size (gets “mixed reviews” -- replication is better!!)
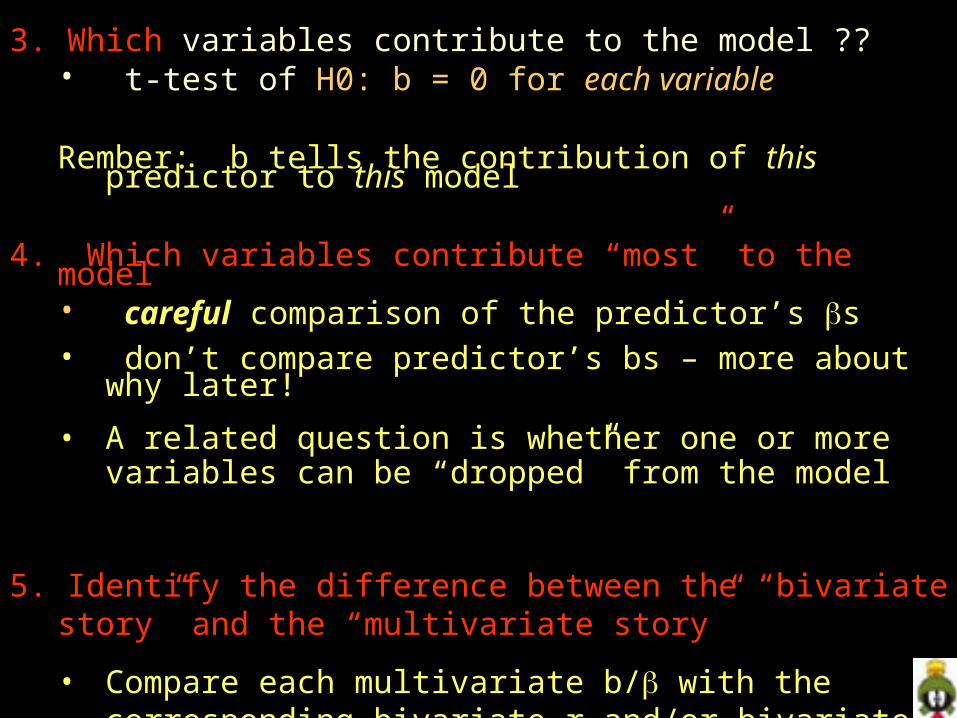
3. Which variables contribute to the model ?? • t-test of H0: b = 0 for each variable
Rember: b tells the contribution of this predictor to this model
4. Which variables contribute “most” to the model• careful comparison of the predictor’s s• don’t compare predictor’s bs – more about why later!
• A related question is whether one or more variables can be “dropped” from the model
5. Identify the difference between the “bivariate story” and the “multivariate story”
• Compare each multivariate b/ with the corresponding bivariate r and/or bivariate b/
• Bivariate & different multivariate “stories” may differ
Model Specification & why it matters !!!
What we need to remember is that we will never, ever (even once) have a “properly specified” multiple regression model one that includes all of & only the causal variables influencing the criterion !
Thus our model is – misspecified – including only some of the causal variables influencing the criterion (underspecification) and maybe has variables that don’t influence the (flooded).
What’s the problem with misspecification?
• Remember that each b () weight tells the direction and extent of the contribution of that variable to that model controlling for all the other variables in that model
• So, if we don’t have a properly specified model, the regression weights for the variables that are in the model don’t necessarily tell us what we hope to learn
• Said differently – the “unique contribution” of a particular predictor might vary importantly, depending up on what other predictors have been included in the model
What’s the problem with under-/misspecification .. cont ???
Since our model will tend to have fewer predictors than the complete model, predictors in the model are not competing with all the predictors that should be in model…
• the amount of collinearity is less than it would be in the full model• the “collinearity mix” is different than it would be in the full model
• weights are trying to “make up for” predictors not in the model
So …
• the resulting b weights will tend to overestimate the unique contribution of each predictor (increasing Type I errors)
• the resulting b weights might underestimate the unique contribution of each predictor (increasing Type II errors)
• the resulting b weights might have the wrong sign and misrepresent the unique contribution of a predictor (increasing Type III errors)

What’s the problem with underspecification .. some more ???
Since our model will tend to have fewer predictors than the complete model …
The R2 is “smaller than it should be” and the error variance (1-R2) is “larger than it should be”
• Since this error term is used in the model F-test and each of themultiple regression weight t-tests, all of those tests tend toward “missing” effects (Type II error)
Summary idea …
Behavior is complicated, and so, larger models are, on average, more accurate! When predictors are added (on average) …
• R2 goes up and error terms go down – reducing Type II errors
• The amount of collinearity increases – limiting Type I errors
• The collinearity mix is more correct – limiting Type III errors

What can we do about “misspecification” ?
• running larger models with every available predictor in them won’t help – models with many predictors tend to get really messy
• our best hope is to base our regression models upon the existing literature & good theory and to apply programmatic research
• include variables that are known to be related to that criterion – will help avoid Type I errors from a poor collinearity
mix
• include only “other variables” that there are theoretical reasons to think may contribute to the model
• use the largest and most representative samples available
• run multiple models – identify those variables that have consistent contribution (or not) across models with different subsets of predictors
• replicate – a lot!

Proxy variables
Remember (again) we are not going to have experimental data!
The variables we have might be the actual causal variables influencing this criterion, or (more likely) they might only be correlates of those causal variables – proxy variables
Many of the “subject variables” that are very common in multivariate modeling are of this ilk…
• is it really “sex,” “ethnicity”, “age” that are driving the criterion – or is it all the differences in the experiences, opportunities, or othercorrelates of these variables?
• is it really the “number of practices” or the things that, in turn, produced the number of practices that were chosen?
Again, replication and convergence (trying alternative measure of the involved constructs) can help decide if our predictors are representing what we think the do!!
Proxy variables
In sense, proxy variables are a kind of “confounds” because we are attributing an effect to one variable when it might be due to another.
We can take a similar effect to understanding proxys that we do to understanding confounds we have to rule out specific alternative explanations !!!
An example r gender, performance = .4 Is it really gender?
Motivation, amount of preparation & testing comfort are some variables that have gender differences and are related to perf.
So, we run a multiple regression with all four as predictors.
If gender doesn’t contribute, then it isn’t gender but the other variables.
If gender contributes to that model, then we know that “gender” in the model is “the part of gender that isn’t motivation, preparation or comfort” but we don’t know what it really is….

Searching for “the model” with multiple regression
A common question is,” What is the best multiple regression model for this criterion?”
This certainly seems like an important question, because such a model would tell us what variables must be considered to predict or perhaps understand the criterion & what variables can be safely ignored in our theory and practice.
A “the model” would have three important properties…
1. Every predictor in the model contributes to the model (parsimony or necessity)
2. No other predictor would contribute to the model if it were added (sufficiency)
3. No other predictor, if added to the model, would change the “structure” of the model (i.e., regression weights of the other predictors in the model)
Searching for “the model” with multiple regression
There are four things that routinely thwart our attempts to find “the model”
1. Collinearity – because of the correlations among the predictors (which are sometimes stronger than the predictors are correlated with the criterion) there are often alternative models that perform equally well
2. Underspecification – there’s just no way we can ever test that “no other predictor” would contribute (one solution is to decide theoretically on the set of predictors - almost cheating)
3. Also, again because of collinearity, it is possible to include a variable in model that, while it doesn’t contribute to the model, does change the size or even the sign of other predictors in the model. If so, the more “parsimonious” model might not be the most accurate.
4. Sampling variability … as always
So, what are we to do?
Rather than telling “the model” we need to tell “the story” (which also gives us the best chance of finding the model if it is out there…)
“the story” is told from …
1. Each predictor’s correlation with the criterion and the collinearities among predictors
2. Each predictor’s contribution to the full model (noting likely reasons why variables don’t contribute and suppressors)
3. Relative utility (R2) of alternative models and each predictor’s contribution to each
4. Building a story of which predictors contribute to what model(s) when included in them

So, what are we to do? No really ?????
Concerns about underspecification, proxy’s and modeling are all well and good, but we have to actually “get a model” once in a while!!
Much as we fret about and include in the discussion sections of our article an admission of the “procedural” limitations of our research, we need to fret about and admit to the measurement & modeling limitations of our research.
This is another example of the importance of replication and convergence via programmatic research!
So, remember & worry about these things, but don’t let that worry be debilitating!
Work with the best variables & data you can get, test hypotheses (even mid-hoc ones) whenever possible, propose & test models and their alternatives, etc.