Multiple Passenger Ride Sharing Changes Economics of Commuting
37
Multiple Passenger Ridesharing Changes the Economics of Commuting Provides both low price and short travel times, along with greener transport Jeffrey Funk Division of Engineering and Technology Management National University of Singapore
-
Upload
jeffrey-funk -
Category
Business
-
view
2.429 -
download
0
Transcript of Multiple Passenger Ride Sharing Changes Economics of Commuting

Multiple Passenger Ridesharing
Changes the Economics of CommutingProvides both low price and short travel times, along
with greener transport
Jeffrey Funk
Division of Engineering and Technology Management
National University of Singapore

Traditional Approaches to Transport
Private Cars
Advantage: Lots of freedom! Usually fast speeds and short travel times
Disadvantages: cars are expensive, cities are filled with roads and parking lots, much lost time in traffic during many parts of day
Public transportation
Advantage: Inexpensive
Disadvantages:
travel times are usually much longer than for private cars or taxis
almost double those of private cars and taxis in Singapore
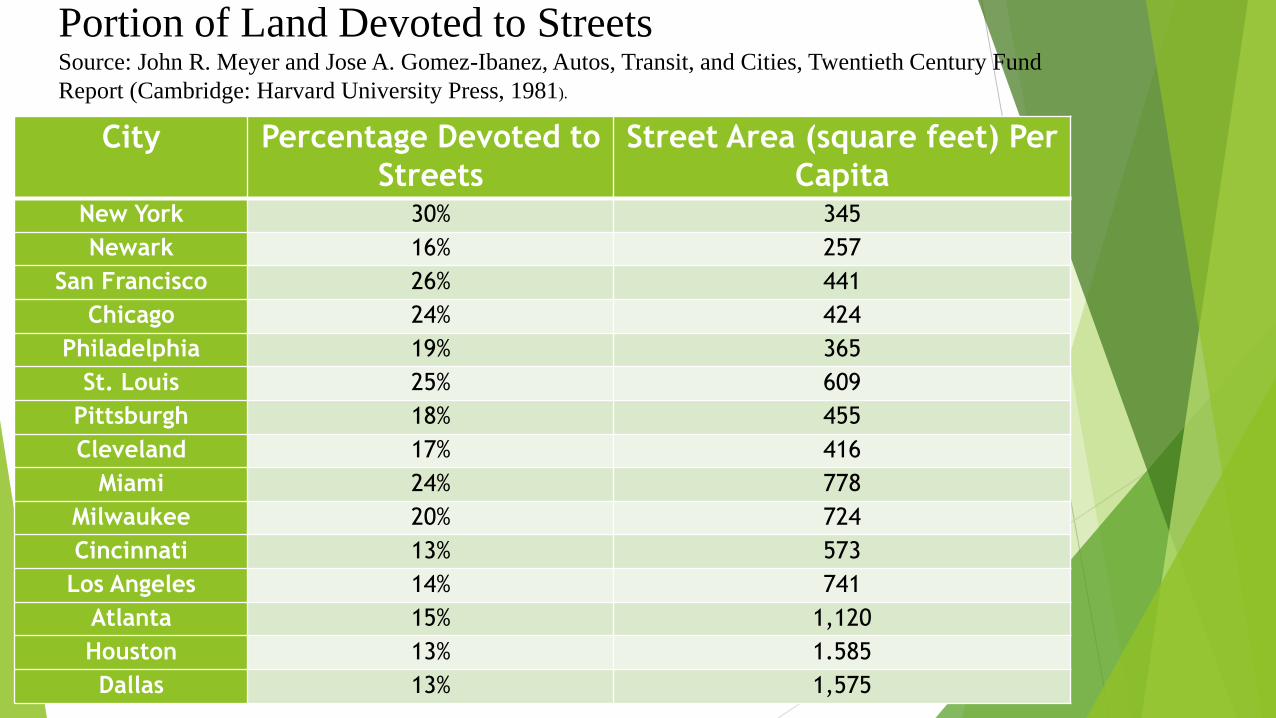
City Percentage Devoted to
Streets
Street Area (square feet) Per
CapitaNew York 30% 345
Newark 16% 257
San Francisco 26% 441
Chicago 24% 424
Philadelphia 19% 365
St. Louis 25% 609
Pittsburgh 18% 455
Cleveland 17% 416
Miami 24% 778
Milwaukee 20% 724
Cincinnati 13% 573
Los Angeles 14% 741
Atlanta 15% 1,120
Houston 13% 1.585
Dallas 13% 1,575
Portion of Land Devoted to StreetsSource: John R. Meyer and Jose A. Gomez-Ibanez, Autos, Transit, and Cities, Twentieth Century Fund
Report (Cambridge: Harvard University Press, 1981).

Rank City Parking Area* Divided by Land Area
1 Los Angeles 81%
2 Melbourne 76%
3 Adelaide 73%
4 Houston 57%
5 Detroit 56%
6 Washington, D.C. 54%
7 Brisbane 52%
8 Calgary 47%
9 Portland 46%
10 Brussels 45%
Land for Parking in Urban AreasSource: Michael Manville and Donald Shoup, “People, Parking, and Cities,” Journal of Urban Planning and Development, Vol.
131, No. 4, December 2005, pp. 233-245
* Includes all levels of all parking garages
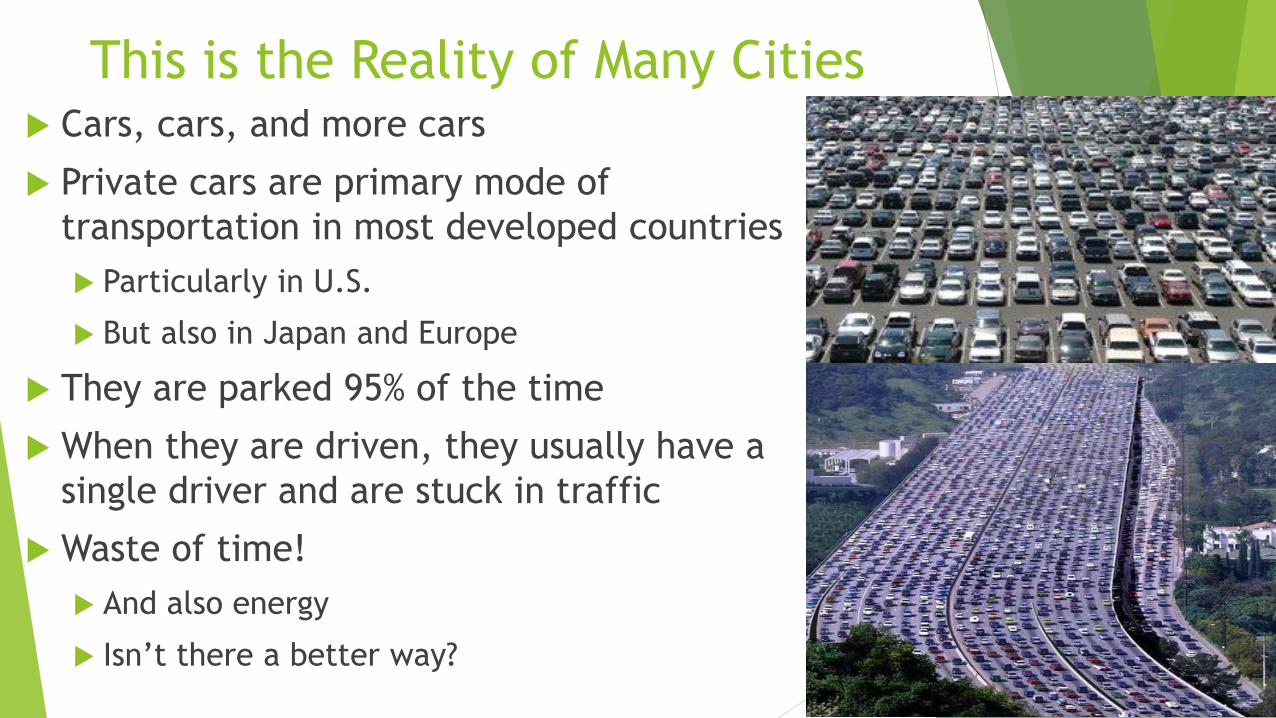
This is the Reality of Many Cities Cars, cars, and more cars
Private cars are primary mode of
transportation in most developed countries
Particularly in U.S.
But also in Japan and Europe
They are parked 95% of the time
When they are driven, they usually have a
single driver and are stuck in traffic
Waste of time!
And also energy
Isn’t there a better way?

There is a Better Way:
Multiple Passenger Ride Sharing
It combines the best of
Short travel times (similar to private vehicles)
Low cost, fewer private cars less congestion (similar to public transport)
How can it do this?
Many people have same starting and ending points, and times
Entrepreneurs can offer services for high-density routes and times
Information Technology enables us to do this
Big data provides better data on common routes and times
Smart phones enable interactions between riders and services
GPS and fast computers enable vehicles to have very complex routes
Very Different from Uber Pool or
Crowdsourcing
Entrepreneurs must take the risks
They must guarantee short travel times and low prices
Uber Pool has twice the travel times as Uber’s single
passenger services
People want short travel times!
Demand won’t emerge in the short run for Uber Pool!
Entrepreneurs must offer services for specific times
and routes
Even if there is initially low demand

Advantages of Multiple Passenger Ride Sharing
Provides another choice for users
Depends more on entrepreneurs than on governments
If successful,
Reduces cost of transport, with only small increase in travel time
Increases income for drivers, good for them and economy
Reduces congestion and thus travel times for everyone
Reduces petroleum usage and air pollution, without expensive subsidies for electric vehicles, solar cells, or wind turbines
Can reduce need for car ownership, which represent second highest cost for most low and mid-income families after homes
Less car ownership means less need for parking lots and roads

Singapore’s Taxis are Concentrated in a Few Places (bright
red) Throughout a Typical Day (this data is for Sunday)
Midnight3AM 6AM
9AM
Noon 3PM6PM
9PM

How Much Space Does Bright Red Occupy? 1% of Space? Two
Major Areas/Routes for Most of the Day (Green Boxes)
Midnight 3AM 6AM 9AM
Noon 3PM 6PM 9PM

Taxis are Operating on Same Routes at
the Same Time
These taxis can be shared with little increase in travel time
One main route along east coast
A second route from south central to central
Simple calculation for Singapore
28,000 taxis or 39 taxis per km2 (total area of 710 km2 )
If taxis are operating in 1% of area: 3,900 taxis per km2
So many chances for shared taxis
Singapore is not unique!
Similar situations probably exist in many cities

Travel Time
Price
Multiple Passenger Ride Sharing can Change the
Economics of Commuting
Private vehicle
or private taxi
Multiple
passenger
ride sharingPublic
TransportBEST: want
low price,
short time

Design Services that Better Match Real Demand
Use big data to understand
People’s actual starting and ending points by time of day
Provide direct services for high density routes and times
Fewer stops reduce travel times, thus increasing user value
Increase number of vehicles if demand emerges
Vehicles follow multiple routes during day, facilitated by GPS
Real densities and demand should determine fixed routes
Vans and cars follow demand as it changes from commuting to shopping
during middle of day and back to commuting in evening
During non-peak commuting times, vehicles can also be used for other
transport needs, such as deliveries (see below)

Such Private Bus/Car Mobile Apps are Emerging
Many transportation apps are emerging
Mostly private taxis
Uber, Didi Dache-Kuaidi Dache, Ola Cabs, Lyft, Grabtaxi
All are valued at >$1Billion, Uber >$50 Billion
Some transport multiple passengers in same vehicle
Uber Pool, LyftLine, Via (in NY) and Split
Driver receives requests via real-time routing algorithm, which maps pickups
and drop-offs into most efficient route
Problems is most services have long travel times, because there aren’t
enough people using the services
Most people want to plan their routes, not depend on dynamic algorithmhttp://bits.blogs.nytimes.com/category/special-section/?_r=1
http://districtsource.com/2015/05/split-a-new-ridesharing-app-is-out-to-shake-up-d-c-s-on-demand-transportation-scene/
Fixed Route Services Can Have Bigger Effect
Fixed route services transfer risk from passenger to service
Services must provide short travel times (and low prices)
through small number of stops, perhaps one or two at each
end
Dynamic services will not provide short travel times until
the number of users is high
Fixed route services can provide shorter travel times
Initially number of passengers may be small and thus service
might lose money
Depends on choice of routes
Services must target routes with high densities of users

Fixed of Fixed Route Services are Emerging
Examples
San Francisco area: RidePal, Chariot, Split, Potrero, Richmond,
Loup, Sunset
Bridj in Boston and Washington
Services make multiple stops only at beginning and end of route
Since no need to access car from parking garage, travel times
almost as fast as private vehicles, but can be much cheaper
The challenge is to find starting and ending points with lots
of demand; Big Data analysis will help
Most current services based on crude observations, not real data
Better data on starting and ending points will lead to better
services http://bits.blogs.nytimes.com/category/special-section/?_r=1; http://www.bridj.com/welcome/#how
http://www.theverge.com/2015/3/23/8279715/san-francisco-bus-leap-loup-chariot
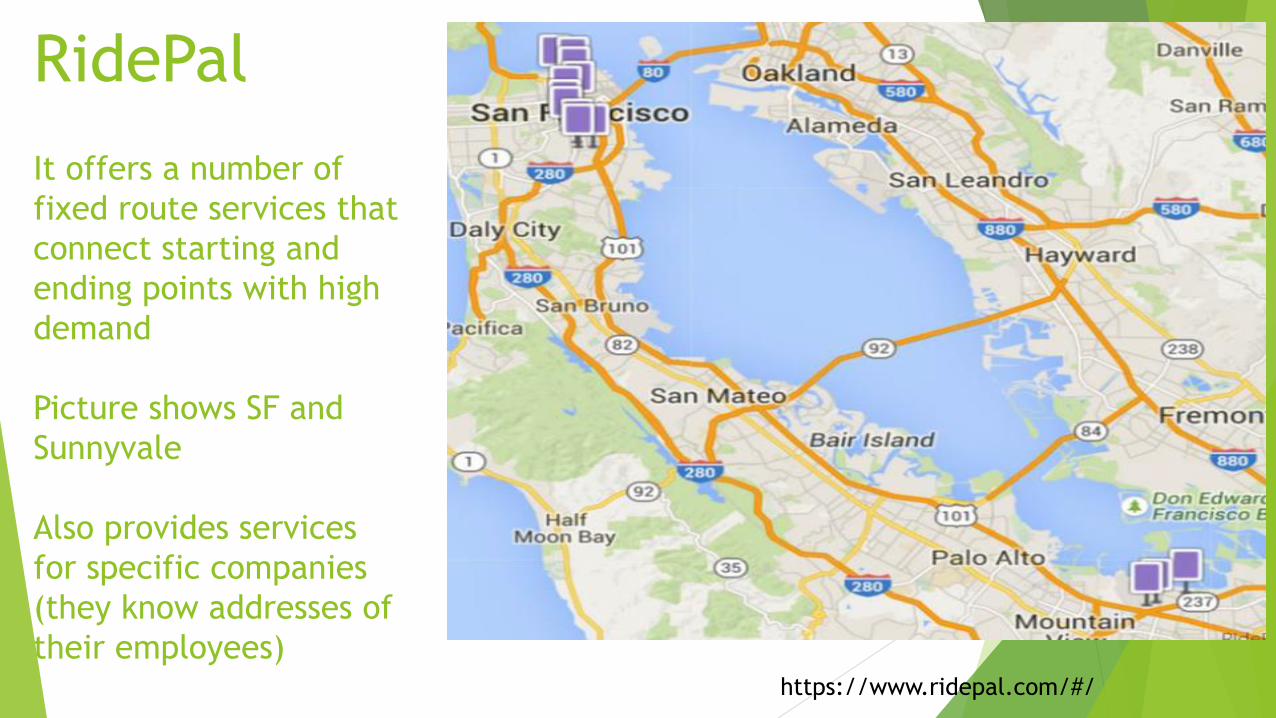
RidePal
It offers a number of
fixed route services that
connect starting and
ending points with high
demand
Picture shows SF and
Sunnyvale
Also provides services
for specific companies
(they know addresses of
their employees)https://www.ridepal.com/#/
Chariot Runs 14 passenger vans across San Francisco on five set routes
during morning and afternoon rush
Rides cost between $3 and $5
Passengers book from smartphones and use mobile phone apps to
monitor van location
Free WiFi also available
Total of 5,000 rides provided each week
Introduced tool to determine new routes, “Roll your Route”
Users can submit their optimum bus route and commute times
Can then recruit friends and neighbors to vote for the route
If route meets certain threshold, the service starts within a week
http://www.bloomberg.com/news/articles/2015-04-22/silicon-valley-private-bus-service-chariot-gets-more-vc-funding
Examples of Possible Services in Singapore
Consider NUS (National University of Singapore) night classes
500 to 1000 students attend classes on weeknights (6-9PM) in Faculty of Engineering
Probably similar numbers in other faculties and universities
Some of these students are
coming from the same place about 6PM
going to the same place at about 9PM
Can we offer cars, vans or mini-buses for them? Thus reducing
use of single passenger private vehicles
travel time for students who typically use public transportation
The more we know about starting and ending points by time of day, better services can be offered

Many other Examples in Singapore and
Other Places
Any location with many low- and mid-income people is one end point
Low price retail outlets
Popular shopping malls
Popular weekend destinations: beaches, parks, theme parks
Schools, universities, and government offices
Entrepreneurs can connect these end points with residential locations that are close and are densely populated
Learn from results, expanding successful routes and reducing unsuccessful routes
Data base will improve over time

What About Other Transport Demands
Ride sharing vehicles/vans are wasted when they are parked
Are there transportation demands during non-peak hours, such as 10AM to 4PM?
Can vehicles and vans be used for other types of transport services?
Use them for deliveries and other applications?
Uber wants to do other applications, why can’t others?
Many store-owned vehicles sit 90% of the time
The following slide suggests there is large demand for transport in non-peak hours
Understanding the demand through big data is essential

0
50
100
150
200
250
0 5 10 15 20
Relative Traffic On All Roads, Great Britain, by Time of Day
Ride sharingcars canalso servicehigh off-peak demand
May be lots of potential during non-peak times
Ride sharing cars and vans can be usedfor other transport applications duringmiddle of day,when there is lesscommuting
We need better info onstarting and ending pointsduring non-peak hours
PeakCommutingTimes

Challenge is to Find High Density Routes
Taxi companies have good data,
because pick-up and drop-off points are often close to user starting and ending points
Same with Waze, a community-based traffic and navigation app (acquired by Google)
Train and bus companies also have data on boarding and alighting points but,
these points may be far from actual user starting and ending points
Ride sharing companies are collecting data and will likely guard it closely
Employers and governments also have data for specific people on
residential
employment locations
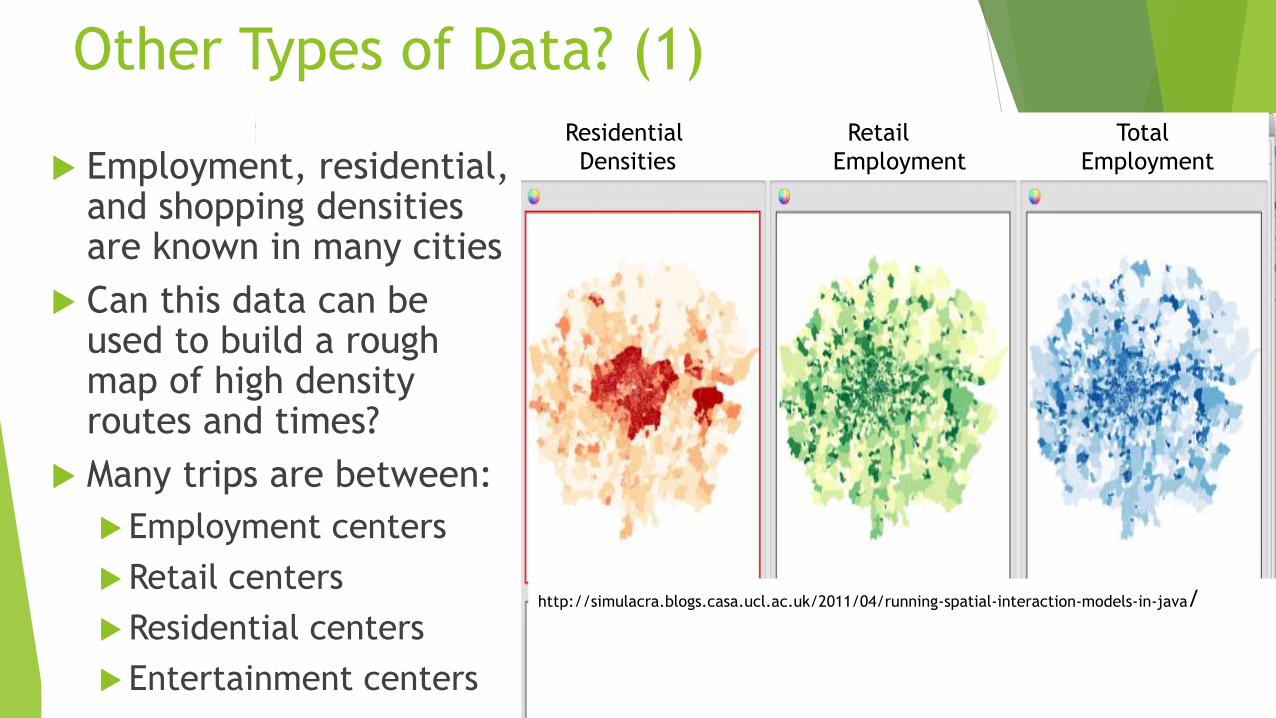
Other Types of Data? (1)
Residential Retail Total
Densities Employment Employment
http://simulacra.blogs.casa.ucl.ac.uk/2011/04/running-spatial-interaction-models-in-java/
Employment, residential, and shopping densities are known in many cities
Can this data can be used to build a rough map of high density routes and times?
Many trips are between:
Employment centers
Retail centers
Residential centers
Entertainment centers

Other Types of Data? (2)
Can this rough map be used to
devise a travel model for a city?
Can we assume travel times for work
and shopping activities?
Would time-of day road, train, bus,
and taxi usage data or retail data
provide a better model?
Can this model help us devise ride
sharing routes and schedules?
Can simulations help us identify the
best combinations of routes and best
schedules?
Where should vehicles stop and at
which times?
Can Employers Help?
For example, should employers provide anonymous
data on home addresses to help design transport
services for them?
Well designed services could
dramatically cut travel times for users
increase employee satisfaction
reduce traffic on trains during peak demand
Should governments require employers to provide
data, in order to reduce peak demand traffic on
trains?

Multiple Passenger
Ride Sharing can
Change Conventional
Wisdom about
Energy Usage: High
urban densities
(and centralized
cities)
are needed for low
energy consumption
in transport
Newman P, Kenworthy J 1989. Cities and
automobile dependence : a sourcebook.
Aldershot Hants England: Gower Technica

Conventional Wisdom About Lower Energy Usage
High urban densities are necessary for low energy usage
Shorter distances to travel
More walking and bicycling in dense than in less dense cities
Vehicle, bus, and train trips are shorter
More public transportation partly because better economics
of public transportation
Both lead to lower energy usage in transportation
Examples of extremes
Long car commutes in Los Angeles
Short bus or train commutes in Hong Kong

0
20
40
60
80
100
0 50 100 150 200 250 300 350
Asia
Canada
Australia
US
Public
Transport
(%)
Density
(per hectare)
Public Transport Usage (%) is Higher in Dense Cities
(Asia, Canada, Australia, US)
Newman P, Kenworthy J 1989. Cities and automobile dependence : a sourcebook. Aldershot Hants England: Gower Technica

0
5
10
15
20
25
30
0 5 10 15 20 25 30
A More Detailed Look at Canada, Australia, and US
New US Cities
Decentralized
Designed for Cars
Old US
Cities
Australia
Canada
Density
(per hectare)
Public
Transport

Why the Differences?
Public Transportation tends to be more economic when
Population is large, population density is high
Cities are designed around walking (and not cars)
Cities are centralized and commuting is one direction (e.g., Tokyo)
Public Transportation is often designed for centralized one
direction commuting during peak hours
Easy to design; just bring people downtown for
work and then back home
Train and bus routes are fixed, repeat same routes
Routes are repeated with only changes
in frequency of service by time of day

Centralized Cities/Rail Lines
(with multiple centers emerging)

Some cities have multiple centers,
particularly in the U.S. where growth
has occurred in the South-West
(California, Texas, Arizona) and FloridaMultiple Centers
Multiple Passenger Ride Sharing Will Overturn
this Conventional Wisdom
Can increase the number of passengers per vehicle and thus reduce energy usage
Even lightly congested cities can do multiple passenger ride sharing
First find high density routes and times and offer services
Then work towards lower density routes and times and offer services
The end result can be lower energy usage along with
Lower cost and time of transport
Less congestion and thus travel times for everyone
Lower car ownership, which represent second highest expenditure for most low and mid-income families after homes
Less car ownership means less need for parking lots and roads

Conclusions
Multiple passenger ride sharing can change the economics of
transport
How can it do this?
Many people have same starting and ending points, and same times
We just need to identify those routes and times
Information Technology enables us to do this
Big data provides better data on common routes and times
Smart phones enable interactions between riders and services
GPS and fast computers enable vehicles to have very complex
routes
Conclusions (2)
Not just Singapore and other high density
populated cities!
Smaller and less dense cities can also do this
Cities should provide more data, to help
services identify common routes
Cities have data, so they can help
Much cheaper than building train lines and
buying buses

Conclusions (3)
Even Los Angeles can do this
Cars, mini-buses and vans are used for high demand routes
Big data can find these routes and times
This will cause users to depend more on ride sharing,
reducing private vehicle usage and ownership
Can we reduce number of vehicles on roads by more
than half during peak hours?
Can we reduce the number of cars per family from two to one?
Can Los Angeles have lower energy usage than Tokyo currently does?
Perhaps, because no empty trains and buses running in opposite directions
And fewer empty trains and buses during off-peak hours
Instead, many full ride sharing vans and mini-buses