Multiple Indicator Cluster Survey - Amazon Web … East and... · The Palestinian Multiple...
28
Mulple Indicator Cluster Survey 2014 Key Findings February, 2015 Mulple Indicator Cluster Survey 2014 Key Findings February, 2015 State of Palesne Palesnian Central Bureau of Stascs
Transcript of Multiple Indicator Cluster Survey - Amazon Web … East and... · The Palestinian Multiple...

Multiple Indicator Cluster Survey
2014
Key Findings
February, 2015
Multiple Indicator Cluster Survey
2014
Key Findings
February, 2015
State of PalestinePalestinian Central Bureau of Statistics
Administrator
Sticky Note
The content of the Key Findings Report has been changed in August 2015 to reflect the small corrections noticed when preparing the Final Report

1
Multiple Indicator Cluster Survey 2014
Key Findings
February, 2015
State of PalestinePalestinian Central Bureau of Statistics

2
© Rabi-ul-Thani, 1436 – February 2015All Rights Reserved.Citation: Palestinian Central Bureau of Statistics, 2015, Multiple Indicator Cluster Survey, 2014. Ramallah/Palestine
All correspondence should be directed to:Palestinian Central Bureau of StatisticsP. O. Box 1647, Ramallah, PalestineTel: (972/970) 2 298 2 700 Fax: (972/970) 2 2982 710Email: [email protected] Web-site: http://www.pcbs.gov.ps
3
Palestinian MICS at a glance.
Child mortality
Nutrition
Child health
Water and sanitation
Reproductive health
Child development
Literacy and education
Child protection
HIV/AIDS
Notes
5
7
8
12
15
12
16
19
21
23
24
Table of Contents
4
The Palestinian Multiple Indicator Cluster Survey (MICS) was carried out in 2014 by Palestinian Central Bureau of Statistics in collaboration with Ministry of Health, as part of the global MICS programme. Technical support was provided by the United Nations Children’s Fund (UNICEF). The survey was financially supported by the Palestinian Na-tional Authority (PNA), UNICEF and UNFPA.
The global MICS programme was developed by UNICEF in the 1990s as an internation-al household survey programme to collect internationally comparable data on a wide range of indicators on the situation of children and women. MICS surveys measure key indicators that allow countries to generate data for use in policies and programmes, and to monitor progress towards the Millennium Development Goals (MDGs) and other internationally agreed upon commitments. The Palestinian Multiple Indicator Cluster Survey has as its basic objectives:
To furnish data needed for monitoring progress toward goals established in the Mil-lennium Declaration and other internationally agreed upon goals, as a basis for future action.
To contribute to the improvement of data and monitoring systems in Palestine and to strengthen technical expertise in the design, implementation, and analysis of such systems.
To facilitate the timely dissemination and use of results from the Palestinian MICS prior to the release of full tables and the final survey report that will contain detailed information on all survey findings by various demographic, social, economic and cul-tural characteristics.
Results presented in this report are not expected to change and are considered final. For more information on indicators and the analysis conducted in the full final report please go to mics.unicef.org and childinfo.org.
Citation:Palestinian Central Bureau of Statistics, 2014. Palestinian Multiple Indicator Cluster Survey 2014, Key Findings Report, Ramallah, Palestine.

5
Palestinian MICS at a glance
Survey implementationSample frame
- Updated
Population Housing and Establishment Census 2007
Household Listing 2013
Questionnaires Household
Women (age 15-49)
Children under five
Interviewer training February 2014 Fieldwork March- April 2014
Survey sample
Households
- Sampled
- Occupied
- Interviewed
- Response rate (Per cent)
11, 125
10, 568
10, 182
96.3
Children under five
- Eligible
- Mothers/caretakers interviewed
- Response rate (Per cent)
7, 919
7, 816
98.7
Women
- Eligible for interviews
- Interviewed
- Response rate (Per cent)
13, 964
13, 367
95.7
Survey populationAverage household size 5.5 Percentage of population living in
- West Bank
- Gaza Strip
- Urban
- Rural
- Camps
59.1
40.9
74.5
16.7
8.8
Percentage of population under:
- Age 5
- Age 18
14.3
46.3
Percentage of women age 15-49 years with at least one live birth in the last 2 years
22.0

6
Household or personal assets Housing characteristics
Palestine West Bank
Gaza Strip Palestine We s t
BankGaza Strip
Percentage of households that own Percentage of households with
RadioA television
38.680.1
44.675.2
28.688.2 Electricity 99.9 99.9 99.9
LCD /LED /3D TV 26.9 34.8 13.5 Finished floor 99.9 99.9 99.8
Non-mobile phone 36.2 40.1 29.7 Finished roofing
99.8 99.9 99.8
A refrigerator 95.5 97.0 93.0 Finished walls 99.0 98.5 99.8
Central heating 2.6 3.8 0.5
Clothes Dryer 5.4 7.2 2.4 Mean number of persons per room used for sleeping
2.5 2.4 2.7Freezer 6.9 9.5 2.6
Dishwasher 2.3 3.6 0.2
Air Conditioner 16.9 22.5 7.5
Play Station / X-Box 4.2 5.9 1.5
Satellite Dish 94.7 95.3 93.6
Solar Heater 59.0 65.4 48.2
Vacuum Cleaner 37.0 49.9 15.4
Washing Machine 95.1 96.2 93.2
Agricultural land 17.6 22.1 10.0
Farm animals/livestock 10.6 10.6 10.8
Percentage of households where at least a member has or owns a
I pad / Tablet 14.3 20.5 3.9
A Smart Mobile telephone
48.2 58.6 30.8
A Laptop 37.4 43.4 27.3
Animal - Drawn cart
1.5 0.4 3.2
A car or Truck 26.8 36.8 10.1
Bank account 44.2 52.1 30.9

7
Child mortality
Early childhood mortality
MICS Indicator Indicator DescriptionValue A
PalestineWest Bank
Gaza Strip
1.1 Neonatal mortality rate
Probability of dying within the first month of life
11 11 12
1.2 MDG 4.2 Infant mortality rate Probability of dying between birth and the first birthday
18 17 20
1.3 Post-neonatal mortality rate
Difference between infant and neonatal mortality rates
7 6 8
1.4 Child mortality rate Probability of dying between the first and the fifth birthdays
4 3 4
1.5 MDG 4.1 Under-five mortality rate
Probability of dying between birth and the fifth birthday
22 20 24
A Indicator values are per 1,000 live births and refer to the five-year period before the survey
Figure 1: Trends in Early Childhood Mortality Rates, Palestine 2014.
Years preceding the survey
Neonatal mortality rate
Note: Indicato values per 1,000 live births
Post-neonatal mortality rate
Infant mortality rate
Child mortality rate
Under-five mortality rate

8
Nutrition
Nutritional Status 1MICS Indicator Indicator Description Palestine West
BankGaza Strip
2.1a
2.1b
MDG 1.8
Underweight Prevalence(a) Moderate and severe (b) Severe
Percentage of children under age 5 who fall below(a) minus two standard deviations (moderate and severe) (b) minus three standard deviations (severe)of the median weight for age of the WHO standard
1.4
0.2
1.5
0.3
1.3
0.2
2.2a
2.2b
Stunting prevalence(a) Moderate and severe(b) Severe
Percentage of children under age 5 who fall below(a) minus two standard deviations (moderate and severe)(b) minus three standard deviations (severe) of the median height for age of the WHO standard
7.4
1.8
7.7
2.4
7.1
1.1
2.3a
2.3b
Wasting prevalence(a) Moderate and severe(b) Severe
Percentage of children under age 5 who fall below(a) minus two standard deviations (moderate and severe)(b) minus three standard deviations (severe)of the median weight for height of the WHO standard
1.2
0.3
1.7
0.6
0.7
0.1
2.3c Overweight prevalence
Percentage of children under age 5 who are above two standard deviations of the median weight for height of the WHO standard
8.2 9.8 6.5

9
060
2
4
6
8
10
12
14
16
483624120
Overweight
Stunted
Wasted
Underweight
Age in months
Perc
ent
Figure 2: Underweight, stunted, wasted and overweight children under age 5 (moderate and severe), Palestine 2014.
10
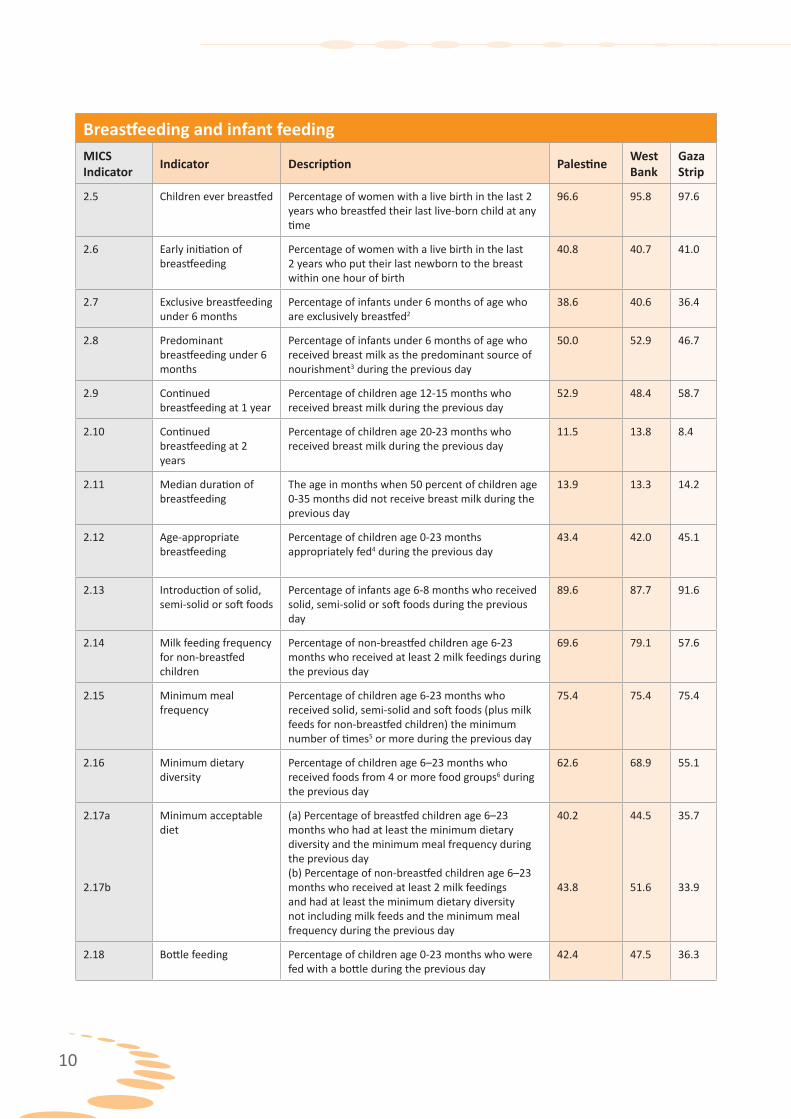
Breastfeeding and infant feedingMICS Indicator Indicator Description Palestine West
BankGaza Strip
2.5 Children ever breastfed Percentage of women with a live birth in the last 2 years who breastfed their last live-born child at any time
96.6 95.8 97.6
2.6 Early initiation of breastfeeding
Percentage of women with a live birth in the last 2 years who put their last newborn to the breast within one hour of birth
40.8 40.7 41.0
2.7 Exclusive breastfeeding under 6 months
Percentage of infants under 6 months of age who are exclusively breastfed2
38.6 40.6 36.4
2.8 Predominant breastfeeding under 6 months
Percentage of infants under 6 months of age who received breast milk as the predominant source of nourishment3 during the previous day
50.0 52.9 46.7
2.9 Continued breastfeeding at 1 year
Percentage of children age 12-15 months who received breast milk during the previous day
52.9 48.4 58.7
2.10 Continued breastfeeding at 2 years
Percentage of children age 20-23 months who received breast milk during the previous day
11.5 13.8 8.4
2.11 Median duration of breastfeeding
The age in months when 50 percent of children age 0-35 months did not receive breast milk during the previous day
13.9 13.3 14.2
2.12 Age-appropriate breastfeeding
Percentage of children age 0-23 months appropriately fed4 during the previous day
43.4 42.0 45.1
2.13 Introduction of solid, semi-solid or soft foods
Percentage of infants age 6-8 months who received solid, semi-solid or soft foods during the previous day
89.6 87.7 91.6
2.14 Milk feeding frequency for non-breastfed children
Percentage of non-breastfed children age 6-23 months who received at least 2 milk feedings during the previous day
69.6 79.1 57.6
2.15 Minimum meal frequency
Percentage of children age 6-23 months who received solid, semi-solid and soft foods (plus milk feeds for non-breastfed children) the minimum number of times5 or more during the previous day
75.4 75.4 75.4
2.16 Minimum dietary diversity
Percentage of children age 6–23 months who received foods from 4 or more food groups6 during the previous day
62.6 68.9 55.1
2.17a
2.17b
Minimum acceptable diet
(a) Percentage of breastfed children age 6–23 months who had at least the minimum dietary diversity and the minimum meal frequency during the previous day(b) Percentage of non-breastfed children age 6–23 months who received at least 2 milk feedings and had at least the minimum dietary diversity not including milk feeds and the minimum meal frequency during the previous day
40.2
43.8
44.5
51.6
35.7
33.9
2.18 Bottle feeding Percentage of children age 0-23 months who were fed with a bottle during the previous day
42.4 47.5 36.3
11
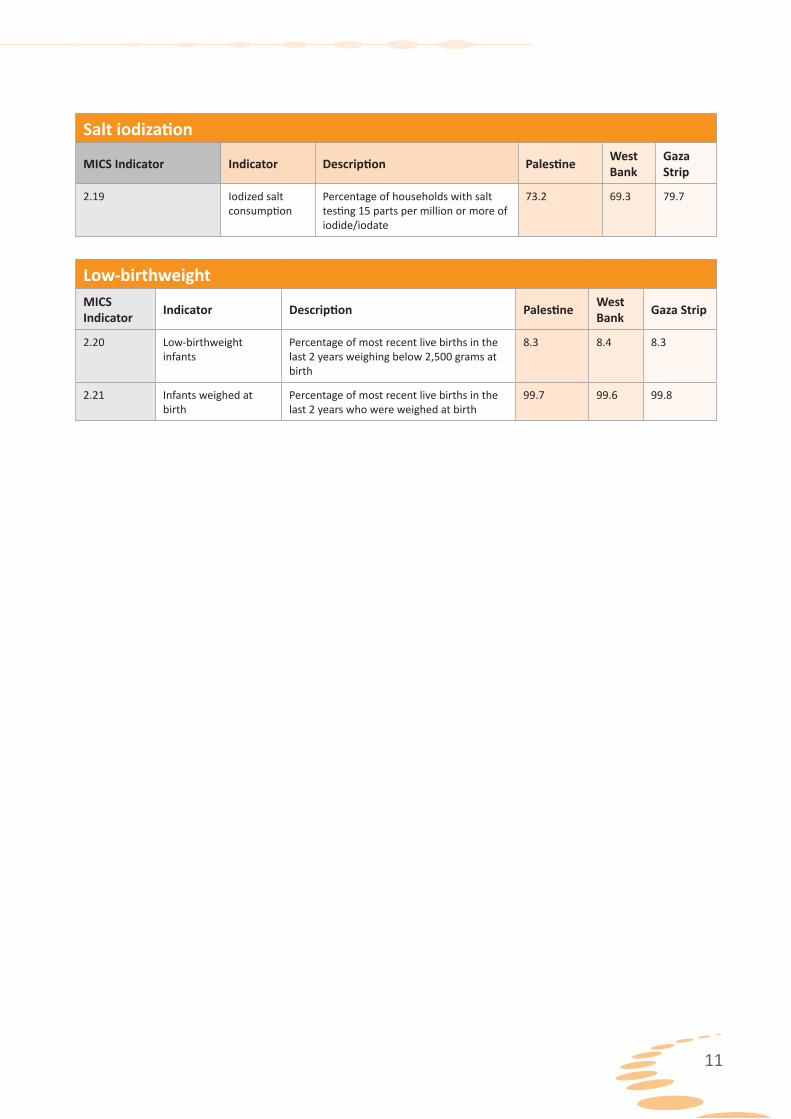
Salt iodization
MICS Indicator Indicator Description Palestine West Bank
Gaza Strip
2.19 Iodized salt consumption
Percentage of households with salt testing 15 parts per million or more of iodide/iodate
73.2 69.3 79.7
Low-birthweightMICS Indicator Indicator Description Palestine West
Bank Gaza Strip
2.20 Low-birthweight infants
Percentage of most recent live births in the last 2 years weighing below 2,500 grams at birth
8.3 8.4 8.3
2.21 Infants weighed at birth
Percentage of most recent live births in the last 2 years who were weighed at birth
99.7 99.6 99.8
12
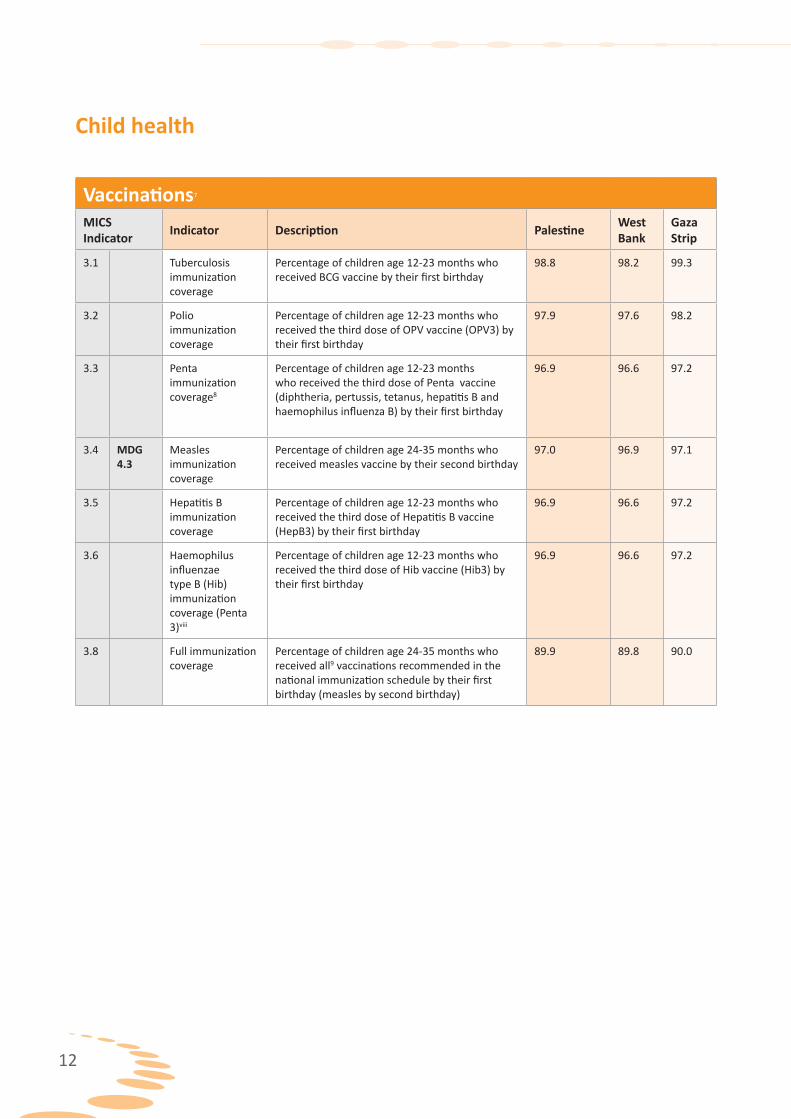
Child health
Vaccinations7
MICS Indicator Indicator Description Palestine West
BankGaza Strip
3.1 Tuberculosis immunization coverage
Percentage of children age 12-23 months who received BCG vaccine by their first birthday
98.8 98.2 99.3
3.2 Polio immunization coverage
Percentage of children age 12-23 months who received the third dose of OPV vaccine (OPV3) by their first birthday
97.9 97.6 98.2
3.3 Penta immunization coverage8
Percentage of children age 12-23 months who received the third dose of Penta vaccine (diphtheria, pertussis, tetanus, hepatitis B and haemophilus influenza B) by their first birthday
96.9 96.6 97.2
3.4 MDG 4.3
Measles immunization coverage
Percentage of children age 24-35 months who received measles vaccine by their second birthday
97.0 96.9 97.1
3.5 Hepatitis B immunization coverage
Percentage of children age 12-23 months who received the third dose of Hepatitis B vaccine (HepB3) by their first birthday
96.9 96.6 97.2
3.6 Haemophilus influenzae type B (Hib) immunization coverage (Penta 3)viii
Percentage of children age 12-23 months who received the third dose of Hib vaccine (Hib3) by their first birthday
96.9 96.6 97.2
3.8 Full immunization coverage
Percentage of children age 24-35 months who received all9 vaccinations recommended in the national immunization schedule by their first birthday (measles by second birthday)
89.9 89.8 90.0

13
Figure 3: Vaccinations by age 12 months (Measles by 24 months) Palestine 2014.
99
9998
98
9897
99
99
99
0
99
Children Age 12 - 23 months
BCG
Polio1
Polio 2
Polio 3
Penta 1
Penta 2
Penta 3
Measles
Hep.B0 at birth
IPV 1
IPV 2
Fully vaccinated
No vaccinations
BCG
Polio1
Polio 2
Polio 3
Penta 1
Penta 2
Penta 3
Hep.B0 at birth
IPV 1
IPV 2
No vaccinations
99
9997
99
9897
97
99
99
99
90
0
99
Children Age 24 - 35 months
Percent
14
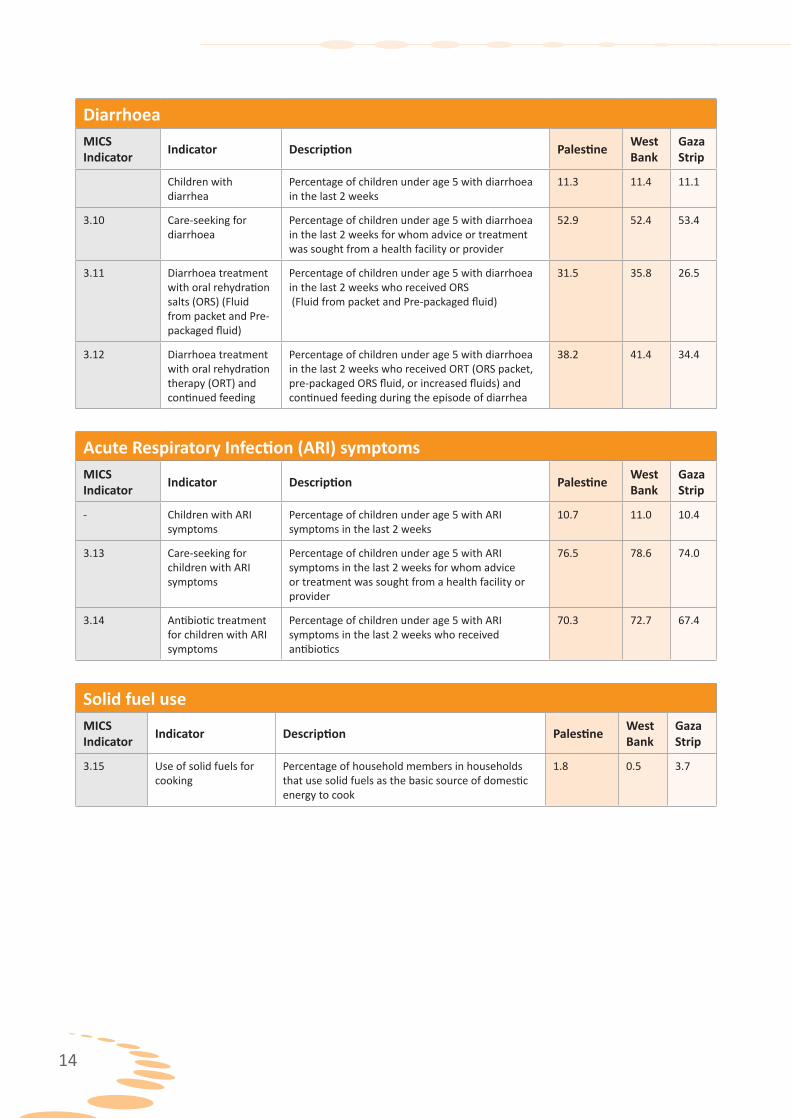
DiarrhoeaMICS Indicator Indicator Description Palestine West
BankGaza Strip
Children with diarrhea
Percentage of children under age 5 with diarrhoea in the last 2 weeks
11.3 11.4 11.1
3.10 Care-seeking for diarrhoea
Percentage of children under age 5 with diarrhoea in the last 2 weeks for whom advice or treatment was sought from a health facility or provider
52.9 52.4 53.4
3.11 Diarrhoea treatment with oral rehydration salts (ORS) (Fluid from packet and Pre-packaged fluid)
Percentage of children under age 5 with diarrhoea in the last 2 weeks who received ORS (Fluid from packet and Pre-packaged fluid)
31.5 35.8 26.5
3.12 Diarrhoea treatment with oral rehydration therapy (ORT) and continued feeding
Percentage of children under age 5 with diarrhoea in the last 2 weeks who received ORT (ORS packet, pre-packaged ORS fluid, or increased fluids) and continued feeding during the episode of diarrhea
38.2 41.4 34.4
Acute Respiratory Infection (ARI) symptomsMICS Indicator Indicator Description Palestine West
BankGaza Strip
- Children with ARI symptoms
Percentage of children under age 5 with ARI symptoms in the last 2 weeks
10.7 11.0 10.4
3.13 Care-seeking for children with ARI symptoms
Percentage of children under age 5 with ARI symptoms in the last 2 weeks for whom advice or treatment was sought from a health facility or provider
76.5 78.6 74.0
3.14 Antibiotic treatment for children with ARI symptoms
Percentage of children under age 5 with ARI symptoms in the last 2 weeks who received antibiotics
70.3 72.7 67.4
Solid fuel useMICS Indicator Indicator Description Palestine West
BankGaza Strip
3.15 Use of solid fuels for cooking
Percentage of household members in households that use solid fuels as the basic source of domestic energy to cook
1.8 0.5 3.7
15
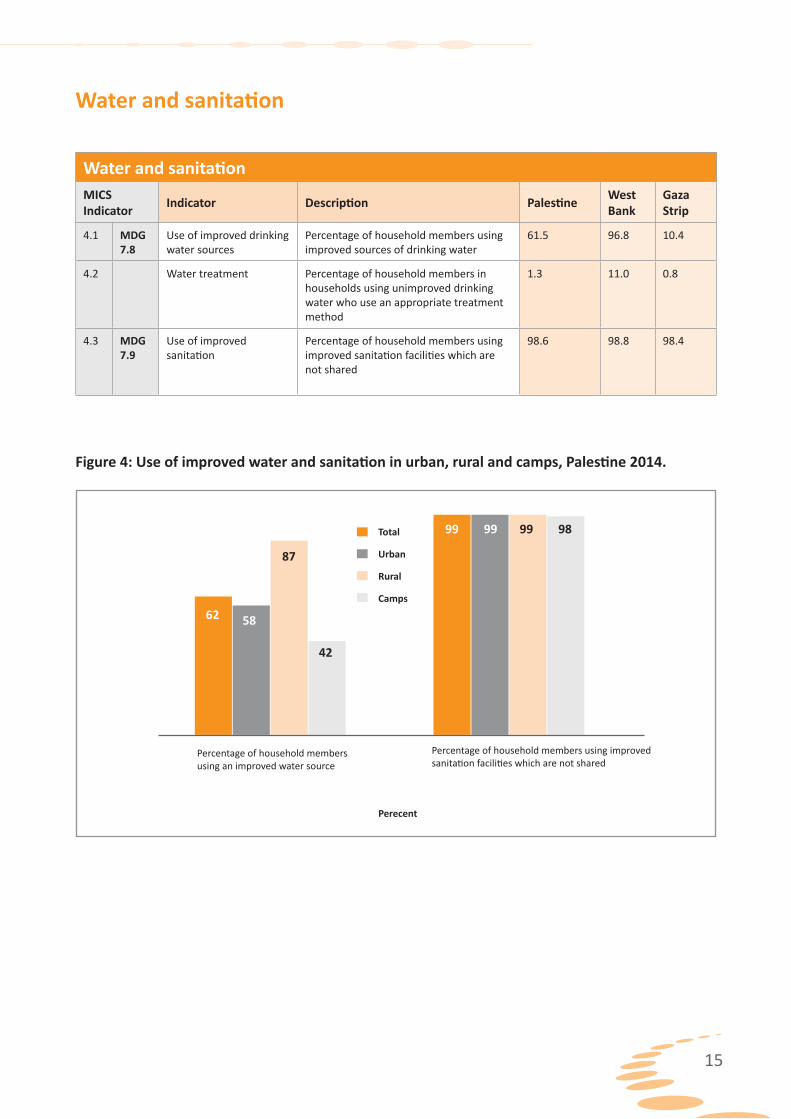
Water and sanitation
Water and sanitationMICS Indicator Indicator Description Palestine West
BankGaza Strip
4.1 MDG 7.8
Use of improved drinking water sources
Percentage of household members using improved sources of drinking water
61.5 96.8 10.4
4.2 Water treatment Percentage of household members in households using unimproved drinking water who use an appropriate treatment method
1.3 11.0 0.8
4.3 MDG 7.9
Use of improved sanitation
Percentage of household members using improved sanitation facilities which are not shared
98.6 98.8 98.4
Figure 4: Use of improved water and sanitation in urban, rural and camps, Palestine 2014.
Total
Urban
Rural
Camps
Perecent
Percentage of household members using improved sanitation facilities which are not shared
Percentage of household members using an improved water source
62 58
87
42
99 99 99 98

16
Reproductive health
Contraception and unmet needMICS Indicator Indicator Description Palestine West
BankGaza Strip
- Total fertility rate Total fertility rateA for women age 15-49 years 4.1 3.7 4.5
5.1 MDG 5.4
Adolescent birth rate Age-specific fertility rateA for women age 15-19 years
48 35 66
5.2 Early childbearing Percentage of women age 20-24 years who had at least one live birth before age 18
22.0 19.6 25.1
5.3 MDG 5.3
Contraceptive prevalence rate
Percentage of women age 15-49 years currently married who are using (or whose partner is using) a (modern or traditional) contraceptive method
57.2 59.8 53.4
5.4 MDG 5.6
Unmet need Percentage of women age 15-49 years who are currently married who are fecund and want to space their births or limit the number of children they have and who are not currently using contraception
10.9 11.0 10.7
A The age-specific fertility rate is defined as the number of live births to women in a specific age group during a specified period, divided by the average number of women in that age group during the same period, expressed per 1,000 women. The age-specific fertility rate for women age 15-19 years is also termed as the adolescent birth rate.
The total fertility rate (TFR) is calculated by summing the age-specific fertility rates calculated for each of the 5-year age groups of women, from age 15 through to age 49. The TFR denotes the average number of children to which a woman will have given birth by the end of her reproductive years (by age 50) if current fertility rates prevailed.
Figure 5: Use of contraception, Palestine 2014.
Modern methods 44.1 Traditional methods 13.1
Female sterilization 1.8 Periodic abstinence 3.6
Male sterilization 0.0 Withdrawal 9.3
IUD 26.2 Other 0.1
Injectable 0.9
Implants 0.0 Any method 57.2
Pill 8.0
Male condom 5.6 No method 42.8
Female condom 0.0
Diaphragm/Foam/Jelly 0.1
LAM 1.6
0 10 20 30 40 50 60 70 80 90 100
Modern methods44
Traditional methods
13No method
43
17
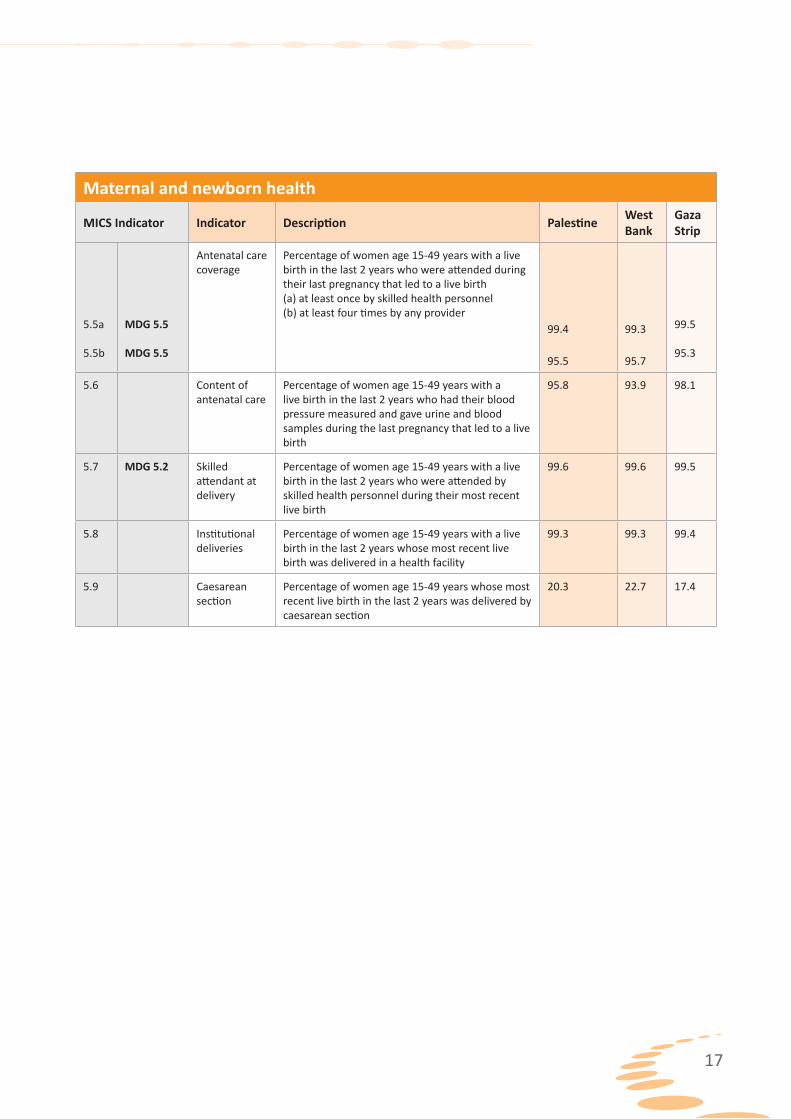
Maternal and newborn health
MICS Indicator Indicator Description Palestine West Bank
Gaza Strip
5.5a
5.5b
MDG 5.5
MDG 5.5
Antenatal care coverage
Percentage of women age 15-49 years with a live birth in the last 2 years who were attended during their last pregnancy that led to a live birth(a) at least once by skilled health personnel(b) at least four times by any provider
99.4
95.5
99.3
95.7
99.5
95.3
5.6 Content of antenatal care
Percentage of women age 15-49 years with a live birth in the last 2 years who had their blood pressure measured and gave urine and blood samples during the last pregnancy that led to a live birth
95.8 93.9 98.1
5.7 MDG 5.2 Skilled attendant at delivery
Percentage of women age 15-49 years with a live birth in the last 2 years who were attended by skilled health personnel during their most recent live birth
99.6 99.6 99.5
5.8 Institutional deliveries
Percentage of women age 15-49 years with a live birth in the last 2 years whose most recent live birth was delivered in a health facility
99.3 99.3 99.4
5.9 Caesarean section
Percentage of women age 15-49 years whose most recent live birth in the last 2 years was delivered by caesarean section
20.3 22.7 17.4
18
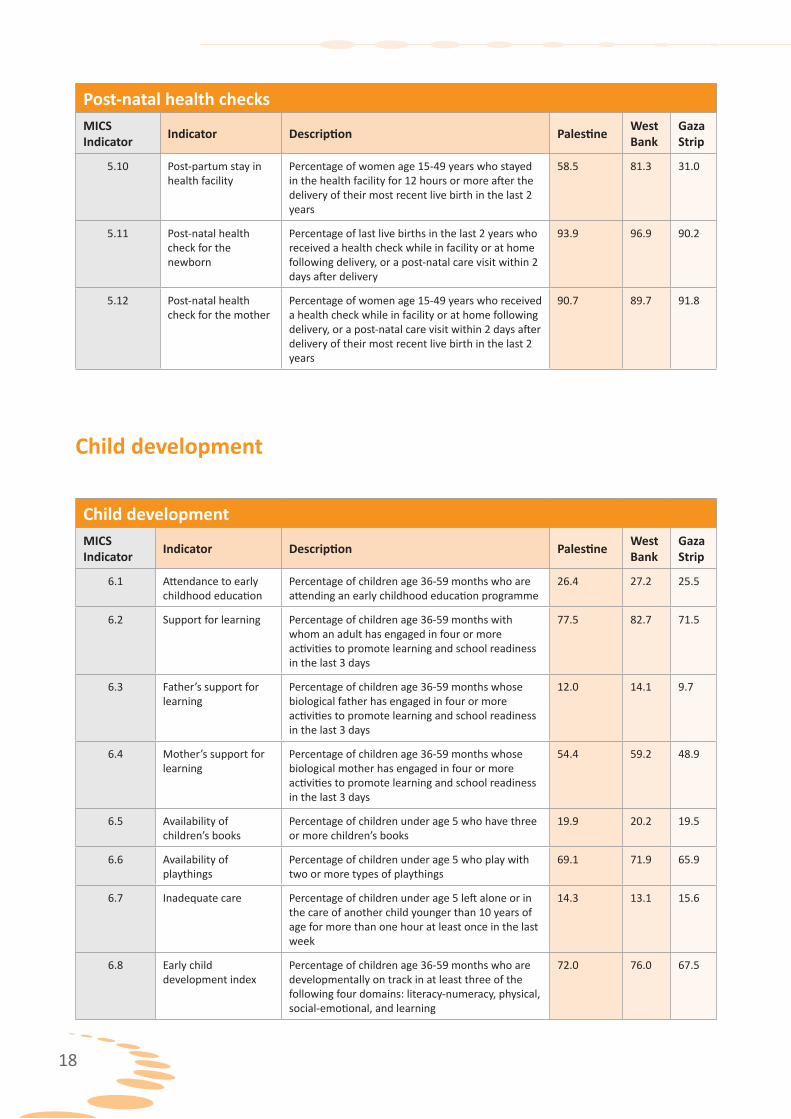
Post-natal health checksMICS Indicator Indicator Description Palestine West
BankGaza Strip
5.10 Post-partum stay in health facility
Percentage of women age 15-49 years who stayed in the health facility for 12 hours or more after the delivery of their most recent live birth in the last 2 years
58.5 81.3 31.0
5.11 Post-natal health check for the newborn
Percentage of last live births in the last 2 years who received a health check while in facility or at home following delivery, or a post-natal care visit within 2 days after delivery
93.9 96.9 90.2
5.12 Post-natal health check for the mother
Percentage of women age 15-49 years who received a health check while in facility or at home following delivery, or a post-natal care visit within 2 days after delivery of their most recent live birth in the last 2 years
90.7 89.7 91.8
Child development
Child developmentMICS Indicator Indicator Description Palestine West
BankGaza Strip
6.1 Attendance to early childhood education
Percentage of children age 36-59 months who are attending an early childhood education programme
26.4 27.2 25.5
6.2 Support for learning Percentage of children age 36-59 months with whom an adult has engaged in four or more activities to promote learning and school readiness in the last 3 days
77.5 82.7 71.5
6.3 Father’s support for learning
Percentage of children age 36-59 months whose biological father has engaged in four or more activities to promote learning and school readiness in the last 3 days
12.0 14.1 9.7
6.4 Mother’s support for learning
Percentage of children age 36-59 months whose biological mother has engaged in four or more activities to promote learning and school readiness in the last 3 days
54.4 59.2 48.9
6.5 Availability of children’s books
Percentage of children under age 5 who have three or more children’s books
19.9 20.2 19.5
6.6 Availability of playthings
Percentage of children under age 5 who play with two or more types of playthings
69.1 71.9 65.9
6.7 Inadequate care Percentage of children under age 5 left alone or in the care of another child younger than 10 years of age for more than one hour at least once in the last week
14.3 13.1 15.6
6.8 Early child development index
Percentage of children age 36-59 months who are developmentally on track in at least three of the following four domains: literacy-numeracy, physical, social-emotional, and learning
72.0 76.0 67.5

19
Literacy and education
Literacy and education10
Survey Indicator Indicator Description Palestine West
BankGaza Strip
MICS7.1
MDG 2.3
Literacy rate among young woman
Percentage of young woman age 15-24 years who are able to read a short simple statement about everyday life or who attended secondary or higher education
97.2 97.6 96.5
7.2 School readiness Percentage of children in first grade of basic school who attended pre-school during the previous school year
94.1 91.9 97.2
7.3 Net intake rate in basic education
Percentage of children of school-entry age who enter the first grade of basic school
96.9 97.3 96.5
7.4 Basic school net attendance ratio (adjusted)
Percentage of children of basic school age currently attending basic or secondary school
96.8 96.7 97.0
7.5 Secondary school net attendance ratio (adjusted)
Percentage of children of secondary school age currently attending secondary school or higher
71.7 70.7 73.2
7.6 Children reaching last grade of basic
Percentage of children entering the first grade of basic school who eventually reach last grade
92.1 92.1 92.0
7.7 Basic completion rate Number of children attending the last grade of basic school (excluding repeaters) divided by number of children of basic school completion age (age appropriate to final grade of basic school)
88.7 90.7 85.4
7.8 Transition rate to secondary school
Number of children attending the last grade of basic school during the previous school year who are in the first grade of secondary school during the current school year divided by number of children attending the last grade of basic school during the previous school year
93.5 92.7 94.7
7.9 Gender parity index (basic school)
Basic school net attendance ratio (adjusted) for girls divided by basic school net attendance ratio (adjusted) for boys
1.03 1.04 1.02
7.10 Gender parity index (secondary school)
Secondary school net attendance ratio (adjusted) for girls divided by secondary school net attendance ratio (adjusted) for boys
1.27 1.32 1.20
20
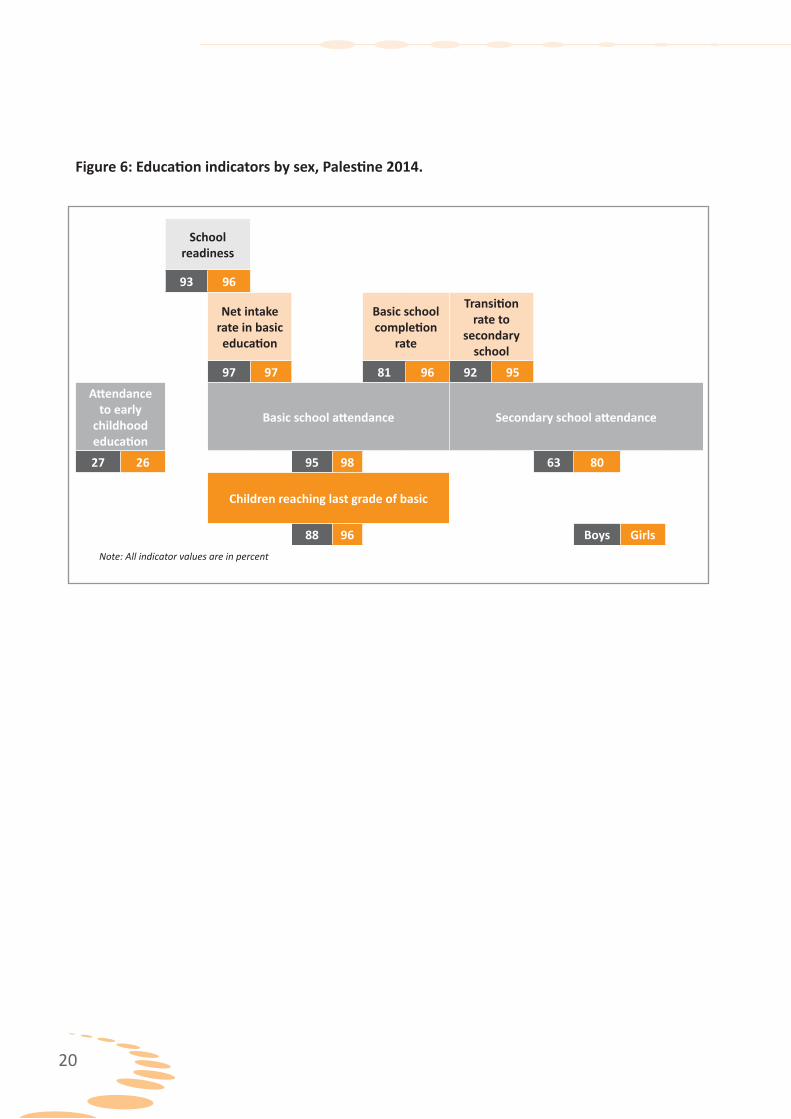
Figure 6: Education indicators by sex, Palestine 2014.
School
readiness
93 96
Net intake
rate in basic education
Basic school completion
rate
Transition rate to
secondary school
97 97 81 96 92 95 Attendance
to early childhood education
Basic school attendance Secondary school attendance
27 26 95 98 63 80
Children reaching last grade of basic
88 96 Boys Girls Note: All indicator values are in percent
21
Child protection
Birth registrationMICS Indicator Indicator Description Palestine West
BankGaza Strip
8.1 Birth registration Percentage of children under age 5 whose births are reported registered
99.3 99.1 99.6
Child disciplineMICS Indicator Indicator Description Palestine West
BankGaza Strip
8.3 Violent discipline Percentage of children age 1-14 years who experienced psychological aggression or physical punishment during the last one month
91.5 89.3 94.5
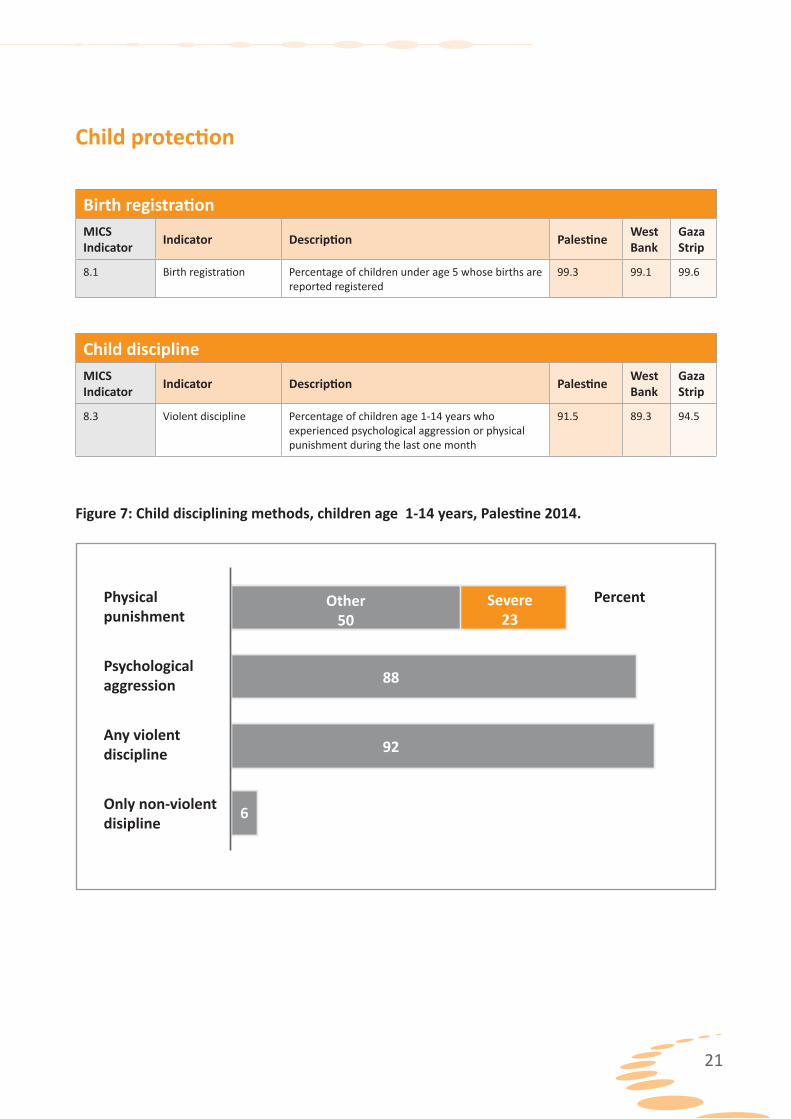
Figure 7: Child disciplining methods, children age 1-14 years, Palestine 2014.
Other50
Severe 23
88
92
6
Physical punishment
Psychological aggression
Any violent discipline
Only non-violent disipline
Percent

22
Early marriage and polygynyMICS Indicator Indicator Description Palestine West
BankGaza Strip
8.4 Marriage before age 15
Percentage of women age 15-49 years who were first married before age 15
2.1 1.8 2.6
8.5 Marriage before age 18
Percentage of women age 20-49 years who were first married before age 18
24.2 21.4 28.6
8.6 Young women age 15-19 years currently married
Percentage of young women age 15-19 years who are married
9.3 6.8 12.8
8.7 Polygyny Percentage of women age 15-49 years who are in a polygynous marriage
4.3 3.2 5.8
Children’s living arrangementsMICS
Indicator Indicator Description Palestine West Bank
Gaza Strip
8.13 Children’s living arrangements
Percentage of children age 0-17 years living with neither biological parent
0.6 0.3 0.9
8.14 Prevalence of children with one or both parents dead
Percentage of children age 0-17 years with one or both biological parents dead
2.3 2.0 2.6
8.15 Children with at least one parent living abroad
Percentage of children 0-17 years with at least one biological parent living abroad
0.3 0.3 0.3

23
HIV/AIDS
HIV/AIDS knowledge and attitudes MICS
IndicatorIndicator Description Palestine West
Bank GazaStrip
Have heard of AIDS Percentage of woman age 15-49 years who haveheard of AIDS
95.0 96.4 92.9
Knowledge about HIV prevention among woman (15-49)
Percentage of woman age 15-49 years who correctly identify ways of preventing the sexual transmission of HIV1, and who reject major misconceptions aboutHIV transmission
7.7 9.9 4.5
9.1 MDG6.3
Knowledge about HIV prevention amongyoung woman
Percentage of woman age 15-24 years who correctly identify ways of preventing the sexual transmission of HIV2, and who reject major misconceptions aboutHIV transmission
6.2 8.2 3.6
9.2 Knowledge of mother- to-child transmissionof HIV
Percentage of woman age 15-49 years who correctly identify all three means3 of mother-to-childtransmission of HIV
43.5 42.6 44.9
9.3 Accepting attitudes towards people livingwith HIV
Percentage of woman age 15-49 years expressing accepting attitudes on all four questions4 towardpeople living with HIV
5.0 5.1 4.8
HIV testing MICS
IndicatorIndicator Description Palestine West
Bank GazaStrip
9.4 People who know where to be tested for HIV
Percentage of woman age 15-49 years who stateknowledge of a place to be tested for HIV
19.7 19.1 20.6
1 Using condoms and limiting sex to one faithful, uninfected partner2 Using condoms and limiting sex to one faithful, uninfected partner3 Transmission during pregnancy, during delivery, and by breastfeeding4 People (1) who think that a female teacher with the AIDS virus should be allowed to teach in school, (2) who would buy fresh vegetables from a shopkeeper or vendor who has the AIDS virus, (3) who would not want to keep it as a secret if a family member became infected with the AIDS virus, and (4) who would be willing to care for a family member who became sick with the AIDS virus
Palestinian MICS, 2014
24
Notes
1 Weight and height/length measurements were successfully completed for 92.2 and 88.8 percent of children under age 5, respectively
2 Infants receiving breast milk, and not receiving any other fluids or foods, with the exception of oral rehydration solution, vitamins, mineral supplements and medicines
3 Infants receiving breast milk and certain fluids (water and water-based drinks, fruit juice, ritual fluids, oral rehydration solution, drops, vitamins, minerals, and medicines), but do not receive anything else (in particular, non-human milk and food-based fluids)
4 Infants age 0-5 months who are exclusively breastfed, and children age 6-23 months who are breastfed and ate solid, semi-solid or soft foods
5 Breastfeeding children: Solid, semi-solid, or soft foods, two times for infants age 6-8 months, and three times for children 9-23 months; Non-breastfeeding children: Solid, semi-solid, or soft foods, or milk feeds, four times for children age 6-23 months
6 The indicator is based on consumption of any amount of food from at least 4 out of the 7 following food groups: 1) grains, roots and tubers, 2) legumes and nuts, 3) dairy products (milk, yogurt, cheese), 4) flesh foods (meat, fish, poultry and liver/organ meats), 5) eggs, 6) vitamin-A rich fruits and vegetables, and 7) other fruits and vegetables
7 The data excludes those parts of Jerusalem which were annexed by Israel in 1967, due to the fact that the Palestinian vaccination schedule is differ from the Israeli vaccination schedule, where the Palestinian children living in East Jerusalem get their vaccines from the Israeli Health centers.
8 According to the Palestinian national immunization schedule, DPT, Hepatitis, Haemophilus influenza vaccines are part of the Penta vaccine, which is administrated in three doses, at age two months, four months and six months, as follows: Penta1 includes: DPT1, Hep1, and Haemophilus influenza1, Penta2 includes: DPT2, Hep2, and Haemophilus influenza2, Penta3 includes: DPT3, Hep3, and Haemophilus influenza3.
9 Full vaccination includes the following: BCG, Hep.B0, IPV1, IPV2, penta1, penta2, penta3, Polio1, Polio2, Polio3, by 12 months of age, and one dose of measles vaccine (administrated as MMR1), by age of 24 months.
10 Education indicators, wherever applicable, are based on information on reported school attendance (at any time during the school year), as a proxy for enrolment. For the purpose of monitoring the progress at the national level, data shown in the table is based on the Palestinian education system classification, where basic stage consists of grades 1-10, and secondary stage consists of grades 11-12. A separate table showing the ISCED classification will be presented in the final report for international comparison.
11 Using condoms and limiting sex to one faithful, uninfected partner
12 Transmission during pregnancy, during delivery, and by breastfeeding
13 People (1) who think that a female teacher with the AIDS virus should be allowed to teach in school, (2) who would buy fresh vegetables from a shopkeeper or vendor who has the AIDS virus, (3) who would not want to keep it as a secret if a family member became infected with the AIDS virus, and (4) who would be willing to care for a family member who became sick with the AIDS virus


Palestinian MICS, 2014
26