Multiple benefits of investing in energy efficient ......CE), Oliver Loebel (PU Europe), Helle...
47
Multiple benefits of investing in energy efficient renovation of buildings Impact on Public Finances Commissioned by Renovate Europe 5 October 2012
Transcript of Multiple benefits of investing in energy efficient ......CE), Oliver Loebel (PU Europe), Helle...
Multiple benefits of
investing in energy
efficient renovation of
buildings
Impact on Public Finances
Commissioned by Renovate Europe
5 October 2012

Multiple benefits of investing in energy
efficient renovation of buildings
The following persons gave valuable input and comments to interim versions of this report. Their ex-
pertise and generosity in participating in this work is greatly appreciated by the Renovate Europe
Campaign.
Tatiana Bosteels, Hermes Real Estate Investment Management Ltd
Patty Fong, European Climate Foundation
Jens Laustsen, Global Buildings Performance Network
J Owen Lewis, Professor Emeritus of Architectural Science, UCD Dublin
Lisa Ryan, International Energy Agency
Yamina Saheb, International Energy Agency
Peter Sweatman, Climate Strategy and Partners
Contributions were also received from the members of the Renovate Europe Steering Group with valua-
ble comments from Jonna Byskata (UTC), Céline Carré (Saint Gobain Isover), Bertrand Cazes (Glass for
Europe), Susanne Dyrbøl (Rockwool International), Andoni Hidalgo (Eurima), Adrian Joyce (EuroA-
CE), Oliver Loebel (PU Europe), Helle Carlsen Nielsen (Velux) and Jean-Luc Savin (Aereco).
Authors, Copenhagen Economics:
Partner and Director, Helge Sigurd Næss-Schmidt
Economist, Martin Bo Hansen
Researcher, Carl von Utfall Danielsson

Multiple benefits of investing in energy
efficient renovation of buildings
Table of contents
Main findings 4
1 Benefits from investing in energy efficient renovation of buildings 10
1.1 Characterising the benefits 10
1.2 Scenarios 12
1.3 Identifying the energy saving potential 13
1.4 Quantifiable benefits from investing in energy efficient
renovation of buildings and the impact on public finances 15
1.5 Aggregating the benefits 22
2 Barriers and policy responses 26
2.1 Why are buildings interesting? 26
2.2 Barriers from regulatory failure 28
2.3 Barriers from market failure 34
2.4 Policy response 39
References 42

Multiple benefits of investing in energy
efficient renovation of buildings
List of figures
Figure 1 Annual gross benefits to society from energy efficient
renovation of buildings, 2020 ............................................................... 5
Figure 2 Annual improvements of public finances, 2020 .................... 6
Figure 3 Impact on GDP from increasing economic activity,
2012-2017 ............................................................................................... 7
Figure 4 Impact on public revenue, increased economic
activity .................................................................................................... 8
Figure 5 Effects of energy efficient renovation of buildings .............. 11
Figure 6 Accumulated energy saving potential over time .................. 14
Figure 7 Share of energy saving potential by country, 2030 ............. 15
Figure 8 Energy savings from renovation of buildings ...................... 16
Figure 9 Reduced tax revenue from energy taxes ............................... 17
Figure 10 Reduced outlay on subsidies ............................................... 18
Figure 11 Value of reduced air pollution ............................................. 19
Figure 12 Benefits from stimulating economic activity ...................... 21
Figure 13 Energy saving potential with rebound ............................... 22
Figure 14 Annual benefits to society, 2020 ........................................ 23
Figure 15 Annual improvement of public finances, 2020 ................. 24
Figure 16 Benefits from stimulating economic activity ...................... 25
Figure 17 Final energy consumption by sector .................................. 26
Figure 18 Real interests rates of government bonds ......................... 28
Figure 19 Rent control regulation ....................................................... 29
Figure 20 Share of owner-occupied and rental ................................. 30
Figure 21 Reduced VAT on energy consumption .............................. 32
Figure 22 Share of public ownership of non-residential
buildings ...............................................................................................33
Figure 23 Share of multi-family homes.............................................. 39
Multiple benefits of investing in energy
efficient renovation of buildings
List of boxes
Box 1 The UK Energy Act 2011 – Green deal ..................................... 30
Box 2 Leveraging public money ........................................................... 35
Box 3 ESCO partnerships in Europe ................................................... 37
Box 4 Specific promotion activities for investments in energy
efficiency renovations ......................................................................... 40

Multiple benefits of investing in energy
efficient renovation of buildings
4
Main findings
Energy savings through the renovation of the existing building stock is one of the most
attractive and low cost options to reduce the emissions of CO2 and potentially improve
energy security by reducing imports of fossil fuels. Indeed, there is wide evidence that
undertaking energy efficient renovations at current energy prices often pay for themselves
i.e. have negative investment costs.1 Now is a particularly good time for pursuing such
renovations. In addition to the permanent benefits these renovations may bring, it will
also produce a much needed stimulus to the European economy at a time of economic
underperformance, spare capacity and record low real interest rates in a number of coun-
tries.
In addition to the energy savings that renovation of the existing buildings stock will bring,
there are a range of co-benefits, which can also be harvested. By reducing energy con-
sumption and focusing on indoor climate issues when renovating, co-benefits can be
achieved such as reduced outlay on government subsidies, and improved health due to
less air pollution and a better indoor climate, both of which also lead to fewer hospitalisa-
tions and improved worker productivity.
Harvesting renovation opportunities could bring huge benefits to the EU economy over
the coming decades. Based on available estimates of the potential for energy savings from
renovation of buildings, this study suggest a monetised permanent annual benefit to soci-
ety of €104-175 billion in 2020 depending on the level of investments made from 2012 to
2020, cf. Figure 1:2 €52-75 billion from lower energy bills, and at least €9-12 billion from
the co-benefits of reduced outlay on subsidies and reduced air pollution from energy pro-
duction. If the health benefits from improved indoor climate are included, the benefits are
increased by an additional €42-88 billion per year. These health benefits are evident, but
very uncertain to estimate, and should be interpreted accordingly. If investments are con-
tinued after 2020, these annual benefits can be doubled by 2030.
1 Net financial savings after deducting investment and running costs are positive 2 In the low EE scenario, investment costs are expected to be app €41 billion per year, and in the high EE scenario investment
costs are expected to be app. €78 billion each year.

Multiple benefits of investing in energy
efficient renovation of buildings
5
Figure 1 Annual gross benefits to society from energy efficient
renovation of buildings, 2020
Note: These results include the rebound effect, and can therefore not be compared with the sub-results de-
rived in Chapter 1. We have applied a rebound effect of 20 per cent.
The total does not equal the sum of each element due to rounding.
Source: Copenhagen Economics
While most of the benefits from increased investments accrue to society as a whole, gov-
ernments may also reap additional net revenue gains. A lower level of total energy con-
sumption will reduce public spending on energy bills in e.g. public buildings and institu-
tions, it will contain public spending through less hospitalisation, it will imply a reduced
need for subsidies to energy consumption, and facilitate the achievement of EU’s 2020
renewable energy targets and reductions of greenhouse gases at a lower cost.
In total, annual permanent net revenue gains to public finances could reach €30 – 40
billion in 2020 if health-related benefits from energy efficient renovations are included
such as less hospitalisation, cf. Figure 2.3 This gain is made up from reduced outlay on
government subsidies, reduced energy bills, and less hospitalisation need. In this esti-
mate, we have taken into account the loss of government tax revenue from energy taxa-
tion. If investments in energy efficient renovation of buildings are continued after 2020,
these annual gains are likely to be doubled in 2030.
3 The health benefits are evident, but very uncertain to estimate, and should be interpreted accordingly
52 75 5
6
4
6 42
88
0
20
40
60
80
100
120
140
160
180
200
Low EE scenario High EE scenario
Billion EUR
Energy savings Reduced outlay on subsidies Reduced air pollution Health benefits
Total: 104
Total: 175

Multiple benefits of investing in energy
efficient renovation of buildings
6
Figure 2 Annual improvements of public finances, 2020
Note: These estimated gains to public finances are already included in in Figure 1, and should not be consid-
ered additional to these.
The total does not equal the sum of each element due to rounding.
Source: Copenhagen Economics
Now is a particularly good time for pursuing these gains. Attaining the benefits will re-
quire investments and man power, but the current economic climate is ideal for starting
such projects. Real interest rates are at record low levels in the majority of EU Member
States while, unfortunately, unemployment has risen in nearly all countries since 2008
and are likely to remain above “structural” levels for another 3-5 years. So investment
costs are low and there are ample available labour resources.
Our results suggest that by harvesting the investment opportunities provided by energy
efficiency renovations in the existing building stock, the EU Member States can stimulate
economic activity at an appropriate time, which can give rise to jobs for 760,000 –
1,480,000 people,4 and bring benefits to GDP of €153 - 291 billion depending on the level
of investments, cf. Figure 3. This corresponds to between 1.2 per cent and 2.3 per cent of
EU GDP.5 These benefits stem from increased economic activity in both the primary af-
fected sectors and through the indirect impact on secondary sectors. These benefits are
not permanent, but instead a “one-off” benefit from stimulating activity in a period of
economic underperformance.
4 These jobs will to a very large extent be “new jobs” in the time of economic underperformance. In fact, these jobs are likely to
remain in the energy efficient renovation of buildings industry. However, as the economy returns to it structural lev-
el, there will be no positive effect on total employment in the economy. 5 GDP measured in 2012 at current prices
9 12
-4 -6
5 6
19
27
-10
0
10
20
30
40
50
Low EE scenario High EE scenario
Billion EUR
Health benefits Reduced outlay on subsidies Lost tax revenue from energy taxation Energy savings
Total: 30
Total: 40

Multiple benefits of investing in energy
efficient renovation of buildings
7
Figure 3 Impact on GDP from increasing economic activity,
2012-2017
Source: Copenhagen Economics
Speeding up the recovery in the coming 3-5 years with continued projections of substan-
tial overall unemployment will also have a direct impact on public budgets. In the period
from 2012-2017 we estimate that public revenue can be increased by €67 billion or €128
billion depending on the scale of investments, cf. Figure 4. This corresponds to between
0.5 per cent and 1.0 per cent of EU GDP.6 These benefits are associated with more activity
and more employment, and come from increased revenue from income taxation, corpo-
rate taxation, and VAT, and from reduced outlay on unemployment benefits. These bene-
fits are not permanent, but instead a “one-off” benefit from stimulating activity in a peri-
od of economic underperformance.
6 GDP measured in 2012 at current prices
153
291
0
50
100
150
200
250
300
350
Low EE scenario High EE scenario
€ billion
Impact on GDP

Multiple benefits of investing in energy
efficient renovation of buildings
8
Figure 4 Impact on public revenue, increased economic activity
Note: The rebound effect is not relevant in relation to effects from increased economic activity
Source: Copenhagen Economics
Indeed, energy savings projects represent a very attractive combination of boosting the
economy and improving public finances at the same time. Addressing the main structural
barriers holding back these investments is either neutral or tends to improve public fi-
nances. We identify at least four key barriers holding these investments back:
Barrier 1: Rent regulation in both publicly and privately owned residential houses, and
to a certain extent commercial buildings, often prevents landlords from passing on the
costs for improvement in the quality of the buildings, including a lower energy bill to ten-
ants. This greatly reduces the landlords’ incentive to invest in energy efficient renovation
of buildings. This is a problem as such investments would reduce the total housing bill for
the tenant.
Action: Modernise rent regulation to allow landlords and tenants to split the gains from
energy efficient renovation of buildings. This is largely without direct costs to public fi-
nances.7
Barrier 2: Budget management of publicly owned buildings tend to focus on shorter
term cash flows as opposed to longer term running costs. This punishes projects with
higher upfront costs as counterpart to lower future operating costs i.e. a lower energy bill.
In addition, the discount rates applied to assess public investments have not followed the
general current trend towards lower market rates.
Action: Reform budget management of publicly owned buildings to allow for a longer
term focus in investments and renovation of buildings. This will reduce longer term oper-
ating costs in the publicly owned building stock.
Barrier 3: The relatively widespread favourable tax treatment of heating and electricity
use in buildings reduces gains from otherwise viable energy savings projects.
7 As overall housing cost would be reduced, the public costs to e.g. social housing would also be reduced.
67
128
0
20
40
60
80
100
120
140
Low EE scenario High EE scenario
€ billion
Impact on public finances

Multiple benefits of investing in energy
efficient renovation of buildings
9
Action: Remove/reduce such tax advantages to render energy efficient renovation of
buildings more attractive, and provide direct net revenue gains to public budgets.
Barrier 4: Handling of risk in renovation projects has traditionally been a weak point.
Investors may face high up-front costs, which imply that they run more substantial risks
than for a similar project with lower up-front costs. In this respect it is an important ques-
tion how you set up, monitor and evaluate performance contracts that ensure that the
owner/user of the building de facto gets the promised benefits required to pay back the
substantial and non-reversible investment cost over time. Concepts such as Energy Ser-
vice Companies (ESCO) and Energy Performance Contracts (EPC) which are explicitly
designed to align risks and responsibility for the outcome of such projects have not been
fully developed to deliver on deep renovation projects. In fact, there are examples of
countries not allowing the use of EPCs in the public sector.
Action: Well-designed risk-sharing programmes can help government as well as private
building owners to realise cost savings with very limited budget costs.

Multiple benefits of investing in energy
efficient renovation of buildings
10
Chapter 1
1 Benefits from investing in energy efficient renovation of buildings
There is an overwhelming amount of evidence that energy savings associated with energy
efficient renovation of buildings outweigh the up-front investment costs needed to under-
take the projects. As we will describe in Chapter 2, several barriers limit the undertaking
of these projects. In this chapter, we describe the benefits that society may reap if the
energy efficiency investment potential is released. These benefits go beyond pure energy
savings to also include e.g. improved health through reduced air pollution and improved
indoor climate, reduced outlay on government subsidies, and macroeconomic benefits
from increased economic activity through higher revenue from taxes and reduced unem-
ployment benefits. We have attempted to appraise these co-benefits in order to quantify
the aggregate benefits from investing in energy efficient renovation of buildings in the
EU. In addition to looking at the overall benefits to society, we have also assessed what
impacts there might be on public finances. In this chapter we describe our results, while
calculations and documentation of the results is given in the Appendix. It should be noted
that several of our estimates are subject to uncertainty, and that constructing these num-
bers is not an exact science. In the appendix, we state uncertainty spans/intervals on sev-
eral of the estimates while we in this Chapter show average values for presentation pur-
poses.
1.1 Characterising the benefits Enhancing the energy efficiency of the existing building stock induces benefits through
several channels. While some of these benefits occur directly through e.g. reduced energy
consumption, other benefits occur more indirectly through e.g. improved health over
several years. In addition, some of these benefits have direct positive effects on public
budgets while others are benefits to society at large without having specific public finance
effects. Our mapping of the different effects is presented in Figure 5, and discussed in the
following section.

Multiple benefits of investing in energy
efficient renovation of buildings
11
Figure 5 Effects of energy efficient renovation of buildings
Source: Copenhagen Economics
Energy savings through reduced energy consumption is a direct benefit stemming from
increased energy efficiency. In privately owned buildings the benefits will typically accrue
to the owner or the user of the building,8 while in publicly owned buildings the benefits
will accrue to the public or the users of publicly rented apartments. Given the proper dis-
tribution of benefits between public entities, this will improve public budgets. The benefit
from energy savings implicitly also includes the avoided capital cost of building additional
power plants, as these capital costs are included in the price of electricity. The same ap-
plies to investments in new grid capacity, which is included in the grid tariffs paid by con-
sumers.9
As energy efficient renovation of buildings will reduce energy consumption, it will have a
negative effect on public budgets through reduced tax revenue from energy consumption
taxes.
The European Member States are currently subsidising both fossil fuel consumption and
deployment of renewable energy technologies. By reducing energy consumption through
8 We will discuss the principal agent problem related to owners/tenants in the section related to reduced energy consumption
below. 9 Over time, consumers will pay for both the variable costs and the capital costs of energy production plants. By considering the
retail price of electricity when we calculate the benefits from reduced energy bills, we therefore include the capital
cost of new energy production infrastructure.

Multiple benefits of investing in energy
efficient renovation of buildings
12
energy efficient renovation of buildings, both types of subsidy can be reduced. This will
have a positive effect on public finances.
A more indirect benefit occurs through health benefits. Most energy efficiency measures
will improve the indoor temperature, and by choosing renovation measures that also im-
prove the indoor climate, health benefits can be obtained through fewer diseases, reduced
mortality, improved worker productivity, and improved overall quality of life. While most
of these benefits accrue to society in general, public budgets may also be improved
through fewer hospital expenses and fewer sick days.
Health benefits also occur as power and heat production from power plants, district heat-
ing plants and local heating is reduced. Power and heat generated in these facilities give
rise to air pollution such as NOx, SO2, small particle matters (PM2.5) and CO2, and by
reducing energy consumption this air pollution can be reduced.
Given the current economic downturn, energy efficiency investments can increase eco-
nomic activity, and improve public budgets by reducing unemployment benefits and in-
creasing tax revenue from the increased economic activity. Positive effects from this in-
clude, increased tax revenue (including VAT, labour income tax, corporate income tax
etc.) from increased activity and employment, reduced unemployment expenses. This
effect is relevant during periods of economic crises, when there is spare capacity in the
economy.
In addition to these benefits, which we attempt to quantify there are additional benefits
which are more difficult to assess and are beyond the scope of this study. Three such ben-
efits are the improved life quality of living in a more comfortable living environment e.g.
through a high average living room temperature (benefits which goes beyond the health
benefits, which we have tried to quantify), the value of reducing EU’s energy supply de-
pendence on third-countries, and the reduced dependence on volatile fossil fuel prices.
1.2 Scenarios We have considered two scenarios for investments in energy efficient renovation of build-
ings. These scenarios have been defined in an extensive study for DG Energy and
Transport in 2009.10 This work established the potential penetration in the market of best
available technologies under different conditions, such as the level of political ambition
for breaking down barriers to energy efficiency investments. Based on this extensive work
we focus on two scenarios: 1) Low Energy Efficiency scenario, and 2) High Energy Effi-
ciency scenario. These scenarios take into account a baseline increase in energy efficient
renovation of buildings based on a business-as-usual scenario. The potential defined in
the two scenarios should therefore be considered in addition to business-as-usual.
The low EE scenario assumes a relatively high level of policy initiative, in order to break
down barriers to otherwise cost effective investment potential. However, the entire in-
vestment potential is so called “cost-effective” meaning that under normal assumptions
10 Fraunhofer ISI et al (2009)

Multiple benefits of investing in energy
efficient renovation of buildings
13
on for example energy prices and consumer’s discount rates, the energy savings following
over time will be able to pay for the upfront investment cost.11 As an example, the scenario
assumes that the heating systems, and windows, which can be cost effectively replaced by
more efficient models (not necessarily the most efficient model) will be upgraded.
The high EE scenario on the other hand assumes full penetration of best available tech-
nologies. This should be seen as an upper limit for energy efficiency investments given the
current level of technology. As an example, the scenario assumes that all windows will be
upgraded to the most efficient models available on the market. While this implies that
technologies will be deployed beyond what is cost effective from an energy savings point
of view, it will bring additional benefits through e.g. improved health, which will improve
the overall profitability of the investment. While this example specifies an upper level on
the potential given current technologies, the potential for energy efficient renovation of
buildings is expected to increase going forward, as technologies improve and cost of tech-
nologies are reduced.
1.3 Identifying the energy saving potential Energy efficient renovation of buildings in the EU holds a large potential for energy sav-
ings. The potential for achieving energy savings in 2012 is 25 Mtoe in the low EE scenario
(35 Mtoe in the high EE), cf. Figure 6.12 In 2020 this potential is accumulated to 65 Mtoe
in the low EE scenario (95 Mtoe in the high EE) which corresponds to app. 5.4 per cent of
EU final energy demand (8.2 per cent in the high EE).13 In 2030 the accumulated energy
savings are increased to 127 Mtoe in the low EE scenario (190 Mtoe high EE), which cor-
responds to app. 10.6 per cent of EU final energy demand (15.8 per cent in the high EE).
The largest potential for renovating buildings lies in the household sector, followed by the
service sector and industry. The energy saving potential is only from energy efficient ren-
ovation of existing buildings, such as upgrading heating systems, improving insulation,
replacing windows, improving lighting systems, ventilation systems and air conditioners.
Energy efficiency improvements from household appliances such a washing machines,
energy efficiency gains from constructing new buildings or gains from more efficient in-
dustrial process such as improving the kiln for making cement clinkers from limestone
are not accounted for in these calculations.
11 Cost effectiveness is defined using consumer’s real discount rates ranging from 4 – 8 per cent. 8 per cent is applied to industry
to depict shorter pay back horizons than households. Public investments are given a 4 per cent real discount rate. 12 This potential is identified in an extensive study for DG Energy and Transport by Fraunhofer et al (2009). The calculations
take into account the specific building stock in all EU Member States including its age, the different climatic zones
including the amount of heating degree days, the energetic standard of the buildings (U-values), and the energy de-
mand in the different countries. This allow the authors to calculate energy consumption per square meter for differ-
ent buildings types in specific countries. Country specific information on material cost, labour costs, and very de-
tailed cost structure for different types of refurbishment is also taken into account, including learning curves for dif-
ferent technologies and the implied cost reductions over time. 13 Based on DG Energy (2010)

Multiple benefits of investing in energy
efficient renovation of buildings
14
Figure 6 Accumulated energy saving potential over time
Source: Copenhagen Economics based on http://www.eepotential.eu/esd.php
The energy saving potential is not equally spread out across Member States, but will de-
pend on the size and the condition of the existing building stock. Countries with a smaller
existing building stock will naturally have a smaller absolute potential for renovations.
Countries with an ageing building stock will also have a higher potential for renovations.
One study finds that more than 68 per cent of apartments and 60 per cent of single family
homes in France were built before 1975.14 This makes energy efficient renovation of build-
ings more relevant in France than in countries, where the building stock is younger.15 We
find that the largest potential is present in Germany (24 per cent of EU total), France (13
per cent), UK (12 per cent), and Italy (10 per cent), cf. Figure 7. These four countries con-
stitute 58 per cent of EU’s total energy savings potential.
14 McKinsey Global Institute (2011), page 89 15 Ibid
0
20
40
60
80
100
120
140
160
180
200
Low EE High EE Low EE High EE Low EE High EE
2012 2020 2030
Mtoe
Industry Service sector Households

Multiple benefits of investing in energy
efficient renovation of buildings
15
Figure 7 Share of energy saving potential by country, 2030
Note: Energy saving potential is measured by Mtoe.
The figure shows the distribution in 2030. A similar picture holds for the potential in 2020.
The full distribution of potentials on countries can be found in the appendix.
Source: http://www.eepotential.eu/esd.php
The gross investment costs associated with meeting this energy saving potential is esti-
mated to be app. €41 billion annually from 2012-2020 in the low EE scenario, and €78
billion in the high EE scenario. In order to reach the potential in 2030 a similar annual
amount is needed.16
1.4 Quantifiable benefits from investing in energy efficient
renovation of buildings and the impact on public finances In this section we quantify the benefits from energy efficient renovation of buildings de-
scribed in Figure 5. In addition to the benefits we have been able to quantify, there are
likely to be additional benefits, which are more difficult to quantify and are beyond the
scope of this paper. Three such benefits are the improved life quality of living in a more
comfortable living environment e.g. through a high average living room temperature
(benefits which goes beyond the health benefits, which we have tried to quantify), the
value of reducing EU’s energy supply dependence on third-countries, and the reduced
dependence on volatile fossil fuel prices. All our calculations and assumptions are elabo-
rated in the Appendix, while we in the main text suffice to describe our results.
16 The European Commission (2012), Annex 1 finds that €60 billion per year is needed from 2012-2020 in order to reach the
energy efficiency potential in both existing buildings and in new buildings. We focus only on renovating the existing
building stock.
For more information on investment cost of renovating buildings, see BPIE (2011) who estimate present value investment costs
of various different energy saving scenarios.
0
5
10
15
20
25
30
Germany France United
Kingdom
Italy Poland Spain Czech
Republic
Rest of EU
pct.
Share of energy saving potential

Multiple benefits of investing in energy
efficient renovation of buildings
16
Within each element we assess the overall benefits to society, and whether or not it will
have an impact on public finances. In the next section (Section 1.5), we aggregate both the
overall benefits and the total expected impact on public finances.
Energy savings
The most direct and also the most significant benefit from energy efficient renovation of
buildings is the savings resulting from lower energy consumption. If the EU is able to
achieve the accumulated potential for energy efficiency in 2020 it can save energy costs of
€66 billion or €94 billion each year respectively for the low and high EE scenario. These
energy savings can be increased to a total of €131 billion or €192 billion annually (low and
high scenario) if the EU also fulfils the potential in 2020-2030, cf. Figure 8. As the public
sector owns 7 per cent of EU’s residential buildings and 29 per cent of non-residential
buildings, a significant share of these total energy savings accrue to the public sector. This
corresponds to €11-15 billion annually in 2020, and a total of €21-29 billion in 2030.
Figure 8 Energy savings from renovation of buildings
Note: The energy savings are annual savings which can be achieved in 2020 and 2030 respectively given an
investment path that meets the potential for energy efficiency renovation of buildings in 2020 and
2030 respectively.
Note that the public budget benefits are a share of total benefits to society.
The total does not necessarily equal the sum of the elements due to rounding.
Source: http://www.eepotential.eu/esd.php for energy saving potential.
Price of energy projections: DG Energy (2010)
Reduced tax revenue from energy taxation
One source of tax revenue for European governments is energy taxes. As energy consump-
tion is reduced from energy efficiency initiatives, government tax revenue will decrease.
We find that the expected reduction in energy consumption in the different scenarios will
give rise to a loss of tax revenue of €5.2 billion or €7.2 billion annually in 2020 (depend-
ing on the scenario), cf. Figure 9. If the potential going towards 2030 is also met, energy
taxes will be reduced annually with a total of €9.7 or €13.8 billion in 2030 (depending on
11 15 21 29
Total: 66
Total: 94 Total: 131
Total: 192
0
50
100
150
200
250
Low EE scenario High EE scenario Low EE scenario High EE scenario
€ bn
Overall benefit Public budget benefit
2012-2020 2020-2030

Multiple benefits of investing in energy
efficient renovation of buildings
17
the scenario). This loss of tax revenue is not a loss to society as a whole, since it is a trans-
fer from governments to consumers. However, it still counts against the benefits to public
budgets which we find elsewhere in this report.
Figure 9 Reduced tax revenue from energy taxes
Note: The calculation is based on an average electricity tax in EU, and the excise duties on natural gas and
coal for heating use in business and non-business for Germany. While the Member States’ electricity
taxation and excise duties on heat varies greatly, our calculations can be used as an approximate av-
erage for EU as a whole.
Source: Copenhagen Economics based on DG Energy (2010), DG TAXUD (2012)
Reduced outlay on government subsidies
In several EU Member States, government subsidies are being allocated both to consump-
tion of energy through e.g. fuel tax reductions/exemptions, and to deployment of renewa-
ble energy technologies that cannot yet compete without government subsidies. While
some Member States subsidise production of energy, the majority of these subsidies are
related to the winding down of coal fired power plants.17 Such subsidies are not related to
the level of energy consumption, and are therefore not expected to be reduced by reduced
energy consumption from increased energy efficient renovation of buildings.
We find that the outlay on energy consumption subsidies in nine large EU countries cor-
respond to about €11.7 billion annually.18 By reducing energy consumption through ener-
gy efficient renovation of buildings according to the potentials identified in our two sce-
narios, we find that these governments can reduce outlays on subsidies by €0.7 – 1.1 bil-
lion annually in 2020 (low and high scenario), cf. Figure 10.
Additionally, by reducing energy consumption, the target of 20 per cent renewable energy
by 2020 can be achieved at reduced costs for governments. In particular, EU governments
can reduce outlays on subsidies to renewable energy deployment annually by €7.1 billion
17 See OECD (2011c) 18 Estimate is based on data from OECD (2011c).
5.2 7.2
9.7
13.8
0
2
4
6
8
10
12
14
16
Low EE scenario High EE scenario Low EE scenario High EE scenario
€ bn
Public revenue loss
2012-2020 2020-2030
Multiple benefits of investing in energy
efficient renovation of buildings
18
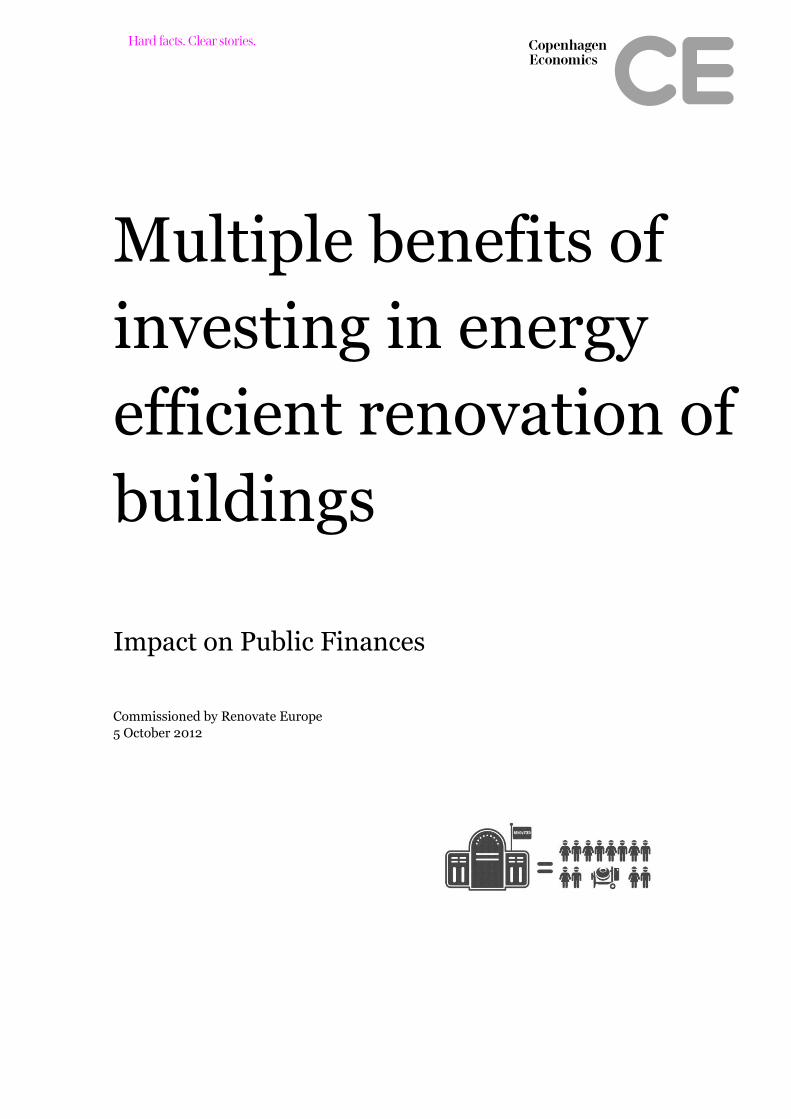
in 2020, cf. Figure 10. These funds could alternatively be used to boost investments in
innovation of low carbon technologies, including energy efficiency, in order to meet more
stringent climate targets in the future.19 Our estimates are based on the EU government’s
envisaged deployment of renewable energy, described in the countries’ National Renewa-
ble Energy Action Plan (NREAP). It should be noted that the cost of energy from renewa-
ble technology is uncertain, and is subject to rapid change over time. We have calculated
the gain to public finances from both a low-cost, and a high-cost scenario. Figure 10
shows an average value, and the low and high-cost estimates respectively can be found in
the appendix. These benefits will improve public budgets each year.
Figure 10 Reduced outlay on subsidies
Note: Since the EU NREAPs only go to 2020, we have assumed a parallel deployment of the same technolo-
gies going towards 2030.
For energy consumption subsidies we have only included the OECD’s EU countries.
The total does not necessarily equal the sum of the elements due to rounding.
Source: Copenhagen Economics, based on Member States NREAP, OECD (2011c), DG Energy (2010), and
http://en.openei.org/apps/TCDB/
Health benefits – reduced air pollution
By reducing energy consumption, the amount of air pollution will be reduced. As energy
production from power plants, district heating plants, and local heating production is
reduced, so is the air pollution associated therewith. The air pollution primarily takes
place through the emissions of CO2, NOx, SO2, and small particle matters (PM2.5).
We find that by reducing air pollution, an annual health benefit worth €5-8 billion will
accrue to the European population from 2020, cf. Figure 11. By continuing with energy
efficiency investments after 2020, this annual benefit can be doubled in 2030. For com-
parison, the EU Commission finds that by going from a 20 per cent GHG reduction target
to a 30 per cent target, the value of reduced air pollution ranges from €3.5 – 17 billion.20
19 See e.g. Copenhagen Economics (2011), and Copenhagen Economics (forthcoming) 20 See European Commission (2010), page 95
0.7 1.1 1.4 2.1
7.1 7.1
14.0 14.0
0
2
4
6
8
10
12
14
16
18
Low EE scenario High EE scenario Low EE scenario High EE scenario
€ bn
Avoided energy consumption subsidies Avoided RE deployment subsidies
2012-2020 2020-2030
Total: 8 Total: 8
Total: 15 Total: 16

Multiple benefits of investing in energy
efficient renovation of buildings
19
Figure 11 Value of reduced air pollution
Source: Copenhagen Economics based on GAINS model, DG Transport (2008), DG Energy (2010), Eurostat,
and IEA (2012)
The European Commission has calculated the avoided costs from other investment
measures in order to reach EU policy objectives of reduced air pollution. This figure can
be seen as the alternative value of reducing air pollution. In the scenario for going from a
target of 20 per cent GHG emission reductions to 30 per cent, this has the value of €5.3
billion per year. 21 This scenario assumes a reduction in gross energy consumption of 6.5
per cent, and is therefore comparable to a cross between the low and high EE scenario.
Health benefits – improved health from improved indoor quality
There is substantial evidence that energy efficient renovation in buildings will have addi-
tional health effects. Renovations such as improved insulation, more efficient heating and
cooling systems, better indoor lighting, and better ventilation affects both health and
productivity through several channels. The health effects stem primarily from alleviating
inadequate warmth and increasing access to daylight and ventilation. Studies have shown
that respiratory and circulatory hospitalisations have been reduced by insulating houses,
as these diseases are particularly responsive to the effects of temperature.22 Cold houses
are also likely to be damp, which can lead to the growth of mould, which can cause respir-
atory symptoms. In addition better indoor lighting and ventilation improves the indoor
climate in office buildings which is likely to increase productivity, and may even improve
students’ learning ability and their future productivity.23
To our knowledge, these benefits have been quantified to a very low extent and only for
very specific projects under specific circumstances. Due to high uncertainty related to an
21 See European Commission (2010), page 59 22 Barnard et al (2011), page 11. 23 See e.g. Threlfall (2011), Liddell et al. (2011), Barnard et al. (2011), UK Department of Health (2010), REHVA (2006), and
Slotsholm (2012)
5
8 10
15
0
2
4
6
8
10
12
14
16
Low EE scen High EE scen Low EE scen High EE scen
€ bn
Value of reduced air pollution
2012-2020 2020-2030

Multiple benefits of investing in energy
efficient renovation of buildings
20
extrapolation of such numbers to the whole of the EU, we include them in the aggregate
benefits with dashed lines, in order to illustrate the uncertainty they are subject to. Never-
theless, we stress that there is substantial evidence that such health effects are of consid-
erable magnitude and may outweigh the value of energy savings. In fact, our ball park
estimates suggest that these health benefits may be worth €33 - 73 billion annually in
2020, in the low EE scenario through improved life quality, less public health spending
and fewer missed days of work.24 In the high EE scenario this amounts to €64 - 140 billion
annually. Continuing investments after 2020 may double this amount. This suggests that
such effects should be considered when the profitability from a societal point of view of
energy efficient renovation of buildings are evaluated. In order to make a more precise
estimate of the actual health benefits to EU as a whole, more research in this area is en-
couraged.
Increased economic activity
In the current economic environment with relatively high unemployment and spare ca-
pacity in the economy, there are good arguments for releasing the energy efficiency reno-
vation potential. Such increased investments will stimulate economic activity, and move
people from unemployment to employment. As growth rates catch up and eliminate the
substantial amount of spare capacity that the EU economy is currently facing – i.e. the
output gap is being closed – the benefit to the total economy from such increased invest-
ments is limited, as they will tend to crowd out activity elsewhere in the economy.
We expect that the output gap will not be closed before 2017. In 2011, OECD concluded
that EU was expected to close its output gap in 2015.25 Subsequently, the economic projec-
tions have been worse than expected. Based on this we expect that the output most likely
will not be closed until 2016-2018, hence we chose 2017 as the basis of our calculations.
Based on this, we calculate the direct and indirect macroeconomic effects from increasing
economic activity in this period with increased investments in energy efficient renovation
of buildings. These effects encompass benefits to GDP and public finances from increased
employment through inter alia increased income tax revenue, corporate tax revenue, VAT
revenue and reduced unemployment benefits. Our ball park estimates show that app.
760,000 jobs each year can be related to energy efficient renovation of buildings, if annu-
al investments of €40 billion are undertaken towards 2020. We estimate that such an
investment path will result in an accumulated impact on GDP in 2012-2017 of €153 bil-
lion in the low EE scenario and €291 billion in the high EE scenario, cf. Figure 12. This
translates into an improvement in public budgets of €67 billion in the low EE scenario,
and €128 billion in the high EE scenario as tax revenues go up and social expenditure to
unemployment benefits etc. go down.
24 See the appendix for the calculations 25 OECD (2011) Economic Outlook

Multiple benefits of investing in energy
efficient renovation of buildings
21
Figure 12 Benefits from stimulating economic activity
Note: The benefits are measured as an accumulated benefit to EU from achieving the energy efficiency
renovation potential from 2012-2017.
These benefits should be interpreted as a one-off benefit in the period 2012-2017.
See the appendix for the calculations
Source: Copenhagen Economics, based on IMF World Economic Outlook database, OECD (2001), and DG
ECFIN (2012).
Taking the rebound effect into account
When the cost of energy is reduced (e.g. through increased energy efficiency), consump-
tion of energy is very likely to increase in response. In the economic literature, this is
known as the rebound effect. The size of the rebound effect varies from environment to
environment, such as for example how many extra kilometres will be driven when the
price of petrol is reduced, or how much the average room temperature will be increased
when it is cheaper to do so. There is uncertainty related to the actual size of this rebound
effect. A survey of the rebound literature has shown however, that the rebound effect re-
lated to room temperature is likely to be between 10-30 per cent.26 In our context, this
means that if energy efficiency investments have the potential to reduce energy consump-
tion by 65 Mtoe in 2020 (low EE scenario), a high rebound effect will increase energy
consumption by 19 Mtoe, cf. Figure 13. This will therefore also reduce the expected
amount of energy savings.
In our calculations above, we show the results excluding the rebound effect, in order to
allow for easy comparison with other rebound estimates. When we aggregate the benefits
below, we do include the rebound effect and apply a rebound effect of 20 per cent.
26 Greening et al (2000)
153
291
67
128
0
50
100
150
200
250
300
350
Low EE scenario High EE scenario
€ billion
Impact on GDP Impact on public finances

Multiple benefits of investing in energy
efficient renovation of buildings
22
Figure 13 Energy saving potential with rebound
Note: The figures depicts the low energy efficiency in 2020
Rebound effect is measured for room heating improvements (including insulation)
Source: Copenhagen Economics based on Greening et al (2010)
1.5 Aggregating the benefits In order to consider the profitability of energy efficient renovation in buildings in the EU,
not only the pure energy savings should be taken into account. Conversely, co-benefits
such as health improvements and reduced outlay for subsidies to energy consumption
and renewable energy deployment should also be considered.
We estimate that by achieving the potential for energy efficient renovation in buildings in
2020, EU Member States may achieve annual benefits worth of €104 billion in the low EE
scenario, and €175 billion in the high EE scenario, cf. Figure 14. €42 and €88 billion of
these respectively are benefits from improved health, where our estimates are subject to
considerable uncertainty and should be interpreted accordingly. If investments are con-
tinued in order to meet the energy efficiency potential in 2030, these annual benefits are
likely to be doubled. Please note that in the aggregate benefits, the rebound effect has
been taken into account. We apply a rebound effect of 20 per cent. This implies that the
aggregate figures used in this section are 20 per cent lower than in the preceding sections,
whenever the rebound effect is relevant.
6
19
0
10
20
30
40
50
60
70
Without rebound Low rebound effect High rebound effect
Mtoe
Rebound effect Energy saving potential

Multiple benefits of investing in energy
efficient renovation of buildings
23
Figure 14 Annual benefits to society, 2020
Note: The rebound effect has been taken into account
The total does not necessarily equal the sum of the elements due to rounding
Source: Copenhagen Economics
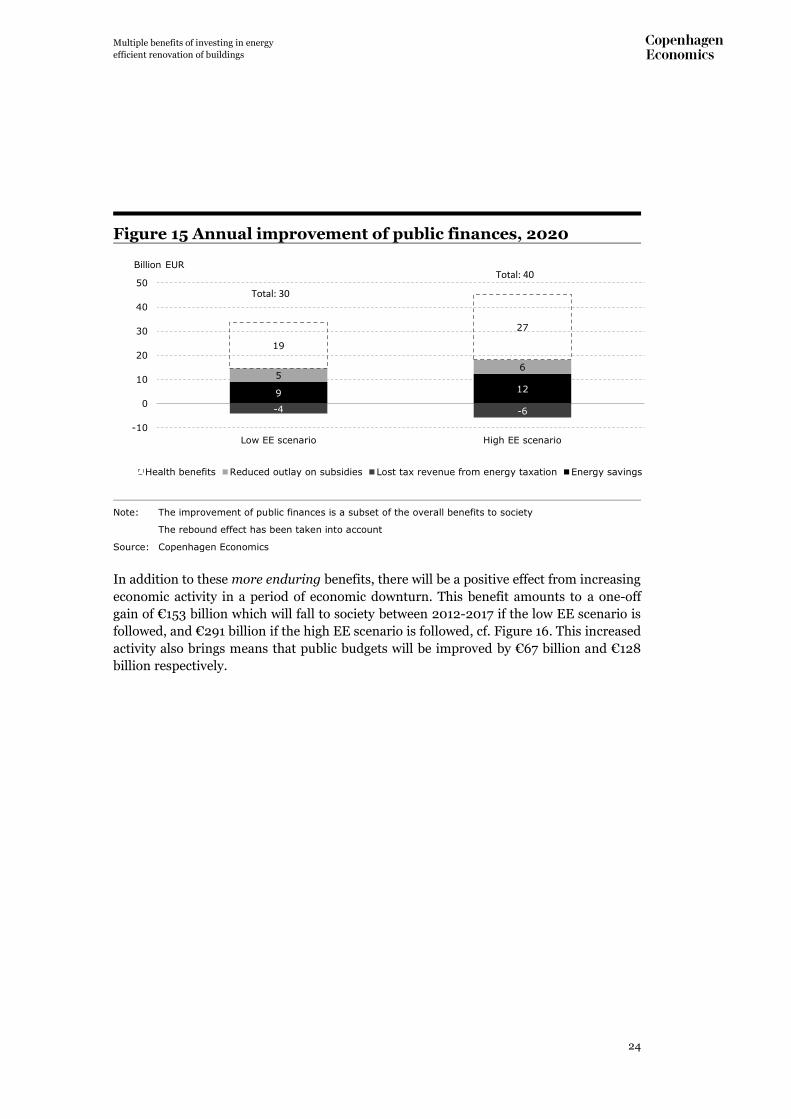
Our estimates suggest that by releasing the potential for energy efficiency renovation,
public finances in Europe can be improved by €30 – 40 billion annually from 2020, cf.
Figure 15. €19 and €27 billion of these respectively are benefits from improved health,
where our estimates are subject to considerable uncertainty and should be interpreted
accordingly. Continuing investments towards 2030 will most likely double this amount in
2030. Note that the benefits to public finances are a subset of the overall benefits to socie-
ty.
52 75 5
6
4
6 42
88
0
20
40
60
80
100
120
140
160
180
200
Low EE scenario High EE scenario
Billion EUR
Energy savings Reduced outlay on subsidies Reduced air pollution Health benefits
Total: 104
Total: 175
Multiple benefits of investing in energy
efficient renovation of buildings
24
Figure 15 Annual improvement of public finances, 2020
Note: The improvement of public finances is a subset of the overall benefits to society
The rebound effect has been taken into account
Source: Copenhagen Economics
In addition to these more enduring benefits, there will be a positive effect from increasing
economic activity in a period of economic downturn. This benefit amounts to a one-off
gain of €153 billion which will fall to society between 2012-2017 if the low EE scenario is
followed, and €291 billion if the high EE scenario is followed, cf. Figure 16. This increased
activity also brings means that public budgets will be improved by €67 billion and €128
billion respectively.
9 12
-4 -6
5 6
19
27
-10
0
10
20
30
40
50
Low EE scenario High EE scenario
Billion EUR
Health benefits Reduced outlay on subsidies Lost tax revenue from energy taxation Energy savings
Total: 30
Total: 40

Multiple benefits of investing in energy
efficient renovation of buildings
25
Figure 16 Benefits from stimulating economic activity
Note: The benefits are measured as an accumulated benefit to EU from making achieving the energy effi-
ciency renovation potential from 2012-2017.
These benefits should be interpreted as a one-off benefit in the period 2012-2017.
Source: Copenhagen Economics, based on IMF World Economic Outlook database, OECD (2001), and DG
ECFIN (2012).
153
291
67
128
0
50
100
150
200
250
300
350
Low EE scenario High EE scenario
€ billion
Impact on GDP Impact on public finances

Multiple benefits of investing in energy
efficient renovation of buildings
26
Chapter 2
2 Barriers and policy responses
2.1 Why are buildings interesting?
Achieving energy efficiency is a key priority for the Commission and Member States. This
is illustrated by the EU 2020 objective of increasing energy efficiency by 20 per cent.
Renovating buildings is only one method of improving energy efficiency; however it is a
very interesting method for at least two reasons 1) The building sector is a large source of
energy consumption, and 2) studies show that renovations of existing buildings is one of
the low-cost options to reduce emissions of CO2.27
Firstly, energy consumption in buildings constitutes 40 per cent of total final energy con-
sumption in EU, cf. Figure 17. This is a larger share than both the transport and the in-
dustry sector. This figure includes both elements that can be affected by energy efficiency
renovations such as heating consumption (can be affected through better insulation etc.),
and elements that cannot be affected such as energy consumption by appliances such as
TVs and washing machines.
Figure 17 Final energy consumption by sector
Note: Energy consumption in agriculture, fishing and “other” makes up 3 per cent of final energy consump-
tion, and is not included in the above figure
Source: DG Energy: EU Energy in Figures 2012
27 McKinsey & Company (2010) for examples finds that such renovations are one of the most attractive options to bring down
greenhouse gas emissions cost effectively.
Industry
25%
Transport
32%
Households
27%
Services
13%
Buildings
40%

Multiple benefits of investing in energy
efficient renovation of buildings
27
Secondly, much evidence has shown that renovating the existing building stock is one of
the most attractive and low cost options to reduce CO2 emissions, and potentially improve
energy security by reducing imports of fossil fuels. A number of studies have suggested
that the net cost of investing in renovating the existing building stock is not only low, but
is in fact negative.28 This means, that through the induced energy savings, investments in
energy efficient renovation of buildings will pay for themselves at current energy prices.
In addition to Marginal Abatement Cost curves (MAC-curves) prominent in several macro
studies, several studies find that energy efficiency improvements in buildings are profita-
ble even with very high financing cost. One assessment from 2011 found that the internal
rate of return (IRR) on typical energy efficiency investments to be nearly 30 per cent on
average for an individual firm (even higher benefits to society).29 This implies that an in-
vestment will be profitable to undertake even when the real interest rate (the financing
cost) is 30 per cent or less. The IRR varies across different types of projects, and can be as
high as 49 per cent for an average investment in e.g. improving lighting. The largest abso-
lute saving potential is typically found in the heating and cooling category, as its share of
energy consumption is relatively larger.
Some criticism has been raised against the MAC and IRR approach in general and specifi-
cally on the McKinsey approach on several accounts, inter alia:30 1) that ex ante studies
dominate much of the estimates, and that ex post assessments often show a lower than
expected potential, 2) that “free riders” are not always properly accounted for, so that the
overall potential includes behaviour that would have taken place even without policy, 3)
most assessments ignore the rebound effects, which implies that as the price of energy is
reduced in response to increased energy efficiency, demand for energy (consumption)
increases, and 4) transaction cost, including e.g. scarce management time and resources
are typically not included. In sum, this implies that such findings tend to value the poten-
tial too optimistically.
However, even with a reduction in the profitability of energy efficiency projects, there is
strong reason to believe that such projects are highly profitable. As the real interest rate in
most European countries is currently very low – and even negative in several countries –,
cf. Figure 18, projects will be profitable even with very low IRRs.
28 A large number of studies construct MAC-curves that makes this point. The MAC curve has been popularised by e.g. McKinsey
& Company (2010). 29 United Technologies Corporation (2011) 30 See e.g. NBER (2009)

Multiple benefits of investing in energy
efficient renovation of buildings
28
Figure 18 Real interests rates of government bonds
Note: We use the nominal interest on a 10-year government bond for most European countries. We use the
HICP index to adjust for inflation.
The curve shows a weighted average for all EU countries except countries severely affected by the
economic crisis leading to extraordinarily high interest rates such as: Italy, Spain, Portugal, and Ire-
land. The real interest rate has been weighted by the countries’ GDP.
Source: Copenhagen Economics, based on data from Eurostat
MAC and IRR studies typically only include the energy savings that may be derived from
energy efficient renovations of buildings. However, as we showed in Chapter 1, these ren-
ovations will also give rise to a range of co-benefits, which makes each individual project
even more profitable from a societal point of view than by just realising energy savings.
The marginal abatement cost curves, and studies on profitability of actual energy efficien-
cy investments suggest that there is a large unfulfilled potential for otherwise profitable
investment projects to be undertaken. This is accentuated by the very low real interest
rates in most European countries, which by definition makes more investment projects
economically profitable. We argue that there are several barriers holding these invest-
ments back. The barriers may be grouped into: 1) Regulatory failures, and 2) Market fail-
ures. We will describe these barriers in detail in the following sections.
2.2 Barriers from regulatory failure
In our view, the existence of regulatory related barriers is the most convincing argument
for the existence of unreleased potential for energy efficiency investments in buildings.
Several types of regulatory failures are likely to exist:
Rent regulation
Rent regulation is a common feature of almost all EU Member States’ housing policies.
While concrete regulation differs between countries, the most common feature is rent
control, which typically prevents landlords from increasing the rent level above some
-2
-1
0
1
2
3
4
5
2000 2001 2002 2003 2004 2005 2006 2007 2008 2009 2010 2011 2012
per cent
Multiple benefits of investing in energy
efficient renovation of buildings
29
regulated level. The strictness of the rent control defines e.g. whether or not landlords
may pass on cost increases to the tenant, and in which cases what types of costs may be
passed on.
The fact that owners/landlords of buildings are the ones to undertake the renovation in-
vestment, and users/tenants are the ones to benefit from reduced energy savings, gives
rise to a so called split-incentive problem. In the literature this is sometimes known as a
principal/agent problem. Basically, the landlords will not have the proper incentive to
undertake such investments, unless they have the possibility to pass on (some of) the
investment costs to the tenants. The tighter control there is over the rent setting, the less
incentive landlords will have to invest. One example in the UK shows that wall cavities
where filled at a much higher rate in the owner-occupied sector than in the private rented
sector (49 per cent versus 32 per cent in 2008).31 According to OECD, the EU Member
States with the tightest rent control in the private rental market is Sweden, Netherlands,
Germany, Czech Republic and Denmark, cf. Figure 19. Rent control for social housing is
especially strict in Portugal, Ireland, Luxembourg, Belgium, Italy and Hungary.
Figure 19 Rent control regulation
Note: The degree of rent control is a constructed indicator determining how increases in rent are deter-
mined, and the permitted cost pass-through onto rents.
Source: OECD (2011a)
The rent regulation problem may have a significant impact, as 26 per cent of the EU
building stock is rentals, cf. Figure 20. This includes both residential and non-residential
buildings.
31 UK government Energy Bill, Green Deal Impact Assessment (2010), referring to English Housing Condition Survey (2007)
and (2008).
0
1
2
3
4
5
6
Degree of rent
control
Private rental market Social housing

Multiple benefits of investing in energy
efficient renovation of buildings
30
Figure 20 Share of owner-occupied and rental
Note: Data only available for 15 countries
Source: Own calculations based on BPIE (2011)
One of the countries having recognised the misaligned incentives between landlords and
tenants as a problem is the UK. In October 2011, UK adopted the Energy Act 2011, which
has as a main priority to increase investments in energy efficiency renovations especially
in the private rented market. While not concretely addressing rent control legislation, the
Energy Act 2011 offers finance for landlords allowing them to undertake such investments
with no up-front investment cost, cf. Box 1.
Box 1 The UK Energy Act 2011 – Green deal In 2011, the UK adopted an Energy Act. One of the three main objectives is how to
tackle barriers to investment in energy efficiency. This objective is addressed through
three concrete measures: 1) A Green deal, 2) Private rented sector reform, and 3) En-
ergy Company Obligation.
Underlying the legislation is an acknowledgment that energy efficiency renovations in
buildings holds a large unused potential for reducing CO2 emissions cost effectively.
One of the main barriers being addressed in the legislation is the problem of unaligned
incentives between landlords and tenants. While it seems that the UK has not as such
adjusted rent control legislation, which is relatively strict on social housing, cf. Figure
19, it has adopted innovative measure to breaking down this barrier. The policy stands
on several pillars:
Green deal
The green deal is a new financing framework for energy efficiency renovations in
buildings. The financing provided by this legislation is funded by a charge on energy
bills. The Green Deal anticipates the retrofit of over a million homes per year, and is
expected to deliver aggregate investments in the region of £7 − £11 billion per year
71%
26%
3%
Owner-occupied Rented Other

Multiple benefits of investing in energy
efficient renovation of buildings
31
over 15 years.32 A wide range of energy efficiency renovations are eligible for funding
under the framework, cf. Table 1.
Table 1 Measure eligible for financing through Green
Deal
Heating, ventilation and air conditioning
Condensing boilers
Heating controls
Under-floor heating
Heat recovery systems
Mechanical ventilation
Flue gas recovery devices
Building fabric
Cavity wall insulation
Loft insulation Flat roof insulation
Internal wall insulation
External wall insulation
Draught proofing
Floor insulation
Heating system insulation (cylinder, pipes)
Energy efficiency glazing and doors
Lighting Lighting fittings
Lighting controls
Water heating Innovative hot water systems Water efficient taps and showers
Microgeneration
Ground and air source heat pumps
Solar thermal
Solar PV
Biomass boilers
Micro-CHP
Source: UK Department of Energy and Climate Change (2011), page 7.
Private rented sector
Several provisions related to the private rented sector have been put in place. One
provision is that private landlords will be unable to refuse a “reasonable” request from
tenants to undertake energy efficiency improvements, if there is a government fund-
ing package available (Green deal, or ECO as covered below). In addition, it is from
2018 rendered unlawful to rent out a residential or business premise that does not
reach a minimum energy efficiency standard. These requirements are subject to there
being no upfront financial cost to landlords.
Energy Company Obligation
A new energy company obligation is envisaged, which will work alongside the Green
Deal finance offer and target those households which are likely to need additional sup-
port, in particular those concerning vulnerable people on low incomes and those in
hard-to-treat housing.
Source: UK Department of Energy and Climate Change, Energy Act 2011
Energy subsidies
In general, increasing the cost of energy will improve the incentives to invest in energy
efficient renovations of buildings, as the expected energy cost savings will increase. In
several EU countries, however, the opposite takes place, as energy consumption is directly
encouraged by targeted fuel subsidies to low-income families, lower excise duties on heat-
ing oil than other fossil fuels, and by reduced VAT rates on energy consumption. In most
countries, VAT is applied in addition to regular taxes on energy consumption. These VAT
rates are however reduced by 9-15 percentage points in Greece, Ireland, Italy, Luxem-
32 Climate and Strategy Partners, Financing Mechanisms for Europe’s Building Renovations.

Multiple benefits of investing in energy
efficient renovation of buildings
32
bourg, Malta and United Kingdom on electricity, cf. Figure 21, while VAT on heating is
also reduced in most of the same countries, including Portugal.
Figure 21 Reduced VAT on energy consumption
Note: All countries with reduced VAT rates on energy electricity and heating is included in the figure
Source: Copenhagen Economics based on DG TAXUD (2012)
One study which assessed policies with the objective of mitigating so called fuel poverty in
UK, Ireland and USA found that in 2010 the UK and the US together spent €6 billion on
income-supplementing fuel payments and social tariffs to reduce effective energy prices.33
Such subsidies to energy consumption are typically based on distributional concerns, as
the energy bill typically constitutes a relatively large share of especially low-income fami-
lies’ budgets. While acknowledging these income distribution considerations, we note that
the subsidies are inefficient and costly for public budgets in addition to harming the envi-
ronment. Income distribution concerns will much more effectively and efficiently be ad-
dressed through targeted income redistribution. Indeed our proposal, as noted later, is to
push for deep and economically viable energy savings programmes that will reduce the
need for energy subsidies in the first place while replacing general energy subsidies to all
households with income transfers to the households most severely affected by the un-
winding of the subsidies. The net effect will be public savings, energy savings, and safe-
guarding of income distribution objectives. Indeed if the EU removed existing general
reduced VAT-rates on energy consumption (heating and electricity), energy consumption
in EU would fall by app. 0.8 per cent,34 and public budgets would be improved by €3.4
billion corresponding to 0.03 per cent of GDP.35 These energy saving estimates are medi-
33 IEA (2011a), p. 7 34 Copenhagen Economics (2008), p. 66. The model simulations in this study are based on reduced VAT rates present in 2008.
Some countries have removed these reduced rates since giving rise to a lower expected reduction in energy consump-
tion. 35 Copenhagen Economics (2008), p. 68. Some countries have removed these reduced rates since giving rise to a lower expected
increased in VAT revenue
0
2
4
6
8
10
12
14
16
per cent reduction
Reduced VAT on electricity Reduced VAT on heat

Multiple benefits of investing in energy
efficient renovation of buildings
33
um term effects, and the longer term effects are likely to be much larger, as the increased
implicit energy price affects investment incentives, and leads to e.g. more energy efficient
buildings. If this is broadened to include all energy consumption tax breaks in the largest
EU countries, public budgets could be improved by €11.7 billion.36,37
Regulation of public investment and ownership of buildings
Several studies have suggested that regulation of public ownership of, and investments in,
buildings provides insufficient incentives, and even restricts investments in energy effi-
cient renovations of buildings. As the public sector owns 29 per cent of non-residential
buildings in the EU, cf. Figure 22, this may be a significant barrier to overall energy effi-
ciency investments.
Figure 22 Share of public ownership of non-residential build-
ings
Source: Copenhagen Economics based on BPIE (2011)
A typical governance structure in EU Member States is to assign ownership of public
buildings such as schools, hospitals, recreational centres etc. to local municipalities. In
many countries, the municipalities are not allowed to borrow externally to finance in-
vestments, which imply that energy efficiency investments typically must be taken out of
the annual budgets. In fact, a survey of public officials in UK, Germany and France
showed that while access to finance instruments from banks was not considered a barrier,
insufficient budgets and to some extent high upfront cost for energy efficiency improve-
ments were considered as important barriers for energy efficiency improvements.38 This
consequently implies that behaviour tends to focus on shorter term cash flow effects as
opposed to the long term benefits accruing over the life time of the assets they own. In
36 OECD (2011c). 37 Under the assumption of no rebound effect 38 Institute for building efficiency (2011a), p. 5
70%
29%
1%
Private
Public
Other/mixed

Multiple benefits of investing in energy
efficient renovation of buildings
34
addition, the limited funds available restrict deeper retrofit investments, which typically
give rise to the most significant energy savings.39
This point does not only apply to energy efficient renovation of buildings, but to mainte-
nance of buildings in general. A study from Denmark showed that the local municipalities
were not making sufficient maintenance renovations to maintain a sustainable building
stock quality and condition.40
Engaging in Energy Performance Contracts (EPCs) with Energy Service Companies (ES-
COs) may overcome this structural barrier if the ESCO is willing to finance the vast ma-
jority of the up-front investment cost. However, public regulation often inhibits the in-
volvement of ESCOs or the implementation of energy performance contracts.41
An additional barrier is that many central administrations do not allow savings from en-
ergy efficiency projects to be recycled into the next year’s annual budget. There are very
valid public governance reasons for doing so, however it provides no incentive for local
governments to undertake the investments if they obtain no benefits of doing so. Given
the high expected returns from energy efficiency investments, it should be economically
feasible to construct a model that allows local governments to reap a share of the energy
savings (at least for a period of time) while channelling the remaining share into the over-
all public finances.
There has been considerable discussion about the appropriateness of the discount rates
used by the public sector when evaluating the feasibility of public investments. The dis-
count rates should reflect the cost of financing and the perceived riskiness of the invest-
ment. As the price of government lending is currently at a historical low in most EU
Member States, this suggests that the implied discount rates should be reduced compared
to say 5-10 years ago. An additional argument has been put forward; that energy efficien-
cy investments can be considered as a hedging tool against volatile fuel prices, which is by
far the most important risk in an energy project.42 This implies that such investments
should be evaluated by a different metric, and with a lower discount rate, than e.g. infra-
structure projects with the same perceived risk.
2.3 Barriers from market failure
There is a vast amount of studies supporting market failures as a brake on profitable en-
ergy efficiency investments. This suggests that market failures constitute a real problem.
Some caution is needed however. Several of the studies do not always factor in all the
total costs of energy savings projects into the cost-benefit calculation, such as e.g. scare
management time. Moreover, measures to evaluate ex ante gains from energy saving pro-
jects have also in certain cases been shown to be too optimistic. Our bottom line from this
39 Institute for building efficiency (2011a), p. 5 40 Rambøll (2010) 41 IPCC (2007), p. 420, and Institute for building efficiency (2011a), p. 6 42 IEA (2008), p. 38

Multiple benefits of investing in energy
efficient renovation of buildings
35
review is that viable energy renovation projects in buildings is not getting done primarily
due to regulatory barriers with market failures compounding this problem.
We identify at least four different market failure barriers that may compound the prob-
lem:
Handling project risks and acquiring financing
Several barriers have been identified with respect to financing and undertaking specific
energy efficiency renovation projects. One barrier has to do with acquiring finance for a
particular investment. As the investment is expected to be profitable, financing should per
se not be a problem. However, traditional lenders such as banks are typically not used to
assessing the risk of energy efficiency investments, and may thus be reluctant to provide
financing. In addition, energy efficiency projects are often perceived as risky, as actual
energy savings can be difficult to forecast.43 Conversely, expected returns on investment
are typically quite high. This risk profile is less suitable for commercial banks and more
suitable for e.g. hedge funds. However, as individual projects are often too small to be
meaningful for these investors, they may be reluctant to get involved. Examples suggest
that if the public sector engage in risk sharing arrangements and/or back private financ-
ing arrangements, the public sectors’ contribution can be leveraged significantly, cf. Box
2.
Box 2 Leveraging public money In Germany, the federal government makes budget funds available to the KfW Bank-
engruppe, a promotional bank of the German Republic and the federal states, under a
building rehabilitation programme. This programme provides builders with reduced-
interest loans or investment bonuses with which they can build or convert their houses
or flats into energy-efficient homes. In 2010, €1.4 billion was made available to KfW.
This injection spurred promotional loans from the KfW of €8.9 billion, which in turn ini-
tiated investments worth of €21.5 billion. That is, for every €1 billion the government
injected to the programme, investments worth €15 billion were initiated.
Estimates suggest that these investments have created or safeguarded 340,000 jobs
and given rise to additional contributions and taxes worth of €5.4 billion.
A similar example can be illustrated by the Sustainable Energy Authority of Ireland
(SEAI). In the Irish Home Energy Saving (HES) scheme, the SEAI spent app. €63 mil-
lion over 2-3 years, which spurred private investments for an additional amount of
almost €110 million.
Source: KfW Bankengruppe (2011a) and SEAI (2011)
In order to bridge this gap, firms such as the Energy Service Companies (ESCOs) are
starting to grow. These companies are specialised in providing different services related to
energy efficiency investments such as identification of possible savings, recommending
measures, designing and installing measures, training of staff etc.44 Importantly, ESCOs
also offer Energy Performance Contracts (EPC) which stipulates that the ESCO will cover
43 Early studies have shown that utility-sponsored programmes achieve only 50-80 per cent of predicted savings, even though
there is evidence that utilities have improved their abilities to predict savings. See e.g. NBER (2009) 44 UNDP (2010) and IPCC (2007), p. 428.

Multiple benefits of investing in energy
efficient renovation of buildings
36
all or a share of the initial investment cost in return for the achieved energy savings going
forward. The ESCOs thus have the potential to overcome the public regulation barriers
where municipalities cannot borrow to finance investments, by taking on the entire up-
front investment cost. Such EPC contracts are a significant step in the right direction, but
are inherently difficult to monitor. Designing an EPC so the risk is distributed properly
and the behaviour/outcome of the users is a difficult task. In addition, as ESCOs are still
relatively unproven companies with significant credit risk, it may be difficult to obtain
sufficient finance without straining their balance sheets. In Korea, e.g. ESCOs have an
average debt load of 378 per cent compared with 160 per cent for manufacturing compa-
nies.45
45 UNDP (2010), p. 44

Multiple benefits of investing in energy
efficient renovation of buildings
37
Box 3 ESCO partnerships in Europe
The most common ESCO in Europe is an independent company specialising in provid-
ing services such as energy analysis and audits, project design and implementation
and monitoring and evaluation of savings to name just a few. While 62 per cent of Eu-
ropean ESCOs define themselves in this category, 17 per cent are Energy utility or
supply companies, and about 16 per cent are public sector agencies or public-private
joint ventures. Almost all companies provide financing services, 89 per cent offer
guarantee of performance meaning that they are prepared to accept part of the tech-
nical and financial risk, and about 58 per cent offer insurance coverage.
The vast majority of ESCO projects take place in either industry (50 per cent) or in the
public sector (38 per cent). The choice of applied technology is more diverse and
ranges from improved heating systems, heating ventilation and air conditioning to im-
proved lighting and industrial processes and combustion improvement. The length of
an ESCO partnership contract is typically 5-15 years.
Germany was one of the first movers, and is currently one of the most mature ESCO
markets in the EU. The focus has primarily been on public buildings in the commercial
sector with building “pools” of up to 100 separate buildings in order to minimize trans-
action costs. In 1995 Berlin launched an energy saving strategy, and by an ESCO
partnership managed to reduce the annual energy cost bill by almost €3 billion and to
reduce CO2 emissions by 25 per cent.
In Nyköping in Sweden, an ESCO offered a contract covering 123 of the municipality’s
buildings totalling an area of 257,000 m2. The improvements included the installation
of a Building Management System in all buildings to monitor energy consumption, new
heat pumps and solar panels, including sensor controlled lighting and heating/cooling.
The project resulted in a reduction of 21 per cent in the municipality’s energy bill.
The Royal Gwent Hospital in UK engaged an ESCO to renovate old infrastructure and
ensure energy savings. The project introduced more effective energy and heating sys-
tems, a lighting retrofit and water conservation measures. The project has resulted in
annual savings of at least €620,000.
Source: DG JRC (2005) and www.EU-esco.org
Energy costs are a small share of overall costs
While the total value of energy savings at macro level might be substantial, energy costs
account typically for a small part of overall costs for business and to a less extent house-
holds.46 One study has found that the energy costs in commercial building in high cost city
centres like London account for just 1-2 per cent of total costs.47 Partly for the same rea-
son, energy cost management is typically not centralised within a single unit that holds
responsibility for the overall energy bill. Instead, energy cost management may be shared
across different departments within firms and institutions. This gives little incentive to
invest resources into reducing the energy bill, especially as these projects involve transac-
tion costs of gathering information, inconvenience of installing new equipment etc.
46 For some households, especially low-income households, energy costs may be a substantial share of total costs. 47 European Commission (2012), citing Guertler, Pett and Kaplan (2005)

Multiple benefits of investing in energy
efficient renovation of buildings
38
Externalities
The costs of adverse effects on health and worker productivity from buildings with out-
dated energy efficiency management will often be born not by the owner of the building
but potentially the society at large. This is certainly the case for reduced health from air
pollution linked to energy production both from electricity production and heating. These
costs to society are not included in the building-owner’s decision to invest in renovations.
Consequently, there will be invested too little in energy efficient renovation of buildings
from society’s point of view.
Households have too short term perspective
A number of studies suggest that some barriers are particularly predominant in the resi-
dential sector. One finding is that households tend to value present and short-term events
much higher than future events. In the economic literature this is known as having a high
implicit discount rate. This implies that households typically like to see early pay back on
investments, and may be reluctant to make too high up-front investments.48
One reason for this is that households are typically more risk averse than e.g. companies.
The actual realised energy savings will be uncertain, and households may be unwilling to
invest an amount of money which may make up a large share of the household budgets
and/or savings. In addition, households may not be sure that they will continue to live in
the same building for a sufficiently long period of time in order to reap enough of the ben-
efits from the investment to make it financially attractive.49 In addition, they may not ex-
pect to be able to fully capitalise the benefits into the property’s market value.
Energy efficient renovation of buildings – especially “deep renovations” – typically come
with a significant inconvenience cost for households. This includes costs of preparing a
project, obtaining permits and financing, finding contractors, supervising their work,
possibly moving out during the renovation etc.50 As these costs are contained in the up-
front investment costs, it is given high value in the households’ decision.
These inconvenience costs are typically compounded for multi-family homes. An issue
such as coordination may turn out to have large transaction costs. In addition, in multi-
family homes, the number of households that expect to find new homes within a foresee-
able future may be significant. These households may try to block otherwise profitable
renovations, as the up-front inconvenience costs outweigh the expected longer term bene-
fits from reduced energy costs. We expect such coordination problems to be greatest in
the Baltics and Italy, but also in several of the EU-12 countries as the share of multi-
family homes is especially high in these countries, cf. Figure 23.
48 Economic research has also suggested that households may have so called hyperbolic discount functions, meaning that they
will place a higher value on the near future than on the more distant future. See e.g. Frederick, Loewenstein and
O’Donoghue (2002). 49 In the UK e.g., households move every seven years on average. See UK government Energy Bill, Green Deal Impact Assess-
ment (2010) 50 European Commission (2012)

Multiple benefits of investing in energy
efficient renovation of buildings
39
Figure 23 Share of multi-family homes
Source: Copenhagen Economics based on Fraunhofer ISI et al. (2009), page 101.
2.4 Policy response Substantial evidence suggests that there exists a large and unfulfilled potential for in-
creasing profitable investments in energy efficient renovation of buildings. In addition,
much evidence suggests that there are significant barriers holding these profitable in-
vestments back. This calls for government action to spur demand for investments by
breaking these barriers. In several EU Member States, governments have tried to address
these barriers by establishing financial promotion activities, cf. Box 4.
0
10
20
30
40
50
60
70
80
pct.

Multiple benefits of investing in energy
efficient renovation of buildings
40
Box 4 Specific promotion activities for investments in energy
efficiency renovations Several countries have introduced activities to promote investments in energy efficien-
cy renovations in buildings.
The sustainable Energy Authority in Ireland (SEAI) has for the past number of years
been supporting households and businesses to shift to more sustainable energy use.
SEAI contributes with several issues including advice, mentoring, training and financial
support to a broad range of energy users. More than 4,000 registered service provid-
ers are associated with SEAI programmes. SEAI runs a programme for the residential
sector (Home Energy Saving - HES) and for small and medium enterprises (SME). The
HES scheme provides financial support to households for energy efficiency upgrades.
Since 2009, over 100,000 homes have been upgraded with a combination of improved
insulation, high efficiency boilers and heating controls through these schemes. The
scheme has been evaluated to deliver a net benefit of €5 to society for every €1 spent
on the programme. The SME programme is evaluated to be even more profitable, de-
livering a net benefit to society of €15-€33 for every €1 spent on the programme.
In Germany, the state bank KfW Bankengruppe is essential in channelling public and
private funding into energy efficiency investments. Germany currently refurbishes
around 200,000 buildings a year and has to date retrofitted 9 million units to high en-
ergy efficiency standard. Existing German homes use around three times more energy
for heating than new buildings. Energy efficiency investments in deep retrofits are es-
timated to have halved the energy use in the buildings treated by the KfW since 2002.
Germany has been particularly succesfull in leveraging its public investments by bring-
ing in additional private investments from e.g. institutional investors. From 2001-2006
the German Alliance for Work and Environment spent $5.2 billion public subsidies and
stimulate total investments of $20.9 billion in building retrofits. From 2006-2009, KfW
financing activities across various programmes deployed €27 billion in loans and
grants leading to total investments of €54 billion.
In Estonia, a Credit and Guarantee Fund – KredEx – was established in 2001 with the
purpose of improving the financing opportunities to a variety of measures, including
housing renovations and energy-saving measures in general. Apart from a general ob-
jective to improve the competitive strength of Estonian companies, a major pillar was
to improve the housing conditions of Estonian inhabitants, including developing an
“energy-saving way of thinking”. Some of the projects undertaken with KredEx are al-
so part of the broader Baltic Energy Efficiency Network.
Source: SEAI (2011), Climate & Strategy Partners, Financing Mechanisms for Europe’s Buildings Renovation,
and Kallaste (2009), KredEx, Energy Efficiency Competence Centre, Estonia.
In the current context of available capacity in the economy and stress on public budgets
due to the economic crisis, such energy savings projects are a particularly attractive op-
tion to increase economic activity, as a number of structural barriers are holding back
otherwise profitable investments. By addressing the most significant structural barriers,
these investments may help to boost the economy, while not reducing governments’ net
revenue. Conversely such initiatives may even create net revenue. This is a direct conse-
quence of the nature of the four key structural barriers that hold back energy savings in
buildings and the policies required to deal with them. We identify at least four:
Barrier 1: Rent regulation in both publicly and privately owned residential houses, and
to a certain extent commercial buildings, often prevents landlords from passing on the
Multiple benefits of investing in energy
efficient renovation of buildings
41
costs for improvement in the quality of the buildings, including a lower energy bill to ten-
ants. This greatly reduces the landlords’ incentive to invest in energy efficient renovation
of buildings. This is a problem as such investments would reduce the total housing bill for
the tenant.
Action: Modernise rent regulation to allow landlords and tenants to split the gains from
energy efficient renovation of buildings. This is largely without direct costs to public fi-
nances.51
Barrier 2: Budget management of publicly owned buildings tend to focus on shorter
term cash flows as opposed to longer term running costs. This punishes projects with
higher upfront costs as counterpart to lower future operating costs i.e. a lower energy bill.
In addition, the discount rates applied to assess public investments have not followed the
general current trend towards lower market rates.
Action: Reform budget management of publicly owned buildings to allow for a longer
term focus in investments and renovation of buildings. This will reduce longer term oper-
ating costs in the publicly owned building stock.
Barrier 3: The relatively widespread favourable tax treatment of heating and electricity
use in buildings reduces gains from otherwise viable energy savings projects.
Action: Remove/reduce such tax advantages to render energy efficient renovation of
buildings more attractive, and provide direct net revenue gains to public budgets.
Barrier 4: Handling of risk in renovation projects has traditionally been a weak point.
Investors may face high up-front costs, which implies that they run more substantial risks
than for a similar project with lower up-front costs. In this respect it is an important ques-
tion how you set up, monitor and evaluate performance contracts that ensure that the
owner/user of the building de facto gets the promised benefits required to pay back the
substantial and non-reversible investment cost over time. Concepts such as Energy Ser-
vice Companies (ESCO) and Energy Performance Contracts (EPC) which are explicitly
designed to align risks and responsibility for the outcome of such projects have not been
developed to deliver on deep renovation projects. In fact, there are examples of countries
not allowing the use of EPCs in the public sector
Action: Well-designed risk-sharing programmes can help government as well as private
building owners to realise cost savings with very limited budget costs.
51 As overall housing cost would be reduced, the public costs to e.g. social housing would also be reduced.

Multiple benefits of investing in energy
efficient renovation of buildings
42
References
Barnard, L. et al. (2011), ”The impact of retrofitted
insulation and new heaters on health services uti-
lisation and costs, pharmaceutical costs and mor-
tality: Evaluation of Warm Up New Zealand:
Heat Smart”.
Buildings Performance Institute Europe (BPIE)
(2011), “Europe’s buildings under the micro-
scope”.
Climate and Strategy partners, Financing Mecha-
nisms for Europe’s Building Renovations
Copenhagen Economics (2008), “Reduced VAT on
environmentally friendly products”, a study for
the European Commission (TAXUD)
Copenhagen Economics (2011), “Promoting co-
operation mechanisms to reach RES targets”, a
study for RECS International.
Copenhagen Economics (forthcoming), “Efficient
strategies to support renewable energy”, a study
for the Nordic Council of Ministers.
DG ECFIN (2012), “Fiscal multipliers and public
debt dynamics in consolidations”.
DG Energy (2010), “EU energy trends in 2030”. Up-
date 2009.
DG Energy (2012), “EU energy in figures”.
DG JRC (2005), “Energy Service Companies in Eu-
rope”
DG TAXUD (2012), “VAT rates applied in the Mem-
ber States of the European Union”.
DG Transport (2008), Handbook of transportation
cost
English Housing Condition Survey (2007), “
English Housing Condition Survey (2008), “

Multiple benefits of investing in energy
efficient renovation of buildings
43
European Commission (2010), Commission Staff
Working Document SEC (2010) 650 of 26 May
2010, Analysis of options to move beyond 20%
greenhouse gas emission reductions and as-
sessing the risk of carbon leakage, Background
information and analysis, Part II.
European Commission (2012), ”Financial support for
energy efficiency in buildings”. Consultation pa-
per.
Frederick, Loewenstein, and O’Donoghue (2002), “
Fraunhofer ISI et al. (2009), “Study on the energy
savings potentials in EU member states, candi-
date countries and EEA countries”. Final report
for the European Commission Directorate-
General Energy and Transport.
Greening et al (2000), “Energy efficiency and con-
sumption – the rebound effect – a survey”
Guertler, Pett & Kaplan (2005), “Valuing low energy
offices”.
IEA (2008), “Promoting energy efficiency invest-
ments”.
IEA (2011a), “Evaluating the co-benefits of low-
income energy efficiency programmes”. Work-
shop report.
IEA (2012), “Spreading the net: The multiple bene-
fits of energy efficiency improvements”.
OECD/IEA.
Institute for Building Efficiency (2011a), “EU public-
sector experiences with building efficiency”.
IPCC (2007), “Residential and commercial build-
ings”. In: Climate change 2007: Mitigation. Con-
tribution of Working Group III to the Fourth As-
sessment Report of the Intergovernmental Panel
on Climate Change.
KfW Bankengruppe (2011), “KfW programmes Ener-
gy-efficient Construction and Refurbishment:
public budgets benefit up to fivefold from “pro-
motional euros”. Press release on Jülich (2011),
“Investments in energy efficient construction and
refurbishment”.

Multiple benefits of investing in energy
efficient renovation of buildings
44
Liddell, C., Morris, C. & Lagdon, S. (2011), “Kirklees
Warm Zone: The project and its impacts on well-
being”.
McKinsey & Company (2010), “Impact of the finan-
cial crisis on carbon economics”.
McKinsey Global Institute (2011), “McKinsey Sus-
tainability & Resource Productivity Practice”.
McKinsey Global Institute (2011), “Resource Revolu-
tion: Meeting the world’s energy materials, food,
and water needs”.
NBER (2009), “Energy Efficiency Economics and
Policy”
OCED (2001), “Standard Shocks in the OECD Inter-
link Model”
OECD (2011a). “Housing markets and structural pol-
icies in OECD countries”. OECD Economics De-
partment working paper no. 836.
OECD (2011b), “A Welfare Analysis of Climate
Change Mitigation Policies”, OECD Economics
Department Working Papers no. 908.
OECD (2011c), Inventory of estimated budgetary
support and tax expenditure for fossil fuels.
Pöyry (2008), “Enhancing economic efficiency –
Benefits of trade”.
Rambøll (2010) ”Konsekvensanalyse af kommunalt
bygningsvedligehold”
REHVA (2006), “Indoor Climate and Productivity in
Offices”
SEAI (2011), “Economic analysis of residential and
small-business energy efficiency improvements”.
Slotsholm (2012), “Socio-economic consequences of
better air quality in primary schools”
Sorrell, S. (2004), “Understanding barriers to energy
efficiency”. In: “The economics of energy efficien-
cy”.
Stern Review (2007), “The Economics of Climate
Change”,
Sweatman, P., & Managan, K. (2010), “Financing en-
ergy efficiency buildings retrofits: International

Multiple benefits of investing in energy
efficient renovation of buildings
45
policy and business model review and regulatory
alternatives for Spain”.
Sweatman, P. (n.d.), “Financing mechanisms for Eu-
rope’s buildings renovation”.
Threlfall, A. (2011), “Understanding the costs and
benefits of fuel poverty interventions: A pragmat-
ic economic evaluation from Greater Manches-
ter”. Greater Manchester Public Health Practice
Unit.
UNDP (2010), “Promoting energy efficiency in build-
ings: Lessons learned from international experi-
ence”.
United Technologies Corporation (2011), “The busi-
ness case for building efficiency”.
UK Department of Energy and Climate Change, En-
ergy Act (2011)
UK Department of Energy and Climate Change
(2011), “What measures does the Green Deal cov-
er”
UK Department of Health (2010)
UK Government Energy Bill (2010), “Green Deal
Impact Assessment”
Ürge-Vorsatz, D., et al. (2010), ”Employment im-
pacts of large-scale deep building energy retrofit
programme in Hungary”. Technical summary.