
Multiphysics Coupling in Lithium-Ion Batteries with ... · (2) The thermal models verified by in...
11
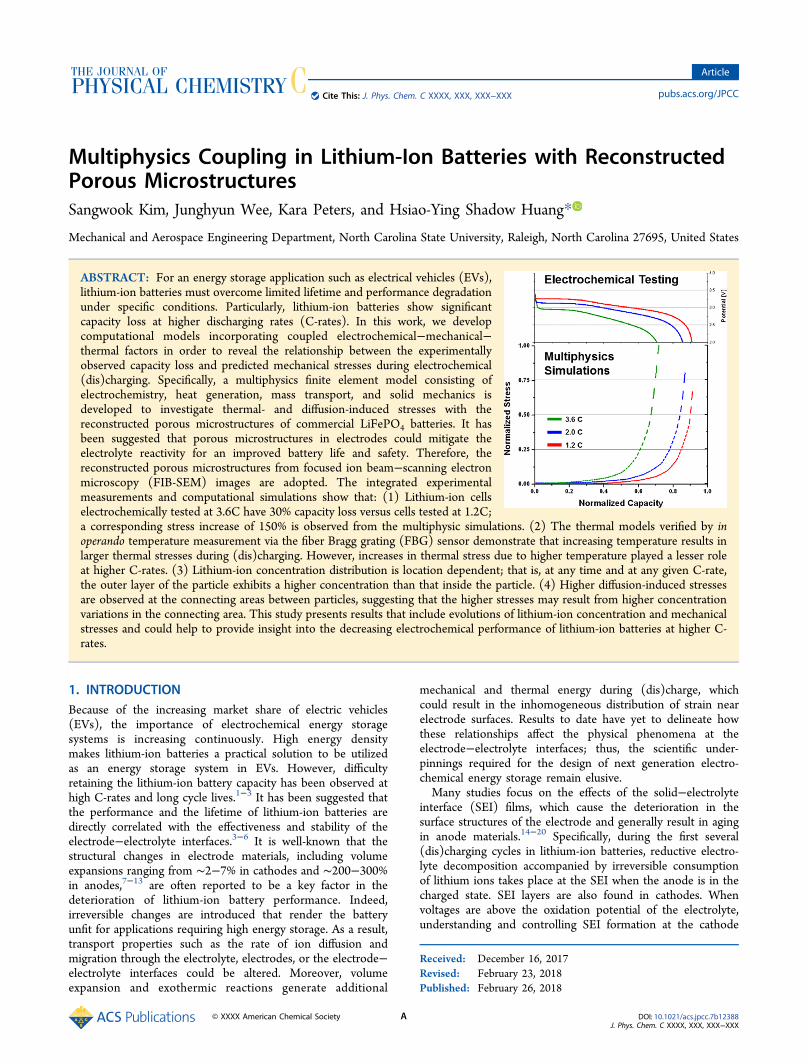
Multiphysics Coupling in Lithium-Ion Batteries with Reconstructed Porous Microstructures Sangwook Kim, Junghyun Wee, Kara Peters, and Hsiao-Ying Shadow Huang* Mechanical and Aerospace Engineering Department, North Carolina State University, Raleigh, North Carolina 27695, United States ABSTRACT: For an energy storage application such as electrical vehicles (EVs), lithium-ion batteries must overcome limited lifetime and performance degradation under specific conditions. Particularly, lithium-ion batteries show significant capacity loss at higher discharging rates (C-rates). In this work, we develop computational models incorporating coupled electrochemical−mechanical− thermal factors in order to reveal the relationship between the experimentally observed capacity loss and predicted mechanical stresses during electrochemical (dis)charging. Specifically, a multiphysics finite element model consisting of electrochemistry, heat generation, mass transport, and solid mechanics is developed to investigate thermal- and diffusion-induced stresses with the reconstructed porous microstructures of commercial LiFePO 4 batteries. It has been suggested that porous microstructures in electrodes could mitigate the electrolyte reactivity for an improved battery life and safety. Therefore, the reconstructed porous microstructures from focused ion beam−scanning electron microscopy (FIB-SEM) images are adopted. The integrated experimental measurements and computational simulations show that: (1) Lithium-ion cells electrochemically tested at 3.6C have 30% capacity loss versus cells tested at 1.2C; a corresponding stress increase of 150% is observed from the multiphysic simulations. (2) The thermal models verified by in operando temperature measurement via the fiber Bragg grating (FBG) sensor demonstrate that increasing temperature results in larger thermal stresses during (dis)charging. However, increases in thermal stress due to higher temperature played a lesser role at higher C-rates. (3) Lithium-ion concentration distribution is location dependent; that is, at any time and at any given C-rate, the outer layer of the particle exhibits a higher concentration than that inside the particle. (4) Higher diffusion-induced stresses are observed at the connecting areas between particles, suggesting that the higher stresses may result from higher concentration variations in the connecting area. This study presents results that include evolutions of lithium-ion concentration and mechanical stresses and could help to provide insight into the decreasing electrochemical performance of lithium-ion batteries at higher C- rates. 1. INTRODUCTION Because of the increasing market share of electric vehicles (EVs), the importance of electrochemical energy storage systems is increasing continuously. High energy density makes lithium-ion batteries a practical solution to be utilized as an energy storage system in EVs. However, difficulty retaining the lithium-ion battery capacity has been observed at high C-rates and long cycle lives. 1−3 It has been suggested that the performance and the lifetime of lithium-ion batteries are directly correlated with the effectiveness and stability of the electrode−electrolyte interfaces. 3−6 It is well-known that the structural changes in electrode materials, including volume expansions ranging from ∼2−7% in cathodes and ∼200−300% in anodes, 7−13 are often reported to be a key factor in the deterioration of lithium-ion battery performance. Indeed, irreversible changes are introduced that render the battery unfit for applications requiring high energy storage. As a result, transport properties such as the rate of ion diffusion and migration through the electrolyte, electrodes, or the electrode− electrolyte interfaces could be altered. Moreover, volume expansion and exothermic reactions generate additional mechanical and thermal energy during (dis)charge, which could result in the inhomogeneous distribution of strain near electrode surfaces. Results to date have yet to delineate how these relationships affect the physical phenomena at the electrode−electrolyte interfaces; thus, the scientific under- pinnings required for the design of next generation electro- chemical energy storage remain elusive. Many studies focus on the effects of the solid−electrolyte interface (SEI) films, which cause the deterioration in the surface structures of the electrode and generally result in aging in anode materials. 14−20 Specifically, during the first several (dis)charging cycles in lithium-ion batteries, reductive electro- lyte decomposition accompanied by irreversible consumption of lithium ions takes place at the SEI when the anode is in the charged state. SEI layers are also found in cathodes. When voltages are above the oxidation potential of the electrolyte, understanding and controlling SEI formation at the cathode Received: December 16, 2017 Revised: February 23, 2018 Published: February 26, 2018 Article pubs.acs.org/JPCC Cite This: J. Phys. Chem. C XXXX, XXX, XXX-XXX © XXXX American Chemical Society A DOI: 10.1021/acs.jpcc.7b12388 J. Phys. Chem. C XXXX, XXX, XXX−XXX
Transcript of Multiphysics Coupling in Lithium-Ion Batteries with ... · (2) The thermal models verified by in...
Multiphysics Coupling in Lithium-Ion Batteries with ReconstructedPorous MicrostructuresSangwook Kim, Junghyun Wee, Kara Peters, and Hsiao-Ying Shadow Huang*
Mechanical and Aerospace Engineering Department, North Carolina State University, Raleigh, North Carolina 27695, United States
ABSTRACT: For an energy storage application such as electrical vehicles (EVs),lithium-ion batteries must overcome limited lifetime and performance degradationunder specific conditions. Particularly, lithium-ion batteries show significantcapacity loss at higher discharging rates (C-rates). In this work, we developcomputational models incorporating coupled electrochemical−mechanical−thermal factors in order to reveal the relationship between the experimentallyobserved capacity loss and predicted mechanical stresses during electrochemical(dis)charging. Specifically, a multiphysics finite element model consisting ofelectrochemistry, heat generation, mass transport, and solid mechanics isdeveloped to investigate thermal- and diffusion-induced stresses with thereconstructed porous microstructures of commercial LiFePO4 batteries. It hasbeen suggested that porous microstructures in electrodes could mitigate theelectrolyte reactivity for an improved battery life and safety. Therefore, thereconstructed porous microstructures from focused ion beam−scanning electronmicroscopy (FIB-SEM) images are adopted. The integrated experimentalmeasurements and computational simulations show that: (1) Lithium-ion cellselectrochemically tested at 3.6C have 30% capacity loss versus cells tested at 1.2C;a corresponding stress increase of 150% is observed from the multiphysic simulations. (2) The thermal models verified by inoperando temperature measurement via the fiber Bragg grating (FBG) sensor demonstrate that increasing temperature results inlarger thermal stresses during (dis)charging. However, increases in thermal stress due to higher temperature played a lesser roleat higher C-rates. (3) Lithium-ion concentration distribution is location dependent; that is, at any time and at any given C-rate,the outer layer of the particle exhibits a higher concentration than that inside the particle. (4) Higher diffusion-induced stressesare observed at the connecting areas between particles, suggesting that the higher stresses may result from higher concentrationvariations in the connecting area. This study presents results that include evolutions of lithium-ion concentration and mechanicalstresses and could help to provide insight into the decreasing electrochemical performance of lithium-ion batteries at higher C-rates.
1. INTRODUCTIONBecause of the increasing market share of electric vehicles(EVs), the importance of electrochemical energy storagesystems is increasing continuously. High energy densitymakes lithium-ion batteries a practical solution to be utilizedas an energy storage system in EVs. However, difficultyretaining the lithium-ion battery capacity has been observed athigh C-rates and long cycle lives.1−3 It has been suggested thatthe performance and the lifetime of lithium-ion batteries aredirectly correlated with the effectiveness and stability of theelectrode−electrolyte interfaces.3−6 It is well-known that thestructural changes in electrode materials, including volumeexpansions ranging from ∼2−7% in cathodes and ∼200−300%in anodes,7−13 are often reported to be a key factor in thedeterioration of lithium-ion battery performance. Indeed,irreversible changes are introduced that render the batteryunfit for applications requiring high energy storage. As a result,transport properties such as the rate of ion diffusion andmigration through the electrolyte, electrodes, or the electrode−electrolyte interfaces could be altered. Moreover, volumeexpansion and exothermic reactions generate additional
mechanical and thermal energy during (dis)charge, whichcould result in the inhomogeneous distribution of strain nearelectrode surfaces. Results to date have yet to delineate howthese relationships affect the physical phenomena at theelectrode−electrolyte interfaces; thus, the scientific under-pinnings required for the design of next generation electro-chemical energy storage remain elusive.Many studies focus on the effects of the solid−electrolyte
interface (SEI) films, which cause the deterioration in thesurface structures of the electrode and generally result in agingin anode materials.14−20 Specifically, during the first several(dis)charging cycles in lithium-ion batteries, reductive electro-lyte decomposition accompanied by irreversible consumptionof lithium ions takes place at the SEI when the anode is in thecharged state. SEI layers are also found in cathodes. Whenvoltages are above the oxidation potential of the electrolyte,understanding and controlling SEI formation at the cathode
Received: December 16, 2017Revised: February 23, 2018Published: February 26, 2018
Article
pubs.acs.org/JPCCCite This: J. Phys. Chem. C XXXX, XXX, XXX−XXX
© XXXX American Chemical Society A DOI: 10.1021/acs.jpcc.7b12388J. Phys. Chem. C XXXX, XXX, XXX−XXX

become very important. Across the range of SEI studies,chemical engineers, material scientists, and electrochemistshave reported their findings on (electro)chemical reactions,material stability, and the associated kinetics. Yet, afundamental understanding of the relationships between chargeand mass transport properties, structural changes, and thermaland mechanical stresses at the electrode−electrolyte interface isstill lacking. For example, Aurbach et al.6,21 have studied theeffects of acidic and nonacidic electrolytes on carbon-coatedLiFePO4 cathodes during storage period by measuring Fe iondissolution (the chemical reaction of rusting). Fe iondissolution represents the loss of the active mass from theelectrode, indicating that the cathode is deteriorated. Asexpected, higher temperature leads to more dissolution of Feions. The study showed that the electrolyte becomes moreacidic at higher temperature, and the dissolution of Fe ionsbecomes pronounced, causing unstable behavior in theelectrode.6,21 These observations suggest that temperature-related chemical reactions in cathodes appear to be importantdeterminants of the charge transport property and structuralresponses at the cathode−electrolyte interface.Studies have shown that lithium-ion battery performance is
highly dependent on temperature. Once the temperature of alithium-ion cell at full charge exceeds a predetermined set point,the possibility of a thermal runaway becomes a seriousconcern.22,23 Liu et al.24 developed framework modelsincorporating mechanical effects, short-circuit, thermal run-away, and thermal submodels in batteries and demonstratedtemperature rising behavior during abusive conditions. Xu’sresearch group continues moving forward on better under-standing interactions between these factors.25,26 To measuretemperature variation due to heat generation in the lithium-ionbattery, several methods such as thermocouples,27−30 infraredimages,30,31 and gold-resistance temperature detectors32 havebeen used. However, the aforementioned methods are not ableto measure the temperature inside of the battery (i.e., thecathode layer surrounded by electrolyte). Thus, fiber Bragggrating (FBG) is an attractive sensor for the temperaturemeasurement due to its immunity against electromagneticinterference and the surrounding electrolyte. Specifically, FBGis a narrow band wavelength filter inscribed in an optical fiber.It can measure mechanical strain and temperature based on thereflected wavelength shifts due to applied strain and temper-ature.33 Meyer et al.34 verified the accuracy of FBG sensors fortemperature measurement by comparing to a thermistormeasurement. Moreover, Novais et al.35 successfully measuredthe external and internal temperatures in lithium-ion batteriesby using FBG sensors.It has been suggested that heat generation could initiate
electrolyte ignition, resulting in thermal runaway andexplosion.27 This is strongly related to electrochemical andmechanical degradation of battery materials. Computationalthermal analysis in lithium-ion batteries has been studied bymany groups to relate the degradation in lithium-ion batterieswith excessive temperature rise under high C-rate. Zhang etal.36 investigated heat generation and intercalated-inducedstresses in LiMn2O4 single particles and concluded that thosetwo factors are coupled to each other and should be consideredsimultaneously. The computational model developed by Wu etal.37 also demonstrates that intercalation and thermal expansionoccur in both electrode and electrolyte concurrently and arenot a simple summation. The same research group, as well asXiao et al.38 and Wu et al.,39 reported that the thermal stress is
comparable to or even higher than the diffusion-induced stressin the separator. Furthermore, Yan et al.40 investigated heatgeneration in a reconstructed LiCoO2 instead of simple core−shell particles. To further understand diffusion-induced stressesin lithium-ion batteries, current state-of-the-art on thecomputational modeling is moving toward reconstructedgeometries of electrodes.Early stage researches had used simple geometries such as
spheres, spheroids, cylinders, and discs in Newman’s pseudo-2D model to analyze diffusion-induced stresses in cathodematerials36,38,41,42 while recognizing that stress developmenthas a major impact on the performance of lithium-ionbatteries.43 However, there were still limitations when simplegeometries were used because they failed to predict thephenomena relating to the inhomogeneous natures of theelectrode microstructures.44 To overcome the limitations ofusing a simple geometry, realistic microstructures reconstructedbased on X-ray nanoscale computer tomography (CT)40,44,45
and focused ion beam−scanning electron microscopy (FIB-SEM)46−52 have gained significant attention. Specifically,LiCoO2 current density, overpotential intercalation rate,40
electrostatic potential,46 and microstructural parameters48
have been investigated with microstructure geometry. Enderet al.48 demonstrate significant parameters including particlesize, active surface area, and tortuosity of LiFePO4 with FIB/SEM. Furthermore, lithium concentration distribution inLiFePO4 electrodes was investigated by Kashkooli et al.44 Anincreasing number of researchers have used microstructuregeometry for stress analysis. Song et al.52 tried to explainparticle fragmentation in Li(Li0.2Mn0.54Ni0.13Co0.13)O2(LLMNC) using the predicted stress based on a simplemathematical model with microstructure geometry. Moreover,Wu et al.45 investigated mechanics in nickel−manganese−cobalt (NMC), showing that concave and convex regions ofstress concentration are crucial. However, the effects ofelectrolyte in mechanical and thermal stress were notconsidered in these studies.In this paper, we developed a multiphysic computational
model based on the reconstructed microstructure of LiFePO4obtained by FIB-SEM, and we studied the relationshipsbetween temperature, volume change, thermal stresses, anddiffusion-induced stresses to address their coupling effects onthe electrochemical performance in lithium-ion batteries.Therefore, the goal of this study is to integrate experimentaland computational approaches which consider charge/masstransport properties, structural changes, and thermal andmechanical stresses at the electrode−electrolyte interfaces tounderstand the relationships between the capacity loss over arange of charging rates (i.e., C-rate), temperature, and lithium-ion concentration.
2. METHODS2.1. Electrochemical Testing. Rate capability electro-
chemical testing on 14 430 lithium-ion cells (400 mAh; BatterySpace, Richmond, CA) was performed via a 273A potentiostat/galvanostat (EG&G Princeton Applied Research, Oak Ridge,TN) at four different discharging rates (0.6C, 1.2C, 2.0C, and3.6C). 0.6C charging rate was used between each discharging,whereas the potential was set between 2.0 and 4.0 V. A dataacquisition board 6052E and LabVIEW Robotics 2013(National Instruments, Austin, TX) were used to communicatebetween the potentiostat and the computer to obtain thecapacity fade of the battery cells. During the electrochemical
The Journal of Physical Chemistry C Article
DOI: 10.1021/acs.jpcc.7b12388J. Phys. Chem. C XXXX, XXX, XXX−XXX
B

testing, the total (dis)charging time was also recorded. Toensure the temperature was recovered to the ambienttemperature (20 °C) during discharging and charging, anadequate resting time over 30 min was included after eachelectrochemical (dis)charging cycle.2.2. Temperature Measurement by Fiber Bragg
Grating (FBG) Sensor. A fiber Bragg grating (FBG) sensorwas used for the in operando measurements of strain andtemperature variations at the electrode−electrolyte interfaceduring the electrochemical testing. The FBG sensor has 1 cmgrating length with 15 μm thick polyimide coating (MicrometerOptics. Inc., Atlanta, GA). The sensor was connected to anoptical interrogator (Micrometer Optics. Inc., Atlanta, GA) totrack the peak wavelength shift as a function of the temperaturewith the precision of ±1 pm. The sampling rate was 1 sample/s,which was sufficient for the measurement of quasi-statictemperature change. Layers encapsulating the cathode andanode in a commercial LiFePO4 battery, such as heat shrinkwrap and outer aluminum can, were removed to measure thetemperature inside the cell. The FBG sensor for the
temperature measurement was mechanically decoupled fromthe cathode surface but was placed on the surface of thecathode in order to ensure accurate and concurrent temper-ature measurement along with the mechanical strains.34
Moreover, the battery and FBG sensor were sealed inside astyrofoam box to minimize convective heat transfer (Figure1a,b). The wavelength shift of the FBG with respect to thetemperature change is expressed with the following equation:33
λ λ α ςΔ = + ΔT( )B s (1)
where λB is the Bragg wavelength, ΔT is the temperaturechange, αs is the thermal expansion coefficient of silica, and ς isthe thermo-optic coefficient of silica. For the fused-silica opticalfiber, the sum of the two coefficients is αs + ς = 6.67 × 10⁻⁶
°C−1.33 Note that all temperature changes were measured withrespect to the ambient temperature (20 °C).
2.3. Reconstructed Electrode Microstructure by FIB/SEM. To generate reconstructed electrode microstructures,separate sets of uncycled commercial lithium-ion batteries(LiFePO4, 14 430 cells) were disassembled in an argon-filled
Figure 1. (a) Representative diagram of in operando temperature measurement by FBG sensors at the electrode−electrolyte interface duringelectrochemical testing. The battery and FBG sensors were located inside a styrofoam box to minimize convective heat transfer. (b) To betterunderstand temperature effects on electrochemical and mechanical battery material degradation, our pilot study has demonstrated that anaxisymmetric heat transfer mechanism could be used for computational simulations. (c) Greater temperature change due to higher Joule heating athigher C-rate was observed. It was observed that at the beginning and the end of the discharging process the temperature gradient was higher thanthat of the plateau region during discharging for all measured and simulation cells.
Figure 2. (a) SEM image of LiFePO4 sample during FIB micromilling under high vacuum (e.g., 10−6 Pa). Platinum was first deposited on the surfaceof LiFePO4 to prevent the curtaining effect. (b) Original SEM image of 1.5 × 1.5 μm2 with higher magnification (>15000×) and image after imageprocessing were overlapping (white line indicated particle boundary after image processing). (c) An image was converted into a dxf file format forcomputational simulation. (d) A representative concentration distribution of the reconstructed porous microstructures of LiFePO4 (50% state ofcharge at 1.2C).
The Journal of Physical Chemistry C Article
DOI: 10.1021/acs.jpcc.7b12388J. Phys. Chem. C XXXX, XXX, XXX−XXX
C

glovebox (Precise Controlled Atmosphere Glove Box,Labconco, Kansas City, MO). N-Methyl-2-pyrrolidone(NMP) was used to clean the surface of LiFePO4 samples forthe focused ion beam−scanning electron microscope (FIB-SEM). In this study, FEI Quanta 3D FEG (FIB-SEM) at theNC State Analytical Instrument Facility (AIF) was used formicromilling with FIB and taking SEM images at differentangles (i.e., 54° in this facility) with high resolution (Figure 2a).Platinum was first deposited on the surface of LiFePO4 toprevent the curtaining effect, which could increase surfaceroughness in the direction of the milling depth and result instripes on the cutting surface, and eventually the roughness ofthe cut could influence the measurements and the segmenta-tion process. To focus on the region of interest (ROI), eachside of the ROI was milled by FIB. For more detailed particleconfiguration, a sector of 1.5 × 1.5 μm2 with highermagnification (>15000×) was used (Figure 2b). The pixelsize of the scanning electron microscopy (SEM) images was8.28 nm. The image processing, including smooth processing,edge finding processing, and threshold determination, wasconducted using ImageJ image analysis software (NationalInstitutes of Health, Bethesda, MD). Because of the highmagnification, it was relatively difficult to distinguish the
boundary between the cathode and electrolyte; therefore,smooth processing was necessary to obtain better binary imagesbefore using the “find-edge plugin” in ImageJ. After identifyingthe boundary with the aforementioned plugin, the image ofLiFePO4 reconstructed microstructure was converted to abinary image using the “threshold plugin” in ImageJ. To importthe 2D configuration into the finite element software, a specificfile formatthe dxf file (commonly used in AutoCAD)wasrequired. In this work, ReaConverter 7 (Realsoft Inc.,Monmouth Junction, NJ) was then used to convert theLiFePO4 microstructure from the binary image to a dxf file, asshown in Figure 2c.
2.4. Multiphysic Computational Model. The recon-structed LiFePO4 microstructure was used to develop multi-physic finite element models of a half-cell system (i.e., withelectrolyte and cathode) via COMSOL Multiphysics (COM-SOL, Inc., Burlington, MA), in which electrochemical reactions,charge/mass transport, heat conduction, and solid mechanicswere included. The parameters used in multiphysic computa-tional model are tabulated in Table 1. The outline of ourmultiscale model and experiment in this research is presentedin Figure 3, where we detailed our integrated electrochemistry,thermal, and mechanical analysis by incorporating galvanostat
Table 1. List of Model Parameters44,60−64
anode separator cathode unit
thickness (δ) 55 33 55 μmelectrical conductivity (σs) 1 × 10⁴ 3.5 × 10⁻⁵ s/cmionic conductivity (σl) 10.7 s/cmmaximum solid phase concentration (Cs,max) 3.108× 10⁴ 2.28 × 10⁴ mol/m3
charge transfer coefficient (αa, αc) 0.5 0.5transport number (t+) 0.343diffusion coefficient (D) 3.2 × 10⁻¹⁰ 2.6 × 10⁻⁶ 1.3 × 10⁻⁹ cm2/sreaction rate constants (ka, kc) 1.764 × 10⁻¹¹ 2.5 × 10⁻¹³ m2.5 mol−0.5/s
Figure 3. Outline of this research. First of all, electrochemistry analysis has been done in a 1D model, composed of negative electrode, electrolyte,and positive electrode. In the 1D analysis, local current density and potential changes according to time in the positive electrode were computed. Thecomputed results were compared with data from experimental measurements to verify the 1D electrochemical model. This procedure hascontinuously repeated until the model was verified. Moreover, heat generation was computed in the 1D model, and it transferred to the 2D-axissymmetry model for thermal analysis. Based on the computed heat generation, the temperature distribution in the cylindrical cell was calculated.Since the temperature on the surface of cylindrical cell was measured by FBG sensor, simulated temperature on the outer layer was compared withexperimental results to verify the thermal analysis. Verified local current density and temperature were used in 2D microstructure model. Localcurrent density was major boundary conditions for concentration distribution in electrode particles. After calculating the concentration distributionin the electrode, diffusion-induced stresses were computed. Furthermore, thermal stress was computed based on the temperature boundaryconditions. Compared to the electrode particle sizes, the thermal conductivity was relatively high; thus, a nearly constant temperature distributionwas observed.
The Journal of Physical Chemistry C Article
DOI: 10.1021/acs.jpcc.7b12388J. Phys. Chem. C XXXX, XXX, XXX−XXX
D

for current density measurements, FIB/SEM to generateporous microstructure, and FBG sensors to conduct temper-ature measurements.2.4.1. Electrochemistry. We developed the 1D model,
composed of anode, separator, and cathode, to investigate thephysical behavior of the electrolyte−electrode interface in theBatteries and Fuel Cells Module of COMSOL Multiphysics.53
Specifically, the conservation of the current density in theelectrolyte was incorporated by the following equation:
∇· =i 0l (2)
where il is the current density in the electrolyte, which satisfiesthe following kinetic equation:
σ ϕσ
= − ∇ + +∂∂
− ∇+
⎛⎝⎜
⎞⎠⎟i
RTF
fc
t c2
1lnln
(1 ) lnl l ll
ll
(3)
where σl denotes the ionic conductivity in electrolyte, ϕl is theelectric potential in the electrolyte, R is the gas constant, T is
temperature, F is the Faraday constant (96 485 C/mol), ∂∂
fc
lnln l
is
activity dependence (assumed to be 1), and t+ is the transportnumber. The molar flux vector of lithium ions (Jl) wascalculated based on both diffusion and migration in theelectrolyte, expressed by the following equation:
= − ∇ + +J D ci tFl l ll
(4)
where Dl is the diffusion coefficient in the electrolyte.In the electrode, the conservation of current density in the
electrode is governed by Ohm’s law, as shown below:
σ ϕ∇· = = − ∇i i0,s s s s (5)
where is is the current density, σs is the electrical conductivity ofelectrode, and ϕs is the electrical potential in the electrode. Themolar flux vector of lithium ions in electrode (Js) is expressedby Fick’s first law:
= − ∇J D Cs s s (6)
where Ds is the diffusion coefficient in the electrode and Cs isthe lithium-ion concentration in the cathode.To model electrode−electrolyte interfaces, the local current
density at the interface between the electrolyte and theelectrode (iloc) is defined by the Butler−Volmer equation:
α η α η= −
−⎜ ⎟⎛⎝⎜
⎛⎝
⎞⎠
⎛⎝⎜
⎞⎠⎟⎞⎠⎟i i
FRT
FRT
exp expa cloc 0
(7)
where αa and αc are anodic and cathodic charge transfercoefficients, η is the overpotential, and i0 is the exchangecurrent density, as detailed below:
= −α α α αα⎛
⎝⎜⎜
⎞⎠⎟⎟i F k k C C C
CC
( ) ( ) ( ) ( )c a s s sl
l0 ,max
,ref
a c a c
a
(8)
where ka and kc are anodic and cathodic reaction rate constants,respectively, and cl,ref is the electrolyte reference concentration.The computed local current density at the interface (iloc) (eq 7)during electrochemical cycling was then used as a boundarycondition for simulations of ionic mass/charge transport. Arepresentative concentration distribution of the reconstructedporous microstructures of LiFePO4 is shown in Figure 2d.
Figure 4. (a) Local current density and potentials vs time for multiphysic computational simulations. Four different discharging rates (0.6C, 1.2C,2.0C, and 3.6C) and 0.6C charging rate were used between each discharge cycle, whereas the potential was set between 2.0 and 4.0 V. (b)Concentration variations at four different locations (P1, P2, P3, and P4 in (c)) were compared. It was observed that higher concentration gradientexisted at the connecting areas of the particles (P3 vs P4). (c) Concentration evolutions at different SoCs. It was observed that smaller particlesexhibited higher concentrations, compared to larger particles, which could be due to much more dramatic concentration changes existing in smallerparticles.
The Journal of Physical Chemistry C Article
DOI: 10.1021/acs.jpcc.7b12388J. Phys. Chem. C XXXX, XXX, XXX−XXX
E

Moreover, the corresponding overpotential is defined asfollows:
η ϕ ϕ= − − Es l eq (9)
where ϕs is the solid phase potential, ϕl is the electrolyte phasepotential, and Eeq is the equilibrium potential. To reducecomputational time, the effect of the solid−electrolyte interfacewas not considered in this model. In the computationalsimulations, electrochemical (dis)charging sequences followedexperimental electrochemical testing, as described in section2.1. Briefly, the electrode was discharged at 0.6C (2000−8000s), 1.2C (17 000−20 000 s), 2.0C (30 400−32 200 s), and 3.6C(45 000−46 000 s); 0.6C charging rate was used between eachdischarge (9450−15 200 s, 21 600−27 300 s, and 34 900−40 500 s). The cycle also included an open-circuit period(applied current is 0 A/m2) between each charging anddischarging process (0−2000 s, 9000−9450 s, 15 200−17 000 s,20 000−21 600 s, 27 300−30 400 s, and 32 200−34 900 s), asshown in Figure 4a.2.4.2. Transport of Lithium Ions in Cathode. 2D mass/
charge transport of lithium ions in the cathode material wasincorporated into the multiphysic simulations. Since composi-tion-independent transport properties such as Dl and Ds wereused in this study, transport of diluted species was consideredto describe the lithium-ion diffusion and migration in the half-cell system. Moreover, the computed local current density atthe interface (iloc) from eq 7 in 1D electrochemistry model wasused as a boundary condition for ionic mass/charge transportsimulation. The initial concentration of lithium ions in thecathode material was assumed to be homogeneous with a valueof 5000 mol/m3 in this study. Based on Fick’s second law ofdiffusion (eq 10), the concentration distribution in cathodematerial was then computed. The calculated concentration inthe active particles was then transferred to the solid mechanicsmodel for diffusion-induced stress prediction.
∂∂
= ∇Ct
D C( )s2
(10)
2.4.3. Axisymmetric Heat Transfer. Studies have shown thattemperatures in excess of 45 °C will rapidly degrade the batterylifetime, and higher temperatures can also introduce safetyconcerns as materials contained within the battery can begin tochemically and mechanically degrade.54 To better understandtemperature effects on electrochemical and mechanical batterymaterial degradation, our pilot study which incorporated thephysical dimensions of the LiFePO4 14 430 cells hasdemonstrated that an axisymmetric heat transfer mechanismcould be used for computational simulations (Figure 1b). The2D axisymmetric heat transfer model is represented as follows:
ρ ∂∂
+ ∇· ∇ − − =⎜ ⎟⎛⎝
⎞⎠C
Tt
k T h T T Q( ) ( )p ext (11)
where ρ is the density, Cp is the specific heat capacity, k is thethermal conductivity, T is absolute temperature, Text is theexternal absolute temperature, h is the heat transfer coefficient,and Q is the heat source. Based on eq 11, the radial temperaturedistribution was calculated by assuming that specific heatcapacity, thermal conductivity, and the heat transfer coefficientwere constant during electrochemical cycling. The materialproperties used in eq 11 are listed in Table 2.Heat generation in lithium-ion batteries is mainly caused by
Joule heat due to charge transport, reversible entropy heat, heat
from chemical side reactions, and heat of mixing due to thegeneration and relaxation of lithium-ion concentrationgradients.55 In this study, only Joule heating was consideredand the contribution from other heat sources were neglectedsince they were relatively less critical in lithium-ion batteries.39
Joule heat (QJH) generated by the charge transport in theelectrodes and the electrolyte is expressed by the followingequation:
ϕ ϕ= − ·∇ + ·∇Q i i( )s s l lJH (12)
2.4.4. Solid Mechanics. Thermal- and diffusion-inducedstresses and strains in the electrode were obtained in the solidmechanics model. The total strain εT was then composed ofelastic strain εel, diffusion-induced strain εdiff, and thermal strainεth.
ε ε ε ε= + +T el diff th (13)
The electrode was assumed to be an isotropic, linear elasticsolid. Elastic strain was computed by the following linear elasticconstitutive equation:56
ε υ τ υτ δ= + −E1
[(1 ) ]ij ij kk ijel
(14)
where E is Young’s modulus, υ is Poisson’s ratio, τ is the stresstensor, and δ is the Kronecker delta. To consider the phasetransformation between LiFePO4 and FePO4, concentration-dependent material properties were incorporated. The materialproperty matrix [K] was defined as
= + −K x x K x K( ) [ ] (1 )[ ]LiFePO FePO4 4 (15)
where x represents the fraction of lithium-rich phase (0 ≤ x ≤1). The detailed material properties for the mechanical modelwere described in our previous work.42
In this study, we used a hygroscopic swelling analysis inCOMSOL to investigate stress evolutions caused by lithium-iondiffusion. Specifically, hygroscopic swelling was analogous tothe volume expansion and/or contraction due to lithiation inthe electrode and is expressed below:
ε β δ= ΔCij ijdis
(16)
where β is the coefficient of hygroscopic swelling (i.e., volumeexpansion) and ΔC is the change in lithium-ion concentration.In this study, coefficient of hygroscopic swelling was assumedto be constant, β = 6%, over discharging and chargingprocesses.Based on the experimental work by Panchal et al.,28 a
LiFePO4 pouch cell had shown dramatic temperature increase
Table 2. Thermal Properties of Cathode andElectrolyte31,38,65
component parameter value unit
cathode (LiFePO4) thermal conductivity(kc)
1.48 W/(m °C)
specific heat capacity(Cp,c)
1260.2 J/(kg °C)
thermal expansion(αc)
4.6 × 10⁻⁵ 1/K
electrolyte (LiPF6 inEC-DMC)
thermal conductivity(kl)
0.099 W/m °C
specific heat capacity(Cp,l)
1800 J/(kg °C)
thermal expansion(αl)
1 × 10⁻³ 1/K
The Journal of Physical Chemistry C Article
DOI: 10.1021/acs.jpcc.7b12388J. Phys. Chem. C XXXX, XXX, XXX−XXX
F

at high C-rate (dis)charging. Thus, thermal strain was includedin this study and is described by the following equation:
ε α δ= ΔTij c l ijth
, (17)
where α is the thermal expansion coefficient of cathode orelectrolyte and ΔT is the temperature change. Thermalexpansion of electrolyte was also considered, and the coefficientof thermal expansion is shown in Table 2.
3. RESULTS AND DISCUSSION
3.1. Electrochemical Testing and TemperatureChange. During electrochemical testing, the local currentdensity reached −2.54, −4.61, −6.29, and −8.88 A/m2 at the0.6, 1.2, 2.0, and 3.6 discharging rates, respectively, while thelocal current density reached 2.93−2.97 A/m2 at 0.6 chargingrate (Figure 4a). The corresponding potential variations arepresented in Figure 4a.The total (dis)charging time was also recorded. It was
observed that the total discharging time was ∼6000 s at 0.6C,∼3000 s at 1.2C, ∼1800 s at 2C, and ∼1000 s at 3.6C. Figure1c shows temperature variations during discharging at differentC-rates (0.6C, 1.2C, 2.0C, and 3.6C). Even though Jouleheating was the only heat source considered, the results fromthe multiphysic simulations matched well with the FBGmeasurements. It confirms Joule heating as the main heatsource in lithium-ion batteries during cycling, and other heatsources (i.e., entropy heat, chemical side reactions, heat ofmixing) are negligible. From both experimental and simulationresults, it was observed that higher C-rate showed highertemperature change, suggesting that higher Joule heating wasgenerated at higher C-rate, and this phenomenon was also
observed in LiCoO2 battery chemistry.40 The temperaturechanges, ΔT, measured with the FBG sensors were 2.09, 5.22,8.75, and 13.75 °C at 0.6C, 1.2C, 2C, and 3.6C, respectively. At1.2C and 2C, the root-mean-square error (RMSE) oftemperature change ΔT between the simulated and measureddata was less than 0.1%, and the RMSE at 0.6C and 3.6C was3.87% and 3.49%, respectively. From these results, weconcluded that the predicted temperature changes from thesimulations demonstrated good agreement with experimentaldata from FBG measurements.Based on the total discharging time at different C-rates, the
state of charge (SoC) is calculated by normalizing thedischarging time. For example, a total of ∼6000 s of dischargingat 0.6C indicates that 25% of discharging (i.e., SoC = 0.25)occurs at 1500 s and 90% of discharging (i.e., SoC = 0.9) occursat 5400 s; a total of ∼1000 s for discharging at 3.6C indicatesthat 25% of discharging (i.e., SoC = 0.25) occurs at 250 s and90% of discharging (i.e., SoC = 0.9) occurs at 900 s, etc. Thetemperature gradients at the beginning (i.e., SoC < 0.23) andthe end (i.e., SoC > 0.9) of the discharging process were higherthan that of the plateau region of discharging (i.e., 0.23 < SoC <0.9) for all measured and simulation cells. A similarphenomenon was observed in the previous study by Saw etal.27 and Panchal et al.,28 where they showed the gradients oftotal heat were relatively high at the beginning and at the end ofthe discharging process. It is suggested that the activationpolarization due to the limited reaction rate at the beginning ofdischarging and the concentration polarization from limitedmass transport at the end of discharging have both causedhigher heat generation than that from the ohmic polarization.
3.2. Concentration Distribution. The results of computa-tional electrochemical simulations were verified by comparing
Figure 5. (a) Local current density and potentials vs time for multiphysic computational simulations. (b) Normalized thermal stress vs timedemonstrating effects of ambient temperatures and C-rates on thermal stresses. (c) Normalized thermal stress values at different C-rates at differentambient temperatures.
The Journal of Physical Chemistry C Article
DOI: 10.1021/acs.jpcc.7b12388J. Phys. Chem. C XXXX, XXX, XXX−XXX
G

electrochemical testing on 14 430 lithium-ion cells at fourdifferent discharging rates (0.6C, 1.2C, 2.0C, and 3.6C) and at acharging rate of 0.6C between 2.0 and 4.0 V. In thecomputational simulations, electrochemical (dis)charging se-quences followed experimental electrochemical testing. Theelectrode was discharged at 0.6C (2000−8000 s), 1.2C(17 000−20 000 s), 2.0C (30 400−32 200 s), and 3.6C(45 000−46 000 s) with charging at 0.6C in between (9450−15 200 s, 21 600−27 300 s, and 34 900−40 500 s) (Figure 4a).Initial concentration in the electrode was assumed to be 5000mol/m3. Based on eqs 2−10, concentration distributions in theelectrode at different C-rates could be determined (Figure 4b).Concentration profiles during (dis)charging at four differentlocations denoted as P1, P2, P3, and P4 were compared, whereP1 and P2 indicate outer layer and P3 and P4 indicate theconnecting area between each active particle and inside of anactive particle, respectively (Figure 4c). It was observed thatlithium-ion concentration distribution was location dependentwhere lithium ions diffuse from the outer layer to the inside ofthe particle. That is, at any time and given C-rate, P1 and P2located on the outer layer of the particle revealed higherconcentrations than those of P3 and P4, which are locatedinside of the particles (Figure 4b). Particularly, the concen-tration at the surface of the particle indicated in black and bluelines (P1 and P2) showed nearly the same concentration due tothe same local current density applied. Moreover, the gapbetween P3 and the other points (i.e., P1, P2, and P4) graduallyincreases at the end of discharging as C-rate increases. Thissuggested that the concentration distribution become non-homogeneous in the cathode under higher C-rate. Figure 4cdemonstrates concentration evolutions for the reconstructedporous microstructures of LiFePO4 at different SoCs.Compared to larger particles, smaller particles showed higherconcentrations, indicating more dramatic concentration varia-tions were observed in smaller particles. Comparing to ourprevious study by adopting core−shell models,42 we have usedthe same local current density as the boundary condition on theparticle surface; the concentration distributions in this studywere different from the ones obtained from mostly adoptedcore−shell models. It is suggested that reconstructed porousmicrostructures of LiFePO4 could possibly provide more detailson concentration evolutions during (dis)charging at differentC-rates.3.3. Mechanical Stresses. 3.3.1. Thermal Stress. With the
prescribed electrochemical (dis)charging sequences, dischargedat 0.6C, 1.2C, 2.0C, and 3.6C and with 0.6C charging inbetween, thermal stress variations at three different ambienttemperatures under different C-rates were obtained (Figure5b). The results showed that by increasing C-rate from 0.6C to3.6C (i.e., discharging 6 times faster), it resulted in 5.92, 3.11,and 2.30 times higher thermal stresses at 20, 30, and 60 °C,
respectively. It suggested that the effects of C-rate were morecritical at room temperature (i.e., 25 °C) than that at highertemperature (i.e., 60 °C). In spite of a sharp decrease inpotential at the beginning of discharging, thermal stresses andtemperature increased more dramatically at the end ofdischarging, compared to that at the beginning of discharging.Our results confirmed that effects of increasing temperatureresults in larger thermal stresses during (dis)charging. More-over, it is observed that thermal stress during the dischargingprocess is higher than that during the charging process underthe same C-rate. Figure 5b also demonstrates that increases inthermal stress due to higher temperature played a lesser role athigher C-rates. For example, if nondimensionalization was usedfor thermal stresses by setting the thermal stress value to 1 at 60°C at 3.6C discharging rate, thermal stress is 2.06 times higherthan that at 20 °C (1/0.48638 = 2.06) and 1.63 times higherthan that at 30 °C (1/0.61421 = 1.63), whereas thermal stressat 60 °C is 5.29 times higher than that at 20 °C (0.43505/0.08219 = 5.29) and 2.20 times higher than that at 30 °C(0.43505/0.19771 = 2.2) at 0.6C discharging rate, as shown inFigure 5c. This can be explained by the fact that heatgeneration inside lithium-ion battery was more criticalcompared to heat convention to the environment, whereasrelatively lower heat generation in lower C-rate inside batteryresulted in critical heat convention. Because higher externaltemperature was highly related to heat convention, thereforeeffects of higher external temperature played a much higher roleat lower C-rate.
3.3.2. Diffusion-Induced Stress. Since the magnitudes ofthermal stresses in electrodes were much smaller than those ofdiffusion-induced stresses, to demonstrate the evolution ofoverall stresses across the entire range of SoC, diffusion-induced stresses from 20% to 100% SoC at 3.6C werepresented (Figure 6). Higher stresses were observed at theconnecting areas between particles, suggesting that the higherstresses might result from higher concentration variations in theconnecting area. Compared to other previous results whereonly homogeneous spherical particles were considered,10,38,42,57
the current study showed that reconstructed microstructures ofelectrode particles were very important for stress analysis, and itis hypothesized that it is highly related to crack initiations.58
The rate capability of 14 430 lithium-ion cells performed viaa 273A potentiostat/galvanostat at different discharging rates(1.2C, 2.0C, and 3.6C) is shown in Figure 7a, and the capacitylost was recorded. The results showed that 14 430 lithium-ioncells tested at 3.6C have 30% capacity loss compared to cellstested at 1.2C; a corresponding 150% increase in stress wasobserved from the multiphysic simulations, where both thermaland diffusion-induced stresses were included (Figure 7b). Notethat normalized stresses and normalized capacities were used inFigure 7 for clear comparisons. At all C-rates, stresses increase
Figure 6. Diffusion-induced stress at different SoCs. Higher stresses were observed at the connecting areas between particles at the end of thedischarging process, suggesting that the higher stresses might result from higher concentration variations in the connecting area. Scale bar:normalized concentration was used.
The Journal of Physical Chemistry C Article
DOI: 10.1021/acs.jpcc.7b12388J. Phys. Chem. C XXXX, XXX, XXX−XXX
H

significantly at the end of the discharging process and may berelated to dramatic drops in potential at the end of discharging.It was concluded that higher capacity loss at the higher C-rate(e.g., 30% loss at 3.6C) was mainly caused by higher stresses athigher C-rate (e.g., 150% increase in stresses at 3.6C). Thecapacity fades measured from the potentiostat were 10%, 13%,and 27% at 1.2C, 2.0C, and 3.6C, respectively (Figure 7a). Thesimulation results show that the capacity fade was 6%, 9%, 14%,and 30% at 0.6C, 1.2C, 2.0C, and 3.6C, respectively (Figure7b).3.3.3. Limitations of the Study. In these efforts to
experimentally measure in operando temperature variation andcomputationally simulate thermal and mechanical effects duringlithium-ion battery discharging with reconstructed micro-structure, several limitations existed in the current study.Based on the results from Kupper and Bessler,59 thetemperature distribution is considered uniform in the electrodesince temperature gradients occur on a larger scale (e.g., mmand/or cm) compared to the particle size (e.g., nm and/orμm). Thus, only temperature “variation” vs time was reported(Figure 1) and used to predict thermal stresses (Figure 5).Furthermore, carbon black and PVDF binder were not includedin the reconstructed microstructure in this study, and effectsfrom these components will be further identified in future work.Though the coupled electrochemistry of electrolyte andelectrode was studied in this work, to reduce computationaltime the solid electrolyte interface was not explicitly consideredin the model.
4. CONCLUSIONSIn this paper, computational models incorporating coupledelectrochemical−mechanical−thermal factors were used to
investigate the relationships between mechanical stresses andcapacity loss in lithium-ion batteries. Further, reconstructedmicrostructures of LiFePO4 were used to enhance the accuracyof the predicted stresses in batteries. Electrochemical−thermalmodels were verified by experimental measurements, includingtemperature variations measured via FBG sensors and capacityloss measured via a potentiostat/galvanostat. The experimen-tally verified multiphysics models had predicted thermalstresses, potential variations, concentration evolutions, andmechanical stresses during (dis)charging at different externaltemperatures and C-rates. Furthermore, effects of ambienttemperatures and C-rates on thermal stress have beeninvestigated, and it was observed that increasing temperatureand C-rate results in larger thermal stresses during (dis)-charging. However, at higher C-rates, increases in thermalstresses due to higher temperature played a lesser role.Moreover, concentration evolution in the reconstructedcathode has been presented. As expected, higher concentrationand dramatic concentration changes were exhibited at thesurface of particles as compared to those at the center of theparticles. Higher concentration variation also appeared atconnecting areas between particles. Moreover, it is alsoconfirmed that the concentration distribution becomes non-homogenous at higher C-rates. By comparing diffusion-inducedstress with thermal stress, it was concluded that the effects ofdiffusion-induced stress dominated in the cathode. With asimple 2D model by integrating some key factors occurring inbattery (dis)charging while neglecting other details (i.e.,polarizations, carbon black, etc.), a relationship betweenmechanical stresses and capacity fade was also observed beforeparticle crack initiation. On the basis of the methodology andresults presented in this paper, we can further study particlecrack prediction and battery degradation in a 3D system.
■ AUTHOR INFORMATIONCorresponding Author*(H.-Y.S.H.) Tel 919.513.0798; Fax 919.515.7968; [email protected] Shadow Huang: 0000-0002-5647-7049NotesThe authors declare no competing financial interest.
■ REFERENCES(1) Kumar, A.; Thomas, R.; Karan, N. K.; Saavedra-Arias, J. J.; Singh,M. K.; Majumder, S. B.; Tomar, M. S.; Katiyar, R. S. Structural andElectrochemical Characterization of Pure LiFePO4 and Nano-composite C-LiFePO4 Cathodes for Lithium Ion RechargeableBatteries. J. Nanotechnol. 2009, 2009, 1−10.(2) Cho, Y.-D.; Fey, G. T.-K.; Kao, H.-M. The Effect of CarbonCoating Thickness on the Capacity of LiFePO4/C CompositeCathodes. J. Power Sources 2009, 189, 256−262.(3) Guerfi, A.; Ravet, N.; Charest, P.; Dontigny, M.; Petitclerc, M.;Gauthier, M.; Zaghib, K. Temperature Effects on LiFePO4 CathodePerformance. ECS Trans. 2006, 3, 3−17.(4) Dupre, N.; Cuisinier, M.; Martin, J. F.; Guyomard, D. InterphaseEvolution at Two Promising Electrode Materials for Li-Ion Batteries:LiFePO4 and LiNi1/2Mn1/2O2. ChemPhysChem 2014, 15, 1922−1938.(5) Dupre, N.; Martin, J.-F.; Degryse, J.; Fernandez, V.; Soudan, P.;Guyomard, D. Aging of the LiFePO4 Positive Electrode Interface inElectrolyte. J. Power Sources 2010, 195, 7415−7425.(6) Aurbach, D.; Markovsky, B.; Salitra, G.; Markevich, E.; Talyossef,Y.; Koltypin, M.; Nazar, L.; Ellis, B.; Kovacheva, D. In Review onElectrode−electrolyte Solution Interactions, Related to Cathode
Figure 7. (a) Experimental capacity losses in 1.2C, 2.0C, and 3.6C wasobserved. Almost 30% capacity loss was observed at 3.6C compared tocells tested at 1.2C. (b) Simulation results revealed 150% increasedstresses at 3.6C compared to cells at 1.2C. For clearer comparisons,normalized stresses (combination of thermal and diffusion-inducedstresses) and normalized capacity were used. It is suggested that largercapacity loss was mainly caused by higher stresses at higher C-rates.
The Journal of Physical Chemistry C Article
DOI: 10.1021/acs.jpcc.7b12388J. Phys. Chem. C XXXX, XXX, XXX−XXX
I

Materials for Li-Ion Batteries, Proceedings of the International BatteryAssociation & Hawaii Battery Conference 2006, Waikoloa, HI, Jan 9−12, 2006.(7) Meethong, N.; Huang, H. Y. S.; Speakman, S. A.; Carter, W. C.;Chiang, Y. M. Strain Accommodation during Phase Transformationsin Olivine-Based Cathodes as a Materials Selection Criterion for High-Power Rechargeable Batteries. Adv. Funct. Mater. 2007, 17, 1115−1123.(8) Meethong, N.; Huang, H.-Y. S.; Carter, W. C.; Chiang, Y.-M.Size-Dependent Lithium Miscibility Gap in Nanoscale Li1−xFePO4.Electrochem. Solid-State Lett. 2007, 10, A134−A138.(9) Li, J.; Zhang, Q.; Xiao, X.; Cheng, Y. T.; Liang, C.; Dudney, N. J.Unravelling the Impact of Reaction Paths on Mechanical Degradationof Intercalation Cathodes for Lithium-Ion Batteries. J. Am. Chem. Soc.2015, 137, 13732−13735.(10) Park, J.; Lu, W.; Sastry, A. M. Numerical Simulation of StressEvolution in Lithium Manganese Dioxide Particles due to CoupledPhase Transition and Intercalation. J. Electrochem. Soc. 2011, 158,A201.(11) Sheem, K. Y.; Sung, M.; Lee, Y. H. Electrostatic Hetero-coagulation of Carbon Nanotubes and LiCoO2 Particles for a High-Performance Li-Ion Cell. Electrochim. Acta 2010, 55, 5808−5812.(12) Qi, Y.; Harris, S. J. In Situ Observation of Strains duringLithiation of a Graphite Electrode. J. Electrochem. Soc. 2010, 157,A741−A747.(13) Chan, C. K.; Patel, R. N.; O’Connell, M. J.; Korgel, B. A.; Cui, Y.Solution-Grown Silicon Nanowires for Lithium-Ion Battery Anodes.ACS Nano 2010, 4, 1443−1450.(14) Li, Y.; El Gabaly, F.; Ferguson, T. R.; Smith, R. B.; Bartelt, N.C.; Sugar, J. D.; Fenton, K. R.; Cogswell, D. A.; Kilcoyne, A. L. D.;Tyliszczak, T.; et al. Current-Induced Transition from Particle-by-Particle to Concurrent Intercalation in Phase-Separating BatteryElectrodes. Nat. Mater. 2014, 13, 1149−1156.(15) Wang, D.; Wu, X.; Wang, Z.; Chen, L. Cracking Causing CyclicInstability of LiFePO4 Cathode Material. J. Power Sources 2005, 140,125−128.(16) Nyman, A.; Behm, M.; Lindbergh, G. ElectrochemicalCharacterisation and Modelling of the Mass Transport Phenomenain LiPF6-EC-EMC Electrolyte. Electrochim. Acta 2008, 53, 6356−6365.(17) Nyman, A.; Behm, M.; Lindbergh, G. A Theoretical andExperimental Study of the Mass Transport in Gel Electrolytes II.Experimental Characterization of LiPF6-EC-PC-P(VdF-HFP). J.Electrochem. Soc. 2011, 158, A636.(18) Prada, E.; Di Domenico, D.; Creff, Y.; Bernard, J.; Sauvant-Moynot, V.; Huet, F. A Simplified Electrochemical and Thermal AgingModel of LiFePO4-Graphite Li-Ion Batteries: Power and CapacityFade Simulations. J. Electrochem. Soc. 2013, 160, A616−A628.(19) Edstrom, K.; Gustafsson, T.; Thomas, J. O. The Cathode−electrolyte Interface in the Li-Ion Battery. Electrochim. Acta 2004, 50,397−403.(20) JU, H.; WU, J.; XU, Y. Revisiting the ElectrochemicalImpedance Behaviour of the LiFePO4/C Cathode. J. Chem. Sci.2013, 125, 687−693.(21) Aurbach, D.; Talyosef, Y.; Markovsky, B.; Markevich, E.;Zinigrad, E.; Asraf, L.; Gnanaraj, J. S.; Kim, H. J. Design of ElectrolyteSolutions for Li and Li-Ion Batteries: A Review. Electrochim. Acta2004, 50, 247−254.(22) Ahmed, S.; Bloom, I.; Jansen, A. N.; Tanim, T.; Dufek, E. J.;Pesaran, A.; Burnham, A.; Carlson, R. B.; Dias, F.; Hardy, K.; et al.Enabling Fast Charging − A Battery Technology Gap Assessment. J.Power Sources 2017, 367, 250−262.(23) Keyser, M.; Ahmad, P.; Li, Q.; Santhanagopalan, S.; Smith, K.;Wood, E.; Shabbir, A.; Bloom, I.; Dufek, E.; Shirk, M.; et al. EnablingFast Charging - Battery Thermal Considerations. J. Power Sources2017, 367, 228−236.(24) Liu, B.; Zhao, H.; Yu, H.; Li, J.; Xu, J. Electrochimica ActaMultiphysics Computational Framework for Cylindrical Lithium-IonBatteries under Mechanical Abusive Loading. Electrochim. Acta 2017,256, 172−184.
(25) Xu, J.; Liu, B.; Wang, X.; Hu, D. Computational Model of 18650Lithium-Ion Battery with Coupled Strain Rate and SOC Depend-encies. Appl. Energy 2016, 172, 180−189.(26) Liu, B.; Yin, S.; Xu, J. Integrated Computation Model ofLithium-Ion Battery Subject to Nail Penetration. Appl. Energy 2016,183, 278−289.(27) Saw, L. H.; Ye, Y.; Tay, A. A. O. Electrochemical-ThermalAnalysis of 18650 Lithium Iron Phosphate Cell. Energy Convers.Manage. 2013, 75, 162−174.(28) Panchal, S.; Dincer, I.; Agelin-Chaab, M.; Fraser, R.; Fowler, M.Experimental and Theoretical Investigations of Heat Generation Ratesfor a Water Cooled LiFePO4 Battery. Int. J. Heat Mass Transfer 2016,101, 1093−1102.(29) Lee, S. J.; Lee, C. Y.; Chung, M. Y.; Chen, Y. H.; Han, K. C.;Liu, C. K.; Yu, W. C.; Chang, Y. M. Lithium-Ion Battery ModuleTemperature Monitoring by Using Planer Home-Made MicroThermocouples. Int. J. Electrochem. Sci. 2013, 8, 4131−4141.(30) Forgez, C.; Vinh Do, D.; Friedrich, G.; Morcrette, M.;Delacourt, C. Thermal Modeling of a Cylindrical LiFePO4/graphiteLithium-Ion Battery. J. Power Sources 2010, 195, 2961−2968.(31) Mathewson, S. Experimental Measurements of LiFePO4 BatteryThermal Characteristics, M.S. Thesis, University of Waterloo,Waterloo, ON, 2014.(32) Lee, C. Y.; Lee, S. J.; Tang, M. S.; Chen, P. C. In SituMonitoring of Temperature inside Lithium-Ion Batteries by FlexibleMicro Temperature Sensors. Sensors 2011, 11, 9942−9950.(33) Fiber Bragg Grating Sensors. Encyclopedia of Structural HealthMonitoring [Online]; John Wiley & Sons: Posted Sept 15, 2009;http://onlinelibrary.wiley.com/doi/10.1002/9780470061626.shm024/full.(34) Meyer, J.; Nedjalkov, A.; Doering, A.; Angelmahr, M.; Schade,W. In Fiber Optical Sensors for Enhanced Battery Safety, Proceedingsof Fiber Optic Sensors and Applications XII, Baltimore, MD, Apr 20−24, 2015.(35) Novais, S.; Nascimento, M.; Grande, L.; Domingues, M. F.;Antunes, P.; Alberto, N.; Leitao, C.; Oliveira, R.; Koch, S.; Kim, G. T.;et al. Internal and External Temperature Monitoring of a Li-IonBattery with Fiber Bragg Grating Sensors. Sensors 2016, 16, 1394.(36) Zhang, X.; Sastry, A. M.; Shyy, W. Intercalation-Induced Stressand Heat Generation within Single Lithium-Ion Battery CathodeParticles. J. Electrochem. Soc. 2008, 155, A542−A552.(37) Wu, W.; Xiao, X.; Huang, X.; Yan, S. A Multiphysics Model forthe in Situ Stress Analysis of the Separator in a Lithium-Ion BatteryCell. Comput. Mater. Sci. 2014, 83, 127−136.(38) Xiao, X.; Wu, W.; Huang, X. A Multi-Scale Approach for theStress Analysis of Polymeric Separators in a Lithium-Ion Battery. J.Power Sources 2010, 195, 7649−7660.(39) Wu, W.; Xiao, X.; Shi, D. In Heat Transfer and Thermal Stressin a Lithium-Ion Battery, Proceedings of the ASME 2010 InternationalMechanical Engineering Congress & Exposition, Vancouber, BC, Nov12−18, 2010.(40) Yan, B.; Lim, C.; Yin, L.; Zhu, L. Simulation of Heat Generationin a Reconstructed LiCoO2 Cathode during Galvanostatic Discharge.Electrochim. Acta 2013, 100, 171−179.(41) Doyle, M.; Newman, J. The Use of Mathematical Modeling inthe Design of Lithium/polymer Battery Systems. Electrochim. Acta1995, 40, 2191−2196.(42) Kim, S.; Huang, H.-Y. S. Mechanical Stresses at the Cathode−electrolyte Interface in Lithium-Ion Batteries. J. Mater. Res. 2016, 31,3506−3512.(43) Mukhopadhyay, A.; Sheldon, B. W. Deformation and Stress inElectrode Materials for Li-Ion Batteries. Prog. Mater. Sci. 2014, 63, 58−116.(44) Kashkooli, A. G.; Farhad, S.; Lee, D. U.; Feng, K.; Litster, S.;Babu, S. K.; Zhu, L.; Chen, Z. Multiscale Modeling of Lithium-IonBattery Electrodes Based on Nano-Scale X-Ray Computed Tomog-raphy. J. Power Sources 2016, 307, 496−509.(45) Wu, L.; Xiao, X.; Wen, Y.; Zhang, J. Three-Dimensional FiniteElement Study on Stress Generation in Synchrotron X-Ray
The Journal of Physical Chemistry C Article
DOI: 10.1021/acs.jpcc.7b12388J. Phys. Chem. C XXXX, XXX, XXX−XXX
J

Tomography Reconstructed Nickel-Manganese-Cobalt Based HalfCell. J. Power Sources 2016, 336, 8−18.(46) Wiedemann, A. H.; Goldin, G. M.; Barnett, S. A.; Zhu, H.; Kee,R. J. Effects of Three-Dimensional Cathode Microstructure on thePerformance of Lithium-Ion Battery Cathodes. Electrochim. Acta 2013,88, 580−588.(47) Roberts, S. A.; Brunini, V. E.; Long, K. N.; Grillet, a. M. AFramework for Three-Dimensional Mesoscale Modeling of Aniso-tropic Swelling and Mechanical Deformation in Lithium-Ion Electro-des. J. Electrochem. Soc. 2014, 161, F3052−F3059.(48) Ender, M.; Joos, J.; Carraro, T.; Ivers-Tiffee, E. QuantitativeCharacterization of LiFePO4 Cathodes Reconstructed by FIB/SEMTomography. J. Electrochem. Soc. 2012, 159, A972−A980.(49) Liu, Z.; Chen-Wiegart, Y. K.; Wang, J.; Barnett, S. A.; Faber, K.T. Three-Phase 3D Reconstruction of a LiCoO2 Cathode via FIB-SEMTomography. Microsc. Microanal. 2016, 22, 140−148.(50) Hutzenlaub, T.; Thiele, S.; Paust, N.; Spotnitz, R.; Zengerle, R.;Walchshofer, C. Three-Dimensional Electrochemical Li-Ion BatteryModelling Featuring a Focused Ion-Beam/scanning Electron Micros-copy Based Three-Phase Reconstruction of a LiCoO2 Cathode.Electrochim. Acta 2014, 115, 131−139.(51) Malave, V.; Berger, J. R.; Zhu, H.; Kee, R. J. A ComputationalModel of the Mechanical Behavior within Reconstructed LixCoO2 Li-Ion Battery Cathode Particles. Electrochim. Acta 2014, 130, 707−717.(52) Song, B.; Sui, T.; Ying, S.; Li, L.; Lu, L.; Korsunsky, A. M. Nano-Structural Changes in Li-Ion Battery Cathodes during CyclingRevealed by FIB-SEM Serial Sectioning Tomography. J. Mater.Chem. A 2015, 3, 18171−18179.(53) COMSOL Multiphysics, version 5.2a; software for mutlphysicssimulation; COMSOL, 2016.(54) Shadow Huang, H.-Y.; Wang, Y.-X. Dislocation Based StressDevelopments in Lithium-Ion Batteries. J. Electrochem. Soc. 2012, 159,A815−A821.(55) Shi, D. Stress Analysis Of the Separator in a Lithium-IonBattery, M.S. Thesis, Michigan State University, East Lansing, MI,2010.(56) Slaughter, W. S. Constitutive Eqautions. The Linearized Theory ofElasticity; Birkhauser: Boston, 2002; pp 193−220.(57) Song, J.; Kim, J.; Kang, T.; Kim, D. Design of a Porous Cathodefor Ultrahigh Performance of a Li-Ion Battery: An Overlooked PoreDistribution. Sci. Rep. 2017, 7, 42521.(58) Chiuhuang, C.; Huang, H. S. Critical Lithiation for C-RateDependent Mechanical Stresses in LiFePO4. J. Solid State Electrochem.2015, 19, 2245−2253.(59) Kupper, C.; Bessler, W. G. Multi-Scale Thermo-ElectrochemicalModeling of Performance and Aging of a LiFePO4/Graphite Lithium-Ion Cell. J. Electrochem. Soc. 2017, 164, A304−A320.(60) Li, X.; Choe, S. Y.; Joe, W. T. A Reduced Order Electrochemicaland Thermal Model for a Pouch Type Lithium Ion Polymer Batterywith LiNixMnyCo1‑x‑yO2/LiFePO4 Blended Cathode. J. Power Sources2015, 294, 545−555.(61) Tanim, T. R.; Rahn, C. D.; Wang, C. Y. State of ChargeEstimation of a Lithium Ion Cell Based on a Temperature Dependentand Electrolyte Enhanced Single Particle Model. Energy 2015, 80,731−739.(62) Park, M.; Zhang, X.; Chung, M.; Less, G. B.; Sastry, A. M. AReview of Conduction Phenomena in Li-Ion Batteries. J. Power Sources2010, 195, 7904−7929.(63) Taleghani, S. T.; Marcos, B.; Zaghib, K.; Lantagne, G. A Studyon the Effect of Porosity and Particles Size Distribution on Li-IonBattery Performance. J. Electrochem. Soc. 2017, 164, E3179−E3189.(64) Bahiraei, F.; Ghalkhani, M.; Fartaj, A.; Nazri, G.-A. A Pseudo 3DElectrochemical-Thermal Modeling and Analysis of a Lithium-IonBattery for Electric Vehicle Thermal Management Applications. Appl.Therm. Eng. 2017, 125, 904−918.(65) Adams, S.; P. Rao, R. Design of (Thio) Phosphates for HighPerformance Lithium Ion Batteries. Ceram. Mater. Energy Appl. 2011,32, 161−176.
The Journal of Physical Chemistry C Article
DOI: 10.1021/acs.jpcc.7b12388J. Phys. Chem. C XXXX, XXX, XXX−XXX
K


![Application of Multiplexed FBG and PZT Impedance · FBG based sensors for sensing applications in civil and structural engineering [7-9]. FBG sensors offer a wide number of advantages](https://static.fdocuments.net/doc/165x107/5f0c25797e708231d433f797/application-of-multiplexed-fbg-and-pzt-impedance-fbg-based-sensors-for-sensing-applications.jpg)


