Multiphase renal CT in the evaluation of renal masses: is ... · Multiphase renal CT in the...
6
Multiphase renal CT in the evaluation of renal masses: is the nephrographic phase necessary? Nor-Azalina Songib a, b , Mohammad Nazri a, b , Nur Adura Yaakup a, b , Hazman M. Nor a, b , Zhonghua Sun c, ⁎ a University of Malaya Research Imaging Centre (UMRIC), University of Malaya, 50603, Kuala Lumpur, Malaysia b Department of Biomedical Imaging, Faculty of Medicine, University of Malaya, 50603, Kuala Lumpur, Malaysia c Discipline of Medical Imaging, Department of Imaging and Applied Physics, Curtin University, GPO Box U1987 Perth, Western Australia, 6845, Australia abstract article info Article history: Received 6 November 2012 Received in revised form 21 May 2013 Accepted 1 August 2013 Keywords: Renal computed tomography Multiphase computed tomography Renal lesions The aim of this study is to investigate the feasibility of eliminating the nephrographic phase from the four- phase renal computed tomography (CT) imaging to a three-phase protocol without affecting its diagnostic value. Thirty patients undergoing four-phase renal CT scans for assessment of renal lesions (N 10 mm) were included in the study. A three-phase renal CT, without nephrographic phase, had similar diagnostic ability to a four-phase renal CT in the detection and characterization of renal lesions. A three-phase CT (plain, corticomedullary, and excretory phase) is therefore adequate in the clinical diagnosis of renal lesions. © 2013 Elsevier Inc. All rights reserved. 1. Introduction According to the American Cancer Society, the prevalence of malignant renal tumors in general population is about 0.07% [1] with renal cell carcinoma (RCC) being the most common, which accounts for approximately 3% of adult malignancies. The incidence of RCC is increasing at an annual rate of approximately 2% [1]. This is partly due to the increased use of radiological imaging, which results in early detection of small asymptomatic lesions incidentally found during scanning for other conditions. Standard four-phase helical renal computed tomography (CT) has been recommended and widely used in many clinical centers for detection and staging of renal tumors [2–4]. It includes preliminary phase (unenhanced phase), corticomedullary phase (CMP), nephro- graphic phase, and excretory phase (EP), corresponding to a scan delay of 30 s, 90 s, and 240 s at post intravenous (iv) contrast injections, respectively. Multiphase renal CT improves the sensitivity of renal lesions detection [5,6] but at the expense of increasing patient's radiation dose, given the fact that CT is a high-dose modality [7–9]. Thus, it is important to reduce the number of CT phases in renal imaging, while still providing diagnostic images. Studies have been conducted to reduce the number of phases used in multiphase renal CT without compromising image quality and ability to characterize renal lesions. A previous study by Yuh et al. reported that renal masses greater than 10 mm can be adequately assessed by EP [2]. Another study showed that nephrographic phase gave the least diagnostic information in the evaluation of renal lesions [3]. Gakis et al. showed that nephrographic phase was better than other phases in the detection of solid renal lesions; however, the CMP was found to be better for the lesion characterization [4]. It is a well- known fact that every additional phase in CT examination increases radiation dose to patients, thus increasing the risk of radiation-related malignancy. Therefore, this study was conducted to confirm the necessity of actual relevance of the nephrographic phase to the assessment of renal masses. We hypothesized that the nephrographic phase could be eliminated from the standard four-phase renal CT and that a three-phase renal CT may be suggested as a routine protocol, while the nephrographic phase can be done at a different setting if deemed necessary. 2. Materials and methods 2.1. Patient population This study was approved by the local ethical research committee, and written informed consent was obtained from all patients before undergoing the procedure. Thirty adult patients aged above 30 years old (age range: 35–85 years old, mean±S.D.: 64.2±12.0) with suspicious renal masses detected either clinically or from other radiological imaging were prospectively collected from December 2008 to February 2011 at the University of Malaya Research Imaging Center, Kuala Lumpur, Malaysia. There were 20 males and 10 females. The presenting symptoms were variable among these patients with 7 (23%) patients presenting with microscopic hematuria, 3 (10%) with gross hematuria, 4 (13%) with loin pain, and 5 (17%) with loin pain associated with microscopic hematuria. Eleven (37%) patients were incidentally noted to have renal lesions on ultrasound performed for Clinical Imaging 37 (2013) 1037–1042 ⁎ Corresponding author. Discipline of Medical Imaging, Department of Imaging and Applied Physics, Curtin University, GPO Box, U1987, Perth, Western Australia, 6845, Australia. Tel.: +61 8 9266 7509; fax: +61 8 9266 2377. E-mail address: [email protected] (Z. Sun). 0899-7071/$ – see front matter © 2013 Elsevier Inc. All rights reserved. http://dx.doi.org/10.1016/j.clinimag.2013.08.005 Contents lists available at ScienceDirect Clinical Imaging journal homepage: http://www.clinicalimaging.org
Transcript of Multiphase renal CT in the evaluation of renal masses: is ... · Multiphase renal CT in the...

Clinical Imaging 37 (2013) 1037–1042
Contents lists available at ScienceDirect
Clinical Imaging
j ourna l homepage: ht tp : / /www.c l in ica l imag ing.org
Multiphase renal CT in the evaluation of renal masses: is the nephrographicphase necessary?
Nor-Azalina Songib a,b, Mohammad Nazri a,b, Nur Adura Yaakup a,b, Hazman M. Nor a,b, Zhonghua Sun c,⁎a University of Malaya Research Imaging Centre (UMRIC), University of Malaya, 50603, Kuala Lumpur, Malaysiab Department of Biomedical Imaging, Faculty of Medicine, University of Malaya, 50603, Kuala Lumpur, Malaysiac Discipline of Medical Imaging, Department of Imaging and Applied Physics, Curtin University, GPO Box U1987 Perth, Western Australia, 6845, Australia
a b s t r a c ta r t i c l e i n f o
⁎ Corresponding author. Discipline of Medical ImagingApplied Physics, Curtin University, GPO Box, U1987, PeAustralia. Tel.: +61 8 9266 7509; fax: +61 8 9266 2377
E-mail address: [email protected] (Z. Sun).
0899-7071/$ – see front matter © 2013 Elsevier Inc. Alhttp://dx.doi.org/10.1016/j.clinimag.2013.08.005
Article history:Received 6 November 2012Received in revised form 21 May 2013Accepted 1 August 2013
Keywords:Renal computed tomographyMultiphase computed tomographyRenal lesions
The aim of this study is to investigate the feasibility of eliminating the nephrographic phase from the four-phase renal computed tomography (CT) imaging to a three-phase protocol without affecting its diagnosticvalue. Thirty patients undergoing four-phase renal CT scans for assessment of renal lesions (N10 mm) wereincluded in the study. A three-phase renal CT, without nephrographic phase, had similar diagnostic ability to afour-phase renal CT in the detection and characterization of renal lesions. A three-phase CT (plain,corticomedullary, and excretory phase) is therefore adequate in the clinical diagnosis of renal lesions.
© 2013 Elsevier Inc. All rights reserved.
1. Introduction
According to the American Cancer Society, the prevalence ofmalignant renal tumors in general population is about 0.07% [1] withrenal cell carcinoma (RCC) being the most common, which accountsfor approximately 3% of adult malignancies. The incidence of RCC isincreasing at an annual rate of approximately 2% [1]. This is partly dueto the increased use of radiological imaging, which results in earlydetection of small asymptomatic lesions incidentally found duringscanning for other conditions.
Standard four-phase helical renal computed tomography (CT) hasbeen recommended and widely used in many clinical centers fordetection and staging of renal tumors [2–4]. It includes preliminaryphase (unenhanced phase), corticomedullary phase (CMP), nephro-graphic phase, and excretory phase (EP), corresponding to a scandelay of 30 s, 90 s, and 240 s at post intravenous (iv) contrastinjections, respectively. Multiphase renal CT improves the sensitivityof renal lesions detection [5,6] but at the expense of increasingpatient's radiation dose, given the fact that CT is a high-dose modality[7–9]. Thus, it is important to reduce the number of CT phases in renalimaging, while still providing diagnostic images.
Studies have been conducted to reduce the number of phases usedin multiphase renal CT without compromising image quality andability to characterize renal lesions. A previous study by Yuh et al.reported that renal masses greater than 10 mm can be adequatelyassessed by EP [2]. Another study showed that nephrographic phase
, Department of Imaging andrth, Western Australia, 6845,.
l rights reserved.
gave the least diagnostic information in the evaluation of renal lesions[3]. Gakis et al. showed that nephrographic phase was better thanother phases in the detection of solid renal lesions; however, the CMPwas found to be better for the lesion characterization [4]. It is a well-known fact that every additional phase in CT examination increasesradiation dose to patients, thus increasing the risk of radiation-relatedmalignancy. Therefore, this study was conducted to confirm thenecessity of actual relevance of the nephrographic phase to theassessment of renal masses. We hypothesized that the nephrographicphase could be eliminated from the standard four-phase renal CT andthat a three-phase renal CT may be suggested as a routine protocol,while the nephrographic phase can be done at a different setting ifdeemed necessary.
2. Materials and methods
2.1. Patient population
This study was approved by the local ethical research committee,and written informed consent was obtained from all patients beforeundergoing the procedure. Thirty adult patients aged above 30 yearsold (age range: 35–85 years old, mean±S.D.: 64.2±12.0) withsuspicious renal masses detected either clinically or from otherradiological imaging were prospectively collected from December2008 to February 2011 at the University of Malaya Research ImagingCenter, Kuala Lumpur, Malaysia. There were 20 males and 10 females.The presenting symptoms were variable among these patients with 7(23%) patients presenting with microscopic hematuria, 3 (10%) withgross hematuria, 4 (13%) with loin pain, and 5 (17%) with loin painassociated with microscopic hematuria. Eleven (37%) patients wereincidentally noted to have renal lesions on ultrasound performed for

1038 N.-A. Songib et al. / Clinical Imaging 37 (2013) 1037–1042
nonurological-related symptoms. Patients with congestive heartfailure or chronic renal parenchymal disease were excluded fromthis study.
2.2. Four-phase CT scanning protocol
All patients underwent a four-phase contrast-enhanced multi-phase renal CT examination using the 16-slice multidetector CTscanner (16×0.75 mm, Siemens Medical Systems, Muenchen, Ger-many) with a tube current of 300 mA and tube voltage of 120 kVp.One hundred twenty milliliter of low osmolar nonionic contrastmedium (iodine concentration 300 mgI/ml) (Iopromide, Schering,Berlin, Germany) was injected at an injection rate of 4 ml/s. Four-phase scanning was performed including a preliminary phase, CMP at30 s, nephrographic phase at 90 s, and EP at 240 s post contrastinjection. Each phase was saved in 5-mm slice thickness in differentfiles and evaluated separately. The images obtainedwere also saved intwo different sets, with one dataset containing all four phases(preliminary, corticomedullary, nephrographic, and EPs) and anotherdataset of three phases comprising preliminary, corticomedullary, andEPs (excluding the nephrographic phase). The value of each phase inthe four-phase renal CT including the corticomedullary, nephro-graphic, and EP in the detection and characterization of renal lesion aswell as renal parenchyma and renal vein opacification were assessed.
2.3. Characterization of renal lesions
The number of lesions detected in each phase and the size andlocation of the lesion either in the renal cortex or medulla weredocumented. Lesions were grouped into four different sizes:b10 mm, 10–30 mm, 30–50 mm, and N50 mm. Lesions sized lessthan 10 mm were included for lesion detection but were excludedfor characterization due to its small size that can cause diagnosticdifficulty. Lesions sized 10 mm and larger were assessed in terms oflesion's margin; wall thickness; the component of the lesion such ascystic, fatty, solid or mixed; the enhancement pattern; and the lesion
Fig. 1. Reference images for visual conspicuity grading of renal lesion (arrow). Score 1: (A) poof margin; score 3: (C) good lesion conspicuity with delineation of almost the entire margin
attenuation (Hounsfield unit, HU) in three-phase and four-phase CTprotocols. Lesion attenuation was measured with attempt tomaintain the region of interest area at a size of at least 10 mm2, atcenter of the lesion or the most homogenously enhanced part of thelesion. For lesions poorly depicted in any of phases, the locationwhere lesion was seen on other phase images was used. Cysticlesions were characterized according to Bosniak classification. Thediagnostic criteria for renal malignancy included a solid lesion or acomplex cystic mass with thick irregular septa, thick calcifications,irregular inner wall, or presence of solid component. A scoringsystem is given to characterize these lesions into benign, indeter-minate, or malignant.
2.4. Image interpretation and assessment
Image interpretation and measurement of attenuation for all scanswere performed independently by two reviewers who had at least 4years of experience in abdominal radiology. For lesion detection, thereviewers independently analyzed images from each phase (unen-hanced, corticomedullary, nephrographic, and EP) separately andblindly within at least a 1-week interval to minimize bias. For lesioncharacterization, scans were interpreted during two different sessionswithin at least a 1-week interval. During the first session, a four-phased CT, combining unenhanced, corticomedullary, nephrographic,and EPs, was read, and during the second session, a three-phased CT,combining unenhanced, corticomedullary, and EPs, was evaluated.Interpretation discrepancies were resolved by consensus discussion.
Conspicuity of each focal lesion was evaluated qualitatively andquantitatively on images obtained from each scan phase. Qualitativeassessment was evaluated using a 5-point scoring scale to classifylesion conspicuity: score 0=nonvisualized; score 1=poorly visual-ized; score 2= fairly visualized, that is, adequately shown but withpoor delineation of margin; score 3=good conspicuity with delineationof almost the entire margin; and score 4=excellent conspicuity withclear demarcation of the entire margin. Standard reference images forgrading were preselected and provided to each radiologist (Fig. 1).
orly visualized lesion; score 2 (B) lesion adequately visualized but with poor delineation; score 4: (D) excellent lesion conspicuity with clear demarcation of the entire margin.
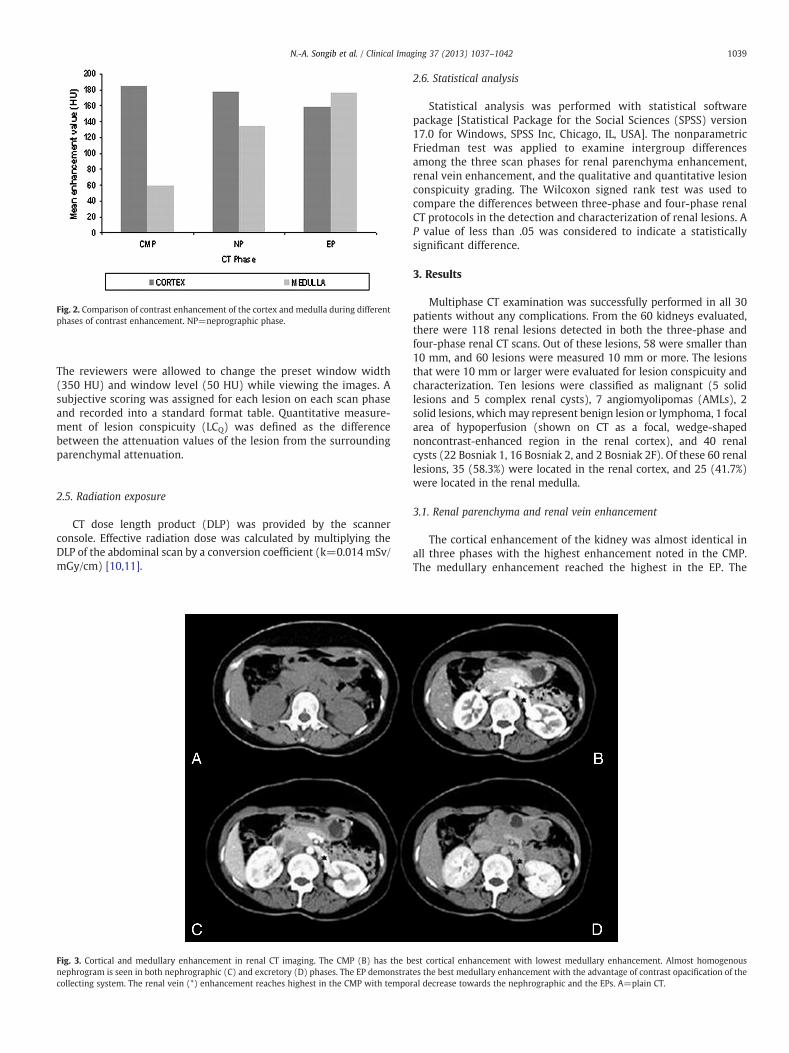
Fig. 2. Comparison of contrast enhancement of the cortex and medulla during differentphases of contrast enhancement. NP=neprographic phase.
1039N.-A. Songib et al. / Clinical Imaging 37 (2013) 1037–1042
The reviewers were allowed to change the preset window width(350 HU) and window level (50 HU) while viewing the images. Asubjective scoring was assigned for each lesion on each scan phaseand recorded into a standard format table. Quantitative measure-ment of lesion conspicuity (LCQ) was defined as the differencebetween the attenuation values of the lesion from the surroundingparenchymal attenuation.
2.5. Radiation exposure
CT dose length product (DLP) was provided by the scannerconsole. Effective radiation dose was calculated by multiplying theDLP of the abdominal scan by a conversion coefficient (k=0.014 mSv/mGy/cm) [10,11].
Fig. 3. Cortical and medullary enhancement in renal CT imaging. The CMP (B) has the bnephrogram is seen in both nephrographic (C) and excretory (D) phases. The EP demonstratcollecting system. The renal vein (*) enhancement reaches highest in the CMP with tempo
2.6. Statistical analysis
Statistical analysis was performed with statistical softwarepackage [Statistical Package for the Social Sciences (SPSS) version17.0 for Windows, SPSS Inc, Chicago, IL, USA]. The nonparametricFriedman test was applied to examine intergroup differencesamong the three scan phases for renal parenchyma enhancement,renal vein enhancement, and the qualitative and quantitative lesionconspicuity grading. The Wilcoxon signed rank test was used tocompare the differences between three-phase and four-phase renalCT protocols in the detection and characterization of renal lesions. AP value of less than .05 was considered to indicate a statisticallysignificant difference.
3. Results
Multiphase CT examination was successfully performed in all 30patients without any complications. From the 60 kidneys evaluated,there were 118 renal lesions detected in both the three-phase andfour-phase renal CT scans. Out of these lesions, 58 were smaller than10 mm, and 60 lesions were measured 10 mm or more. The lesionsthat were 10 mm or larger were evaluated for lesion conspicuity andcharacterization. Ten lesions were classified as malignant (5 solidlesions and 5 complex renal cysts), 7 angiomyolipomas (AMLs), 2solid lesions, whichmay represent benign lesion or lymphoma, 1 focalarea of hypoperfusion (shown on CT as a focal, wedge-shapednoncontrast-enhanced region in the renal cortex), and 40 renalcysts (22 Bosniak 1, 16 Bosniak 2, and 2 Bosniak 2F). Of these 60 renallesions, 35 (58.3%) were located in the renal cortex, and 25 (41.7%)were located in the renal medulla.
3.1. Renal parenchyma and renal vein enhancement
The cortical enhancement of the kidney was almost identical inall three phases with the highest enhancement noted in the CMP.The medullary enhancement reached the highest in the EP. The
est cortical enhancement with lowest medullary enhancement. Almost homogenouses the best medullary enhancement with the advantage of contrast opacification of theral decrease towards the nephrographic and the EPs. A=plain CT.

Fig. 4.Mean visual conspicuity of different renal lesions during different phases of renalCT scans.
1040 N.-A. Songib et al. / Clinical Imaging 37 (2013) 1037–1042
enhancement of the renal cortex and medulla is almost equivalent inthe nephrographic and EP with least difference seen in the EP, givinga more homogenous nephrogram in the EP (Figs. 2, 3). The renal veinenhancement reached the highest in the CMP. There is temporaldecrease of renal enhancement from corticomedullary to EP (Fig. 3).
3.2. Lesion detection and conspicuity
There were only 9 (15%) lesions that were best visualized in thenephrographic phase, while 22 (36.7%) and 29 (48.3%) lesions werebetter visualized in the corticomedullary and EPs, respectively. Therewas significant difference of lesion conspicuity between corticomedul-lary or EP and the nephrographic phase (Pb .05). All of the three phases(corticomedullary, nephrographic, and EP) were equally good in thedetection of cortical renal cysts; however, the CMPwas inferior to otherphases in the detection of medullary cysts. In contrast, the CMPwas thebest in the detection of solid renal lesions (Fig. 4). All the three phaseshad almost similar ability in the detection of AML (Figs. 5, 6).
The CMP had the highest conspicuity value for the cortical lesions,though no significant difference was found between the three phases,and the EPhas the highest conspicuity value formedullary lesions (Fig. 7).
3.3. Conspicuity and attenuation of malignant lesions
Of 10 malignant lesions, only 1 (10%) was best visualized in thenephrographic phase, while 3 (30%) and 6 (60%) lesions were bestvisualized in the corticomedullary and EPs, respectively. A significantdifference of conspicuity of malignant lesions was found between themaximum conspicuity in either the corticomedullary or EP and thenephrographic phase (Pb .05). The highest enhancement of malignanttumors was achieved in the CMP with washout seen in thenephrographic phase. EP gave the least tumor enhancement;however, there was no significant difference of the enhancementbetween the nephrographic and EPs (PN .05) (Fig. 8).
Fig. 5. Four-phase renal CT shows a left AML (arrow) that has excellent visibility in all phasesof AML and the renal parenhyma. A=plain CT, B=CMP, C=nephrographic phase, D=EP.
3.4. Four-phase versus three-phase renal CT protocols
All lesions detected in the four-phase renal CT were also detectedin the three-phase renal CT with no significant difference noted(PN .05). There was also a good correlation between the four-phaserenal CT and three-phase renal CT in characterizing renal lesions. Nosignificant difference was reached for both sets of CT to characterizethe renal lesions (PN .05). There was also no significant difference indegree of confidence of both reviewers in diagnosing renal lesionsusing either four-phase or three-phase renal CT (PN .05).
3.5. Radiation dose between four-phase and three-phase CT protocols
The mean DLP of four-phase CT and three-phase CT protocols was1486 mGycm and 1164 mGycm, with corresponding effective dose
due to its fatty component causing marked difference between the negative attenuation

Fig. 6. Four-phase renal CT shows left RCC (arrow) that demonstrates best tumor enhancement in the CMP (B), compared to other phases. A=plain CT, C=nephrographic phase, andD=EP.
1041N.-A. Songib et al. / Clinical Imaging 37 (2013) 1037–1042
being 20.8 mSv and 16.3 mSv, respectively. There is approximately22% reduction of radiation dose when the nephrographic phase wasexcluded from the standard four-phase renal CT protocol.
4. Discussion
Multiphase renal CT has been widely used in characterization ofrenal tumors and preoperative staging of RCC due to its highsensitivity and specificity to detect and characterize the renal lesions[12–14]. A potential criticism to the four-phase CT protocol is anincrease in radiation dose to the patient. This study shows that theroutine four-phase renal CT can be replaced with a three-phaseprotocol with elimination of the nephrographic phase withoutcompromising diagnostic ability.
A four-phase CT protocol is routinely used in the detection anddiagnosis of renal lesions. Unenhanced scanning represents a baselinefor measurement of lesion enhancement after iv administration ofcontrast medium. CMP is useful for detection of the renal arteries andvascular anomalies. Nephrographic phase allows maximal opacifica-tion of renal veins and staging of the renal disease, while EP has beenreported as the important phase for detection and characterization ofrenal masses.With a delay of 4min, EP demonstrates the advantage ofsimultaneous renal excretion and evaluation of the relation between
Fig. 7. Lesion conspicuity of cortical and medullary renal lesions between differentphases of renal CT imaging.
the neoplasm and the collecting systems [15,16]. This analysis onrenal enhancement showed that the cortical enhancement among allthree phases is almost identical with the highest enhancement notedin the CMP. This is contrary to previous studies that showed thatcortical enhancement was best seen in the nephrographic phase[13,17]. Results of this study indicated that the renal medulla wasleast enhanced in the CMP but demonstrated temporal increase withmaximum enhancement in the EP. These findings can be correlated tothe renal histoanatomical structures whereby the contrast flows intothe filtering portion of a nephron located in the cortex followed by arenal tubule that passes from the cortex deep into the medullarypyramids, which later drains into the collecting duct. This probablyalso explains why cortical lesions were best demonstrated in the CMPand why medullary lesions were best demonstrated in the EP. Theenhancement of the cortex and medulla is almost equivalent in thenephrographic and EP with least difference seen in the EP, giving amore homogenous nephrogram in this phase. Theoretically, anylesion occupying both cortical and medullary regions is bestdemonstrated in the EP.
This study was not confined to the evaluation of RCC but lookedinto various renal lesions, which were detected in the studypopulation. Most of the patients were symptomatic, as this was the
Fig. 8. Enhancement of malignant lesions during different phases of renal CT scans.

1042 N.-A. Songib et al. / Clinical Imaging 37 (2013) 1037–1042
indication for a renal-specific CT scan. Although Schlomer et al. notedthat most small renal lesions are found incidentally, the articleshowed that they reviewed CT, ultrasound, and MRI investigationsthat were nonrenal specific [18]. Of 30 patients with a total of 118lesions being detected, most of them were simple renal cystsaccounting for approximately 89% of total lesions. Fifty-eight (49%)lesions were smaller than 10 mm, most of which were likely to besimple cysts, and 60 (51%) lesions were larger than 10 mm. From aclinical perceptive, the CMP is less sensitive in detecting small renallesions as noted in a previous study by Szolar et al. [6], in which thenephrographic and EPs were found to have similar ability in detectingsmall renal lesions measuring less than 10 mm. Again, results of thisstudy confirmed the possibility of eliminating nephrographic phasewithout affecting detection of both small and large renal lesions.
The optimum enhancement of malignant tumors was bestachieved in the CMP with maximum peak enhancement of 210HU(mean=146.7), as most of malignant lesions particularly RCC andurothelial tumors are hypervascular and enhanced early following ivcontrast due to their supply by the renal artery [17,19]. Most of theselesionswashoutduring thenephrographic (maximumenhancement=140HU, mean of 111.6) and EP (maximum enhancement=137HU, mean of 94.2). This is consistent with the lesion conspicuityevaluation that showed significant difference of conspicuity ofmalignant lesionbetweenthecorticomedullaryandthenephrographicphase(Pb .05)as90%ofthemalignantlesionswerebestvisualizedintheCMPwhileonly10%lesionswerebettervisualizedinthenephrographicphase. Tumor enhancement was the least in the EP due to contrastwashout from the tumors in this delayed phase, which is consistentwith a previous study [20].
The effective doses related to the four-phase and three-phase renalCT used in this study were 20.8 mSv and 16.3 mSv, which issignificantly higher than that reported in a recent study by Tsili et al.[21]. This is mainly due to the use of high tube current in this study,despite using tube current modulation. With recent multislice CTmodels of 64-slice and post-64, tube current modulation across thepatient's body during tube rotation is available with reduction ofeffective dose achieved satisfactorily [22–24].
The main limitation of this study was the small samples size withrelatively low variants of renal pathology. This was due to theinclusion/exclusion criteria and patient willingness to participate inthe study, as well as the general load of patients undergoingmultiphasic renal CT in our center. Out of 118 lesions, only 60 lesionscould be evaluated for characterization. Most of these lesions werebenign cysts that contributed to most of the lesion conspicuity. Thereis no definitive biopsy performed—just consensus diagnosis fromimaging based on enhancement appearances.
Another limitation is the suboptimal renal perfusion imaging thatleads to different or delayed attenuation of the renal enhancement.This is due to the use of fixed scan delays for the four-phase renal CTprotocol. A bolus-tracking technique has becomewidely available andhas been increasingly used to optimize scan timing in individualpatients to compensate for the variability of circulation time betweenpatients. Goshimat et al. reported that the bolus tracking techniqueimproved contrast enhancement in multiphase renal CT imaging ofthe kidney and renal vessels as the scan delays were based onindividual patients [25].
In conclusion, excluding the nephrographic phase from thestandard four-phase renal CT protocol does not reduce the ability todetect and characterize renal lesions. Therefore, a combination of
plain, corticomedullary, and EPs is adequate to assess renal lesionswith the advantage of lowering radiation dose.
References
[1] Surveillance Epidemiology and End Results, SEER Cancer Statistics Review 1975–2008. National Cancer Institute; 260–276. Available at URL: http://seer.cancer.gov/faststats.
[2] Yuh BI, Cohan RH, Francis IR, Korobkin M, Ellis JH. Comparison of neprographicwith excretory phase helical computed tomography for detecting and character-izing renal masses. Can Assoc Radiol J 2000;51:170–6.
[3] Dahlman P, Semenas E, Brekkan E, Bergman A, Magnusson A. Detection andcharacterization of renal lesions by multiphasic helical CT. Acta Radiol 2000;41:361–3666.
[4] Gakis G, Kramer U, Schilling D, Kruck S, Stenzl A, Schlemmer HP. Small renaloncocytomas: differentiation with multiphase CT. Eur J Radiol 2011;80:274–8.
[5] Bosniak MA, Rofsky NM. Problems in the detection and characterization of smallrenal masses. Radiology 1996;198:638–41.
[6] Szolar DH, Kammerhuber F, Altziebler S, Trillich M, Breinl E. Multiphase helical CTof kidney: increased conspicuity for detection and characterization of small(b3cm) renal masses. Radiology 1997;202:211–7.
[7] Brenner DJ, Hall EJ. Computed tomography—an increasing source of radiationexposure. N Engl J Med 2007;357:2277–84.
[8] Hausleiter J, Meyer T, Hermann F, Hadamitzky M, Kreb M, Gerber TC, et al.Estimated radiation dose associatedwith cardiac CT angiography. JAMA 2009;301:500–7.
[9] Committee to Assess Health Risks from Exposure to Low Levels of IonizingRadiation; Nuclear and Radiation Studies Board, Division on Earth and Life Studies,National Research Council of the National Academies. Health Risks From Exposureto Low Levels of Ionizing Radiation: BEIR VII Phase 2. Washington, DC: TheNational Academies Press; 2006.
[10] HudaW, Magill D, HeW. CT effective dose per dose length product using ICRP 103weighting factors. Med Phys 2011;38:1261–5.
[11] Huda W, Tipnis S, Sterzik A, Schoepf UJ. Computing effective dose in cardiac CT.Phys Med Biol 2010;55:3675–84.
[12] Kopka L, Fisher U, Zoeller G, Schmidt C, Ringert RH, Grabbe E. Dual phase helical CTof the kidney: value of the corticomedullary and nephrographic phase of renallesions and pre operative staging of renal cell carcinoma. AJR Am J Roentgenol1997;169:1573–8.
[13] Birnbaum BA, Jacobs JE, Ramchandani P. Mulltiphase renal CT: comparison of renalmass enhancement during the corticomedullary and nephrographic phases.Radiology 1996;200:753–8.
[14] Cohan RH, Sherman LS, Korobkin M, Bass JC, Francis IR. Renal masses: assessmentof corticomedullary phase and nephrographic phase CT scans. Radiology1995;196:445–51.
[15] Coll DM, Herts BR, Davros WJ, Uzzo RG, Novick AC. Preoperative use of 3D volumerendering to show renal tumors and renal anatomy. Radiographics 2000;20:431–8.
[16] Hsu RM, Chan DY, Siegelman SS. Small renal cell carcinomas: correlation of sizewith tumor stage, nuclear grade, and histologic subtype. AJR Am J Roentgenol2004;182:551–7.
[17] Kocakoc E, Bhatt S, Dogra VS. Renal multidetector row CT. Radiol Clin North Am2004;43:1021–47.
[18] Schlomer B, Figenshau RS, Yan Y, Ventakesh R, Bhayani SB. Pathological features ofrenal neoplasms classified by size and symptomatology. J Urol 2006;176:1317–20.
[19] Herts BR, Coll DM, Lieber ML, Streem SB, Novick AC. Triphasic helical CT of thekidneys: contribution of vascular phase scanning in patients before urologicsurgery. AJR Am J Roentgenol 1999;173:1273–7.
[20] Shebel HM, Elsayes KM, Sheir KZ, Abou EL, Atta HM, El-Sherbiny AF, Ellis JH, et al.Quantitative enhancement washout analysis of solid cortical renal masses usingmultidetector computed tomography. J Comput Assist Tomogr 2011;35:337–42.
[21] Tsili AC, Argyropoulou MI, Gousia A, et al. Renal cell carcinoma: value ofmultiphase MDCT with multiplanar reformations in the detection of pseudocap-sule. AJR Am J Roentgenol 2012;199:379–86.
[22] Kalra MK, Maher MM, Toth TL, Schmidt B, Westerman BL, Morgan HT, et al.Techniques and applications of automatic tube current modulation for CT.Radiology 2004;233:649–57.
[23] Sun Z, Choo GH, Ng KH. Coronary CT angiography: current status and continuingchallenges. Br J Radiol 2012;85:495–510.
[24] Sun Z, Cao Y, Li H. Multislice computed tomography angiography in the diagnosisof coronary artery disease. J Geriatric Cardiol 2011;8:104–13.
[25] Goshima S, Kanematsu M, Nishibori H, Kondo H, Tsuge Y, Yokoyama R, et al. Multi-detector row CT of the kidney: optimizing scan delays for bolus trackingtechniques of arterial, corticomedullary, and nephrographic phases. Eur J Radiol2007;63:420–6.