Multinational Production Data Setfelix-tintelnot.wdfiles.com/.../DocumentationRRTDec2013.pdffor the...
23
Multinational Production Data Set Natalia Ramondo * Andr´ es Rodr´ ıguez-Clare † Felix Tintelnot ‡ UC-San Diego UC Berkeley and NBER UChicago and Princeton December 18, 2013 Abstract We present a comprehensive data set on the bilateral activity of multinational firms, analogous to the data available for international bilateral trade flows. We focus on two variables: affiliate sales and the number of affiliates across country pairs. Each observation is an average over the period 1996-2001 and an aggregate over all non-financial sectors in the economy. Our basic data are from UNCTAD and include 61 countries. We implement an extrapolation procedure that fills in missing values using, alternately, FDI stocks and the bilateral number of M&A transactions. * E-mail: [email protected] † E-mail: [email protected] ‡ E-mail: [email protected]
Transcript of Multinational Production Data Setfelix-tintelnot.wdfiles.com/.../DocumentationRRTDec2013.pdffor the...

Multinational Production Data Set
Natalia Ramondo∗ Andres Rodrıguez-Clare† Felix Tintelnot‡
UC-San Diego UC Berkeley and NBER UChicago and Princeton
December 18, 2013
Abstract
We present a comprehensive data set on the bilateral activity of multinational firms, analogous
to the data available for international bilateral trade flows. We focus on two variables: affiliate
sales and the number of affiliates across country pairs. Each observation is an average over the
period 1996-2001 and an aggregate over all non-financial sectors in the economy. Our basic data
are from UNCTAD and include 61 countries. We implement an extrapolation procedure that fills
in missing values using, alternately, FDI stocks and the bilateral number of M&A transactions.
∗E-mail: [email protected]†E-mail: [email protected]‡E-mail: [email protected]
1 Introduction
Over the last decades, worldwide sales of foreign affiliates of multinational firms have grown more
rapidly than trade. By 2004, foreign affiliate sales (what we will henceforth refer to as MP, for multi-
national production) were already twice as high as world exports. In spite of its rising importance,
MP has not received as much attention in the literature as international trade. One key reason is the
lack of systematic data on bilateral MP flows for a large set of countries.
There has been an important effort by UNCTAD to put together a worldwide data set on MP by
collecting information from national agencies. Unfortunately, unlike the data on international trade
flows, in the case of the activity of multinational firms—even for the set of rich OECD countries—
the data have many missing observations, limited time period, and sectoral coverage.1 This leads to
two major concerns: first, the missing data are likely to include a particularly large number of zero
or small MP flows, thus creating a sample selection problem in the analysis of the available data;
second, the missing data may add up and distort aggregate values, leading to biases in the domestic
MP shares, which is a key statistic to compute the gains from MP (see Ramondo and Rodriguez-
Clare, 2013). In this paper we complement the UNCTAD with other sources of data and in that way
significantly reduce the number of missing observations.
We restrict our attention to 61 countries, which entail 3,660 (60× 61) possible observations. Each
observation is an average over the period 1996-2001, and an aggregate over non-financial sectors.2
As mentioned above, the UNCTAD data set has many missing observations, both regarding affiliate
sales and the number of affiliates across country pairs. We use two types of data to fill in the missing
observations. First, we use data on Mergers and Acquisitions (M&A) from Thomson and Reuters.
Cross-border M&A are a natural candidate to use in any extrapolation procedure of affiliates’ activity
because they are the predominant form of entry of a foreign firm into a country (Nocke and Yeaple,
2007). Second, as an alternative extrapolation procedure for affiliate sales, we use (bilateral) Foreign
Direct Investment (FDI) stocks from the balance of payment of countries (international investment
1By contrast, the data for bilateral trade, from Feenstra et al. (2005), are available for a set of more than 200 countries,for the period 1962-2000, classified by four-digit SITC. Countries with fairly comprehensive data on inward and outwardmultinational firms’ activities are for example the United States (Bureau of Economic Analysis—BEA) and Germany (Ger-man Bundesbank).
2Disaggregating bilateral MP flows into various sectors is an important but challenging task that we do not tackle here.Fukui and Lakatos (2012) and Alviarez (2013) are important steps in that direction. Fukui and Lakatos use Eurostat FATSdata and extrapolates missing values from a gravity regression. Alviarez uses unpublished OECD and Eurostat FATS datato assemble a dataset of thirty-five countries, nine tradable sectors, and three nontradable sectors. Unfortunately, threequarters of the source-host-sector relationships are zeros or missing.
1
position), and collected by UNCTAD. Most countries record this variable, and hence, the number of
missing observations is substantially lower for FDI stocks than for MP sales. Both of these additional
sources of data are highly informative about bilateral MP. For the set of country pairs for which
we have data, the correlation between bilateral affiliate sales and bilateral M&A transactions or FDI
stocks is very high. The correlation between the bilateral number of affiliates and the bilateral count
of M&A transactions is also very high.
Using our extrapolation procedure brings down the number of missing values for bilateral sales
and number of affiliates from around 70 percent of all possible country pairs to 40 percent. The
countries that exhibit larger improvements in the data, as expected, are poorer countries for which
missing value in the original data are pervasive. For instance, for Hungary and Russia, the share of
sales of foreign affiliates in their territory increases by more than 50 percent using the imputed data.
Among poorer countries, the improvement is very large regarding the estimates of the share of sales
of own affiliates abroad: Brazil, Greece, and India, for instance, increase their shares by almost two
fold.
2 Data Description
2.1 Data Sources
The construction of the MP database combines several sources of data. The main information source
is published and unpublished data by UNCTAD (the Investment and Enterprise Program, FDI Statis-
tics, FDI Country Profiles).3 The data on sales by affiliates of foreign firms include both local sales
and exports to any other country outside host country, including exports to the home country. Ad-
ditionally, the UNCTAD data include the number of local affiliates owned by foreign firms, as well
as their employment and asset value. Moreover, bilateral FDI flows and stocks from the Balance of
Payments are also included.
A foreign affiliate is defined as a firm who has more than ten percent of its shares owned by a
foreigner. Some countries report magnitudes for majority-owned affiliates only (more than 50 percent
of ownership). Nonetheless, majority-owned affiliates are the largest part of the total number of
foreign affiliates in a host economy. The data cover, for the most part, non-financial affiliates in all
3Unpublished data are available upon request at [email protected].
2
sectors.4 Unfortunately, systematic data by industry or sector are not available. The data period
considered is 1996-2001. Since data availability varies by year and country we use an average of the
variable of interest over those years.5
Table 1 shows, for selected countries, the source of information at the country level as well as the
characteristics of the data in terms of coverage, availability, criteria of ownership, for bilateral affiliate
sales and number of affiliates (inward and/or outward).6 All countries in our sample report bilateral
FDI stocks for the Balance of Payments to UNCTAD.
A country that reports multinational activity can present magnitudes for local affiliates of foreign
firms (inward), and foreign affiliates of local firms (outward), or both. Our criteria is that we first
choose the data as reported by the source (home) country; if this country does not report any data,
we choose as source of information the receiving (host) country. Our criteria reverses the one uses
for trade data, which gives priority to the data on trade flows as reported by the importer country.
One reason to reverse the criteria is that it is more likely that if statistics are not reported by
”Ultimate Beneficiary Owner” (UBO) in the receiving country, there would be misreporting of the
country of origin of such flow. Capturing it from the source country might attenuate this type of
problems with the data recording. For instance, suppose that the U.S. operations of a firm in France
are owned by a U.S. firm in Netherlands, which in turn depends directly from the parent in the
United States. If French statistics followed the UBO criteria (which, in fact, they do not), they would
correctly classify this subsidiary in France as American; if they did not follow the UBO criteria, they
would incorrectly classify this affiliate as Dutch, and hence, underreporting affiliate revenues from
the United States and over-reporting them from Netherlands . In turn, in the U.S. statistics, this
French affiliate will appear as French, not Dutch; moreover, in the Dutch statistics this firm, correctly,
will not appear as a Dutch multinational with affiliates in French. Hence, giving priority to the
statistics reported by the source country will attenuate these reporting problems.
There is an additional source of misreporting when the host, rather than the source, country is
considered. The revenues of affiliates from i in n reported by n may be subject to an underreporting
problem because the destination country n may report only revenue from local sales of the affiliates
as opposed to their revenues from sales to all countries. Unfortunately, the documentation provided
4A few countries report data only for foreign affiliates in manufacturing. For consistency of our procedure acrosscountries, we treat these observations as missing observations.
5More recent years (2004) are available at UNCTAD for very few countries and variables; we chose not to include thosedata because they are very sparse.
6This is the group of countries for which UNCTAD lists the national statistical source.
3

by UNCTAD, for each country, does not clearly indicate if the reported magnitudes refer to total or
only local sales. Our criteria tries to get around this underreporting problem.
All that said, we find that for MP on the aggregate the numbers would be almost identical if
priority were given to the information coming from the host country. In the original sample of 159
countries from UNCTAD, for the period 1990-2002, the average sales reported by the source is U$
13,009 million, while the same average when reported by the host country is U$ 12,770 million. The
correlation between the two series is 0.98, with no country below 0.90. For the sample period 1996-
2001 the averages are U$ 9,992 and U$ 9,651 million, respectively. Regarding the bilateral number
of affiliates, using as criteria records by the source first and by the host country second delivers
averages over the period 1990-2002 of 128, while the reverse criteria delivers 123 affiliates for the
average country-pair. The correlation between the two series is 0.94, with no country below 0.88.
Our second main source of data is the Thomson and Reuters Financial data set that records merg-
ers and acquisitions (M&A) across country pairs, for the period 1990-2010, in all sectors. To our
knowledge, this database is the most comprehensive description of domestic and international M&A.
Consistent with the UNCTAD data, we restrict the sample to the period 1990-2001, accumulating the
number of M&A transactions for each country pair during that period. Following the criteria of the
UNCTAD data, we also restrict our sample to target firms in the non-financial sectors that are ac-
quired by firms in all sectors. Even though the Thomson and Reuters data records both the value and
the number of bilateral M&A transactions, we restrict our attention to the count data, since the value
of M&A transactions is only recorded for publicly listed companies.
A major advantage of the M&A database is that it has a much broader coverage of country-pair
transactions than the available UNCTAD data on affiliate sales. Furthermore, M&A transactions
are a good proxy of economic activity in a country, and hence, a good predictor of sales of firms.
Therefore, as discussed further below, we will use the substantial correlation between the number of
acquisitions and the sales of affiliates to predict the missing values of MP.
2.2 Sample Selection
The UNCTAD data include a total of 151 countries. We select countries that have a real GDP per
capita of more than 5,000 US dollars (PPP-adjusted) and a population of more than three million. We
add China, India, and Indonesia, to the sample. In total, our data set contains 61 countries which
entails 3,660 (61× 60) bilateral (ordered) pairs.
4

Table 2 lists the sample of countries. Our sample represents more than 90 percent of world GDP
and almost 95 percent of world’s FDI inward and outward stocks, respectively, for the year 2000.7
2.3 Zeros and Missing Values
A pervasive problem with the UNCTAD data on bilateral sales of affiliates is the presence of missing
values. But in our sample, we not only encounter missing values, but true bilateral zero MP val-
ues. The fairly comprehensive M&A data will help us to better estimate missing values for bilateral
affiliate sales and number of affiliates, as explained below.
Table 3 summarizes the number of observations with missing and non-missing values, for affiliate
sales and number of affiliates from UNCTAD, and the number of M&A transactions from Thomson
and Reuters.
Out of the 3, 660 (61 × 60) possible bilateral relationships, we can assign a non-missing value to
2,436 and 2,365 pairs, for affiliate sales and number of affiliates, respectively. We also report non-
missing values for FDI stocks across country pairs. We assign a zero value for sales, number of
affiliates, and FDI stock, if and only if the six measures of bilateral multinational activity recorded
in the UNCTAD data set (i.e., FDI stocks and flows, affiliate sales, assets, and employment, and
number of affiliates) are all zero or missing for the period 1996-2001. As it can be seen in Table 3,
in the UNCTAD data, FDI stocks from the Balance of Payment of countries have substantially better
coverage (3, 411 non-missing values) than the variables directly linked to the activity of affiliates. We
assume that there is no missing values in the M&A data; a zero value simply means there was not an
M&A transaction in the period 1990-2001.
We will need to estimate 1,224 observations for bilateral affiliate sales, and 1,295 for the number
of affiliates across country pairs. Some of those missing values will be zeros. Still, we will be left with
missing observations as explained below. Table 4 records missing values from the UNCTAD data,
by country, both for inward and outward magnitudes of affiliate sales, number of affiliates, and FDI
stocks.7Aggregate FDI stocks by country are available at http://unctadstat.unctad.org.
5

3 Extrapolation Procedure
We exploit the high and tight correlation between the number of cross-M&A deals and either affiliate
sales or number of affiliates to estimate missing values. Alternately, we estimate affiliate sales using
FDI stocks.
The correlation between (1) affiliate sales of firms from country i in country n as a share of gross
production in non-financial sectors in n, and (2) the number of M&A transactions by firms from i in n,
as a share of the total number of transactions in n, is 0.80 in logs (0.43 in levels), while the correlation
between the bilateral number of affiliates and the number of M&A transactions is 0.82 in logs (0.70 in
levels). Furthermore, the correlation between bilateral affiliate sales and FDI stocks, both as a share
of gross production in non-financial sectors in the destination country, is very high—0.87 in logs and
0.47 in levels.
Figure 1 shows the strong positive correlation between the measures of MP activity, M&A trans-
actions, and FDI stocks, with more dispersion in the center panel related to the bilateral number of
affiliates.
We start our extrapolation procedure by better estimating zero MP flows. In particular, we assign
a zero MP value by country i in n if and only if the six measures of bilateral multinational activity
recorded in the UNCTAD data set are all zero or missing for the period 1996-2001, as we did above,
and there are no M&A transactions between 1990 and 2001 by a firm from i in n. It can be the case that,
using only UNCTAD data, we assigned a zero value for MP flows from country i to n, but adding
the information on M&A leads us to change that observation from being a zero to being a missing
(but positive) value, as long as we observe some positive M&A transaction by firms from i in n, in
the period 1990-2001. Hence, after applying the extrapolation procedure, the number of observations
with zero MP should (weakly) decrease.
The positive values for affiliate sales, number of affiliates, M&A transactions, and FDI stocks are
used in the procedure described below. Denote by Yni total sales of affiliates from i in n, Mni total
number of affiliates from i in n, Qni total number of M&A transactions by firms from i in n, and
Sni FDI stocks from i in n. Our baseline regressions are the following (robust standard errors are in
parenthesis):
log Yni = 1.002 logQni +Oi +Dn + εni,
(0.057)(1)
6

logMni = 0.96 logQni +Oi +Dn + νni,
(0.041)(2)
andlog Yni = 0.75 logSni +Oi +Dn + υni,
(0.045)(3)
for i 6= n, and two sets of country fixed-effects, Oi and Dn. In order to have a minimum number
of observations to reasonably pin down the fixed effects of a country as both a source and a host,
we only include those country pairs in the regressions for which each country has at least three non-
missing data points in UNCTAD as a source or destination country, respectively.8 Notice that the
source and destination country fixed effects, among other things, pick up variations across countries
in average sales, and in the pattern of greenfield FDI versus M&A.9 As robustness (not shown), we
also interact our main regressor (i.e. Qni or Sni) with real GDP per capita in the host country, but
such interaction is never significant.
We use the results of these regressions to impute the missing values for bilateral foreign affili-
ate sales and number of foreign affiliates across country pairs. The results from this procedure are
described in the next section.
3.1 Results
To be clear, the possibilities after applying our extrapolation procedure are the following: (1) We can
have a zero value that becomes a positive value because all UNCTAD variables were zero or missing
but we have some M&A transactions, or stay as a zero value; and (2) We can have a missing value
that becomes a positive value because we did not have any UNCTAD data for affiliate sales (and/or
number of affiliates), but we have some positive value for M&A transactions, or stays as a missing
value.
Notice that we can have a missing value for affiliate sales, a positive FDI stock, and zero M&A
8The countries that fall into this category for at least one of the three equations above are: Cuba, Guatemala, Lebanon,Libya, Puerto Rico, Slovakia, Turkmenistan, and Tunisia.
9Firms can establish foreign affiliates either via greenfield investment or via acquisition of an existing foreign company.One might think that, if there is a large set of firms available in a related sector in the destination country, the newlyentering firm may be more likely to acquire an existing firm than to establish a new affiliate via greenfield investment.Using new data collected by the German Bundesbank on the mode of entry of newly established affiliates owned byGerman companies, from 2005-2009, we find that the ratio of greenfield to M&A investments is falling in real GDP percapita of the destination country.
7

transactions in which case this observation remains missing when we consider M&A transactions in
the extrapolation procedure, but become positive when we consider FDI stocks instead. Conversely,
we can have a missing value for FDI stocks, a missing value for affiliate sales, and a positive number
of M&A transactions in which case this observation remains missing when we consider FDI stocks
in the extrapolation procedure, but become positive when we consider M&A transactions instead.
There are 361 observations that fall into the first case and hence, remain as missing values for the
extrapolation that uses the number of M&A transactions, but not in the one that uses FDI stocks.
Analogously, there are only 13 observations that fall into the second case and hence, remain as miss-
ing values for the extrapolation that uses FDI stocks, but become positive for the procedure that uses
the number of M&A transactions.
Additionally, we can have a positive value for affiliate sales (and/or number of affiliates) from
UNCTAD, but zero M&A transactions during the period and hence, such observation is not included
in the extrapolation procedure. There are 177 observations with a positive value for sales and zero
M&A for the period 1990-2001 (157 observations if we consider number of affiliates); these observa-
tions present non-missing values before and after the extrapolation procedure.
Finally, it is not possible to have a missing value in the UNCTAD data that becomes zero after we
consider the M&A data because this is a case in which, even though the number of M&A transactions
is zero for the period 1990-2001, some variable in the UNCTAD data set, other than affiliate sales
(and/or number of affiliates), is not missing, indicating that the country pair was involved in an MP
relationship.
Analogously to results in Table 3, we present in Table 5 the numbers of missing and non-missing
values implied by our extrapolation procedure. Out of the 3,660 possible bilateral MP relationships,
almost 45 percent are zeros; the remaining 55 percent present some MP activity. We are still left
with 802 positive missing values for affiliate sales (794 for number of affiliates) because these are
observations for which we do not observe any M&A transaction during the period 1990-2001 and,
hence, we are not able to apply the extrapolation procedure. Using FDI stocks, brings the number
of missing positive observations to 727. Overall, extrapolating bilateral affiliate sales and number of
affiliates using M&A transactions allows us to more than double the number of positive observations
of all possible country pairs. For some countries, the coverage is perfect after extrapolation. For
example, between the 12 Western European and North American countries used in Tintelnot (2012),
all values of affiliate sales are positive and non-missing; similarly for the 18 OECD countries used in
8

Arkolakis, Ramondo, Rodriguez-Clare, and Yeaple (2013).
Table 6 , analogously to Table 4, contains the number of missing values by country with respect to
all 60 partner countries after applying the extrapolation procedure. One thing is worth noticing here.
For instance, for the United States, the number of missing values for affiliate sales went from 4 to 5
when the imputed data uses the number of M&A transactions. Is that possible? The answer is yes.
This is a case in which a zero observation in the UNCTAD data becomes missing after applying the
extrapolation procedure even though we observe some M&A transaction. This happens in very few
cases in which the extrapolation in (1) cannot be completed because there is not a minimum number
of observations to pin down the origin or destination fixed effects. In the example of the United
States, Puerto Rico does not have enough observations to pin down the origin fixed effects, so that
the missing value for affiliate sales cannot be estimated with M&A transactions.
Table 7 presents sales of affiliates, as a share of non-financial gross production (see the Appendix
for a description of these data), both inward (∑
i 6=n Yni/Yn) and outward (∑
n6=i Yni/Yi), both from
the extrapolation procedures using the number of M&A transactions and FDI stocks, respectively; we
refer to these shares as inward and outward MP shares, respectively.10 We also present the number
of foreign affiliates and affiliates abroad into and from each country, as well as the raw data.
The inward MP share is an important variable since this is the variable that some models use
to evaluate the gains of moving from isolation to the situation with the observed MP flows. It is
important to have an accurate estimate of inward MP shares: countries with higher inward MP shares
are more open, and hence, have higher gains.
As expected, the imputed data deliver higher MP activity, both in terms of total sales and number
of affiliates. While the raw data delivers an average inward MP share of 14.6 percent, the imputed
data reaches 17 percent. At the same time, the average number of foreign affiliates into a receiving
country increases from 1,525 in the raw data to 1,843 in the imputed data. Similar increases are
present for outward MP magnitudes. Improvements with respect to the raw data are heterogenous
across countries. Countries with very complete data, such as the United States and Germany, do
not improve after applying the extrapolation procedure. But some countries in the sample present
very large improvements. For instance, for Belgium, Colombia, Hungary, Slovakia, Lithuania, and
10The data are, of course, available in levels, without any normalization, giving the user the choice about her mostconvenient normalization. Notice that some non-OECD countries present very high inward MP shares, such as China orSingapore (for which this share is even bigger than one). However, one should keep in mind that the denominator of suchshares is imputed for most of non-OECD countries, as described in the Appendix.
9

Russia, inward MP shares increase by more than 50 percent using the imputed data. Among poorer
countries, the improvement is very large regarding outward MP: Brazil, Greece, India, Uruguay, and
Poland, for instance, increase their outward MP shares by almost two fold, reaching almost a four-
fold increase in the case of Argentina.
Additionally, using FDI stocks or the number of M&A transactions for extrapolation give very
similar results in terms of outward and inward MP, on average. There is, however, considerable
variation across countries between the two extrapolation methods. For instance, while for Chile the
improvement with respect to the raw data on inward MP shares is of around 25 percent using M&A
transactions, it is more than 40 percent when FDI stocks are used instead. The opposite is true for a
country like Lithuania: using M&A transactions increases inward MP shares by more than 50 percent,
while using FDI stocks to extrapolate that share leaves the raw data almost unchanged.
The number of M&A transactions may be a better indicator of bilateral MP activity than FDI
stocks. Since they are constructed from FDI flows, FDI stocks may be a worse indicator because
companies can raise capital locally, phase their investment over a period of time, and channel their
investment through different countries for tax efficiency (see IMF, 2004). Even though FDI stocks have
broader coverage, we recommend using the variable “sales MandA,” which contains the actual data
on bilateral affiliate sales completed with the M&A-extrapolation procedure, for empirical exercises
that involve data on bilateral MP. Section 3.2 presents the variables contained in our data set.
Finally, notice that missing values do not seem to be random in the UNCTAD data in the following
sense. We systematically predict less MP for those pairs that were missing in the UNCTAD data: a
missing bilateral pair has (predicted) average sales of U$ 783 million, equivalent to 0.0026 as a share
of the host country’s gross value of production, while a non-missing (positive) pair in UNCTAD has
average sales of U$ 11,468 millions, equivalent to 0.016 as a share of the host country’s gross value of
production. Comparing the simple average across all country-pairs with the raw and imputed data,
respectively, points out to the same bias: while the average MP share calculated with the raw data is
0.016, the imputed data deliver much lower averages, of around 0.004 for affiliate sales (using either
M&A transactions or FDI stocks). That is, the imputed data come from pairs with systematically low
MP.
10

3.2 Data Presentation
We provide both the original UNCTAD data and the data completed with our extrapolation proce-
dure on affiliate sales and number of affiliates from country i to n. Please email us for the data. The
output file is in STATA(12), called “bilateral mp.dta,” and contains the following variables:
Variable Name Definition Source
ISO d code for receiving country U.N.
ISO o code for source country U.N.
sales raw affiliate sales, original data UNCTAD, avg. 96-01
stocks FDI stocks UNCTAD, avg. 96-01
num raw number of affiliates, original data UNCTAD, avg. 96-01
MandA number of cross-border M&A Thomson and Reuters, 90-01
sales MandA affiliate sales, imputed data from M&A own calculations, avg. 96-01
sales stocks affiliate sales, imputed data from FDI stocks own calculations, avg. 96-01
num aff MandA number of affiliates, imputed data from M&A own calculations, avg. 96-01
gross prod nonfin d gross value of production, receiving country, own calculations, avg. 96-01
non-financial sectors
References
Alviarez, Vanessa (2013), “Multinational Production and Comparative Advantage ”, mimeo Univer-sity of Michigan.
Arkolakis, Costas, Natalia Ramondo, Andres Rodriguez-Clare, and Stephen Yeaple (2013), “Innova-tion and Production in the Global Economy,” NBER Working Paper No. 18792.
Robert C. Feenstra, Robert E. Lipsey, Haiyan Deng, Alyson C. Ma, and Hengyong Mo (2005), “WorldTrade Flows: 1962-2000.”NBER Working Paper No. 11040.
Fukui, Tani and Csilla Lakatos (2012) “A Global Database of Foreign Affiliate Sales, ” USITC Workingpaper No. 2012-08A
International Monetary Fund (2004), “Foreign Direct Investment:Trends, Data Availability, Concepts,and Recording Practices.”
Nocke, Volker and Stephen Yeaple (2007), “Cross-border mergers and acquisitions vs. greenfield for-eign direct investment: The role of firm heterogeneity,” Journal of International Economics, 72(2):336-365.
11

Ramondo, Natalia and Andres Rodriguez-Clare (2013), “Trade, Multinational Production, and theGains from Openness, ” Journal of Political Economy, 121(2).
Tintelnot, Felix (2012), “Global Production with Export Platforms,” mimeo Pennsylvania State Uni-versity.
12

Appendices
Appendix A Auxiliary Data
As auxiliary data – which is not directly used in the extrapolation procedure for MP but enables the
calculation of MP shares – we use the OECD-STAN database for gross production and the World De-
velopment Indicators (WDI) for GDP. For countries for which gross production data are not available
from STAN—most of non-OECD countries—we use data on GDP to predict the magnitude of gross
production in the respective country. Let Yn denote the gross value of production in non-financial
sectors in country n, calculated from STAN for the OECD countries by subtracting the value of gross
production in the financial sectors from the total value of gross production. Since such data are avail-
able only for OECD countries, we impute values for the remaining countries using data on current
GDP. Estimates from ordinary least squares (OLS), with robust standard errors, yield
log Yn = 1.43 + 0.96 logGDPn,
(0.047) (0.002)(4)
with an R-squared of 0.99, and 1, 647 observations. Gross production in non-financial sectors is used
to present inward and outward MP shares in Table 7, for the reader convenience.
13

Appendix B Tables and Figures
14

Table 1: Availability and Coverage of Affiliate sales and Number of Affiliates. UNCTAD. Selected countries.
Reporting Availability by year Coverage Ownership NationalCountry 1996 1997 1998 1999 2000 2001 type of aff. sectors inward outward Criteria SourceBEL n/a n/a x n/a n/a n/a MOA all n/a x UBO National Bank of Belgium (Eurostat)CAN n/a n/a x n/a x x MOA all n/a x n/a CANSIMCZE n/a n/a n/a x n/a n/a all all x x non UBO Czech National BankFIN[ x x x x x x all nf x x UBO Bank of FinlandFRA† x x x x x x MOA all x x non UBO Bank of France and Ministry of FinanceGBR x x n/a n/a n/a n/a MOA nf x n/a UBO Office for National StatisticsGER x x x x x x all all x x UBO BundesbankIRL x x x x x n/a MOA mfg x x UBO Central Statistics OfficeJPN x x x x x x all nf x x UBO Ministry of Economy, trade, and IndustryNLD‡ n/a n/a n/a n/a n/a n/a MOA nf x x non UBO Centrak Bureau of Statistics (CBS)NOR x n/a n/a n/a n/a n/a MOA mfg x n/a UBO OECD: Measuring GlobalizationPOL n/a n/a n/a x x n/a MOA nf x n/a n/a Central Statistical OfficePRT n/a x x x x x MOA all x x n/a Bank of PortugalSWE\ n/a n/a x x x n/a MOA nf x n/a UBO www.itps.seUSA x x x x x x all nf x x UBO Bureau of Economic Analysis
MOA = Majority-owned affiliate. UBO = Ultimate Beneficiary Owner. NF = non-financial affiliates. Inward (Outward) refers to magnitudes for foreign affiliates in(from) country n. Belgium (BEL), Canada (CAN) and Portugal (PRT) only report affiliate sales, not the number of affiliates. (†): France (FRA), for inward magnitudes,only records affiliates in the manufacturing sector. [: Finland (FIN) reports outward magnitudes for only majority-owned affiliates. (‡): Netherlands (NLD) onlyreports the number of foreign affiliates abroad and at home, not sales. (\): Sweden (SWE) reports number of affiliates in all sectors, including the financial sector.
15

Table 2: List of countries
Code Name Code NameARG Argentina ISR IsraelAUS Australia ITA ItalyAUT Austria JPN JapanBEL Belgium KOR KoreaBGR Bulgaria LBN LebanonBLR Belarus LBY LybiaBRA Brazil LTU LithuaniaCAN Canada MEX MexicoCHE Switzerland MYS MalaysiaCHL Chile NLD NetherlandsCHN China NOR NorwayCOL Colombia NZL New ZealandCRI Costa Rica POL PolandCUB Cuba PRI Puerto RicoCZE Czech Republic PRT PortugalDNK Denmark ROM RomaniaDOM Dominican Rep. RUS RussiaESP Spain SAU Saudi ArabiaFIN Finland SGP SingaporeFRA France SLV SloveniaGBR Great Britain SVK SlovakiaGER Germany SWE SwedenGRC Greece THA ThailandGTM Guatemala TKM TurkmenistanHRV Croatia TUN TunisiaHUN Hungary TUR TurkeyIDN Indonesia TWN TaiwanIND India URY UruguayIRL Ireland USA United StatesIRN Iran VEN Venezuela
ZAF South Africa
Belgium includes Luxembourg. China includes Hong Kong.
16
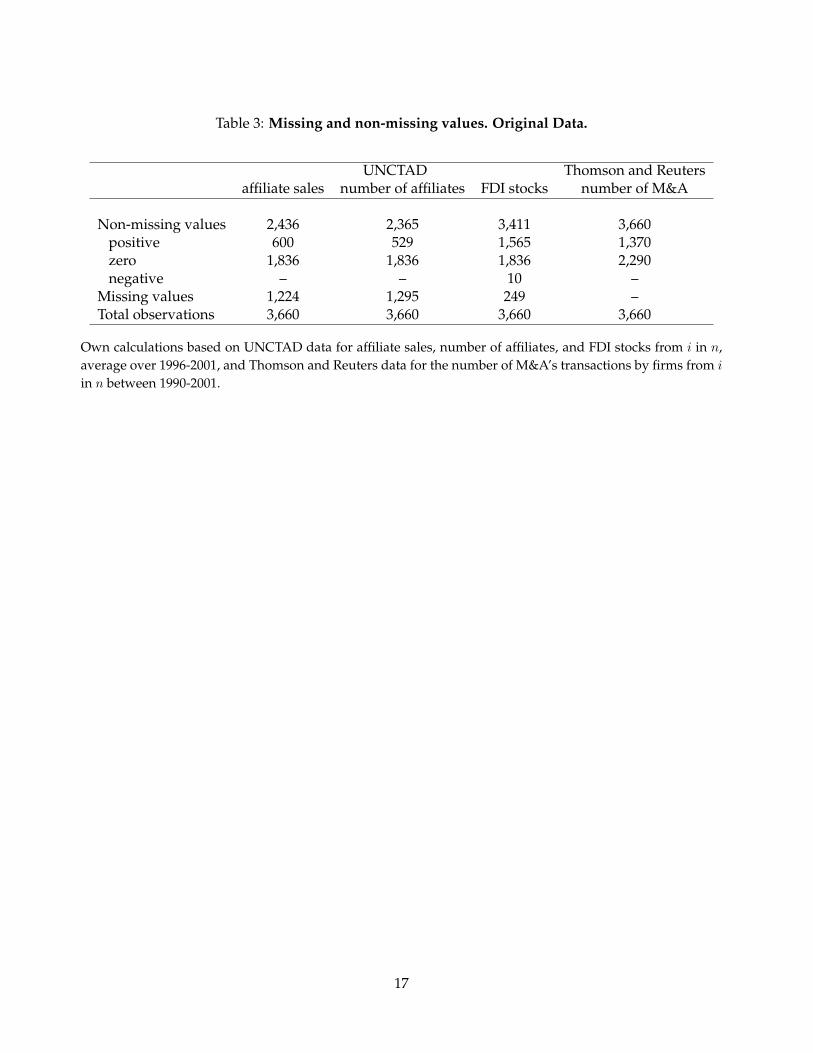
Table 3: Missing and non-missing values. Original Data.
UNCTAD Thomson and Reutersaffiliate sales number of affiliates FDI stocks number of M&A
Non-missing values 2,436 2,365 3,411 3,660positive 600 529 1,565 1,370zero 1,836 1,836 1,836 2,290negative – – 10 –
Missing values 1,224 1,295 249 –Total observations 3,660 3,660 3,660 3,660
Own calculations based on UNCTAD data for affiliate sales, number of affiliates, and FDI stocks from i in n,average over 1996-2001, and Thomson and Reuters data for the number of M&A’s transactions by firms from i
in n between 1990-2001.
17

Figure 1: Bilateral MP and M&A Transactions. Raw Data.
(a) Affiliate sales and M&A
-15
-10
-50
log_mp_share_gross
-10 -8 -6 -4 -2 0
log_MandA_share
(b) Number of affiliates and M&A
02
46
8
log_num_aff
0 2 4 6 8
log_num_MandA
(c) Affiliate sales and FDI stocks
-15
-10
-50
log_mp_share_gross
-20 -15 -10 -5 0
log_stock_share_gross
Left Panel: (log of) affiliate sales of firms from i in n, as a share of gross production in non-financial sectors in country n, and the(log of) number of M&A transactions from i in n, as a share of the total number of transactions in n. Center Panel: (log of) numberof affiliates and the (log of) number of M&A’s transactions from i in n. Right Panel: (log of) affiliate sales and FDI stocks from i
in n, as a share of gross production in non-financial sectors in country n. Number of M&A’s transactions are from Thomson andReuters, 1990-2001. FDI stocks, affiliate sales, and number of affiliates are from UNCTAD, an average over 1995-2001.
18

Table 4: Missing values by country. Original data, UNCTAD.
Inward Outwardaff. sales number of aff. FDI stocks aff. sales number of aff. FDI stocks
ARG 19 23 5 30 29 12AUS 28 31 5 33 30 4AUT 27 35 3 22 24 2BEL 22 25 4 25 31 6BGR 36 35 1 22 22 2BLR 2 2 3 2 3 1BRA 36 41 2 28 28 9CAN 21 35 0 37 40 1CHE 24 27 1 35 38 4CHL 28 30 13 25 26 9CHN 29 22 6 26 24 4COL 35 36 2 28 28 3CRI 24 23 19 10 9 4CUB 4 3 4 4 4 1CZE 14 38 0 11 36 0DNK 33 25 2 31 37 0DOM 8 8 7 3 3 1ESP 27 40 21 39 40 15FIN 19 6 4 4 36 2FRA 31 43 2 31 41 4GBR 28 29 0 33 37 3GER 4 4 2 1 1 5GRC 23 25 4 32 34 4GTM 7 6 2 5 5 3HRV 18 17 0 15 14 0HUN 37 38 0 34 35 7IDN 23 24 2 17 15 4IND 15 16 2 26 24 5IRL 17 7 8 21 25 3IRN 13 11 4 16 16 6ISR 17 17 6 25 21 5ITA 26 16 1 14 2 12JPN 33 28 6 18 12 7KOR 31 31 0 44 29 0LBN 3 2 4 5 5 3LBY 3 3 3 2 2 2LTU 6 7 5 2 2 0MEX 35 37 3 22 25 4MYS 25 25 5 36 36 1NLD 25 22 0 33 37 3NOR 11 21 0 32 36 2NZL 28 30 0 33 34 3POL 16 16 1 38 37 1PRI 2 1 1 3 3 1PRT 22 41 1 17 37 4ROM 19 19 4 13 13 5RUS 22 22 2 20 19 5SAU 5 5 5 8 6 5SGP 22 22 4 25 23 3SLV 17 16 1 2 2 2SVK 25 26 3 27 29 1SWE 31 20 17 35 38 11THA 28 29 1 23 22 1TKM 1 1 1 0 0 0TUN 20 19 21 0 0 0TUR 19 33 8 25 23 13TWN 18 17 2 22 17 6URY 10 10 5 9 10 5USA 4 3 9 3 1 10VEN 29 30 0 17 18 5ZAF 19 21 2 25 21 5Total 1224 1295 249 1224 1295 249
Own calculations based on UNCTAD data for affiliate sales, number of affiliates, and FDI stocks from i in n,average over 1996-2001.
19

Table 5: Zero, missing, and positive values. Imputed Data.
Affiliate sales Number of affiliates Number of M&AM&A FDI stocks
Non-missing values 2,873 2,951 2,866 3,660positive 1,255 1,333 1,248 1,370zero 1,618 1,618 1,618 2,290
Missing values 787 709 794 0Total observations 3,660 3,660 3,660 3,660
Columns 1 corresponds to the extrapolation in (1). Columns 2 refers to the extrapolation in (2). Columns 3 corresponds tothe extrapolation in (3). Calculations are made using observations which are averages over the period 1996-2001. The dataon number of M&A’s transactions in column 4 are from Thomson and Reuters, between 1990-2001.
20

Table 6: Missing values by country. Imputed data.
Inward Outwardaff. rev. with M&A number of aff. aff. rev. with FDI stocks aff. rev. with M&A number of aff. aff. rev. with FDI stocks
ARG 9 10 14 21 20 16AUS 12 13 14 2 2 8AUT 16 17 11 11 14 4BEL 11 12 15 6 7 13BGR 14 14 8 20 19 5BLR 1 2 5 2 3 2BRA 17 18 13 15 14 14CAN 13 14 12 10 10 9CHE 15 17 11 9 9 9CHL 10 11 17 27 28 27CHN 14 12 15 11 11 12COL 20 21 11 28 28 28CRI 17 16 20 11 10 11CUB 9 8 9 5 5 5CZE 11 16 8 10 29 3DNK 21 20 9 7 7 3DOM 8 8 7 3 3 3ESP 18 19 25 13 13 22FIN 14 5 11 2 5 0FRA 23 24 17 11 11 10GBR 16 16 16 9 9 13GER 4 4 3 1 1 1GRC 13 13 9 9 10 4GTM 13 12 13 6 6 6HRV 5 6 2 15 14 15HUN 15 16 8 22 22 8IDN 12 12 8 25 23 25IND 9 9 14 9 9 17IRL 10 7 12 7 7 14IRN 15 13 15 14 14 5ISR 27 27 27 6 5 15ITA 17 17 11 8 2 9JPN 15 15 13 8 7 7KOR 14 13 8 17 8 6LBN 6 5 6 6 6 6LBY 7 7 7 6 6 6LTU 4 4 15 7 7 7MEX 19 21 11 14 15 10MYS 14 14 15 40 40 40NLD 17 19 11 8 8 10NOR 7 9 12 8 9 7NZL 17 17 9 37 38 37POL 14 14 11 24 22 2PRI 11 10 11 7 7 7PRT 18 24 10 17 28 6ROM 19 19 4 13 13 13RUS 9 9 14 7 6 11SAU 4 5 11 26 24 26SGP 13 13 14 37 35 37SLV 17 16 17 4 4 4SVK 8 8 5 18 19 1SWE 24 19 21 8 8 12THA 14 14 10 28 27 28TKM 1 1 1 1 1 1TUN 24 23 24 2 2 2TUR 11 15 9 15 15 13TWN 14 13 11 12 12 14URY 8 8 14 7 8 7USA 5 4 4 4 2 4VEN 17 18 11 12 12 10ZAF 7 8 10 39 35 39Total 787 794 709 787 794 709
Columns 1 and 4 correspond to the extrapolation in (1). Columns 3 and 6 correspond to the extrapolation in (3). Columns2 and 5 refer to the extrapolation in (2). Inward variables to totals into country n; outward variables refer to totals fromcountry n. Calculations are made using observations which are averages over the period 1996-2001.
21

Table 7: Outward and Inward MP. Original and Imputed Data.
Inward MP Outward MPaffiliate sales number of affiliates affiliate sales number of affiliates
raw data M&A FDI stocks raw data M&A raw data M&A FDI stocks raw data M&A(1) (2) (3) (4) (5) (6) (7) (8) (9) (10)
ARG 0.078 0.104 0.0984 657 1487 0.005832 0.0218 0.0107 31 685AUS 0.189 0.229 0.23 1746 2706 0.054781 0.0752 0.0633 278 902AUT 0.279 0.297 0.2925 3584 3946 0.127706 0.1375 0.1395 2026 2148BEL 0.331 0.474 0.4002 2082 3581 0.27075 0.3365 0.3251 1408 2496BGR 0.009 0.01 0.0112 92 213 0.000867 0.0009 0.0017 12 17BLR 1E-03 0.001 0.001 14 32 0.000995 0.001 0.001 5 5BRA 0.123 0.139 0.1393 1381 2722 0.005222 0.0096 0.0066 73 252CAN 0.352 0.354 0.3557 2797 3653 0.176663 0.1983 0.1987 1309 2093CHE 0.318 0.357 0.369 2424 3025 0.688728 0.8016 0.8023 4191 6181CHL 0.075 0.092 0.1138 308 539 0.002767 0.0028 0.0028 14 14CHN 0.428 0.589 0.5254 4236 4965 0.00597 0.0074 0.0073 454 759COL 0.058 0.092 0.0771 233 528 0.00133 0.0013 0.0013 17 17CRI 0.032 0.033 0.0342 86 113 0.000434 0.0004 0.0004 4 4CUB 7E-05 7E-05 7E-05 2 2 0 0 0 0 0CZE 0.338 0.338 0.3386 1402 1712 0.015569 0.0156 0.0159 59 102DNK 0.106 0.135 0.1347 1023 1045 0.156011 0.1924 0.1893 1332 1905DOM 0.028 0.028 0.0283 47 47 0.000291 0.0003 0.0003 3 3ESP 0.167 0.171 0.1677 2194 3637 0.021691 0.0287 0.0275 252 787FIN 0.195 0.196 0.196 1617 1620 0.379303 0.3809 0.3813 770 1067FRA 0.201 0.202 0.2023 4655 6910 0.19282 0.208 0.2035 3197 5602GBR 0.316 0.318 0.3177 6515 6610 0.222287 0.2608 0.2535 3664 7215GER 0.29 0.29 0.2903 12341 12341 0.354405 0.3544 0.3544 28644 28644GRC 0.054 0.07 0.0918 289 488 0.005734 0.0117 0.0133 39 130GTM 0.022 0.022 0.0223 109 109 0.000218 0.0002 0.0002 4 4HRV 0.011 0.013 0.0121 131 182 0.002689 0.0027 0.0027 20 20HUN 0.278 0.453 0.4503 1392 1882 0.011177 0.0127 0.0153 29 94IDN 0.094 0.105 0.1079 769 1143 0.003406 0.0034 0.0034 31 31IND 0.034 0.036 0.037 661 741 0.004453 0.0084 0.0098 38 136IRL 0.348 0.351 0.3484 1166 1169 0.121667 0.1304 0.1282 299 458IRN 8E-04 8E-04 0.0008 20 20 0.002609 0.0026 0.0032 31 46ISR 0.063 0.063 0.0628 149 149 0.021729 0.0266 0.0261 135 297ITA 0.094 0.13 0.1138 3312 3323 0.056535 0.0571 0.0572 2310 2310JPN 0.041 0.045 0.0446 1910 1995 0.149623 0.1506 0.1515 11931 12049KOR 0.05 0.058 0.0554 725 954 0.039289 0.0507 0.0501 417 1119LBN 0.002 0.002 0.0024 14 14 0.00826 0.0083 0.0083 26 26LBY 0 0 0 0 0 0 0 0 0 0LTU 0.008 0.012 0.0076 41 102 0 0 0 0 0MEX 0.163 0.185 0.1787 1392 2143 0.019339 0.024 0.0204 191 415MYS 0.273 0.334 0.3088 989 1483 0.00714 0.0071 0.0071 33 33NLD 0.407 0.418 0.4134 3588 3602 0.77565 0.9872 0.9135 4944 7625NOR 0.131 0.134 0.143 382 572 0.147263 0.1827 0.1678 951 1253NZL 0.149 0.226 0.1901 325 665 0.017198 0.0172 0.0172 22 22POL 0.222 0.222 0.2223 3347 3359 0.002144 0.0039 0.0036 74 277PRI 0 0 0 4 4 0 0 0 0 0PRT 0.372 0.38 0.382 544 1046 0.031188 0.0315 0.0317 34 144ROM 0.014 0.014 0.034 256 256 0.000569 0.0006 0.0006 8 8RUS 0.016 0.027 0.029 366 659 0.018578 0.0255 0.0207 107 235SAU 0.034 0.047 0.0358 125 193 0.047365 0.0474 0.0474 154 154SGP 0.879 1.118 1.0334 1637 2925 0.032925 0.0329 0.0329 99 99SLV 0.017 0.017 0.0175 50 50 0.002869 0.0029 0.0029 5 5SVK 0.14 0.216 0.2182 352 558 0.013098 0.025 0.0183 12 39SWE 0.297 0.298 0.2979 4237 4243 0.251169 0.3029 0.2888 1902 2704THA 0.237 0.292 0.2749 1185 1829 0.002235 0.0022 0.0022 27 27TKM 2E-04 2E-04 0.0002 2 2 0 0 0 0 0TUN 0.008 0.008 0.008 104 104 0 0 0 0 0TUR 0.06 0.061 0.0614 385 596 0.002704 0.0035 0.0034 81 138TWN n/a n/a n/a 938 1138 n/a n/a n/a 261 526URY 0.028 0.04 0.0354 77 164 0.002561 0.005 0.0073 16 43USA 0.154 0.154 0.1544 11758 11758 0.191694 0.1917 0.1917 20933 20933VEN 0.081 0.114 0.1033 305 536 0.11105 0.1168 0.1172 47 95ZAF 0.09 0.103 0.1064 538 859 0.032865 0.0329 0.0329 56 56Average 0.146 0.170 0.165 1524.8 1843.4 0.080 0.092 0.090 1524.8 1843.4
Columns 2 and 7, 3 and 8 correspond to the extrapolations in (1) and (3), respectively. Columns 5 and 10 refer to theextrapolation in (2). ”Raw” refers to the original data from UNCTAD. Inward MP shares are
∑i6=n Yni/Yn, while outward
MP shares are∑
n 6=i Yni/Yi. Observations are averages over the period 1996-2001.
22