Multinational enterprises, industrial ... - econ.geo.uu.nlecon.geo.uu.nl/peeg/peeg1802.pdf ·...
46
http://econ.geog.uu.nl/peeg/peeg.html Papers in Evolutionary Economic Geography #18.02 Multinational enterprises, industrial relatedness and employment in European regions Nicola Cortinovis & Riccardo Crescenzi & Frank van Oort
Transcript of Multinational enterprises, industrial ... - econ.geo.uu.nlecon.geo.uu.nl/peeg/peeg1802.pdf ·...
http://econ.geog.uu.nl/peeg/peeg.html
Papers in Evolutionary Economic Geography
#18.02 Multinational enterprises, industrial relatedness and
employment in European regions
Nicola Cortinovis & Riccardo Crescenzi & Frank van Oort

1
MULTINATIONAL ENTERPRISES, INDUSTRIAL
RELATEDNESS AND EMPLOYMENT IN EUROPEAN
REGIONS1
Nicola Cortinovis
Erasmus University
Rotterdam
Riccardo Crescenzi
London School of
Economics
Frank van Oort
Erasmus University
Rotterdam
Abstract
This paper looks at the link between Multinational Enterprises (MNEs) and employment in local firms in their host regions. The paper cross-fertilizes the literature on MNE spillovers with the emerging body of research on industrial relatedness. This paper empirically tests the link between industrial relatedness and MNE impacts on employment by capturing various types of horizontal and vertical similarities across industries. The focus of our study is on employment in European NUTS2 regions. The empirical analysis shows that cross-sectoral MNE spillovers among cognitively related industries are positive and significant, confirming that industrial relatedness is an important driver of employment-enhancing spillovers from MNE activities. However, positive effects of MNEs on domestic employment are contingent upon the modeling of both regional and industrial heterogeneity. Keywords: Foreign Direct Investment (FDI), Relatedness, Employment, Europe,
Regions.
JEL Classification: O33, F22
1 Funding
The research leading to these results has received funding from the European Research Council under the European Union Horizon 2020 Programme H2020/2014-2020) (Grant Agreement n 639633-MASSIVE-ERC-2014-STG).

2
INTRODUCTION
The capability of firms to control and organize their activities in multiple countries and
the corresponding increase in global investment flows have fostered scholarly and
policy debates on multinational enterprises (MNEs), their ability to take advantage of
specific locations and their effects on the host economies (Narula and Dunning, 2000;
Fu et al., 2011; Javorcik, 2013). The existing literature in economics, economic
geography and international business has highlighted a number of mechanisms through
which MNEs may have a positive impact on domestic firms, for example in terms of
innovation and productivity, especially when pursuing knowledge intensive and
innovative activities in the host economy (Javorcik et al., 2017). In light of this evidence
countries and regions across the globe actively compete with each other in order to
attract foreign investors (Narula & Pineli, 2016; Bitzer et al., 2008; Harding & Javorcik,
2011). However, more recently, new empirical research has highlighted various
potential ambiguities in the link between MNE activities and local innovation,
development and wealth, shedding new light on the pre-conditions that need to be in
place for these positive effects to materialize (Crespo and Fontoura, 2007; Görg and
Greenaway, 2004).
The inflow of foreign direct investment (FDI) may stimulate product upgrading in the
host country. Multinationals are often seen as key generators of innovation, accounting
for a large share of global R&D spending as well as possessing superior knowledge on
the suitability of the host country for the production of a specific products (Javorcik et
al., 2017). Empirical evidence indeed confirms that multinationals transfer knowledge
to their foreign affiliates (Arnold and Javorcik 2009) and that foreign affiliates are more
likely to introduce new products than their indigenous competitors (Brambilla, 2009;
Guadalupe et al., 2012). Yet, spillover effects to firms in host economies may be
negative. MNEs may actively protect their knowledge in order to minimise knowledge
leakages in favour of domestic competitors. Competition from MNEs may actually lead
to negative productivity and innovation effects on domestic firms (Aitken & Harrison
1999). These mechanisms typically refer to horizontal spillovers from foreign to
domestic firms operating in the same industry. Apart from MNEs potentially operating
in different markets than domestic firms (e.g. top segments versus local market
segments), these considerations led most researchers to a conclusion that the existence

3
of horizontal spillovers is very limited (Havranek et al., 2011; Lin et al., 2007; Javorcik
2004; Javorcik et al., 2017). In contrast, vertical (i.e. inter-industry) spillovers are far
more likely, since multinationals may have incentives to provide technology to their
suppliers (backward spillovers), and probably also to their customers (forward
spillovers) (Lu et al., 2017).
The aim of this paper is to contribute to the debate on MNE externalities and domestic
firm performance by cross-fertilizing the MNE spillovers literature with the growing
literature on industrial relatedness (Hidalgo et al., 2007). This paper empirically tests
the link between relatedness and the impact of MNEs on employment in domestic firms.
By adopting a relatedness perspective the paper can capture various types of horizontal
and vertical similarities across industries complementary to (vertical) input-output
linkages. The focus of our study is on the effect of MNEs on employment in European
regions. Given that knowledge intensive industries and product relatedness are
generally associated with employment opportunities, we look at sectoral employment
in European (NUTS2) regions to test hypotheses on their relation with MNEs in the
same and related sectors, their interactions with local absorptive capacities and
institutional and development stages. In light of the considerable regional differences
in terms of knowledge, sectoral composition and overall level of development, we
address the heterogeneity of MNE effects by capturing sectoral and regional specific
conditions and mechanisms of spillovers. Although we control for sector-region and
year fixed effects, it is possible that some unobservable factors varying at the sector-
region-year level could be affecting our findings or that MNEs may anticipate local
firms’ ability to learn and employ people and therefore MNEs locate in those areas. To
address these possibilities, we rely on a Bartik-type instrument (Crescenzi et al., 2015;
Ascani and Gagliardi, 2015) to approximate the distribution of MNEs across regions
and sectors while purging region-industry specific characteristics and test the
robustness of our results.
Our empirical analysis shows that cross-sectoral MNE spillovers among cognitively
related industries are positive and significant. This provides an initial confirmation to
the idea that industrial relatedness - possibly encompassing but not limited to I-O
relations – is an important driver of employment-enhancing spillovers from MNE
activities. While the use of relatively aggregated sectors does not allow us to capture
4
relatedness at a fine-grained level, the influence of MNEs on cognitively related
industries across two-digit NACE sectors, confirms the importance of looking beyond
vertical linkages. These results however are contingent on the modeling of both
regional and industrial heterogeneity. The explicit consideration given to regional and
industrial heterogeneity represents a second contribution of this paper. In line with
previous studies (Fu et al., 2011; Bitzer et al., 2008), we find that intra-industry effects
are not negligible, and tend to be stronger in relatively less economically advanced
regions rather than more developed areas.
The paper is organized as follows. In the first section, the relevant literature on MNE
externalities, their preconditions and their intra- and inter-industrial scope is reviewed,
underlining the limitations of a focus on vertical inter-industry spillovers only, and the
potential contributions from including cognitive industrial relatedness. Based on these
considerations, we developed four testable hypotheses in the second section of our
paper. Following, the modeling choices, the methodology applied, the identification
strategy and the data to test these hypotheses are presented, before moving to the
discussion of our econometric results. In the last section, we summarize the
contributions of our work, also stressing its limitations and highlighting some directions
for further research and policy implications.
LITERATURE REVIEW
Multinational enterprises (MNEs) are among the most important actors in the process
of knowledge creation and diffusion. Thanks to their technological capabilities and their
capacity to control activities in multiple technological environments, MNEs can
leverage their network of subsidiaries and exploit local knowledge resources in
different places (Narula and Dunning, 2000; Ernst and Kim, 2002; McCann and
Iammarino, 2013). On this basis, foreign subsidiaries bring about externalities for
domestic firms, some of which may lead to higher employment and productivity
(Javorcik, 2013; Crescenzi et al., 2015).
5
MNE spillovers
In the last decades, a significant amount of research has studied the impact of MNE
subsidiaries on the host economy (Perri and Peruffo, 2016; Burger et al, 2013;
Karreman et al, 2017). The literature in this field has contributed to unveil the set of
mechanisms, dynamics and preconditions linking the presence of international
companies with potential beneficial effects for the local economy.
The presence of multinational companies can affect, either positively or negatively, the
host economy. Theoretical and empirical contributions have established the different
channels through which these externalities occur. Firstly, local companies can learn and
imitate the technologies and procedures used by MNEs (Crespo and Fontoura, 2007;
Ernst and Kim, 2002). In the same way, the MNE network abroad can give insights
about foreign tastes and relational channels, facilitating the internationalization of
domestic firms (Görg and Greenaway, 2004). Secondly, the increase in competition due
to the entry of an MNE can force domestic companies to become more efficient and
make better use of existing technologies and resources. However, competitive pressure
might also be harmful: more advanced MNEs may push competitors out of the market
or induce local companies to operate on a smaller and less efficient scale (Fu et al.,
2011). Thirdly, domestic firms can acquire specialized knowledge by hiring workers
previously employed in an MNE. Labor mobility however can also work in the opposite
direction. MNEs tend to offer higher wages than domestic ones, making them more
attractive for the most talented workers in the market (Javorcik, 2013).
Preconditions for MNE spillovers
Different contributions in the literature have highlighted how local conditions and MNE
characteristics may affect the ability of domestic firms to benefit from the presence of
foreign companies (Ernst and Kim, 2002; Perri and Peruffo, 2016). Productivity and
knowledge spillovers are found to be more marked in economies with higher levels of
development (Crespo and Fontoura, 2007; Meyer and Sinani, 2009), whereas the
picture is more mixed for transition and developing economies (Görg and Greenaway,
2004; Bitzer et al., 2008; Javorcik, 2013). This relation between local development and
MNE spillovers depends however on more fundamental factors, affecting the ability of
6
domestic firms to benefit from MNE presence (Fu et al., 2011). The literature on FDI
distinguishes respectively (vertical and horizontal) market-driven, (horizontal)
efficiency-driven, (vertical) resource-driven, and (horizontal, cognitive) knowledge-
driven investments (Barba Navaretti and Venables, 2004; Burger et al., 2013). One of
the most relevant elements in the latter category is the technological gap between local
firms and multinationals. Whereas larger difference in terms of technological
endowment between domestic and foreign firms entails greater room for learning, a
larger gap is also more difficult to close (Kokko, 1994; Boschma, 2005). The relation
between spillovers and technological gaps has an inverse-U shape: from the one hand,
no transfer can take place if there is no difference in technology and knowledge; from
the other hand, if the gap is too wide, local firms will not be able to learn from the
foreign counterpart (Fu et al., 2011).
A second critical factor is the local “absorptive capacity” (Narula and Dunning, 2000;
Blomström and Kokko, 2003), conceptually linked to the levels of R&D and human
capital both at firm and local level (Cohen and Levinthal, 1990). The fact that firms and
regions with larger absorptive capacity are in better position to benefit from MNE
spillovers bear some implications as for what type of industries have more chances to
profit from MNEs. Given the greater availability of knowledge resources in advanced
industries, both theory and empirics indicate that MNE have stronger impacts in more
knowledge-intensive sectors (Crespo and Fontoura, 2007; Fu et al., 2011).
Various other factors may determine the spillover effects of foreign firms on domestic
ones. Institutional features, such as trade policy, tax incentives, community presence,
intellectual property rights and the solidity of the financial system influence the location
choices of MNEs, and thus of their spillovers (Blomström and Kokko, 2003; Alfaro et
al., 2004; Cipollina et al., 2012, Karreman et al., 2017). Similarly, the origin (Narula
and Dunning, 2000; Crespo and Fontoura, 2007), the mode of entry (via greenfield or
M&A) and the reason for entry (efficiency-seeking or market-seeking) of foreign
companies have been associated to a larger or lesser ability to generate spillovers (Neto
et al., 2008; Beugelsdijk et al., 2008). Finally, the effects of MNEs may reduce in
sectors already hosting a significant number of foreign firms (Altomonte and Pennings,
2009).

7
Intra-industry and inter-industry spillovers
One of the most important characteristics of MNEs is the knowledge and human capital
resources they control (McCann and Iammarino, 2013). The protection of their
intangible assets and the mitigation of risks of knowledge dissipation represent
theoretical answers to the ambiguous empirical results on intra-industry spillovers. If
the survival of a foreign subsidiary strongly depends on its knowledge assets and its
ability to internalize the benefits deriving from those, the prevention of knowledge
spilling to local competitors is of paramount importance (Görg and Greenaway, 2004;
Javorcik, 2004). The strong incentive to minimize knowledge spillovers would thus
curb the positive externalities deriving from the MNE presence. Unlike, in inter-
sectoral relations MNEs may face different incentives. To ensure efficient and positive
cooperation with local firms when needed, foreign companies may be more prone to
share part of their knowledge. The presence of MNEs in a given industry may thus have
implications also outside the sector to which they belong (Ernst and Kim, 2002; Kugler,
2006).
In the quest for cross-sectoral MNE spillovers, most of the literature has identified
input-output relations as the main channel through which such externalities may occur
(Perri and Peruffo, 2016; Lu et al.,2017; Lin et al., 2007). Vertical linkages to MNEs
engender productivity-enhancing spillovers for instance through increased demand for
local goods or larger competition for supplying multinationals (Javorcik, 2004; 2013;
Crespo et al., 2009). Besides, to guarantee certain quality or technical standards, foreign
companies have the incentive to share valuable knowledge to local producers (Ernst
and Kim, 2002), through visit and periodic inspections (Javorcik, 2004) or training
programs (Fu et al., 2011). Similar dynamics apply to forward linkages too. By sourcing
from MNEs, local firms may benefit from goods of greater quality or more
technologically advanced, which in turn may streamline their production process,
fostering efficiency and productivity (Crespo and al, 2007; Javorcik, 2004). Specific
knowledge might also be acquired along with the good itself (Coe and Helpman, 1995)
or via after-sale care or support services.
Whereas studies on within-industry spillovers often give inconclusive results (Fu et al.,
2011), significant evidence exists confirming the relevance of inter-industry effects

8
(Kugler, 2006; Crespo et al., 2009; Javorcik, 2013). In general, these analyses suggest
that backward linkages positively contribute to the increase in level of productivity
within the local economy (Javorcik, 2004; Bitzer et al., 2008; Crespo et al., 2009; Lin
et al., 2007), with few exceptions (Damijan et al., 2003). Unlike, forward linkages do
not seem to have significant effect on local productivity, in some cases even having a
negative impact on domestic firms (Crespo and Fontoura, 2007).
Within the debate on inter- and intra-sectoral MNE spillovers, types of linkages
different from input-output relations have received minor if any attention. This
contrasts with other literatures, which consider a broader set of dimensions through
which knowledge can flow across industries. In economic geography and
agglomeration literature, externalities are hypothesized and empirically found to occur
especially from the recombination of both proximate (Boschma, 2005; Frenken et al.,
2007) and highly diverse types of knowledge (Jacobs, 1969; Glaeser et al., 1992). The
concept of relatedness aims at capturing how knowledge, technologies and assets
already present in a (local) economy influence the possibility to diversify over time
(Hidalgo et al., 2007). In other words, the opportunities for an economy to diversify
and operate in a new (for the region) sector depend on the industries already present in
the economy: the more two sectors are cognitively related, the easier it is for firms to
re-deploy their assets, acquire new capabilities, and move from one sector to the other
(Hidalgo et al., 2007; Hausmann and Klinger, 2007; Cortinovis et al., 2017; Boschma
and Capone, 2015; Boschma et al., 2013). The concept of relatedness synthesizes the
different dimensions in which two sectors can be proximate, be it because of similar
technologies, skills or production processes, because of input-output relations, or
because of similar institutional arrangements (Hidalgo et al., 2007).
Foreign-owned companies, with their ability to gather and use knowledge and
technologies from different locations (Narula and Dunning, 2000; McCann and
Iammarino, 2013; Crescenzi et al., 2015), may bring about significant cross-industrial
knowledge flows outside of their own value chains. For instance, management practices
or organization of the production – such as the “lean production” systems – represent a
set of general capabilities, initially applied in automotive, but now diffused in
manufacturing of a variety of goods, as well as in retail and distribution (McCann and
Iammarino, 2013). While more specialized knowledge is more difficult to be
9
redeployed, this can still happen. Technical expertise may provide valuable knowledge
and abilities to successfully operate in similar industries, as in the case of spin-off
dynamics (Boschma and Frenken, 2011). Boschma and Wenting (2007), for instance,
show how the chances of survival for entrepreneurs in car manufacturing in Britain
were higher if they had previous experience in technically similar but vertically
unrelated industries, such as bicycle production or industries using mechanical
engineering skills. On this basis, confining the impacts of MNEs within the boundaries
of backward and forward linkages might offer at best a partial picture of the cross-
sectoral spillovers.
Contributions in industrial relatedness and variety externalities can complement the
literature on inter-industry spillovers of MNEs. The international business literature has
so far mostly argued that cross-sectoral effects of MNEs are mediated by vertical
linkages. Unlike, the literature focusing on different types of proximity (Boschma,
2005, Nooteboom 2000) has convincingly argued that interactive learning occurs more
easily when two parties exhibit some degree of cognitive or technological relatedness.
This implies that firms may learn from each other even when operating in sectors
separated in terms of input-output relations, but similar in terms of knowledge, skills
and technologies. Besides, the international business literature uses arguments similar
to those of Boschma (2005) in relation to the technological gap between domestic and
foreign firms (Kokko, 1994; Fu et al., 2011); however, their implications in terms of
cross-sectoral (horizontal and vertical) knowledge spillovers have not been fully
addressed.
Following the relatedness literature we propose that knowledge in one sector can find
useful applications also in different but cognitive related sectors. Whereas this idea of
cognitive relatedness may encompass also vertical linkages (Hidalgo et al., 2007), it
specifically entails the possibility of knowledge spilling over horizontally to proximate
sectors. The channels for knowledge spillovers already identified in the literature, such
as labor mobility, demonstration effects or other informal linkages (Ernst and Kim,
2002; Perri and Peruffo, 2016), can thus be expected to work not only within vertical
relations, but also connecting different but technologically or cognitively similar
industries horizontally.

10
RESEARCH SETTING
The literature on the multinational corporations and their effects on the local economy
has witnessed an upsurge in the last years. Such intensive attention contributed to the
establishing of some stylized facts on MNEs, in particular with respect to their ability
to diffuse knowledge, to generate positive externalities for domestic firms, and on the
local preconditions for these beneficial effects to materialize (Ernst and Kim, 2002;
Crespo and Fontoura, 2007). Nonetheless, our review of the literature in the
introduction and the previous section problematized several important issues.
First, theoretical and empirical research suggest the existence of both intra- and inter-
sectoral spillovers. The former derive from the presence of MNEs in the same sector in
which domestic firms operate. The weak empirical support that has been found for this
type of effects has been linked to need of foreign companies to limit positive
externalities to competitors or the existence of competition-related externalities
counterbalancing the knowledge spillovers. As the majority of research has looked at
input-output relations for measuring channels for knowledge spillovers, the broader
industrial linkages are undervalued: MNE spillovers may also flow to industries that
are not connected via vertical linkages but related in terms of products, technologies
and knowledge assets. Because such cognitive relatedness co-evolves with sectoral
diversity more naturally than with specialization, more significant effects are expected
for employment levels and dynamics than for productivity. No previous research
considered the role of cognitive relatedness in MNE spillovers.
Second, the effects of MNEs on domestic firms are clearly mediated and influenced by
local characteristics (Ernst and Kim, 2002; Görg and Greenaway, 2004; Meyer and
Sinani, 2009). In areas that are lacking of essential assets, in terms of human capital,
knowledge or institutional conditions, the impact of MNE is likely to be smaller. The
same is true for regions in which the technological divide between domestic and foreign
firms is minimal, so that domestic firms have little to learn from foreign ones. When
local endowments of knowledge, technology and institutions are significant, the
presence of foreign companies can have positive and economically meaningful effects
(Fu et al., 2011). The focus of the present study is on the effect of MNEs in European

11
regions. Given the considerable differences in terms of knowledge, sectoral
composition and overall level of development in our sample (Annoni et al., 2017), our
work aims at disentangling the heterogeneity of effects of foreign companies on the
domestic regional economy.
Based on these considerations, we develop four hypotheses on the effects of
multinational corporations on industries in European regions. In our baseline models,
we want to study the intra-industry impact of MNE presence on local sectoral
employment. Whereas the previous literature has provided ambiguous results,
theoretically we can expect sectors with higher presence of foreign companies to
perform better due to knowledge spillovers and competitive pressure.
Hypothesis 1:
The level of employment in a sector in a region is positively related with the
presence of MNEs in the same sector-region.
As argued in the previous sections, the main focus of this paper is on the study of
industrial cognitive relatedness, and its ability to mediate MNE spillovers across
sectors. Combining the literature on inter-industry MNE spillovers, diversity
externalities (Jacob 1969; Glaeser et al., 1993; Frenken et al., 2007) and relatedness
(Hidalgo, 2007; Boschma, 2005), we theorize that knowledge spillovers from foreign
companies may have an impact on sectors related to that of the MNE. In hypotheses 2,
we expect that presence of MNEs in cognitive related industries positively influences
the focal industry, thanks to larger possibilities for knowledge spillovers, to lower
competitive pressures, and to the lower risk of MNE enacting strategies for reducing
externalities.
Hypothesis 2:
The level of employment in a sector in a region is positively related to the
presence of MNEs in cognitive related industries in the same region.
Our last two hypotheses deal with regional and industrial heterogeneity in our sample.
Knowledge assets and absorptive capacity are necessary for benefitting from foreign
companies (Görg and Greenaway, 2004; Crespo and Fontoura, 2007; Fu et al., 2011).
12
Against this background, we expect that relations to MNEs, both within the same
industry and in related sectors, will have a stronger effect in more knowledge intensive
industries, as they are better equipped in terms of human capital and R&D resources.
In other words, as firms in knowledge intensive industries are more likely to better
endowed with absorptive capabilities, the effects of spillovers from MNEs are likely to
be stronger.
Hypothesis 3:
The positive effects of MNE presence, both within-industry and across-industry,
are stronger for knowledge intensive industries in the target region.
Finally, the effects of MNEs have been shown to depend on the level of development
of the target area, with firms in less developed regions benefitting less from foreign
companies (Crespo and Fontoura, 2007; Javorcik, 2013). Whereas countries in our
sample gather relatively developed economies, significant regional differences persist
in the EU, with Southern (less growing) and Central Eastern European regions (less
developed) being on average less prosperous than Western ones. At the same time,
these areas are characterized by skilled workforce, relatively low wages and stable
institutional systems, and are part of the EU Common market (Dogaru et al. 2015). In
spite of its relatively lower level of development or growth, we argue that these factors
make less-advanced EU regions in good positions to attract MNEs, absorb knowledge
and stimulate growth and development (Protsenko, 2003; Bitzer et al., 2008; Damijan
et al., 2003; Javorcik, 2004, 2013). On these bases, we hypothesize that:
Hypothesis 4:
The positive effects of MNE presence and entries, both within-industry and
across-industry, are stronger in less advanced regions than in more advanced
EU regions.
MODELS, METHODS AND DATA
Modeling framework

13
Investigating the relationship between MNEs and local economies poses a number of
issues from an econometric point of view, for capturing the impact of related industries
and with respect to endogeneity and reverse causality issues. The analysis proposed in
this paper considers the short-term effects on total sectoral employment of MNE
presence both within the same industry and in cognitively related ones.
In Model 1, the economic performance within each sector-region is modeled as a
function of the number of MNE in the previous year. In formal terms:
!",$,% = '",$ + )% + *+,-_/01",$,%23 + 4/5_+,-",$,%23 + 675/895:".$,%23 +
<",$,%, (1)
where !",$,% stands for the level of employment2 (in logs) in sector i, in region r at time
t, :/+,- represents the log count of MNE3 at time t-1, while /5_+,- is a dummy
variable with value 1 when no foreign company is present in sector i, in region r at time
t-1. Our model includes also control variables (75/895:) as well as sector-region ('",$)
and yearly ()%) fixed effects. Along with sector-region and yearly fixed effects, we
control for within-region dependence in the error terms and potential heteroscedasticity
by using robust and regionally clustered errors in all models.
Testing for hypothesis 2, requires a further extension of the baseline model discussed
above, so to include the terms for capturing MNE presence in related industries. In the
case of Model 2, the variable +,-_/01 is interacted with the proximity matrix W to
generate +,-_/01_9=: (see Equation 2). This matrix, as explained in the next pages,
captures the cognitive proximity between industries based on the co-occurrence of pair
wise specializations.
!",$,% = '",$ + )% + *+,-_/01",$,%23 + >+,-_/01_9=:",$,%23 +
4/5_+,-",$,%23 + 675/895:".$,%23 + <",$,%, (2)
2 The choice of using employment as measure of the performance of the industries instead of wages is motivated by the fact that salaries adjust to the levels of productivity differently in different countries. This, in turn, may make wage a less reliable proxy for productivity. 3 As discussed more thoroughly in the section on data and in Appendix 2, our dataset captures the presence, entry and exit of foreign firms, both via M&A and foreign direct investments.

14
We test for hypotheses 3 and 4 by splitting the sample in regimes according to different
types of sectors and regions (cf. Ertur and Koch. 2007). In other words, the same models
will be estimated separately for advanced industries4, knowledge-intensive services and
low-knowledge sectors, as well as for more prosperous EU regions and for less
developed EU regions.
Methodology
As underlined in the discussion of the literature, one of the main limitations in the study
of MNE externalities has been the almost exclusive consideration given to vertical
linkages as channels for inter-industry spillovers. In this paper we explore whether
MNE effects are perceived across industries, industries using a cognitive proximity
measure.
For doing so, we apply the concept of relatedness proposed by Hidalgo et al. (2007),
following a method proposed by Van Eck and Waltman (2009) and refined by Steijn
(2016). These methods allow to create a measure of similarity across different types of
objects, in our case industries at the 2-digit of NACE classification. To perform these
calculations, we used data on sectoral employment in 2006 from the Bureau Van Dijk
Orbis database (cf. Variables and Data and Appendix 2). We choose to use only data
from 2006 in order to reduce possible endogeneity.
Like in the work by Hidalgo et al. (2007), we start by defining the sectors in which each
region is specialized. We consider region r to be specialized in sector i when it’s
location quotient for that sector is larger than one. In more formal terms:
@A"$ = (CDE C∗E
CD∗ C∗∗), (5)
and
4 See Appendix 1 for details on the subdivision of sectors and regions in different categories.

15
H",$ =1, JK@A"$ > 1
0, 58ℎ=9OJP=
(6)
Once the sectoral measure of specialization is computed, we count in how many regions
specializations in sectors i and j co-occur. We then consider i and j related if they tend
to systematically co-locate. Our measure of relatedness is thus calculated as the ratio
between the observed co-occurrences and a random benchmark. Equation 7 represents
formally the computation performed:
Q"R =SDT
UDV
∗UT
VWUDX
UTV
∗UD
VWUT∗VY
, (7)
where Z"R is the co-occurrence count of specializations in sectors i and j, [" and [R are
the total number of occurrence of i and j respectively, and \ is the total number of
occurrences of any sector. In the equation, the nominator is equal to the number of times
(i.e. in how many regions) specializations in i and j occur together, while the
denominator computes the number of co-occurrences under the assumption of the i and
j are independent (Steijn, 2016).
The result of Equation 7 is a n × n W matrix, with n being the number of sectors in our
sample. Each cell in W contains the cognitive relatedness score between two sectors,
with each value ranging between 0 and infinity and taking value 1 when the expected
number of co-occurrences is the same as expected under the random scenario. In order
to capture the effects of strong relatedness across sectors, we exclude cells in the main
diagonal of W and we set to 0 the cells with relatedness less or equal to 1. Finally, we
rescale the values of the matrix to make them range between 0 and 1. As mentioned in
the description of the models, we use the W matrix to capture the number of MNEs
around sector i. We create the variable +,-_/01_9=: by simply multiplying the
relatedness matrix W and the sectoral vectors of +,-_/01 in each region.
Figure 1 (below) gives a first-hand evaluation of the network of relatedness obtained
and captured by W. Each node represents one of the 68 industries we collected data for,
and the position relative to the other nodes is based on the pair wise relatedness scores

16
(Hidalgo et al., 2007). For sake of clarity, the graph depicts only linkages with values
higher than average. As shown in the legend, round nodes are low-knowledge
industries, whereas square nodes represent most advanced sectors, and each of the node
is colored according the first-digit NACE sector it belongs to. As Figure 1 clearly
highlights, sectors are not homogeneously related one to each other. Square nodes have
sorted themselves in the left hand side of the graph, where the network relations appear
to be denser. This indicates that knowledge intensive industries tend to be more closely
related with each other and less with medium- and lower knowledge intensive sectors.
Figure 1 thus gives some preliminary support to the idea that knowledge spillovers may
be stronger within the knowledge intensive part of the economy (to be tested with
Hypotheses 3) compared to spillovers across sectors with various degrees of knowledge
intensity. A mirroring pattern emerges on the right part of the graph, where mostly low-
knowledge intensive manufacturing industries locate. Also in this case the
configuration suggests the existence of opportunities for cross-sectoral spillovers,
although to a lesser extent and mostly from other low-knowledge industries.
Figure 1: Network representation of relatedness
06
07
0809
10
11
13
1415
16
20
22
23
2425
27
28
29
30
33 35 41
49
5161
62
68
69
75
80
81
82
05
12
19
31
36
38
42
50
52
58
59
60
7071
7273 777879
21
17
37
39
43
45
47
5556
95
53
46
32
18
74
26
63
Mining
Manufacturing
Electricity&Gas
Construction
Transport
ICT
Real Estate
Prof. Services
Admin. Services
Water Mngt
Trade
Hotel&Restaurant
Repair
Knowledge intensive sector
Medium Knowledge sector
Low Knowledge sector
17
Finally, it may be argued that the use of only 68 sectors for performing our analysis
represents a limitation for this study. However, it should also be stressed that observing
industries at such aggregate level allows us to reduce potential concerns for capturing
spillover mediated by input-output relations, rather than horizontal knowledge flows.
By analyzing relatively encompassing industries, we can more safely assume we mainly
capture knowledge spillovers between horizontally related industries.
Variables and data
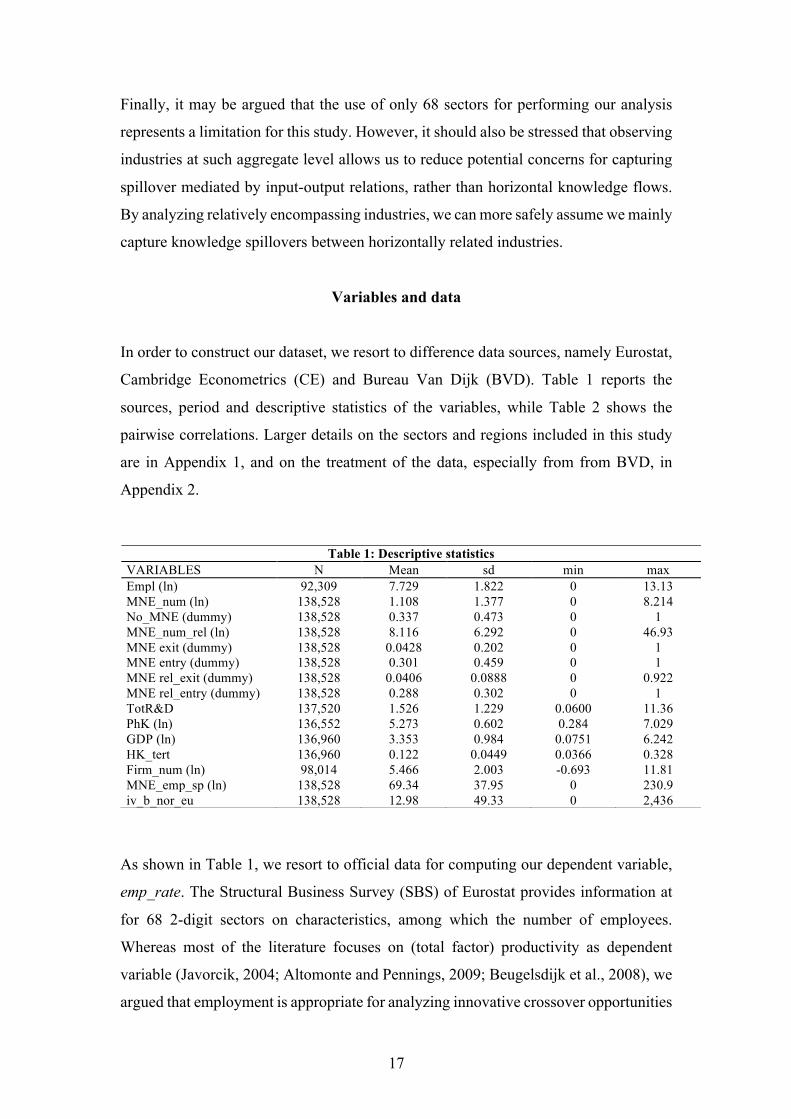
In order to construct our dataset, we resort to difference data sources, namely Eurostat,
Cambridge Econometrics (CE) and Bureau Van Dijk (BVD). Table 1 reports the
sources, period and descriptive statistics of the variables, while Table 2 shows the
pairwise correlations. Larger details on the sectors and regions included in this study
are in Appendix 1, and on the treatment of the data, especially from from BVD, in
Appendix 2.
As shown in Table 1, we resort to official data for computing our dependent variable,
emp_rate. The Structural Business Survey (SBS) of Eurostat provides information at
for 68 2-digit sectors on characteristics, among which the number of employees.
Whereas most of the literature focuses on (total factor) productivity as dependent
variable (Javorcik, 2004; Altomonte and Pennings, 2009; Beugelsdijk et al., 2008), we
argued that employment is appropriate for analyzing innovative crossover opportunities
Table 1: Descriptive statistics VARIABLES N Mean sd min max Empl (ln) 92,309 7.729 1.822 0 13.13 MNE_num (ln) 138,528 1.108 1.377 0 8.214 No_MNE (dummy) 138,528 0.337 0.473 0 1 MNE_num_rel (ln) 138,528 8.116 6.292 0 46.93 MNE exit (dummy) 138,528 0.0428 0.202 0 1 MNE entry (dummy) 138,528 0.301 0.459 0 1 MNE rel_exit (dummy) 138,528 0.0406 0.0888 0 0.922 MNE rel_entry (dummy) 138,528 0.288 0.302 0 1 TotR&D 137,520 1.526 1.229 0.0600 11.36 PhK (ln) 136,552 5.273 0.602 0.284 7.029 GDP (ln) 136,960 3.353 0.984 0.0751 6.242 HK_tert 136,960 0.122 0.0449 0.0366 0.328 Firm_num (ln) 98,014 5.466 2.003 -0.693 11.81 MNE_emp_sp (ln) 138,528 69.34 37.95 0 230.9 iv_b_nor_eu 138,528 12.98 49.33 0 2,436
18
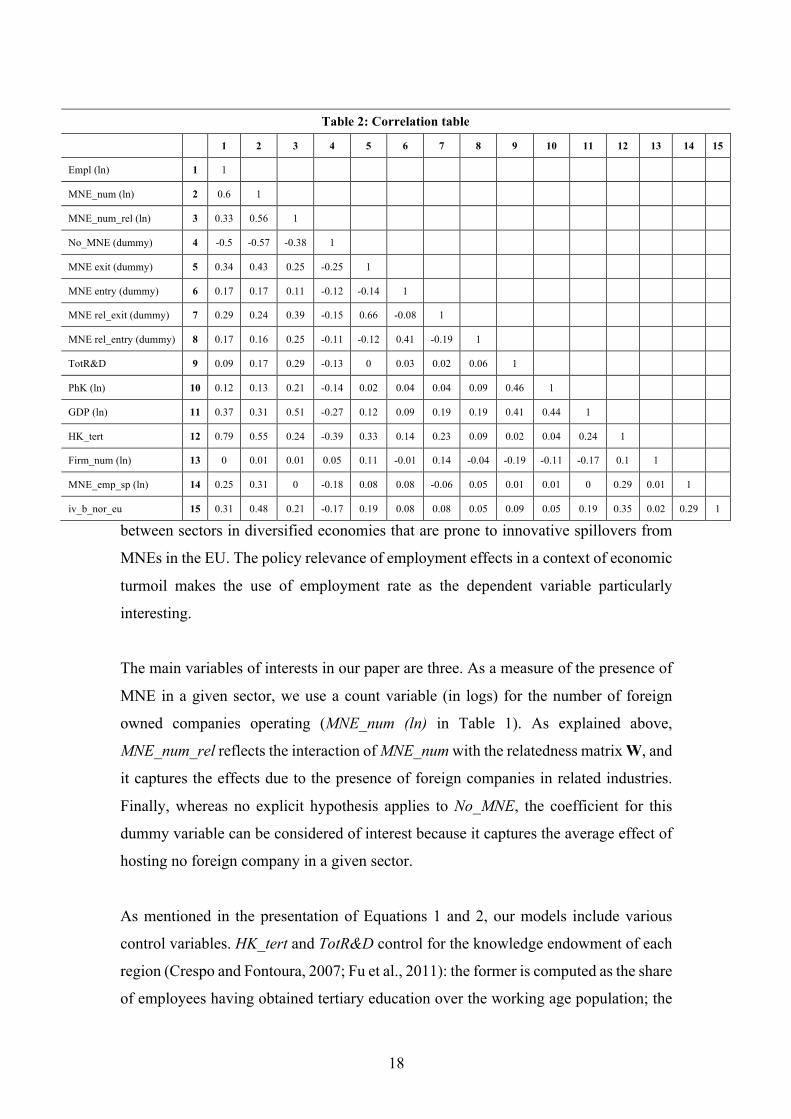
between sectors in diversified economies that are prone to innovative spillovers from
MNEs in the EU. The policy relevance of employment effects in a context of economic
turmoil makes the use of employment rate as the dependent variable particularly
interesting.
The main variables of interests in our paper are three. As a measure of the presence of
MNE in a given sector, we use a count variable (in logs) for the number of foreign
owned companies operating (MNE_num (ln) in Table 1). As explained above,
MNE_num_rel reflects the interaction of MNE_num with the relatedness matrix W, and
it captures the effects due to the presence of foreign companies in related industries.
Finally, whereas no explicit hypothesis applies to No_MNE, the coefficient for this
dummy variable can be considered of interest because it captures the average effect of
hosting no foreign company in a given sector.
As mentioned in the presentation of Equations 1 and 2, our models include various
control variables. HK_tert and TotR&D control for the knowledge endowment of each
region (Crespo and Fontoura, 2007; Fu et al., 2011): the former is computed as the share
of employees having obtained tertiary education over the working age population; the
Table 2: Correlation table
1 2 3 4 5 6 7 8 9 10 11 12 13 14 15
Empl (ln) 1 1
MNE_num (ln) 2 0.6 1
MNE_num_rel (ln) 3 0.33 0.56 1
No_MNE (dummy) 4 -0.5 -0.57 -0.38 1
MNE exit (dummy) 5 0.34 0.43 0.25 -0.25 1
MNE entry (dummy) 6 0.17 0.17 0.11 -0.12 -0.14 1
MNE rel_exit (dummy) 7 0.29 0.24 0.39 -0.15 0.66 -0.08 1
MNE rel_entry (dummy) 8 0.17 0.16 0.25 -0.11 -0.12 0.41 -0.19 1
TotR&D 9 0.09 0.17 0.29 -0.13 0 0.03 0.02 0.06 1
PhK (ln) 10 0.12 0.13 0.21 -0.14 0.02 0.04 0.04 0.09 0.46 1
GDP (ln) 11 0.37 0.31 0.51 -0.27 0.12 0.09 0.19 0.19 0.41 0.44 1
HK_tert 12 0.79 0.55 0.24 -0.39 0.33 0.14 0.23 0.09 0.02 0.04 0.24 1
Firm_num (ln) 13 0 0.01 0.01 0.05 0.11 -0.01 0.14 -0.04 -0.19 -0.11 -0.17 0.1 1
MNE_emp_sp (ln) 14 0.25 0.31 0 -0.18 0.08 0.08 -0.06 0.05 0.01 0.01 0 0.29 0.01 1
iv_b_nor_eu 15 0.31 0.48 0.21 -0.17 0.19 0.08 0.08 0.05 0.09 0.05 0.19 0.35 0.02 0.29 1
19
latter is the share of total R&D expenditure over regional GDP. Similarly, we included
the level of GDP of the region (GDP (ln)) to control for the economic size of the region.
Whereas these three variables are measured at regional level, PhK – measuring the
share of capital formation over Gross Value Added (GVA) – is measured for the six
“macro” sectors available from Cambridge Econometrics. Through PhK we are able to
control for the level of investment in those macro-sectors (Basile et al., 2012). Finally,
in order to control for local agglomeration economies and spatial effects, we included
for each 2-digit NACE industry, the log number of local units sector (Firm_num (ln))
and the spatially lagged version of MNE_num (MNE_num_sp (ln)) (Alfaro and Chen,
2014). This last variable is computed by multiplying the log number of MNEs in each
of the sectors of a neighboring region Z, for the measure of geographical proximity of
Z and the focal region R.
ECONOMETRIC ANALYSIS
The results from our baseline models are reported in Table 3 and 4. In the tables, the
heading of each column indicates whether the coefficients refer to the economy as a
whole (All), to low-knowledge industries (LKI), to high-knowledge industries (HKI)
or to knowledge intensive business services (KIBS). The heading also specifies whether
the estimates refer to the whole sample, more advanced regions (with GDP per capita
above the EU average in 2010) or less advanced areas (with GDP per capita below the
EU average in 2010).
TABLE 3 AROUND HERE
The estimates reported in Table 3 confirm our Hypotheses 1, 3 and 4. More specifically,
a high presence of foreign companies at time t-1 is associated with a high level of
employment at time t within the same sector. The coefficients for the variable
MNE_num are in fact positive and significant across the different types of sectors.
However, the size of the coefficients changes when the analysis is performed across
different groups of industries: the effect of MNEs on local employment more than
20
doubles when moving from less advanced industries (Table 3, column 2) to high-
knowledge ones and knowledge intensive services (Column 3 and 4). As theorized in
Hypothesis 3, more knowledge intensive parts of the economy are more strongly
influenced by the presence of foreign companies. At the same time, however, sectors
which host no foreign company do not seem to do significantly worse than the others.
The coefficients for No_MNE are in fact negative, though only one of them is
significantly different from zero. With respect to Hypothesis 4 and regional
heterogeneity, the results of the baseline model suggest a stronger intra-industry effect
of MNE in less advanced regions. Finally, whereas different control variables did not
produce significant coefficients, the levels of investments (PhK) and of sectoral level
agglomerations (Firm_num) are both strongly associated with higher employment rate,
as expected.
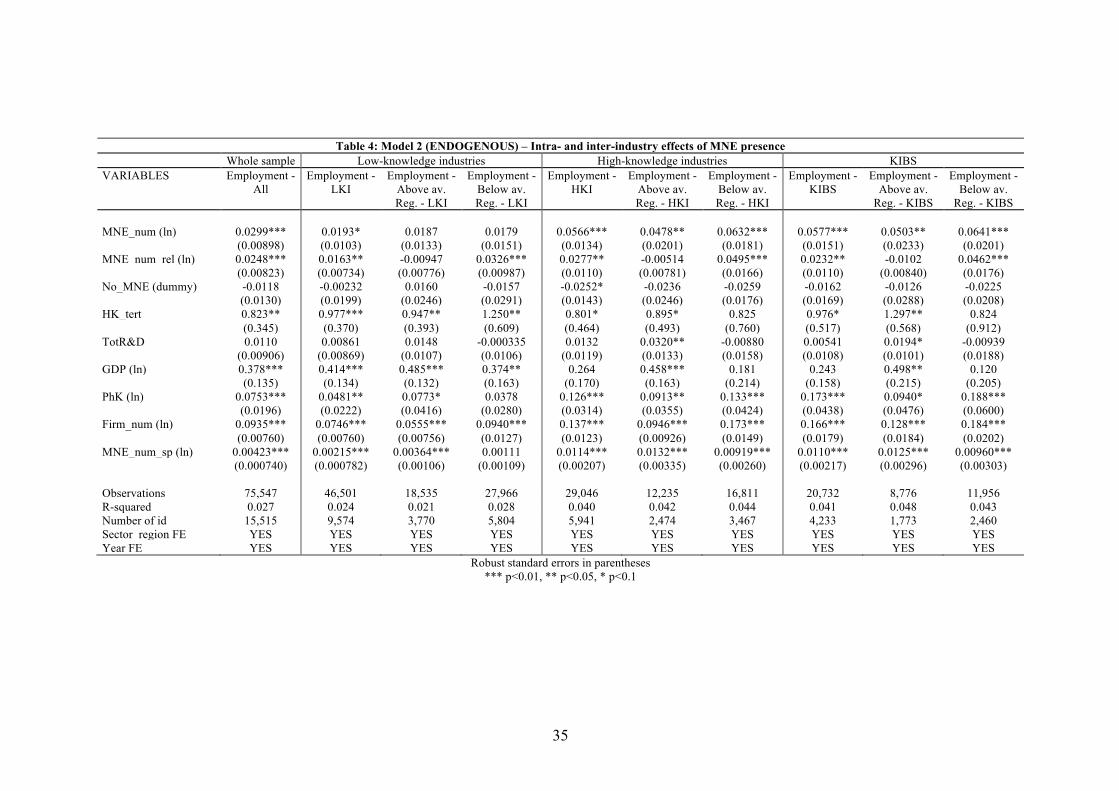
The main focus of this analysis is on the use of cognitive relatedness for studying MNE
inter-industry spillovers, investigated through our last two models. Table 4 reports the
estimated coefficients for Equation 2.
TABLE 4 AROUND HERE
The estimates reported in the columns of Table 4 highlight heterogeneity in the relation
between the presence of foreign companies and their employment effects on the hosting
economy. Hypothesis 1 finds further support, as MNE_num remains positive and
significant throughout most of the specifications. Also the differences in terms of the
size of the coefficients between more and less advanced EU regions and between more
and less knowledge intensive industries remain unchanged. Coefficients reported in
Table 4 test also for Hypothesis 2, concerning the effect of MNE presence in related
industries. The number of foreign companies from related industries appears to
significantly impact sectoral employment, a part from most advanced regions.
Remarkably, in line with the results for MNE_num, also MNE_num_rel indicates a
stronger effect of MNE presence in related industries in the case of most knowledge
intensive sectors. In line with Hypothesis 4, the effect of multinationals in related
industries appears to be mostly driven by less-advanced regions: the coefficients for
MNE_num_rel are always positive significant but in the case of regions with above-
average per capita income.

21
To summarise, our main interest in this analysis was to study the employment effect of
MNE presence within and across industries, as well as across different types of sectors
and regions, using industry-pair co-occurrence relatedness rather than IO-relations as
determining framework of identification. Our baseline hypotheses find overall support.
Both the intra-industry impact (Hypothesis 1) and inter-industry effects (Hypothesis 2)
of MNE appear to be positive, though with substantial differences across groups of
industries and regions.
Instrumental variable estimation and robustness checks
Different methodological issues may be affecting the models and results discussed in
the previous pages. A first concern reflects the fact that the location choice of MNEs is
likely to be endogenous, thus implying that the relations found in the previous models
may be due to reverse causality. Given the direct relation between location choices of
the MNEs and sectoral performance, this problem is likely to be especially acute in the
case of intra-industry effects. As multinationals select themselves in the region-industry
pairs for location, it is unlikely they would choose to locate in areas performing
comparatively worse than others or lacking critical resources such as suitable
infrastructure, human capital or other intangible assets (see Karreman et al. 2017). This
implies that the current number of MNEs present in an industry-region is likely to be
driven by previous performance, and thus previous employment levels. A second
potentially problematic aspect relates to the fact that the presence of multinationals
may, by itself, induce a positive effect on employment within the same sector-region.
As multinationals tend to be larger in terms of employment, it cannot be excluded that
their presence may by construction lead to a higher level of sectoral employment. We
address both these concerns in two robustness checks: firstly, we construct a Bartik-
type of instrumental variable (IV) and re-estimate our models using two-stage panel
data techniques; secondly, we test our results looking at non-MNE employment in a
subsample of industry-regions.
We start with our IV strategy. Since the main explanatory variables are likely to be
endogenous, we construct a apply an IV strategy using a shift-share Bartik instrument
(Faggio and Overman, 2014; Crescenzi et al., 2015; Ascani and Gagliardi, 2015). The

22
aim of the insturment is approximate the number of multinationals present in each
industry-region group, excluding the effect of characteristics specific to the group itself
which may drive the location choices of MNEs. For doing this we compute the
instrument for the (log) number of MNEs following Equation 7:
iv_b_nor_eu",$,% =/01_KJ91P_2006",$
/01_KJ91P_2006",$$
∗ /01_+,-",$,% −
$
/01_+,-",$,% (7)
In the formula above, i refers to the industry and r to the region to whom the region
belongs. The instrument essentially redistributes the number of MNEs in sector i
(excluding from the count the MNEs in sector s in region r) according to the respective
share of firms in the sector i in region r in 2006. The exclusion of the number of MNEs
in the region (the second term in Equation 7) helps addressing the problem of
endogeneity (Faggio and Overman, 2014). Besides, exploiting the within region-
industry variation over time in our instruments reduces the concerns for using the
potentially endogenous share of firms by sector in 2006 (the first term in Equation 7).
Generally speaking, estimating IV regressions with more than one endogenous variable
is complicated and generally adviced against (Agrinst and Pischke, 2009). In our case,
the number of potentially endogenous variables, the similarity of two instruments and
the different industrial and regional dimensions to cut our sample across make the IV
estimation especially problematic. Given these challenges, and considering that
reverse-casuality may be a problem for espectially intra-industry effects, we focus
robustness checks on endogeneity only on Model 15.
TABLE 5 (IV) + TABLES WITH FIRST STAGE ESTIMATION
Table 5 reports the estimates and the statistics referring to IV estimation. The F-tests
reported at the bottom of the table are all above the rule of thumb threshold of 10,
usually applied in the literature, thus indicating the validity of the chosen instrument.
5 We tried also adopting a similar strategy for instrumenting for the number of MNEs in related industries, by interacting the instrument iv_b_nor_eu with the previously computed relatedness matrix (Bloom et al., 2013). Whereas the instrumental variable estimations appear to work solidly for Model 1, the same is not true for Model 2: once both endogenous variables are included, the instruments jointly perform poorly.

23
Overall, the results shown in Table 5 provide a more solid confirmation of the
conclusions reached in the previous analyses. Whereas the second stage coefficients are
not found to be significant in the whole sample and in the low-knowledge industries,
the effects of MNE presence on employment in the same industry are positive
significant for high-knowledge sectors and KIBS. The positive effects and the sectoral
heterogeneity find solid evidence in our IV estimates, even though the size of the
coefficients suggest a stronger effect in regions with higher per capita income, unlike
in Table 3.
With respect to the second issue (non-MNE employment), we perform the same
analysis as in Tables 3 and 4, this time looking only at employment in non-multinational
firms. To implement this robustness check, we use information from Orbis to compute
the level of employment in each industry-region accruing to firms which are not
foreign-owned. Because of the low reliability of information for certain countries
(Kalemli-Ozcan et al. 2015), due to the missing information on firm-level employment,
we restrict the sample of region considered in our robustness check6. More precisely,
we select regions in countries for which the minimum correlation between data on
employment in each industry according to Orbis and Eurostat SBS is 70%7. Having
selected only countries with highly reliable data, we compute the (log) number of
employees in nationally owned firms and re-estimate Models 1 and 2 once again. Both
models are also estimated for the high-knowledge, low-knowledge and KIBS
industries, whereas we do not group the regions along the per capita income categories
due to the reduced heterogeneity in the regions included in the sample for this
robustness check.
TABLE 7, 8 (NON-MNE EMPLOYMENT)
6 It should be noticed that, whereas the firm level information on employment in Orbis may have missing values, the analysis so far has been carried out using ownership information, which does not suffer from the same problem. 7 This implies that if even in one sector in one region, a country has correlation lower than 70%, it will not be included in the analysis. Finally, region-industries within the following 19 countries are included in the robustness check: Austria, Belgium, Bulgaria, Czech Republic, Denmark, Finland, France, Hungary, Lithuania, Latvia, Luxembourg, Norway, Poland, Portugal, Romania, Slovenia, Slovakia Spain and Sweden.

24
Table 7 and Table 8 reproduce the results for the robustness checks on non-MNE
employment. Even though the regional dimension had to be ignored, the estimates on
the reduced sample of countries highlight positive significant relations between
MNE_num and MNE_num_rel, from the one hand, and non-MNE employment on the
other. Such positive significant relations therefore confirm the positive effect of MNEs.
Besides, it is interesting to notice how, in line with the previous literature on local firm
productivity (Javorcik, 2004), the inter-industry effect of MNE presence appears to be
stronger than the intra-industry ones. Also, the results for non-MNE employment
indicate a similar pattern in terms of industrial heterogeneity: the estimated coefficients
for both MNE_num and MNE_num_rel are larger for the knowledge intensive part of
the economy than for low-knowledge industries and the sample as a whole.
The robustness checks provide a general confirmation of our conclusions. Our
instrumental variable strategy, based on a Bartik-type of instrument, confirms the
existence of positive intra-industry spillovers, as well as their stronger effects in the
case of more knowledge intensive industries. Whereas we are not able to apply the same
instrumental variable method to Equation 2, due to the presence of multiple endogenous
variables, we would expect the robustness of the results for Model 1 to bear on the
estimates of Model 2. As a further check on the solidity of our results, we briefly look
at the effect of MNE presence on non-MNE employment. Whereas we perform this
check on a smaller sample of regions, the existence of positive MNE spillovers both
intra- and inter-industry is confirmed. Hypotheses 3 and 4 theorize a stronger effect of
MNEs for advanced industries and for regions with lower per capita income.
Hypothesis 3 proves to be accurate. High-knowledge sectors and knowledge intensive
services consistently show higher and more significant coefficients for MNE presence,
both within and across industries. Results are less clear-cut when investigating regional
heterogeneity. From our standard panel results, less advanced EU regions seem to
benefit more than other areas from presence of foreign companies (hypothesis 4).
However, once we implement our instrumental variable strategy, the size of the
coefficients indicates a stronger effect in the case of regions with per capita income
above the EU average.
CONCLUSIONS
25
The cross-sectoral effect of MNEs and the existence of preconditions for the local
economy to benefit from foreign companies are nowadays well-established facts. The
present paper contributes to this debate in two main ways. First, it shows that cross-
sectoral externalities related to MNE presence transcend vertical input-output linkages
in which current economic literature confine them (Javorcik, 2004; 2013). While a
limitation of this study is undoubtedly the use of relatively aggregated data at the second
digit of NACE classification, the positive results obtained by our relatedness-based
measures at such aggregate level suggest that input-output relations are not the only
channels through which knowledge spillovers take place. Second, in this paper we try
to disentangle the heterogeneous effects of MNEs by linking them to sectoral and
regional differences. Our results suggest that these sources of heterogeneity have to be
adequately taken into account in order to better grasp the mechanics of MNE
externalities. We show that within- and cross-sector linkages to foreign company are
particularly important for knowledge intensive industries (with relative high degrees of
absorptive capacity) and for low-income regions.
Nonetheless, some limitations emerge from our study. The lack of more disaggregated
data forced us to perform the analysis based on 68 2-digit NACE sectors. This implies
different potential shortcomings. First, our intra-regional spillovers are by definition
rather broad, potentially encompassing what other researchers have been able to capture
as cross-sectoral linkages. As argued above, this represents a limitation for this study,
though it also reinforces our critique to the use of mere input-output relations as
channels for knowledge spillovers. If some effects of relatedness are found across
broadly defined sectors, even stronger results may be found using relatedness in more
disaggregated settings. Second, in this paper we account for endogeneity issues as much
as possible by using IV estimation strategies. The use of sector-region fixed effects and
different types of control variables also reduce our concerns. A methodology capturing
IV-estimation at both stages of estimation is difficult, while still worthwhile to pursue.
Thirdly, the use of employment as a dependent variable, although suggested by theory
in a consistent way, may also be considered a limitation, in that it reduces the
comparability of our results with other studies in the literature. In this sense, while
looking at employment effects of MNEs is very relevant in a period of economic
turbulence, replicating our study using models focused on productivity will represent

26
an important additional test for our conclusions. Relations between employment and
productivity (over the life-cycle of industries and products) then have to be taken into
account.
It is worth highlighting some emerging venues for further research. First of all, both
theoretical and empirical investigations are needed to understand through what
channels, other than input-output relations, MNE spillovers may take place. For
instance, relatedness literature tends to stress cognitive and technological similarity (in
labour mobility for instance) as media for knowledge externalities. These types of
linkages have arguably found little attention in international business literature.
Secondly, industrial heterogeneity should also be explored more thoroughly, in
particular analyzing with greater level of details what sectors are more prone to benefit
from the presence of foreign firms. Recent contributions in regional economics and
economic geography have stressed the importance of institutions in affecting the
behavior of actors and the functioning of the local economy (Acemoglu and Robinson,
2012; Cortinovis et al., 2017; Rodriguez-pose, 2013). Obtaining further insights on how
different local conditions may affect knowledge, employment and productivity
externalities of MNEs would provide valuable elements to the discussion both in the
academia and policy circles.

27
REFERENCES Acemoglu, D., and Robinson, J.A. (2012). Why nations fail: the origins of power,
prosperity and poverty. New York: Random House.
Aitken, B.J. and Harrison, A.E. (1999). Do domestic firms benefit from direct foreign
investment? Evidence from Venezuela. American Economic Review 89: 605-618.
Alfaro L., Chanda A ., Kalemli-Ozcan S., and Sayek S. (2004). FDI and economic
growth: the role of local financial markets. Journal of International Economics 64(1),
89-112.
Alfaro L., and Chen M. (2014). The global agglomeration of multinational firms.
Journal of International Economics 94(2): 263–276.
Altomonte C., and Pennings E. (2009). Domestic plant productivity and incremental
spillovers from foreign direct investment. Journal of International Business Studies
40(7): 1131-1148.
Angrist, J. D., and Pischke, J.-S. (2009). Mostly harmless econometrics: An empiricist's
companion. Princeton: Princeton University Press.
Annoni, P., Dijkstra, L. and Gargano, N. (2017). The European Regional
Competitivness Index 2016. Brussels, EU Working Paper 02/2017.
Arnold, J.M. and Javorcik, B.S. (2009). Gifted kids or pushy parents? Foreign direct
investment and plant productivity in Indonesia. Journal of International Economics 79:
42-53.
Alvarez R. and Görg H. (2007). Multinationals as stabilizers?: economic crisis and
plant employment growth. GEP Research Paper 07/15, University of Nottingham .
Alvarez R., Görg H. (2009). Multinationals and plant exit: evidence from Chile,
International Review of Economics & Finance 18 (1): 45-51.
Audretsch, D. and Feldman, F.P. (1996). R&D spillovers and geography of innovation
and production. American Economic Review 86: 630-640.

28
Barba Navaretti, G. and Venables, A J. (2004). Multinational Firms in the World
Economy, Princeton, NJ, Princeton University Press.
Basile, R., Capello, R. and Caragliu, A. (2012). Technological interdependence and
regional growth in Europe: Proximity and synergy in knowledge spillovers. Papers in
Regional Science 91(4): 697–722.
Beugelsdijk, S., Smeets, R. and Zwinkels, R. (2008). The impact of horizontal and
vertical FDI on host’s country economic growth. International Business Review 17:
452-472.
Bitzer J., Geishecker I., and Görg H. (2008). Productivity spillovers through vertical
linkages: Evidence from 17 OECD countries. Economics Letters 99(2): 328-331.
Blomström, m., and Kokko, A. (2003). The Economics of Foreign Direct Incentives.
NBER Working Paper 9489.
Bloom, N., Schankerman M., and Van Reenen, J. (2013). Identifying Technology
Spillovers and Product Market Rivalry. Econometrica, 81(4):1347-1393.
Boschma, R. and Capone, G. (2015). Institutions and diversification: related versus
unrelated diversification in a varieties of capitalism framework. Research Policy 44:
1902-1914.
Boschma, R. (2005). Proximity and innovation: a critical assessment. Regional Studies
39: 61-74.
Boschma, R.A. and Wenting, R. (2007). The spatial evolution of the British automobile
industry: does location matter? Industry and Corporate Change 16(2): 213-238.
Boschma, R., Minondo, A., and Navarro, M (2013). The emergence of new industries
at the regional level in Spain: A proximity approach based on product relatedness.
Economic Geography 89: 29-51.
Brambilla, I. (2009). Multinationals, technology, and the introduction of varieties of
goods. Journal of International Economics 79: 89-101.

29
Branstetter, L. (2006). Is foreign direct investment a channel for knowledge spillovers?
Evidence from Japan’s FDI in the United States. Journal of International Economics
68: 325-344.
Burger, M.J., Van der Knaap, B. and Wall; R.S. (2013). Revealed competition for
greenfield investments between European regions. Journal of Economic Geography
13(4): 619–648.
Caragliu A. and Nijkamp P. (2015). Space and knowledge spillovers in European
regions: the impact of different forms of proximity on spatial knowledge diffusion.
Journal of Economic Geography, 16 (3): 749-774.
Cipollina, M., G. Giovannetti, F. Pietrovito and A. F. Pozzolo (2012). FDI and growth:
what cross-country industry data say. The World Economy 35: 1599–629.
Cohen, W. M. and Levinthal D. A. (1990). Absorptive capacity: a new perspective on
learning and innovation. Administrative Science Quarterly 35(1): 128-152.
Cortinovis N., Xiao J., Boschma R. and Van Oort, F. (2017). Quality of government
and social capital as drivers of regional diversification in Europe, Journal of Economic
Geography, 17: 1179–1208.
Crescenzi R., Gagliardi L., and Iammarino S. (2015). Foreign multinationals and
domestic innovation: Intra-industry effects and firm heterogeneity. Research Policy
44:596-609.
Crespo, N., Fontoura, M. P. and Proença, I. (2009). FDI spillovers at regional level:
Evidence from Portugal. Papers in Regional Science 88: 591–607
Crespo, N. and Fontoura, M.P. (2007). Determinant factors of FDI spillovers—what do
we really know? World Development 35(3), 410–425.
Damijan, J., Knell, M., Majcen, B. and Rojec, M. (2003). Technology transfer through
FDI in top 10 transition countries: how important are direct effects, horizontal and
vertical spillovers? William Davidson Working Paper no. 549
Dogaru, T., Burger, M.J., Karreman B., and van Oort, F. (2015). Functional and
sectoral division of labour within Central and Eastern European countries: evidence

30
from greenfield FDI. Journal of Economic and Social Geography (TESG) 106: 120-
129
Van Eck, N. J.and Waltman, L. (2009), How to normalize co-occurrence data? An
analysis of some well-known similarity measures. Journal of the Association for
Information Science and Technology, 60: 1635–1651.
Ernst, D. and Kim, L. (2002). Global production networks, knowledge diffusion, and
local capability formation. Research Policy 31: 1417-1429.
Ertur, C. and Koch, W. (2007). Growth, technological interdependencies and spatial
externalities: theory and evidence. Journal of Applied Econometrics 22: 1033-1062.
Faggio G. and Overman, H. (2014). The effect of public sector employment on local
labour markets. Journal of Urban Economics 79:91-107.
Frenken K., Van Oort F. and Verburg T. (2007). Related variety, unrelated variety and
regional economic growth, Regional studies 41(5): 685-697.
Fu, X. (2008). Foreign direct investment, absorptive capacity and regional innovation
capabilities. Oxford Development Studies 36: 89-110.
Fu X., Pietrobelli C. and Soete L. (2011). The role of foreign technology and indigenous
innovation in the emerging economies: technological change and catching-up. World
Development 39(7): 1204-12.
Glaeser, E., Kallal, H., Scheinkman, J., Shleifer, A. (1992). Growth in cities. Journal
of Political Economy 100 (6): 1126 – 1152.
Görg, H., and Greenaway D. (2004). Much ado about nothing? Do domestic firms really
benefit from foreign direct investment? World Bank Research Observer 19: 171–197
Greunz, L. (2003). Geographically and technologically mediated knowledge spillovers
between European regions. Annals of Regional Science 37:657–680
Guadalupe, M., Kuzmina, O., and Thomas, C., (2012), Innovation and foreign
ownership. American Economic Review 102: 3594-3627.
31
Harding, T. and Javorcik, B. (2011). Roll out the red carpet and they will come:
investment promotion and FDI inflows. Economic Journal 121: 1445-1476.
Hausmann, R., and Klinger, B. (2007). The structure of the product space and the
evolution of comparative advantage. CID Working Paper, No. 146. Cambridge, MA:
Center for International Development, Harvard University.
Havranck, T. and Irsova, Z. (2011). Estimating vertical spillovers from FDI: why
results vary and what the true effect is. Journal of International Economics 85: 234-
244.
Hidalgo, C.A., Klinger, B., Barabàsi, A.L., and Hausmann, R. (2007). The product
space conditions the development of nations. Science 317: 482-487.
Iammarino, S. and McCann, P. (2013). Multinationals and economic geography:
location, technology and innovation. Edward Elgar, Cheltenham, UK.
Javorcik, B. (2004). Does foreign direct investment increase the productivity of
domestic firms? In search of knowledge spillovers through backward linkages.
American Economic Review 94: 605-627.
Javorcik, B. (2008). Can survey evidence shed light on spillovers from foreign direct
investment. World Bank Research Observer 23: 139-159.
Javorcik B. (2013). Does FDI bring good jobs to host countries? World Bank Research
Observer 30 (1): 74-94.
Javorcik, B., Lo Turco, A. and Maggioni, D. (2017). New and improved: does FDI
boost production complexity in host countries? CEPR Discussion Paper DP11942.
Kleinert, Jšrn, Julien Martin and Farid Toubal. 2015. "The Few Leading the Many:
Foreign Affiliates and Business Cycle Comovement." American Economic Journal:
Macroeconomics, 7(4): 134-59.
Kugler, M. (2006). Spillovers from foreign direct investment: Within or between
industries?. Journal of Development Economics 80(2): 444-477
Blomström, M. and Kokko, A. (2003) The economics of foreign direct investment
32
incentives. NBER Working Paper No. 9489.
Kokko A., (1994). Technology, market characteristics, and spillovers, Journal of
Development Economics 43(2): 279-29.
Lin, M. and Kwann, Y.P. (2016). FDI technology spillovers, geography and spatial
diffusion. Journal of International Economics 43: 257-274.
Lin, P. and Saggi, K. (2007). Multinational firms, exclusivity, and backward linkages.
Journal of International Economics 71: 206-220.
Lu, Y., Tao, Z. and Zhu, L. (2017), Identifying FDI spillovers. Journal of International
Economics 107: 75-90.
Maggioni M. and Uberti E. (2009). Knowledge networks across Europe: which distance
matters? Annals of Regional Science 43(3): 691-720.
Marcin, K. (2008). How does FDI inflow affect productivity of domestic firms? The
role of horizontal and vertical spillovers, absorptive capacity and competition. The
Journal of International Trade and Economic Development 17: 155-173.
Meyer, K. and Sinani, E. (2009). Where and When Does Foreign Direct Investment
Generate Positive Spillovers? A Meta Analysis. Journal of International Business
Studies 40(7): 1075-1094.
Narula, R., and Dunning, J. (2000). Industrial Development, Globalization and
Multinational Enterprises: New Realities for Developing Countries. Oxford
Development Studies 28(2): 141-167.
Neto, P. Brandão, A. and Cerqueira, A., (2008). The impact of FDI, cross border
mergers and acquisitions and greenfield investments on economic growth. FEP No.
291.
Oberhofer, H. (2013). Employment effects of acquisitions: evidence from acquired
European firms. Review of Industrial Organization 42(3): 345-363.

33
Perri, A. and Peruffo, E. (2016). Knowledge spillovers from FDI: a critical review from
the international business perspective. International Journal of Management Reviews
18 (1): 3-27
Protsenko, A. (2003). Vertical and horizontal Foreign Direct Investments in transition
countries. Ph.D. thesis. Ludwig-Maximilians-University Munich.
Rodríguez-Pose, A. (2013). Do institutions matter for regional development? Regional
Studies 47: 1034-1047.
Steijn, M.P.A. (2016). Improvement on the association strength: implementing
probability measures based on combinations without repetition. Mimeo, Utrecht
University.

34
Table 3: Model 1 (ENDOGENOUS) - Intra-industry effects of MNE presence
Whole sample Low-knowledge industries High-knowledge industries KIBS
VARIABLES Employment - All
Employment - LKI
Employment - Above av. Reg. - LKI
Employment - Below av. Reg. - LKI
Employment - HKI
Employment - Above av. Reg. - HKI
Employment - Below av. Reg. - HKI
Employment - KIBS
Employment - Above av.
Reg. - KIBS
Employment - Below av.
Reg. - KIBS MNE_num (ln) 0.0427*** 0.0266** 0.0149 0.0325* 0.0744*** 0.0446** 0.0935*** 0.0736*** 0.0435* 0.0940*** (0.0113) (0.0113) (0.0134) (0.0170) (0.0164) (0.0199) (0.0234) (0.0177) (0.0232) (0.0253) No_MNE (dummy) -0.0127 -0.00301 0.0163 -0.0174 -0.0259* -0.0233 -0.0257 -0.0162 -0.0121 -0.0208 (0.0130) (0.0199) (0.0247) (0.0291) (0.0143) (0.0247) (0.0177) (0.0169) (0.0288) (0.0209) HK_tert 0.952*** 1.063*** 0.866** 1.311** 0.947** 0.861* 0.960 1.096** 1.227** 0.926 (0.340) (0.374) (0.408) (0.608) (0.458) (0.485) (0.760) (0.523) (0.556) (0.912) TotR&D 0.0107 0.00833 0.0149 -0.00159 0.0130 0.0319** -0.0115 0.00511 0.0191* -0.0128 (0.00915) (0.00869) (0.0107) (0.0105) (0.0121) (0.0132) (0.0158) (0.0112) (0.00988) (0.0189) GDP (ln) 0.393*** 0.424*** 0.485*** 0.392** 0.278 0.461*** 0.212 0.258 0.506** 0.155 (0.137) (0.135) (0.133) (0.166) (0.173) (0.162) (0.218) (0.159) (0.213) (0.204) PhK (ln) 0.0763*** 0.0484** 0.0768* 0.0345 0.128*** 0.0919** 0.133*** 0.173*** 0.0974** 0.191*** (0.0198) (0.0220) (0.0415) (0.0273) (0.0325) (0.0356) (0.0447) (0.0448) (0.0481) (0.0631) Firm_num (ln) 0.0940*** 0.0748*** 0.0560*** 0.0964*** 0.138*** 0.0950*** 0.180*** 0.169*** 0.128*** 0.192*** (0.00800) (0.00765) (0.00745) (0.0127) (0.0133) (0.00903) (0.0180) (0.0194) (0.0184) (0.0238) MNE_emp_sp (ln) 0.00419*** 0.00210*** 0.00368*** 0.00108 0.0114*** 0.0132*** 0.00915*** 0.0106*** 0.0127*** 0.00876*** (0.000742) (0.000782) (0.00106) (0.00109) (0.00207) (0.00335) (0.00262) (0.00221) (0.00295) (0.00310) Observations 75,547 46,501 18,535 27,966 29,046 12,235 16,811 20,732 8,776 11,956 R-squared 0.026 0.024 0.021 0.027 0.038 0.042 0.041 0.040 0.048 0.040 Number of id 15,515 9,574 3,770 5,804 5,941 2,474 3,467 4,233 1,773 2,460 Sector_region FE YES YES YES YES YES YES YES YES YES YES Year FE YES YES YES YES YES YES YES YES YES YES
Robust standard errors in parentheses *** p<0.01, ** p<0.05, * p<0.1
35
Table 4: Model 2 (ENDOGENOUS) – Intra- and inter-industry effects of MNE presence
Whole sample Low-knowledge industries High-knowledge industries KIBS VARIABLES Employment -
All Employment -
LKI Employment -
Above av. Reg. - LKI
Employment - Below av. Reg. - LKI
Employment - HKI
Employment - Above av. Reg. - HKI
Employment - Below av. Reg. - HKI
Employment - KIBS
Employment - Above av.
Reg. - KIBS
Employment - Below av.
Reg. - KIBS MNE_num (ln) 0.0299*** 0.0193* 0.0187 0.0179 0.0566*** 0.0478** 0.0632*** 0.0577*** 0.0503** 0.0641*** (0.00898) (0.0103) (0.0133) (0.0151) (0.0134) (0.0201) (0.0181) (0.0151) (0.0233) (0.0201) MNE_num_rel (ln) 0.0248*** 0.0163** -0.00947 0.0326*** 0.0277** -0.00514 0.0495*** 0.0232** -0.0102 0.0462*** (0.00823) (0.00734) (0.00776) (0.00987) (0.0110) (0.00781) (0.0166) (0.0110) (0.00840) (0.0176) No_MNE (dummy) -0.0118 -0.00232 0.0160 -0.0157 -0.0252* -0.0236 -0.0259 -0.0162 -0.0126 -0.0225 (0.0130) (0.0199) (0.0246) (0.0291) (0.0143) (0.0246) (0.0176) (0.0169) (0.0288) (0.0208) HK_tert 0.823** 0.977*** 0.947** 1.250** 0.801* 0.895* 0.825 0.976* 1.297** 0.824 (0.345) (0.370) (0.393) (0.609) (0.464) (0.493) (0.760) (0.517) (0.568) (0.912) TotR&D 0.0110 0.00861 0.0148 -0.000335 0.0132 0.0320** -0.00880 0.00541 0.0194* -0.00939 (0.00906) (0.00869) (0.0107) (0.0106) (0.0119) (0.0133) (0.0158) (0.0108) (0.0101) (0.0188) GDP (ln) 0.378*** 0.414*** 0.485*** 0.374** 0.264 0.458*** 0.181 0.243 0.498** 0.120 (0.135) (0.134) (0.132) (0.163) (0.170) (0.163) (0.214) (0.158) (0.215) (0.205) PhK (ln) 0.0753*** 0.0481** 0.0773* 0.0378 0.126*** 0.0913** 0.133*** 0.173*** 0.0940* 0.188*** (0.0196) (0.0222) (0.0416) (0.0280) (0.0314) (0.0355) (0.0424) (0.0438) (0.0476) (0.0600) Firm_num (ln) 0.0935*** 0.0746*** 0.0555*** 0.0940*** 0.137*** 0.0946*** 0.173*** 0.166*** 0.128*** 0.184*** (0.00760) (0.00760) (0.00756) (0.0127) (0.0123) (0.00926) (0.0149) (0.0179) (0.0184) (0.0202) MNE_num_sp (ln) 0.00423*** 0.00215*** 0.00364*** 0.00111 0.0114*** 0.0132*** 0.00919*** 0.0110*** 0.0125*** 0.00960*** (0.000740) (0.000782) (0.00106) (0.00109) (0.00207) (0.00335) (0.00260) (0.00217) (0.00296) (0.00303) Observations 75,547 46,501 18,535 27,966 29,046 12,235 16,811 20,732 8,776 11,956 R-squared 0.027 0.024 0.021 0.028 0.040 0.042 0.044 0.041 0.048 0.043 Number of id 15,515 9,574 3,770 5,804 5,941 2,474 3,467 4,233 1,773 2,460 Sector_region FE YES YES YES YES YES YES YES YES YES YES Year FE YES YES YES YES YES YES YES YES YES YES
Robust standard errors in parentheses *** p<0.01, ** p<0.05, * p<0.1

36
Table 5: Model 1 (IV) - Intra-industry effects of MNE presence
Whole sample Low-knowledge industries High-knowledge industries KIBS
VARIABLES Employment - All
Employment - LKI
Employment - Above av. Reg. - LKI
Employment - Below av. Reg. - LKI
Employment - HKI
Employment - Above av. Reg. - HKI
Employment - Below av. Reg. - HKI
Employment - KIBS
Employment - Above av. Reg. - KIBS
Employment - Below av. Reg. - KIBS
MNE_num (ln) 0.189 0.0754 -0.0620 0.200 0.479** 0.598* 0.381*** 0.421** 0.387 0.390*** (0.131) (0.145) (0.261) (0.180) (0.191) (0.356) (0.148) (0.204) (0.374) (0.145) No_MNE (dummy) -0.00380 0.000442 0.0117 -0.00417 -0.00707 0.0139 -0.0170 -0.00365 0.00649 -0.0139 (0.0147) (0.0214) (0.0286) (0.0310) (0.0174) (0.0355) (0.0187) (0.0188) (0.0361) (0.0215) HK_tert 0.846** 1.027*** 0.947* 1.245** 0.694 0.429 0.876 0.873 0.923 0.858 (0.368) (0.393) (0.539) (0.605) (0.528) (0.751) (0.766) (0.563) (0.704) (0.912) TotR&D 0.0109 0.00827 0.0154 -0.000422 0.0150 0.0340*** -0.00980 0.00898 0.0223** -0.00944 (0.00901) (0.00868) (0.0109) (0.0103) (0.0120) (0.0126) (0.0160) (0.0115) (0.00952) (0.0200) GDP (ln) 0.388*** 0.422*** 0.479*** 0.387** 0.261 0.592*** 0.185 0.226 0.577** 0.115 (0.135) (0.134) (0.133) (0.163) (0.171) (0.178) (0.211) (0.157) (0.224) (0.200) PhK (ln) 0.0910*** 0.0739*** 0.0564*** 0.0912*** 0.129*** 0.0927*** 0.168*** 0.154*** 0.121*** 0.176*** (0.00816) (0.00789) (0.00762) (0.0133) (0.0129) (0.00919) (0.0175) (0.0202) (0.0187) (0.0242) Firm_num (ln) 0.0744*** 0.0473** 0.0798* 0.0348 0.128*** 0.106** 0.133*** 0.180*** 0.128** 0.189*** (0.0197) (0.0222) (0.0434) (0.0275) (0.0317) (0.0441) (0.0433) (0.0448) (0.0624) (0.0618) MNE_emp_sp (ln) 0.00307*** 0.00165 0.00449 -0.000358 0.0105*** 0.0142*** 0.00787*** 0.0104*** 0.0140*** 0.00770** (0.00119) (0.00158) (0.00297) (0.00192) (0.00214) (0.00356) (0.00270) (0.00227) (0.00342) (0.00318) Observations 75,506 46,466 18,525 27,941 29,040 12,232 16,808 20,729 8,774 11,955 R-squared 0.019 0.023 0.018 0.018 -0.007 -0.082 0.022 0.007 -0.002 0.020 Number of id 15,474 9,539 3,760 5,779 5,935 2,471 3,464 4,230 1,771 2,459 Sector_region FE YES YES YES YES YES YES YES YES YES YES Year FE YES YES YES YES YES YES YES YES YES YES F Test 13.21*** 10.75*** 7.239*** 9.797*** 30.92*** 13.47*** 50.12*** 26.11*** 9.244*** 42.73*** F P-val 0.000335 0.00119 0.00829 0.00209 6.64e-08 0.000381 0 6.23e-07 0.00298 8.71e-10
Robust standard errors in parentheses *** p<0.01, ** p<0.05, * p<0.1

37
Table 6: First stage for regressions in Table 5 (1) (2) (3) (4) (5) (6) (7) (8) (9) (10) VARIABLES Firm - All
(MNE_num (ln))
HKI - All (MNE_num
(ln))
HKI - Above av. Reg.
(MNE_num (ln))
Low tech - Below av. Reg.
(MNE_num (ln))
HKI - All (MNE_num
(ln))
HKI - Above av. Reg.
(MNE_num (ln))
HKI - Below av. Reg.
(MNE_num (ln))
KIBS - All (MNE_num
(ln))
KIBS - Above av. Reg.
(MNE_num (ln))
KIBS - Below av. Reg.
(MNE_num (ln))
iv_b_nor_eu 0.00134*** 0.00111*** 0.000587*** 0.00296*** 0.00325*** 0.00191*** 0.0143*** 0.00300*** 0.00163*** 0.0141*** (0.000369) (0.000339) (0.000218) (0.000946) (0.000585) (0.000520) (0.00202) (0.000587) (0.000535) (0.00216) No_MNE (dummy)
-0.0618*** -0.0716*** -0.0601*** -0.0806*** -0.0483*** -0.0697** -0.0317** -0.0384*** -0.0567** -0.0253*
(0.00916) (0.0124) (0.0201) (0.0158) (0.0137) (0.0273) (0.0138) (0.0142) (0.0271) (0.0153) HK_tert 0.674* 0.705** 1.013** 0.397 0.493 0.659 0.179 0.472 0.732 0.102 (0.346) (0.334) (0.502) (0.389) (0.402) (0.557) (0.534) (0.455) (0.575) (0.666) TotR&D -0.00103 0.00168 0.00623 -0.00654 -0.00401 -0.00294 -0.00323 -0.00990 -0.00823 -0.00760 (0.00456) (0.00505) (0.00548) (0.00848) (0.00578) (0.00719) (0.00864) (0.00728) (0.00945) (0.0109) GDP (ln) 0.0328 0.0376 -0.0734 0.0279 0.0380 -0.231 0.0901 0.0816 -0.209 0.114 (0.0814) (0.0801) (0.157) (0.0866) (0.0942) (0.145) (0.112) (0.120) (0.168) (0.150) Firm_num (ln) 0.0209*** 0.0188*** 0.00535 0.0322*** 0.0234*** 0.00392 0.0395*** 0.0423*** 0.0189 0.0549*** (0.00469) (0.00440) (0.00536) (0.00660) (0.00761) (0.00799) (0.0110) (0.00916) (0.0132) (0.00985) PhK (ln) 0.0129 0.0208 0.0407 -0.00283 -0.000668 -0.0236 0.00222 -0.0176 -0.0827 0.0220 (0.0166) (0.0182) (0.0274) (0.0196) (0.0208) (0.0355) (0.0249) (0.0394) (0.0633) (0.0489) MNE_emp_sp (ln)
0.00731*** 0.00909*** 0.0104*** 0.00817*** 0.00114 -0.00260 0.00212 -0.000389 -0.00439** 0.00117
(0.000681) (0.000825) (0.00119) (0.00111) (0.00124) (0.00197) (0.00154) (0.00144) (0.00217) (0.00186) Observations 75,506 46,466 18,525 27,941 29,040 12,232 16,808 20,729 8,774 11,955 Number of reg_ind
15,474 9,539 3,760 5,779 5,935 2,471 3,464 4,230 1,771 2,459
Sector_region FE
YES YES YES YES YES YES YES YES YES YES
Year FE YES YES YES YES YES YES YES YES YES YES Robust standard errors in parentheses
*** p<0.01, ** p<0.05, * p<0.1

38
Table 7: Model 1 (ENDOGENOUS) - Intra-industry effects of MNE presence on non-MNE employment
Whole sample Low-knowledge industries High-knowledge industries KIBS VARIABLES Non-MNE employment- All Non-MNE employment - LKI Non-MNE employment - HKI Non-MNE employment - KIBS MNE_num (ln) 0.0863*** 0.0714*** 0.110*** 0.120*** (0.0258) (0.0263) (0.0374) (0.0396) No_MNE (dummy) -0.00190 -0.0125 0.0136 0.0117 (0.0248) (0.0308) (0.0430) (0.0505) HK_tert 1.087 1.023 1.199* 1.529** (0.727) (0.827) (0.678) (0.751) TotR&D -0.0140 -0.0163 -0.0105 -0.0202 (0.0107) (0.0113) (0.0134) (0.0142) GDP (ln) 0.0614 0.166 -0.128 -0.282 (0.246) (0.252) (0.282) (0.302) PhK (ln) 0.348*** 0.322*** 0.405*** 0.571*** (0.0705) (0.0815) (0.0747) (0.0965) Firm_num (ln) 0.0326* 0.0488** 0.00335 -0.00884 (0.0194) (0.0231) (0.0197) (0.0208) MNE_emp_sp (ln) -0.000177 0.000500 -0.00295 -0.00766** (0.00111) (0.00122) (0.00267) (0.00306) Observations 26,980 16,895 10,085 7,165 R-squared 0.041 0.049 0.033 0.040 Number of id 5,426 3,403 2,023 1,438 Sector_region FE YES YES YES YES Year FE YES YES YES YES
Robust standard errors in parentheses *** p<0.01, ** p<0.05, * p<0.1
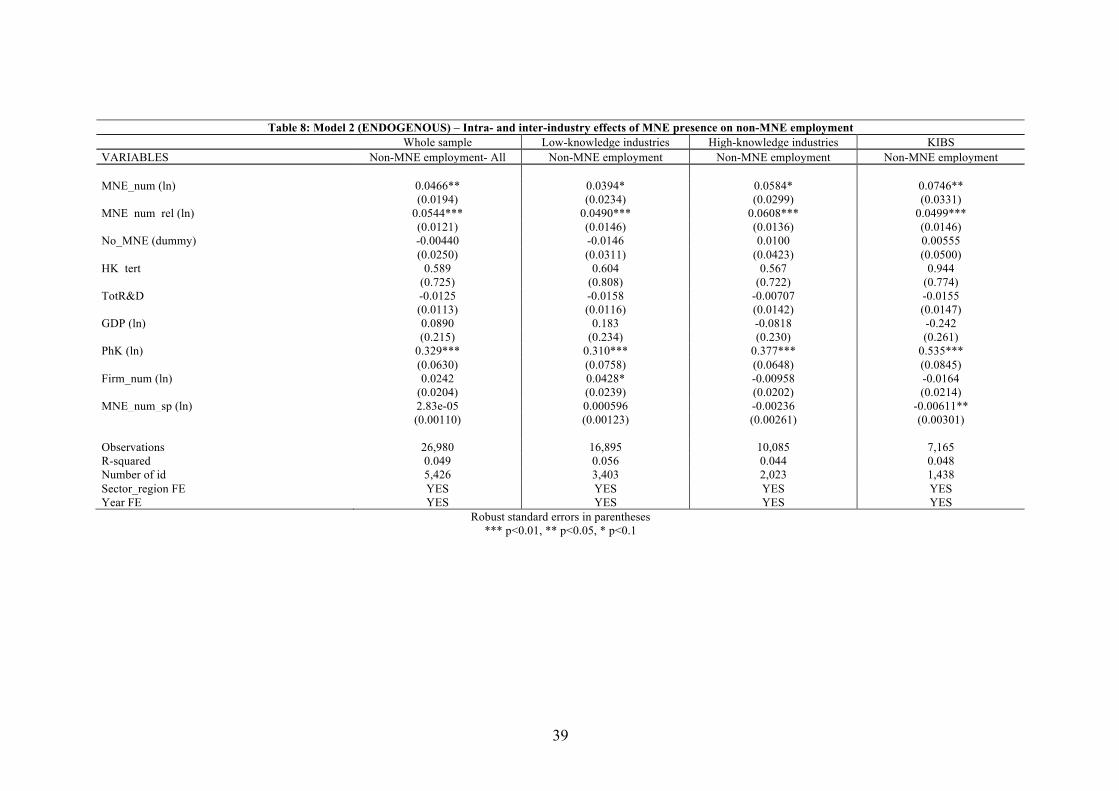
39
Table 8: Model 2 (ENDOGENOUS) – Intra- and inter-industry effects of MNE presence on non-MNE employment Whole sample Low-knowledge industries High-knowledge industries KIBS VARIABLES Non-MNE employment- All Non-MNE employment Non-MNE employment Non-MNE employment MNE_num (ln) 0.0466** 0.0394* 0.0584* 0.0746** (0.0194) (0.0234) (0.0299) (0.0331) MNE_num_rel (ln) 0.0544*** 0.0490*** 0.0608*** 0.0499*** (0.0121) (0.0146) (0.0136) (0.0146) No_MNE (dummy) -0.00440 -0.0146 0.0100 0.00555 (0.0250) (0.0311) (0.0423) (0.0500) HK_tert 0.589 0.604 0.567 0.944 (0.725) (0.808) (0.722) (0.774) TotR&D -0.0125 -0.0158 -0.00707 -0.0155 (0.0113) (0.0116) (0.0142) (0.0147) GDP (ln) 0.0890 0.183 -0.0818 -0.242 (0.215) (0.234) (0.230) (0.261) PhK (ln) 0.329*** 0.310*** 0.377*** 0.535*** (0.0630) (0.0758) (0.0648) (0.0845) Firm_num (ln) 0.0242 0.0428* -0.00958 -0.0164 (0.0204) (0.0239) (0.0202) (0.0214) MNE_num_sp (ln) 2.83e-05 0.000596 -0.00236 -0.00611** (0.00110) (0.00123) (0.00261) (0.00301) Observations 26,980 16,895 10,085 7,165 R-squared 0.049 0.056 0.044 0.048 Number of id 5,426 3,403 2,023 1,438 Sector_region FE YES YES YES YES Year FE YES YES YES YES
Robust standard errors in parentheses *** p<0.01, ** p<0.05, * p<0.1

40
Table 9: Model 1 (IV) - Intra-industry effects of MNE presence on non-MNE employment
Whole sample Low-knowledge industries High-knowledge industries KIBS VARIABLES Non-MNE employment- All Non-MNE employment Non-MNE employment Non-MNE employment MNE_num (ln) -0.764 -1.675 0.719*** 0.645*** (0.912) (2.316) (0.221) (0.219) No_MNE (dummy) -0.0385 -0.0815 -0.00557 -0.000459 (0.0531) (0.154) (0.0300) (0.0339) HK_tert 1.358 2.759 -0.0694 0.488 (1.816) (4.499) (0.864) (0.901) TotR&D 0.00216 0.0160 0.0138 0.0141 (0.0224) (0.0290) (0.0257) (0.0180) GDP (ln) -0.0118 -0.00249 -0.0515 -0.0233 (0.269) (0.485) (0.231) (0.274) PhK (ln) 0.189*** 0.191* 0.169*** 0.178*** (0.0506) (0.111) (0.0186) (0.0174) Firm_num (ln) 0.246** 0.207 0.256*** 0.345*** (0.107) (0.163) (0.0691) (0.108) MNE_emp_sp (ln) 0.0110 0.0206 -0.00228 0.00184 (0.00893) (0.0232) (0.00383) (0.00428) Observations 25,214 15,811 9,403 6,674 R-squared -0.222 -1.148 -0.015 0.042 Number of id 5,317 3,337 1,980 1,405 Sector_region FE YES YES YES YES Year FE YES YES YES YES
Under identification F 1.950 0.783 6.500** 6.827** F P-val 0.166 0.379 0.0126 0.0106
Robust standard errors in parentheses *** p<0.01, ** p<0.05, * p<0.1
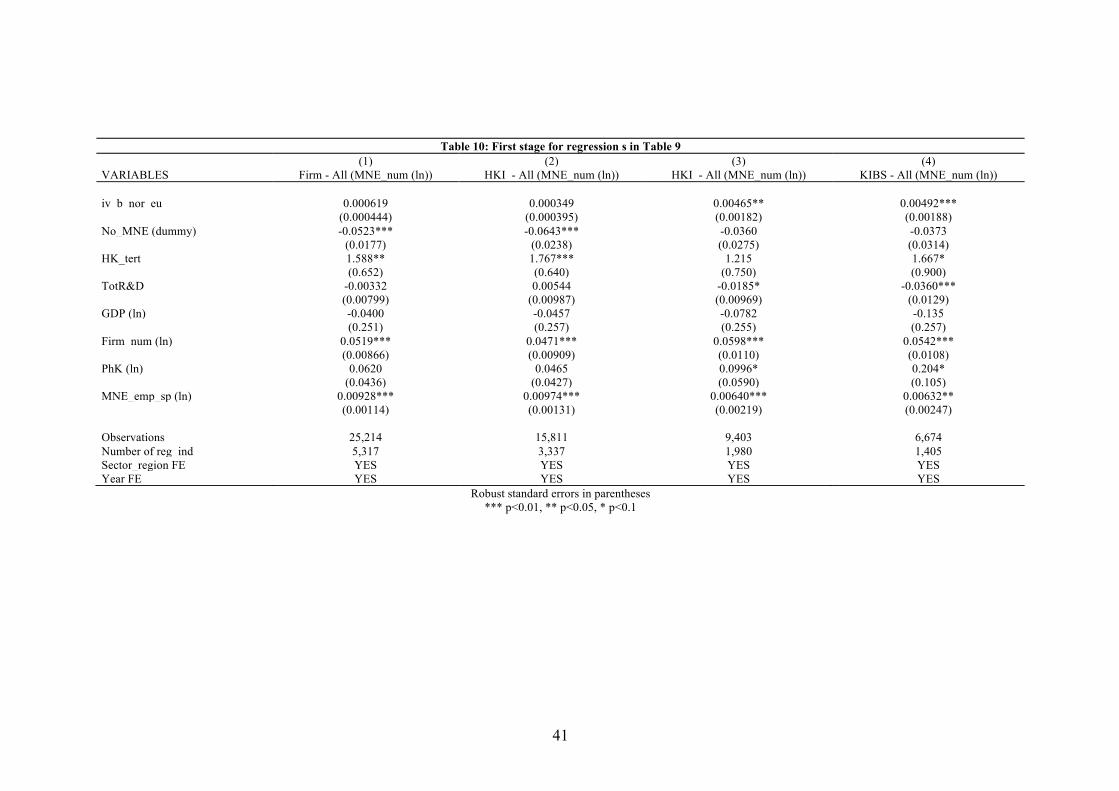
41
Table 10: First stage for regression s in Table 9
(1) (2) (3) (4) VARIABLES Firm - All (MNE_num (ln)) HKI - All (MNE_num (ln)) HKI - All (MNE_num (ln)) KIBS - All (MNE_num (ln)) iv_b_nor_eu 0.000619 0.000349 0.00465** 0.00492*** (0.000444) (0.000395) (0.00182) (0.00188) No_MNE (dummy) -0.0523*** -0.0643*** -0.0360 -0.0373 (0.0177) (0.0238) (0.0275) (0.0314) HK_tert 1.588** 1.767*** 1.215 1.667* (0.652) (0.640) (0.750) (0.900) TotR&D -0.00332 0.00544 -0.0185* -0.0360*** (0.00799) (0.00987) (0.00969) (0.0129) GDP (ln) -0.0400 -0.0457 -0.0782 -0.135 (0.251) (0.257) (0.255) (0.257) Firm_num (ln) 0.0519*** 0.0471*** 0.0598*** 0.0542*** (0.00866) (0.00909) (0.0110) (0.0108) PhK (ln) 0.0620 0.0465 0.0996* 0.204* (0.0436) (0.0427) (0.0590) (0.105) MNE_emp_sp (ln) 0.00928*** 0.00974*** 0.00640*** 0.00632** (0.00114) (0.00131) (0.00219) (0.00247) Observations 25,214 15,811 9,403 6,674 Number of reg_ind 5,317 3,337 1,980 1,405 Sector_region FE YES YES YES YES Year FE YES YES YES YES
Robust standard errors in parentheses *** p<0.01, ** p<0.05, * p<0.1

42
Appendix 1
Table 1.A – Appendix: List of sectors High-knowledge=Advanced
manufacturing +Knowledge-intensive services
Low Knowledge
20 5 37 21 6 38 26 7 39 27 8 41 28 9 42 29 10 43 30 11 45 50 12 46 51 13 47 58 14 49 59 15 52 60 16 53 61 17 55 62 18 56 63 19 68 69 22 77 70 23 79 71 24 81 72 25 82 73 31 95 74 32 75 33 78 35 80 36

43
Table 2.A – Appendix: List of regions by income groups Above EU Average in GDP per capita Below EU average in GDP per capita
AT12
DE72
HU10
PT17
AT11
ES11
FR81
ITI2
RO21
UKK3
AT13
DE73
IE02
RO32
BE22
ES12
FR83
ITI3
RO22
UKK4
AT21
DE91
ITC1
SE11
BE32
ES13
GR11
LT00
RO31
UKL1
AT22
DE92
ITC2
SE12
BE33
ES41
GR12
LV00
RO41
UKL2
AT31
DE94
ITC3
SE21
BE34
ES42
GR13
MT00
RO42
UKM2
AT32
DEA1
ITC4
SE22
BE35
ES43
GR14
NL12
SE31
UKM3
AT33
DEA2
ITH1
SE23
BG31
ES52
GR21
NL13
SI01
UKM6
AT34
DEA3
ITH2
SE32
BG32
ES53
GR22
NL23
SI02
UKN0
BE10
DEA4
ITH3
SE33
BG33
ES61
GR23
NL34
SK02
BE21
DEA5
ITH4
SK01
BG34
ES62
GR24
PL11
SK03
BE23
DEB1
ITH5
UKD6
BG41
FI19
GR25
PL21
SK04
BE24
DEB3
ITI1
UKH1
BG42
FI1C
GR30
PL22
UKC1
BE25
DEC0
ITI4
UKH2
CY00
FI1D
GR41
PL31
UKC2
BE31
DED5
LU00
UKI1
CZ02
FR21
GR42
PL32
UKD1
CZ01
DEF0
NL11
UKI2
CZ03
FR22
GR43
PL33
UKD3
DE11
DK01
NL21
UKJ1
CZ04
FR23
HU21
PL34
UKD4
DE12
DK03
NL22
UKJ2
CZ05
FR24
HU22
PL41
UKD7
DE13
DK04
NL31
UKJ3
CZ06
FR25
HU23
PL42
UKE1
DE14
DK05
NL32
UKK1
CZ07
FR26
HU31
PL43
UKE2
DE21
ES21
NL33
UKM5
CZ08
FR30
HU32
PL51
UKE3
DE22
ES22
NL41
DE40
FR41
HU33
PL52
UKE4
DE23
ES23
NL42
DE80
FR42
IE01
PL61
UKF1
DE24
ES24
NO01
DE93
FR43
ITF1
PL62
UKF2
DE25
ES30
NO02
DEB2
FR51
ITF2
PL63
UKF3
DE26
ES51
NO03
DED2
FR52
ITF3
PT11
UKG1
DE27
FI1B
NO04
DED4
FR53
ITF4
PT15
UKG2
DE30
FI20
NO05
DEE0
FR61
ITF5
PT16
UKG3
DE50
FR10
NO06
DEG0
FR62
ITF6
PT18
UKH3
DE60
FR71
NO07
DK02
FR63
ITG1
RO11
UKJ4
DE71
FR82
PL12
EE00
FR72
ITG2
RO12
UKK2
44
Appendix 2
The main sources used in this paper are Eurostat Structural Business Survey,
Cambridge Econometrics Regional Database and Bureau Van Dijk Orbis and Zephyr
databases. As for the former two sources, no significant elaboration was performed.
The only exception is the nearest neighbor interpolation order to fill gaps in the data,
mostly on SBS employment data and Eurostat R&D and human capital information.
Besides, whereas SBS provides data on employment from 2008, we decided to exclude
2008 as, out of the 15369 observations for that year, around 4500 are flagged as
potentially problematic.
The treatment of BVD data was instead more complex. Orbis database provides detail
information at firm-level on sector of operation, number of employees, registration date
and last available year. Zephyr instead gathers information on Merger and Acquisition
(M&A) deals, reporting the name and code of the firms involved, the stake of the deal,
the date, etc. Data on 18 million firms in the period 2006-2014 (from Orbis) and on
more than 17,000 M&A deals between 1997 and 2014 (from Zephyr) were downloaded,
cleaned and geo-coded 8 (Kalemli-Ozcan et al., 2015). Whereas Orbis provides
information on whether a given firm is foreign owned or not, and with what share of
ownership, only the most recent information is recorded with no historical records
about ownership. In other words, past information on ownership, such as whether a
given firm was already foreign-owned and when it was acquired, are not provided.
In order to overcome this obstacle, information on M&A from Zephyr was used to
established when a domestic firm acquired or was acquired by a foreign company. After
merging data from Zephyr and Orbis, we proceeded as follows:
1. Firms which are present in both Orbis and Zephyr are considered as MNE from
the year in which the first M&A in which they were involved took place. For
instance, Firm A is acquired by the MNE B in 2008: firm A becomes MNE from
2008 on.
2. Firms which are recorded as foreign in Orbis but missing in Zephyr are assumed
to be MNE throughout the whole period. In this way, our dataset is also able to
8 For our analysis we included only information on firms with unconsolidated accounts, in order to avoid introducing some bias (Kalemli-Ozcan et al. 2015; Oberhofer, 2013).

45
capture, at least to some extent, greenfield investments, previous M&A or deals
which were not reported in Zephyr.
We exclude each firm from the dataset for the years subsequent to the last available
year recorded in Orbis. For example, firm A, which was acquired by MNE B in 2008,
provided information to its local chamber of commerce only until 2011. As 2011 is its
last available year, firm A is considered as domestic firm in the years 2006 and 2007
(period preceding its acquisition), is counted as MNE between 2008 and 2011, and
excluded from the sample in 2012 and 2013. We also considered as MNE only those
firms which are owned at least at 10% by a foreign counterpart.
As a last step, firm level data from the dataset obtained after these operations have been
collapsed to the second digit of NACE code, in order to be compatible with the data
obtained from Eurostat SBS. As a robustness check, we compute the correlation
between the employment data constructed from Orbis and the one provided by SBS.
The overall correlation between the two dataset is a re-assuring, being above 75%.