Multimodal contrast agents for in vivo neuroanatomical analysis of monosynaptic connections
8
Multimodal contrast agents for in vivo neuroanatomical analysis of monosynaptic connections Giuseppe Gambino a , Jörn Engelmann b, *** , Lorenzo Tei a, ** , Mauro Botta a , Nikos K. Logothetis c, d , Ilgar Mamedov c, * a Dipartimento di Scienze e Innovazione Tecnologica, Università del Piemonte Orientale “Amedeo Avogadro”, Viale T. Michel 11,15121 Alessandria, Italy b High-Field Magnetic Resonance, Max Planck Institute for Biological Cybernetics, Spemannstr. 41, 72076 Tübingen, Germany c Department for Physiology of Cognitive Processes, Max Planck Institute for Biological Cybernetics, Spemannstr. 38, 72076 Tübingen, Germany d Imaging Science and Biomedical Engineering, University of Manchester, Manchester, UK article info Article history: Received 4 April 2013 Accepted 24 May 2013 Available online 19 June 2013 Keywords: MRI contrast agent Gadolinium Brain connectivity Tracers Dextran Neural network abstract We developed and examined the applicability of two multimodal paramagnetic contrast agents for the longitudinal in vivo investigations of the brain projections. The classical dextran based neuroanatomical tracer was conjugated with mono- and bimetal Gd 3þ complexes and an optical reporter. Relaxometric studies of both tracer molecules were performed in vitro followed by in cellulo MR and microscopy in- vestigations. Finally, tracers were injected into the motor cortex of the rat brain; uptake and transporting properties were compared by MRI. The advantage of the multimodal approach was taken and histological studies were performed on the same animals. The histology results confirm the MRI studies demon- strating that the applied tracers labelled anterogradely the regions known for their connections with the motor cortex of the rat brain. Ó 2013 Elsevier Ltd. All rights reserved. 1. Introduction The prevalence of age-associated neurodegenerative diseases is increasing rapidly. About 40 million people worldwide are affected by diseases like Alzheimer’s Disease (AD) or Parkinson’s Diseases (PD). Due to the ageing population, their incidence is expected to triple in the next forty years. This creates an urgent need for early diagnosis of the disease to enable treatment at an early stage. In spite of extensive research in the field, the cause and progression of such diseases is still not well understood. Neurodegenerative processes are closely related to the alter- ations of the brain network, for example reduced connectivity be- tween the hippocampus and other regions such as prefrontal cortex and cingulate cortex [1]. One possible approach to successful therapy refers to the brain’s remarkable ability to change and reorganize itself, termed brain plasticity. It was long thought that brain plasticity declined with age. However, recent studies demonstrated that this is not the case, even in the early stages of disease [2]. Consequently more extensive studies are needed to understand the mechanisms underlying these processes. The methodology to investigate brain connectivity and plasticity has made substantial progress in the last few years. Newly developed animal models for neurodegenerative diseases in combination with improved neuroimaging technologies now provide researchers with unique tools to study disease processes and to investigate preclinically the effects of potential treatments in order to acquire knowledge that will ultimately inform clinical practise [3,4]. In addition to the current post-mortem techniques scientists will be able to take advantages of different less- or non-invasive modal- ities. Nevertheless, none of the developed methods is so far able to deliver complete information on this issue. The most commonly used in vivo imaging techniques in animal models are positron emission tomography (PET) and magnetic resonance imaging (MRI), each of which has its own advantages and disadvantages. Whereas the former suffers from poor spatial resolution, the latter is more limited in the functional and neurochemical measurements it is currently capable of. [5,6]. Diffusion tensor imaging (DTI) is the most popular MRI technique widely used in the clinic and providing a sensitive method to detect white matter changes in subjects with AD. Unfortunately, it seems that the method is not * Corresponding author. Tel.: þ49 7071 601 916; fax: þ49 7071 601 919. ** Corresponding author. Tel.: þ39 0131360 208; fax: þ39 0131 360 250. *** Corresponding author. Tel.: þ49 7071 601 704; fax: þ49 7071 601 702. E-mail addresses: [email protected] (J. Engelmann), [email protected] (L. Tei), [email protected] (I. Mamedov). Contents lists available at SciVerse ScienceDirect Biomaterials journal homepage: www.elsevier.com/locate/biomaterials 0142-9612/$ e see front matter Ó 2013 Elsevier Ltd. All rights reserved. http://dx.doi.org/10.1016/j.biomaterials.2013.05.064 Biomaterials 34 (2013) 7135e7142
Transcript of Multimodal contrast agents for in vivo neuroanatomical analysis of monosynaptic connections

at SciVerse ScienceDirect
Biomaterials 34 (2013) 7135e7142
Contents lists available
Biomaterials
journal homepage: www.elsevier .com/locate/biomater ia ls
Multimodal contrast agents for in vivo neuroanatomical analysis ofmonosynaptic connections
Giuseppe Gambino a, Jörn Engelmann b,***, Lorenzo Tei a,**, Mauro Botta a,Nikos K. Logothetis c,d, Ilgar Mamedov c,*
aDipartimento di Scienze e Innovazione Tecnologica, Università del Piemonte Orientale “Amedeo Avogadro”, Viale T. Michel 11, 15121 Alessandria, ItalybHigh-Field Magnetic Resonance, Max Planck Institute for Biological Cybernetics, Spemannstr. 41, 72076 Tübingen, GermanycDepartment for Physiology of Cognitive Processes, Max Planck Institute for Biological Cybernetics, Spemannstr. 38, 72076 Tübingen, Germanyd Imaging Science and Biomedical Engineering, University of Manchester, Manchester, UK
a r t i c l e i n f o
Article history:Received 4 April 2013Accepted 24 May 2013Available online 19 June 2013
Keywords:MRI contrast agentGadoliniumBrain connectivityTracersDextranNeural network
* Corresponding author. Tel.: þ49 7071 601 916; fa** Corresponding author. Tel.: þ39 0131360 208; fax*** Corresponding author. Tel.: þ49 7071 601 704; f
E-mail addresses: [email protected]@mfn.unipmn.it (L. Tei), ilgar.mamedov@tue
0142-9612/$ e see front matter � 2013 Elsevier Ltd.http://dx.doi.org/10.1016/j.biomaterials.2013.05.064
a b s t r a c t
We developed and examined the applicability of two multimodal paramagnetic contrast agents for thelongitudinal in vivo investigations of the brain projections. The classical dextran based neuroanatomicaltracer was conjugated with mono- and bimetal Gd3þ complexes and an optical reporter. Relaxometricstudies of both tracer molecules were performed in vitro followed by in cellulo MR and microscopy in-vestigations. Finally, tracers were injected into the motor cortex of the rat brain; uptake and transportingproperties were compared by MRI. The advantage of the multimodal approach was taken and histologicalstudies were performed on the same animals. The histology results confirm the MRI studies demon-strating that the applied tracers labelled anterogradely the regions known for their connections with themotor cortex of the rat brain.
� 2013 Elsevier Ltd. All rights reserved.
1. Introduction
The prevalence of age-associated neurodegenerative diseases isincreasing rapidly. About 40 million people worldwide are affectedby diseases like Alzheimer’s Disease (AD) or Parkinson’s Diseases(PD). Due to the ageing population, their incidence is expected totriple in the next forty years. This creates an urgent need for earlydiagnosis of the disease to enable treatment at an early stage. Inspite of extensive research in the field, the cause and progression ofsuch diseases is still not well understood.
Neurodegenerative processes are closely related to the alter-ations of the brain network, for example reduced connectivity be-tween the hippocampus and other regions such as prefrontal cortexand cingulate cortex [1]. One possible approach to successfultherapy refers to the brain’s remarkable ability to change andreorganize itself, termed brain plasticity. It was long thought thatbrain plasticity declined with age. However, recent studies
x: þ49 7071 601 919.: þ39 0131 360 250.ax: þ49 7071 601 702..mpg.de (J. Engelmann),bingen.mpg.de (I. Mamedov).
All rights reserved.
demonstrated that this is not the case, even in the early stages ofdisease [2]. Consequently more extensive studies are needed tounderstand the mechanisms underlying these processes. Themethodology to investigate brain connectivity and plasticity hasmade substantial progress in the last few years. Newly developedanimal models for neurodegenerative diseases in combinationwithimproved neuroimaging technologies now provide researcherswith unique tools to study disease processes and to investigatepreclinically the effects of potential treatments in order to acquireknowledge that will ultimately inform clinical practise [3,4]. Inaddition to the current post-mortem techniques scientists will beable to take advantages of different less- or non-invasive modal-ities. Nevertheless, none of the developed methods is so far able todeliver complete information on this issue. The most commonlyused in vivo imaging techniques in animal models are positronemission tomography (PET) and magnetic resonance imaging(MRI), each of which has its own advantages and disadvantages.Whereas the former suffers from poor spatial resolution, the latteris more limited in the functional and neurochemical measurementsit is currently capable of. [5,6]. Diffusion tensor imaging (DTI) is themost popular MRI technique widely used in the clinic andproviding a sensitive method to detect white matter changes insubjects with AD. Unfortunately, it seems that the method is not

G. Gambino et al. / Biomaterials 34 (2013) 7135e71427136
reliable for the investigation of the grey matter for example theneuronal connections present in the brain cortex [7].
An ideal strategy would be to develop methods that combinespatiotemporally-resolved MR imaging with other invasiveneuroscientific modalities. Manganese-enhanced MRI (MEMRI)represents one of the approaches undertaken towards in vivostudying of neuronal connectivity by means of MR imaging [8].However, difficulties in understanding manganese transport pro-cesses, due to their multi-synaptic nature, as well as the potentialtoxicity of the Mn2þ in the tissue, restricts its applicability [9,10].
Another promising approach which could be developed is onewhere paramagnetic tracers share transport properties withtraditional monosynaptic histological markers. Recent attempts toconjugate paramagnetic Gd3þ complexes with classical neuroana-tomical tracers such as biocytin, cholera toxin subunit B (CTB) ordextran amine have demonstrated the potential of such systems toact as contrast agents, thus offering an excellent alternative toMEMRI [11e13].
Here, we aim to develop a multi-track methodology for longi-tudinal investigations of the monosynaptic connections betweenspecific brain areas, using MR and optical imaging techniques incombination with the other neuroscientific modalities.
Dextran amine is extensively used in neuroanatomical researchas a core molecule conjugated to MR and optical reporters. Inaddition to its outstanding labelling properties, in our studies weconsidered dextran because of two other important properties [14].First, unlike CTB and other retrograde tracers, dextran is trans-ported predominantly anterogradely (labelling begins at the den-drites and cell bodies and the dye is transported out to the axonsand their terminals). Very often this type of transport is preferable
Chart 1. Schematic illustra
in neuroanatomical research because it enables the projectiontargets of individual or groups of cells to be charted within thecentral nervous system. Second, in contrast to biocytin and manyother “fast” tracers where the labelling occurs in 24 h, dextranbelongs to the group of “slow” transported agents. Such types ofneuronal tracing could be preferable for different kinds of longi-tudinal studies in vivo.
Tetramethylrhodamine was used in the present study as anoptical reporter for the evaluation of the cellular uptake via fluo-rescence microscopy and additional histological control of cellulartransport. Two MR-molecular imaging probes based on mono- andbimetallic Gd3þ complexes of AAZTA-like ligands (AAZTA ¼ 6-amino-6-methylperhydro-1,4-diazepinetetraacetic acid) attachedto a dextranerhodamine conjugate were synthesised (Chart 1).GdAAZTA-like complexes possess outstanding paramagneticproperties in comparison with the commonly used GdDTPA- andGdDOTA-like chelates and additionally have thermodynamic sta-bility sufficient for in vivo applications [15,16]. In this work, we aimto investigate the dependence of MR signal enhancement andtransporting properties of synthesised molecules on the structureof the applied paramagnetic complexes through a 1H NMRrelaxometric study on both MR reporters at different magnetic fieldstrengths and through in cellulo and in vivo MRI and fluorescencemicroscopy experiments.
2. Materials and methods
2.1. Materials
All chemicals were purchased from commercial sources and were used withoutfurther purification. All solvents were dried and stored under nitrogen. A solution of
tion of the molecules.

G. Gambino et al. / Biomaterials 34 (2013) 7135e7142 7137
Gadolinium(III) ions of knownconcentrationwaspreparedbydissolving anaccuratelyweighed quantity of the chloride salt into an appropriate volume of doubly distilledwater, standardised by a complexometric titration with the disodium salt of EDTA.
Diafiltration was carried out on a Pall Minimate� Tangential Flow FiltrationSystem using a Pall Minimate TFF Capsule with an Omega 3K PES ultrafiltrationmembrane.
2.2. Synthesis
Syntheses of the Gd3þ bifunctional chelates used for the preparation of theprobes were performed according to reported procedures [13,16]. Conjugation of thefluorescent dye to dextranwas carried out by the reaction of dextran aminewith 2eqof tetramethylrhodamine isothiocyanate in water/DMF solution at pH 8.5 resultingin Dextran tetramethylrhodamine (Dextran-TMR). An excess of the fluorophore wasused to avoid or reduce the amount of the unreacted dextran which is difficult toseparate from the reaction mixture. The conjugate was purified using a Minimateultrafiltration device (Pall Life Science�) to remove excess of TMR.
Dextran-TMR-GdL1 probe was synthesized by reaction of Dextran-TMR withthe GdAAZTA chelate bearing pentanoic acidmoiety in 6-position and using 1-Ethyl-3-(3-dimethyllaminopropyl) carbodiimide hydrochloride and 1-Hydroxybenzo-triazole (EDC/HOBt) as coupling reagents in the presence of N-Methylmorpholine(NMM) as the base. The final probe was purified using a Minimate ultrafiltrationdevice (Pall Life Science�) to ensure removal of the non-conjugated complexes. Inthe case of Dextran-TMR-Gd2L2, isothiocyanate containing dimer [16] was conju-gated toDextran-TMR in DMF/carbonate buffer at pH 9. In particular, to a solution ofDextran-TMR (30 mg, 0.003 mmol) in DMF (5 mL) and K2CO3 1 M (5 mL), DIPEA(5,2 mL, 0.03 mmol) and HCl 1 M were added to bring the pH to 9. Then, solid Gd2L2
(38,5 mg, 0.03 mmol) was added to the reaction mixture which was stirred at roomtemperature for 36 h. The solution was then purified by ultracentrifugation usingVivaspin� (cut-off 5000 Da) and dried by lyophilisation obtaining pure Dextran-TMR-Gd2L2 as a purple solid (47 mg). The Gd3þ concentration in the probes wascalculated using the bulk magnetic susceptibility (BMS) shift method [17,18] andconfirmed by ICP-MS. Dextran:Gd3þ ratio was estimated to be w1:3 for Dextran-TMR-GdL1 and 1:3.4 for Dextran-TMR-Gd2L2 (on average 1.7 eq of complex per 1 eqdextran).
2.3. Relaxometric measurements
Thewater proton longitudinal relaxation rates as a function of themagnetic fieldstrength were measured in non-deuterated aqueous solutions on a fast field-cyclingStelar SmarTracer relaxometer (Stelar s.r.l., Mede, Pv, Italy) over a continuum ofmagnetic field strengths from 0.00024 to 0.25 T (corresponding to 0.01e10 MHzproton Larmor frequencies). The relaxometer operates under computer control withan absolute uncertainty in 1/T1 of �1%. Additional longitudinal and transverserelaxation data in the range 15e70 MHz were obtained on a Bruker WP80 NMRelectromagnet adapted to variable-field measurements (15e80 MHz proton Larmorfrequency) Stelar Relaxometer. The exact concentration of Gd3þ was determined bymeasurement of bulk magnetic susceptibility shifts of a tBuOH signal. The 1H T1relaxation times were acquired by the standard inversion recovery method withtypical 90� pulse width of 3.5 ms, 16 experiments of 4 scans. The reproducibility ofthe T1 datawas�5%. 1H T2 relaxation times were acquired by the CPMGmethodwithtypical 90� pulse width of 3.5 ms, 64 experiments and typical echo time of 100e500 ms. The temperature was controlled with a Stelar VTC-91 airflow heaterequipped with a calibrated coppereconstantan thermocouple (uncertainty of�0.1 �C).
2.4. Cell culture and fluorescence microscopy
N18 mouse neuroblastoma cells (kind gift of Prof. Bernd Hamprecht, Universityof Tübingen, Germany) were cultured as a monolayer at 37 �C with 5% CO2 inantibiotic free Dulbecco’s Modified Eagle’s Medium (DMEM) supplemented with10% foetal bovine serum (FBS) and 4 mM L-glutamine, (all purchased from BiochromAG, Germany). Cells were passaged by trypsinization with trypsin/EDTA 0.05/0.02%(w/v) in phosphate-buffered saline (PBS; Biochrom AG, Germany) for 5 min everysecond to third day.
To achieve more neuronal metabolic and morphologic features in the neuro-blastoma cells, serum deprivation was used to differentiate the cells prior to thesubsequent experiments. In the course of the slow stepwise reduction of FBS contentin the culture medium to 1.25% the growth rate slowed down and cells started toshow a neuronal morphology with a network of neurite-like cellular processeswhich were completely absent at 10% FBS.
For high resolution microscopy differentiated N18 neuroblastoma cells weregrown in single channel Ibidi slides (Ibidi GmbH, Germany) by inoculation of 3�105
cells/mL. After reaching 70e80% confluency, cells were incubated with 50 mM ofDextran-TMR-GdL1 or 20 mM of Dextran-TMR-Gd2L2 in complete culture mediumfor 18 h under routine culture conditions. Subsequently, cell nuclei were counter-stainedwith the DNA dyeHoechst H33342. After repeated cell washings with Hank’sbuffered saline solution (HBSS, Biochrom AG, Germany), fluorescence microscopywas performed on a Zeiss Axiovert 200M (Carl Zeiss AG, Germany) with a Plan-
Apochromat 63�/1.4 oil objective. The imaging conditions were kept constant forthe observation of different samples. Cellular localization and distribution of tracerswas determined by irradiating at 545 nm and observing at 610 nm, and nuclearlabelling by Hoechst was imaged at 460 nm. Additionally, cell morphology wasobserved by capturing phase contrast images with differential interference contrast(DIC) microscopy of the same areas used for fluorescence detection. The structuredlight illumination device OptiGrid (Improvision/PerkineElmer, UK) was used toacquire fluorescence images of confocal quality. Image acquisition and processingwere done with the Volocity Acquisition and Visualization software (Improvision/PerkineElmer, UK).
2.5. MR measurement in cells
For MR imaging, serum deprived N18 cells (1.25% FBS) were cultured in 175 cm2
tissue culture flasks and labelled with 20 mM (Gd concentration) of Dextran-TMR-GdL1 and Dextran-TMR-Gd2L2 in culture medium for 18 h. The cells were repeatedlywashed with HBSS, trypsinized, centrifuged and re-suspended in 0.5 mL Eppendorftubes at a cell density of 1 �107/500 mL in complete medium. Cells were allowed tosettle beforeMRmeasurements. Tubes withmedium only and cells without CAwereused as controls. MR imaging of the cell pellets at room temperature (w21 �C) wasperformed in a 3 T (123 MHz) human MR scanner (MAGNETOM Tim Trio, SiemensHealthcare, Germany), using a 12-channel RF head coil and slice selective mea-surements from a slice with a thickness of 1 mm positioned through the cell pellet.T1 was measured using an inversion-recovery sequence, with an adiabatic inversionpulse followed by a turbo-spin-echo readout. 14 images were taken, with the timebetween inversion and readout varying from 23 ms to 3000 ms. With a repetitiontime of 10 s, 15 echoes were acquired per scan and averaged six times. Diffusionsensitivity was reduced by minimizing the crusher gradients surrounding therefocusing pulse. All experiments scanned 2562 voxels in a field-of-view of 110 mmin both directions resulting in a voxel volume of 0.43 � 0.43 � 1 mm3. Data analysiswas performed by fitting to relaxation curves with self-written routines underMATLAB 7.1 R14 (The Mathworks Inc., United States). The series of T1 relaxation datawere fitted to the following equations:
T1 series with varying t ¼ TI : S ¼ S0ð1� expð�t=T1ÞÞ þ SðTI¼0Þexpð�t=T1Þ:
Nonlinear least-squares fitting of three parameters S0, S(TI ¼ 0), and T1 was donefor manually selected regions-of-interest with the Trust-Region Reflective Newtonalgorithm implemented in MATLAB. The quality of the fit was controlled by visualinspection and by calculating the mean errors and residuals.
Evaluation of the signal intensities in the T1-weighted MR images were per-formed in ImageJ (http://rsb.info.nih.gov/ij) by defining an ellipsoid region of in-terest (ROI) inside one tube image and measuring the mean signal intensity andstandard deviation of the included voxels. Further statistical analyses were per-formed in GraphPad Prism 5.03 (GraphPad Software, Inc., USA).
2.6. Surgery and anaesthesia
Male SpragueeDawley and Long-Evans rats (200e250 g) were used for in vivostudies. All experiments were approved by the local authorities (Regierung-spraesidium) and were in full compliance with the guidelines of the EuropeanCommunity (EUVD 86/609/EEC) for the care and use of the laboratory animals. Theanimals were anaesthetised with 2.0% isoflurane (Forene, Abbott, Wiesbaden, Ger-many) and placed in a stereotaxic frame (Kopf Instruments). The tracer was stereo-taxically injectedusing a 0.5 mLHamilton syringe at a rate of 0.5 nL/min under generalanaesthesia, using aseptic techniques. The needlewas left in the brain for 15minpostinjection and then retracted stepwise to avoid leakage of the contrast agent along theneedle track. During the scan, the isoflurane anaesthesia was reduced to 1.5e1.7%.Rats were immobilized on a nonmagnetic stereotaxic head holder. The rat body wasplaced on a heating pad tomaintain a body temperature of 37 �C. Each ratwas imagedup to four times: 1, 96, 144, 216 and 336 h after tracer injection. Body temperature,heart rate, CO2 and SpO2 was monitored throughout the scanning session.
2.7. MRI experiment
The MRI (Magnetic Resonance Imaging) was done on a 7 T (300 MHz) magnetwith a 30-cm horizontal bore (Bruker BioSpec 70/30, Ettlingen, Germany) equippedwith the 12 cm inner diameter gradient insert (Bruker BGA-12S Ettlingen, Germany).The MR systemwas controlled by a Bruker BioSpec console (ParaVision 5.1) runningunder the Linux operating system. The RF-Coil was a circular polarized rat headvolume coil (Bruker, Ettlingen, Germany) with an inner diameter of 40 cm. The coilwas placed at a fixed position on the animal bed with the rat fixed stereotaxically.This ensured the same positioning of rat and coil within the magnet bore betweenseparate measurements. We used a modified driven equilibrium Fourier transform(MDEFT) method with MDEFT preparation to obtain T1-weighted anatomical im-ages. The scan parameters were: TR ¼ 22 ms, TE¼ 3 ms, FA ¼ 20� , ID¼ 1000 ms andfour segments. The geometric parameters of the 3D scans were: matrix240 � 170 � 126 and FOV 48 � 34 � 25.2 mm resulting in a voxel size of0.2 � 0.2 � 0.2 mm. For each measurement 8 MDEFT images were acquired.

Fig. 1. 1/T1 NMRD profiles of aqueous solutions (pH ¼ 7.4) of Dextran-TMR-GdL1
(upper) and of Dextran-TMR-Gd2L2 (lower) at 298 K (triangles) and 310 K (circles).
Table 1r1, r2 and r2/r1 (mM
�1 s�1) data measured in PBS buffer at 298 K.
Dextran-TMR-GdL1 Dextran-TMR-Gd2L2
Field r1 r2 r2/r1 r1 r2 r2/r17 T 10.8 25.0 2.3 12.9 52.7 4.1
G. Gambino et al. / Biomaterials 34 (2013) 7135e71427138
2.8. Histology and microscopy
After the last MRI experiment, each rat was euthanized with a lethal dose ofsodium pentobarbital (250 mg/kg i.p.; Narcoren�, Merial GmbH, Germany) andperfused transcardially with 0.9% saline followed by 4% paraformaldehyde in 0.1 M
phosphate buffer (PB, pH 7.4). The brain was removed and stored in the samefixative. Before sectioning, the whole brain was placed in 0.1 M PB containing 30%sucrose until it sank. Serial 60 mm-thick coronal sections were then cut on a hori-zontal freezingmicrotome (MicromHM 440E, Walldorf, Germany), collected in 0.1 M
PB and then directly stained or stored at �20 �C in a cryoprotectant solution (30%ethylene glycol and 10% sucrose in 0.05 M PB) until further processing. The serialsections were used for examination of the fluorescent dextran transport. For thissections were mounted onto gelatin-coated glass slides, dried and coverslipped withpolyvinylalcohol (Mowiol 4e88; Hoechst, Frankfurt, Germany) containing 5%DABCO (1,4- diazobicyclooctane; Merck, Darmstadt, Germany).
All sections were examined using an AxioPhot or AxioImager microscope (CarlZeiss, Goettingen, Germany) equipped with 2.5�, 5�, 10�, 20� and 40� planapo-chromatic objectives. Fluorescent sections were examined under epifluorescentillumination using custom-made sets of filters for DAPI and Alexa Fluor� 488, 546and 594 (AHF, Tübingen, Germany).
Representative photomicrographs of the injection sites and anterograde label-ling were made with a color AxioCam HRc camera (4164 � 3120 pixels; Carl Zeiss,Goettingen, Germany) attached to a PC workstation and printed from Adobe Pho-toshop (Adobe System Inc., San Jose, USA) after contrast enhancement and sharp-ening. LC injection sites were located cytoarchitectonically and documented withphotomicrographs of individual sections for each case. Drawing of all injection siteswere then collated onto a standard map of LC by comparing the relative location ofthe injection site with respect to the anteroposterior extent of LC and to surroundinganatomical landmarks. The anterograde labelling of axon terminals was analysedthroughout the entire brain by systemic scanning with 10�, 20� and 40� objectivesunder appropriate illumination. The anterogradely labelled terminals were plottedfrom each section in each rat with a Minnesota Datametrics MD-3 system (Accu-Stage, Shoreview, USA). The individual plots were assembled into a composite mapof labelling using Adobe Illustrator (Adobe System Inc., San Jose, USA).
3. Results and discussion
3.1. Relaxometric studies
The dual MR-Optical Imaging probes Dextran-TMR-GdL1 andDextran-TMR-Gd2L2 reported in Chart 1 were synthesised asdetailed in Materials and Methods section. They consisted of tet-ramethylrhodamine (TMR) and different GdAAZTA-like MRI probesconjugated to Dextran; in particular, monomeric GdAAZTA system(GdL1) in case of Dextran-TMR-GdL1 and dimeric (Gd2L2) in case ofDextran-TMR-Gd2L2. The two probes resulted also in differentdextran:Gd3þ ratio that was estimated to be w1:3 for Dextran-TMR-GdL1 and 1:3.4 for Dextran-TMR-Gd2L2 (on average 1.7 eq ofdimeric complex per 1 eq dextran).
The efficacy of the paramagnetic systems as MRI reporters wasassessed by evaluating the magnetic field dependency of therelaxivity (r1p, the longitudinal relaxation enhancement of thewater protons induced by a 1 mM concentration of the para-magnetic metal ions) in water at pH 7.4. The so-called NuclearMagnetic Resonance Dispersion (NMRD) profiles (Fig. 1) weremeasured at 298 and 310 K for both Gd-conjugated systems over awide range of values, from 0.00024 to 11.7 T (corresponding to0.01e500 MHz proton Larmor frequencies) (Fig. 1). The shape andamplitude of the profiles are characteristic of slowly tumbling Gd-based systems: a low fields region where r1p assumes a nearlyconstant value (w0.01e0.8 MHz), a dispersion around 1e3 MHzand a high field broad peak associated with the occurrence of arestricted molecular tumbling [19]. The maxima are centred atabout 40 MHz (1 T) for both systems and correspond to 298r1pvalues of 36.1 mM
�1 s�1 for Dextran-TMR-Gd2L2 and 24.6 mM�1 s�1
for Dextran-TMR-GdL1. The greater high field relaxivity enhance-ment and sharper peak for Dextran-TMR-Gd2L2 is indicative of aslower rotational dynamics. Longitudinal and transverse relaxationrates (R1 and R2) for both MRI probes were also measured at 7 Tin PBS buffer (298 K; pH ¼ 7.4) and the corresponding values arereported in Table 1.
The experimental NMRD profiles were fitted to the standardequations for the inner- (IS) and outer sphere (OS) paramagneticrelaxation contributions [20]. Moreover, based on previous resultsobtained in various other macromolecular systems, we can expectthe presence of two types ofmotion: a relatively fast local rotation ofthe Gd-chelate about the linker connecting the coordination cage tothe dextran (characterized by a correlation time sRL) superimposedto the globalmotion of the system (sRG). For this purpose, a relativelysimple but effective approach is based on the use of the model-freeLiparieSzabo description of the rotational dynamics within theSolomoneBloembergeneMorgan equations for the inner-sphererelaxation mechanism [21,22]. Fitting was carried out by assumingthe presence of two coordinated water molecules (q ¼ 2), at a dis-tance of 3.1 Å from the metal ion (rGdH) and fixing the values for thedistance of closest approach to the paramagnetic centre of the outersphere solvent molecules (a ¼ 4.0 Å) and for their diffusion coeffi-cient (298D ¼ 2.24 cm2 s�1). For the residence lifetime sM, the valueobtained for the related [Gd(AAZTA)(H2O)2]� and [Gd(AAZTA-OH)(H2O)2]� was used (298sM ¼ 80 ns) [23,24]. Nevertheless, thedecrease of r1p with temperature (see ESI, Figure S1) is a clearindication that relaxivity is not limited by water exchange. In fact,the results of the fitting are onlymarginally affected by changing sMbetween 50 and 100 ns. The parameters of the electronic relaxationtimes T1,2e (D2, sV), sRg and sRl and the order parameter S2 describingtheir degree of correlation (0< S2< 1) were optimized in the fitting

Table 2Selected best-fit relaxation parameters obtained from the analysis of the 1/T1 NMRDprofiles for Dextran-TMR-GdL1 and for Dextran-TMR-Gd2L2.a
Dextran-TMR-GdL1 Dextran-TMR-Gd2L2
D2 (1019 s�2) 1.2 � 0.1 1.0 � 0.1298sV (ps) 47 � 3 44 � 2298sRg (ns) 1.7 � 0.2 1.7 � 0.1298sRl (ns) 0.32 � 0.06 0.44 � 0.03S2 0.10 � 0.01 0.22 � 0.02298sM (ns)b 80 80
G. Gambino et al. / Biomaterials 34 (2013) 7135e7142 7139
procedure. The best-fit parameters for both systems are reported inTable 2 and clearly indicate that the differences in the rotationaldynamics of the two macromolecular systems are fully responsiblefor their different relaxivity profiles. Both systems are highlyflexibleand their relaxivity is mostly limited by a fairly high degree of localrotation. However, the dimeric complex in Dextran-TMR-Gd2L2
appears endowed with a more restricted local mobility which re-sults in significantly higher values of sRl and of the order parameterS2. Thus, the optimization of the motional coupling between themetal chelate and the substrate represents the key factor forattaining high relaxivity enhancements.
3.2. Cell studies
Efficient cell internalization, effective labelling and transportingproperties are essential for the tracer molecule to mark theneuronal tract. According to published data and the long experi-ence of the neuroanatomists, dextran based markers are among thebest tracers because of their detailed labelling properties [25].However, there is strong dependence of cellular uptake andtransporting properties on the nature of the applied fluorophore[26]. Most obviously the structure of the MR reporter should also
Fig. 2. Microscopy images of differentiated N18 neuroblastoma cells after 18 h incubation wi([Gd3þ]) of Dextran-TMR-Gd2L2. Phase contrast (left) and corresponding fluorescence imag
influence the tracing ability of the final molecule. Therefore, in ourcell studies we examined how the MR reporter modificationswould affect the labelling characteristics of the final moleculescontaining the same type of fluorophore.
To investigate the cellular uptake of Dextran-TMR-Gd2L2 incomparison with Dextran-TMR-GdL1, differentiated mouse N18neuroblastoma cells were incubated with solutions of tracers underphysiological conditions in serum-containing medium for 18 h. Theresults obtained by fluorescence microscopy clearly demonstratedthat the nature of theMR reporter does indeed influence the uptakeproperties of the tracer (Fig. 2).
Although both tracer molecules were taken up by the cells, theywere located in different compartments. In fact, while Dextran-TMR-GdL1 was mainly concentrated in cell bodies (Fig. 2a)Dextran-TMR-Gd2L2 was mainly observed in vesicles surroundingthe nucleus and along the cell membrane (Fig. 2b).
We assume that one of the reasons for such different behaviourcould be the changes in lipophilicity due to the additional aromaticring in the case of Dextran-TMR-Gd2L2 which can influence themechanism of uptake and accumulation.
The spin-lattice relaxation times (T1) of N18 cells incubated with20 mM solutions of each paramagnetic tracer were measured at a 3Thorizontal scanner. The control cells were treated in the same way,but without the tracers. Cells were placed into Eppendorf tubes andT1 weighted images were acquired. Significant positive contrastenhancement was observed for the Dextran-TMR-Gd2L2 loadedcells in comparison to the control experiment (Fig. 3).
For Dextran-TMR-GdL1 the signal intensity was not muchdiffering from the control. To explain the obtained results, the GdIII
content of the cells from the MR experiments was determinedin mineralised cell lysates by ICP-MS. Only a small amount couldbe found for Dextran-TMR-GdL1 (w0.07 nmol/106 cells). This issignificantly above the detection limit of ICP-MS for such cell ly-sates (w0.01 nmol/106 cells) but obviously not sufficient to
th the tracer solutions in cell medium. a) 50 mM ([Gd3þ]) of Dextran-TMR-GdL1, b) 20 mMes (right) are shown. Bars represent 20 mm.

Fig. 3. T1-weighted MR images of the differentiated N18 cells labelled with 20 mM[Gd3þ] of Dextran-TMR-GdL1 and Dextran-TMR-Gd2L2 (down) and analysis of thecorresponding signal intensities (up). (Values represent mean � SD, n ¼ 76 voxels.***p < 0.001 statistically different compared to control, ***p < 0.001 statistical dif-ference between both probes; ANOVA, Tukey’s post test.)
G. Gambino et al. / Biomaterials 34 (2013) 7135e71427140
enhance contrast in the corresponding MR images. However, ourprevious experiments demonstrated considerable enhancement ofthe MR signal after incubation of the cells with 50 mM of Dextran-TMR-GdL1 [13]. In contrast, about 20-fold more Gd3þ was seen for20 mM Dextran-TMR-Gd2L2 (1.41 nmol/106 cells) in the presentstudy. Thus, Dextran-TMR-Gd2L2 not only provides better signalenhancement due to its increased longitudinal relaxivity but also isinternalised much better than Dextran-TMR-GdL1 into the cells.The exact reason for this behaviour remains unclear but the altered
Fig. 4. Injection of Dextran-TMR-GdL1 into the primary motor cortex of the rat brain and timtest, uncorrected). M1* e contralateral M1.
lipophilicity of the molecule might be involved as mentionedabove. The in cellulo MR results indicate that the bis-macrocyclicderivative was able to deliver a stronger signal and thus might bebetter suited for in vivo experiments than the mono-macrocyclictracer.
3.3. In vivo investigations and histology
To evaluate both tracers in vivo we tested them in the well-defined circuitry of the rat brain injecting them into the primarymotor cortex (M1). We expected to observe MR signal enhance-ment in well-known thalamic targets of M1: the ventral postero-lateral and posteriomedial thalamic nucleus (VPL and VPM),ventramedial and ventrolateral thalamic nucleus (VM and VL),reticular thalamic nucleus (Rt), ipsilateral somatosensory cortex(S1) and also in contralateral areas of M1 [27,28].
Three albino rats (SpragueeDawley) were used for each tracer.Baseline reference scans were acquired one day prior to injection.After injection, the animals were scanned at different time points(1 h, 4d, 6d, 10d and 14d post injection) to evaluate neuronaltransport.
Fig. 4 represents a typical illustration of the voxels with statis-tical significant increase in the MR signal superimposed on theanatomical images. The full MR data sets with all imaged slices areshown in Fig. S2 in the supporting information.
The labelling dynamics are clearly depicted. Six days post in-jection only the area of the ipsilateral somatosensory cortex (S1)was labelled, but almost no signal increase was detected in thecontralateral area at a long distance from the injection site (Fig. 4A).However, an obvious path towards the contralateral M1 wasmonitored 10 days post injection (Fig. 4B).
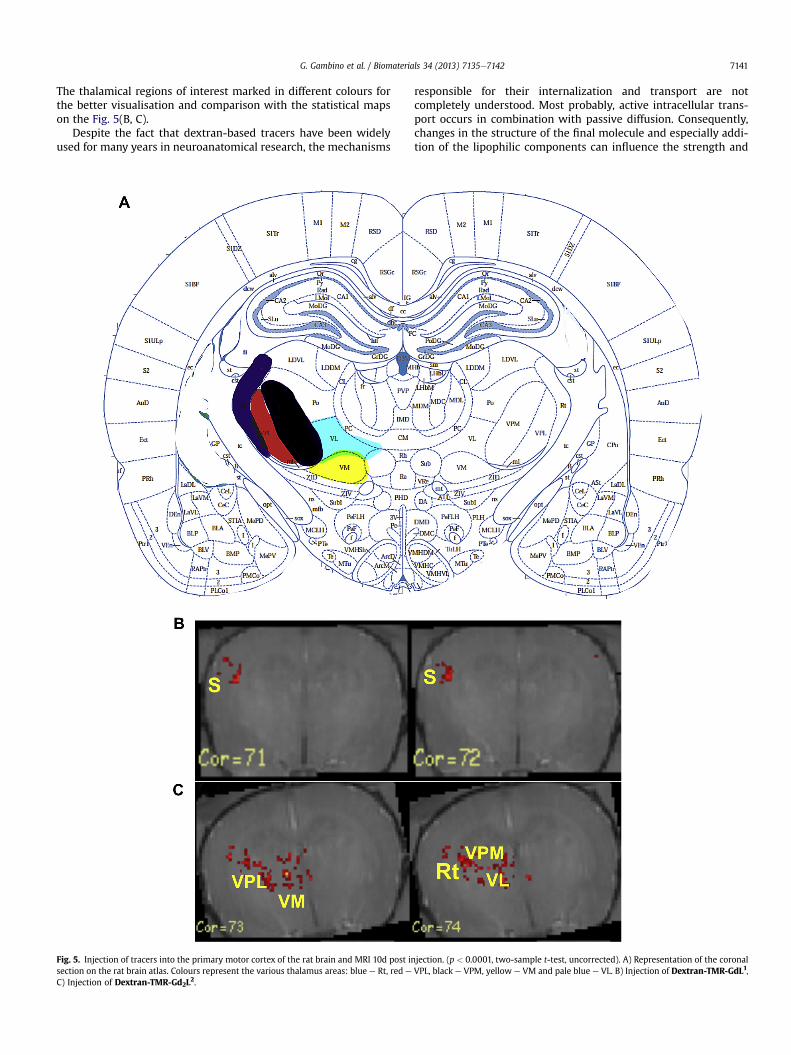
Statistical analysis indicated that labelling in a number of ex-pected cortical and subcortical regions was significant. A schematicrepresentation of the coronal section of the rat brain is given inFig. 5(A), corresponding to the slices analysed in Fig. 5(B and C) [29].
e dependent MRI. A) 6d post injection, B) 10d post injection. (p < 0.0001, two-sample t-
G. Gambino et al. / Biomaterials 34 (2013) 7135e7142 7141
The thalamical regions of interest marked in different colours forthe better visualisation and comparison with the statistical mapson the Fig. 5(B, C).
Despite the fact that dextran-based tracers have been widelyused for many years in neuroanatomical research, the mechanisms
Fig. 5. Injection of tracers into the primary motor cortex of the rat brain and MRI 10d post insection on the rat brain atlas. Colours represent the various thalamus areas: blue e Rt, red e
C) Injection of Dextran-TMR-Gd2L2.
responsible for their internalization and transport are notcompletely understood. Most probably, active intracellular trans-port occurs in combination with passive diffusion. Consequently,changes in the structure of the final molecule and especially addi-tion of the lipophilic components can influence the strength and
jection. (p < 0.0001, two-sample t-test, uncorrected). A) Representation of the coronalVPL, black e VPM, yellow e VM and pale blue e VL. B) Injection of Dextran-TMR-GdL1,
G. Gambino et al. / Biomaterials 34 (2013) 7135e71427142
directions of labelling. Thus dextran 10.000, which is known as apredominantly anterograde tracer, can also demonstrate retrogradelabelling [14].
Nevertheless, similar to the in vitro studies, in vivo in-vestigations also reveal differences between mono- and bis-AAZTAbased molecules. Thus, Dextran-TMR-GdL1 labelled cortical areasquite extensively. Clusters of voxels with significantly enhancedcontrast were observed in different MR slices representing thetract leading towards the contralateral M1 (Fig. 3B); a signal in-crease was also seen in the area of the ipsilateral somatosensorycortex (S) (Fig. 5B). These areas are only poorly present on theimages acquired after injection of Dextran-TMR-Gd2L2 (Fig. 5(C)and S2(C)). In spite of the fact that for the mono-AAZTA derivativethe thalamic area was poorly represented, still some increase ofthe signal was detected in various thalamic regions on the sta-tistical brain maps (Fig. S2A, B). When Dextran-TMR-Gd2L2 wasinjected, a prominent labelling in the ipsilateral thalamic areasVPL, VPM, VM, VL and Rt occurred on the statistical maps (Fig. 4C).The pyramidal tract could be clearly observed starting from themotor area and leading towards the various thalamic regions(Fig. S2C and D).
In the present study, advantage of dual modality probes wastaken and histological experiments were performed on the sameanimals after the last MR investigations on day 14 post injection.The histology results were used to confirm the MRI data. Given themuch higher sensitivity of the optical techniques, the comparisonof histological and MR data provides more information about theaxonal trajectories of the connected neurons in the areas of interest.Anterograde dextran labelling was found in the same areas wherethe signal in statistical MRI maps was detected, namely in ipsilat-eral S1, contralateral M1, and in the corticothalamic terminals VPL,VM, VL and VPM (Fig. S3).
4. Conclusions
Multimodal paramagnetic neuronal tracers with variable MRreporting parts have been developed. Physico-chemical charac-teristics and in vivo behaviours were compared between monoand bimetallic derivatives. It was found that the derivative con-taining the dimeric AAZTA moiety demonstrated stronger para-magnetic properties and as a result had a greater influence on theMR signal. We showed that as with the nature of the fluorophore,the structure of the MR reporter can also influence cellular uptakeand transport properties of dextran-based tracers. In spite ofsome differences in transport behaviour, both compounds resul-ted in MR signal enhancement in known targets of the primarymotor cortex after an optimal 10 days post injection. Takingadvantage of the multimodality of the developed tracers, MRresults have been confirmed by optical microscopy of the histo-logical slices from the same animals. These encouraging resultsre-assure us that such optimized compounds can be used forparticular neuroanatomical investigations. Depending on the finalapplication, this technique can also be combined with othermethods used in neuroscience (DTI, electrophysiology) providingessential information for in vivo whole brain longitudinal studiesof monosynaptic connections under physiological and patho-physiological conditions.
Acknowledgements
The authors thank Dr. Henry Evrard for his help in histologicalstudies. Ms. Hildegard Schulz for her help in performing cell ex-periments. The financial support of the Max-Planck Society,German and Italian Ministries for Education and Research (BMBF,FKZ: 01EZ0813; MIUR, PRIN 2009) is gratefully acknowledged.
Appendix A. Supplementary data
Supplementary data related to this article can be found at http://dx.doi.org/10.1016/j.biomaterials.2013.05.064.
References
[1] Filippi M, Agosta F. Structural and functional network connectivity breakdownin Alzheimer’s disease studied with magnetic resonance imaging techniques.J Alzheimers Dis 2011;24:455e74.
[2] Belleville S, Clément F, Mellah S, Gilbert B, Fontaine F, Gauthier S. Training-related brain plasticity in subjects at risk of developing Alzheimer’s disease.Brain 2011;134:1623e34.
[3] Strome EM, Doudet DJ. Animal models of neurodegenerative disease: insightsfrom in vivo imaging studies. Mol Imaging Biol 2007;9:186e95.
[4] Yanga J,Wadghirib YZ, HoangbDM, TsuicW, Suna Y, Chunga E, et al. Detection ofamyloid plaques targetedbyUSPIO-A beta 1-42 inAlzheimer’s disease transgenicmice using magnetic resonance microimaging. Neuroimage 2011;55:1600e9.
[5] Brust P, Patt JT, Deuther-Conrad W, Becker G, Patt M, Schildan A, et al. In vivomeasurement of nicotinic acetylcholine receptors with [18F]norchloro-fluoro-homoepibatidine. Synapse 2008;62:205e18.
[6] Dagher A, Nagano-Saito A. Functional and anatomical magnetic resonanceimaging in Parkinson’s disease. Mol Imaging Biol 2007;9:234e42.
[7] Stebbins GT, Murphy CM. Diffusion tensor imaging in Alzheimer’s disease andmild cognitive impairment. Behav Neurol 2009;21:39e49.
[8] Lee JH, Koretsky AP. Manganese enhanced magnetic resonance imaging. CurrPharm Biotechnol 2004;5:529e37.
[9] Eschenko O, Canals S, Simanova I, Beyerlein M, Murayama Y, Logothetis NK.Mapping of functional brain activity in freely behaving rats during voluntaryrunning using manganese-enhanced MRI: implication for longitudinal studies.Neuroimage 2010;49:2544e55.
[10] Chuang KH, Koretsky AP. Accounting for nonspecific enhancement inneuronal tract tracing using manganese enhanced magnetic resonance im-aging. Magn Reson Imaging 2009;27:594e600.
[11] Wu CW-H, Vasalatiy O, Liu N, Wu H, Cheal S, Chen D-Y, et al. Development of aMR-visible compound for tracing neuroanatomical connections in vivo.Neuron 2011;70:229e43.
[12] Mishra A, Schüz A, Engelmann J, Beyerlein M, Logothetis NK, Canals S. Bio-cytin-derived MRI contrast agent for longitudinal brain connectivity studies.ACS Chem Neurosci 2011;2:578e87.
[13] Mamedov I, Engelmann J, Eschenko O, Beyerlein M, Logothetis NK. Dual-functional probes towards in vivo studies of brain connectivity and plasticity.ChemComm 2012;48:2755e7.
[14] Reiner A, Veenman L, Medina L, Jiao Y, Del Mar N, Honig MG. Pathway tracingusing biotinylated dextran amines. J Neurosci Methods 2000;103:23e37.
[15] Baranyai Z, Uggeri F, Giovenzana GB, Benyei A, Brucher E, Aime S. Equilibriumand kinetic properties of the lanthanoids(III) and various divalent metalcomplexes of the heptadentate ligand AAZTA. Chem Eur J 2009;15:1696e705.
[16] Gugliotta G, Botta M, Tei L. AAZTA-based bifunctional chelating agents for thesynthesis of multimeric/dendrimeric MRI contrast agents. Org Biomol Chem2010;8:4569e74.
[17] Peters J, Huskens J, Raber DJ. Lanthanide induced shifts and relaxation rateenhancements. Prog Nucl Magn Reson Spectrosc 1996;28:283e350.
[18] Corsi DM, Platas-Iglesias C, van Bekkum H. Determination of paramagneticlanthanide(III) concentrations from bulk magnetic susceptibility shifts in NMRspectra. J Magn Res Chem 2001;39:723e6.
[19] Botta M, Tei L. Relaxivity enhancement in macromolecular and nanosizedGdIII-based MRI contrast agents. Eur J Inorg Chem 2012;5:1945e60.
[20] Toth E, Merbach AE. The chemistry of contrast agents in medical magneticresonance imaging. 3rd ed. New York: Wiley; 2001.
[21] Lipari G, Szabo S. Model-free approach to the interpretation of nuclearmagnetic-resonance relaxation in macromolecules .1. Theory and range ofvalidity. J Am Chem Soc 1982;104:4546e59.
[22] Lipari G, Szabo S. Model-free approach to the interpretation of nuclearmagnetic-resonance relaxation in macromolecules 2. Analysis of experimentalresults. J Am Chem Soc 1982;104:4559e70.
[23] Aime S, Calabi L, Cavallotti C, Gianolio E, Giovenzana GB, Losi P, et al. [Gd-AAZTA]�: a new structural entry for an improved generation of MRI contrastagents. Inorg Chem 2004;43:7588e90.
[24] Gugliotta G, Botta M, Giovenzana GB, Tei L. Fast and easy access to efficientbifunctional chelators for MRI applications. Bioorg Med Chem Lett 2009;19:3442e4.
[25] Kobberta C, Appsb R, Bechmannc I, Lanciegod JL, Meye J, Thanosa S. Currentconcepts in neuroanatomical tracing. Prog Neurobiol 2000;62:327e51.
[26] Nance DM, Burns J. Fluorescent dextrans as sensitive anterograde neuroana-tomical tracers: applications and pitfalls. Brain Res Bull 1990;25:139e45.
[27] Kaas J, Ebner F. Intrathalamic connections: a new way to modulate corticalplasticity? Nat Neurosci 1998;1:341e2.
[28] Ebrahimi A, Pochet R, Roger M. Topographical organization of the projectionsfrom physiologically identified areas of the motor cortex to the striatum in therat. Neurosci Res 1992;14:39e60.
[29] Paxinos G, Watson C. The rat brain in stereotaxic coordinates. 6th ed. Elsevier;2007.