Multigenerational Workforce: Relationship between by A ...
170
Multigenerational Workforce: Relationship between Generational Cohorts and Employee Engagement by Phyllis Kiiru-Weatherly A Dissertation Presented in Partial Fulfillment Of the Requirements for the Degree of Doctorate of Business Administration Wilmington University 2016
Transcript of Multigenerational Workforce: Relationship between by A ...

Multigenerational Workforce: Relationship between
Generational Cohorts and Employee Engagement
by
Phyllis Kiiru-Weatherly
A Dissertation Presented in Partial Fulfillment
Of the Requirements for the Degree of
Doctorate of Business Administration
Wilmington University
2016

ii
Multigenerational Workforce: Relationship between
Generational Cohorts and Employee Engagement
by
Phyllis Kiiru-Weatherly
I certify that I have read this dissertation and that in my opinion it meets the academic
and professional standards required by Wilmington University as a dissertation for
the degree of Doctor of Business Administration.
Signed ____________________________________________________________
Amy Danley, Ed.D, Dissertation Committee Chair
Signed ____________________________________________________________
Lynda Fuller, Ed.D, Dissertation Committee Member
Signed ____________________________________________________________
Gregory Warren, Ed.D, Dissertation Committee Member

iii
Dedication
I dedicate this dissertation to my children Ava & Jayden, my best friend and
true love, my husband Jerrold. Your never ending love, support, reassurance, and
encouragement throughout this process bolstered me with additional determination,
confidence, and endurance at times when I needed it most. Multiple obstacles and
challenges in our lives during this journey that threatened to derail or postpone my
ability to reach this important milestone. Never once did I consider stopping, though,
because I knew that together, we could overcome anything. You inspire me daily to
be a better person, and I will forever be thankful that I had you by my side during this
journey, cheering me on to the finish line. Looks like we made it!
I also dedicate this work to my parents, Mr. & Mrs Julius Kiiru Chomba, who
have always supported me and celebrated my successes no matter how large or small.
It is because of your modeling and the example you set that I have become a capable,
dedicated, compassionate individual who is proud of the values I uphold and of the
way they show up in my life. You instilled in me a passion for education, hard work,
and perseverance, and for that, I will always be thankful.

iv
Acknowledgements
First and foremost, I would like to thank my lord and savior Jesus Christ for
seeing me through this journey. As with any endeavor in life, you are only as
successful as those who support your journey. These years of doctoral study have
provided me with the opportunity to study with a number of outstanding
professionals. There are many people to acknowledge and thank for helping me
accomplish this incredible goal.
Special recognition is extended to Dr. Amy Danley, my Advisor and Chair of
my Dissertation Committee for your extraordinary guidance, support and direction
from my first coursework at Wilmington University to the final approval of my
dissertation. Dr. Lynda Fuller and Gregory Warren, dissertation committee
members, are appreciated for their ongoing support, feedback, and academic
perspectives. You have guided me through this process with calm deliberation.
Wilmington University, with all of the incredible resources of the many support staff
and other esteemed members of the faculty and staff who have been most supportive.
I want to acknowledge my colleagues and employers who supported me along
the way and reminded me why I value my profession. I also want to acknowledge
and thank all of the great researchers who wrote articles and books that I had the
privilege of reading, studying and citing to support my research.
For the commitment to life-long learning, as well as the strength, tenacity and
resolution which carried me through this transformative time, I thank my siblings,

v
Kevin, Sam and Chomba and especially my parents Julius Chomba Kiiru and Esther
Kiiru. I would be remiss not to recognize the power that parents play in molding the
person you become. Mom and Dad, thank you for teaching me the value of work as
foundational to a productive life. I am blessed to have you as my parents.
I am deeply grateful to our children Jayden and Ava for your love, support
and encouragement even when you were too young to understand this journey I was
travelling. Life is about learning and my wish for each of you is that you reach for the
starts and never stop exploring the world around you. It is through this process that
we learn who we truly are and the purpose God has for each of us. I hope I inspire
you as much as you inspire me.
Sincerest appreciation is extended to my husband Jerrold for your continuous
support, encouragement and confidence in me throughout my years of coursework
and completion of this dissertation. I love you and forever grateful for you.

vi
Abstract
Organizational leaders worldwide are concerned that employees are less engaged.
However, there has not yet been conclusive evidence that employee engagement is
actually at lower levels than in previous generations, defined as Baby boomers (born
1946-1964), Generation X (born 1965-1983), and Millennials (born 1984-2002). The
current study measured if engagement, composed of absorption, dedication, and vigor
dimensions (Schaufeli & Bakker, 2003) are in fact different by generations and
explored potential causes for this disparity. Specifically, the study measured the
relationship between the employee motivators toward work and generational cohort,
and the relationship between motivations and employee engagement. A three-factor
ANOVA analysis revealed differences in mean dedication and vigor, but not
absorption, across the generational groups. The study determined Baby Boomers
(1946-1964) had significantly higher vigor and dedication than the Millennials, but
not significantly higher absorption. However, the results for absorption trended in the
same direction as the results for vigor and dedication. Additional analyses indicated
that successive generations have viewed their work as less internally motivating. The
researcher synthesized these findings to determine that current workplace conditions
may be realigning the factors that employees find motivating about their jobs, and this
may be negatively impacting their engagement with their work. Implications from
the findings and recommendations for future research are discussed.

vii
Table of Contents
Dedication……………………………………………………………….......………..iii
Acknowledgment…………………………………………………………........……..iv
Abstract……………………………………………………………………….............vi
List of Tables……………………………………….……………………….…….....vii
List of Figures…………………………………………………………...…………..xiv
Chapter
1. Introduction……………….…………………………………………………….…1
Statement of the Problem……………………….…………………… …………...5
Purpose of the Study……………….…………………………………….………..5
Significance of the Study……..…………………………………………………...6
Research Questions………….…………………………………………………….8
Definition of Terms………………………………………………………………..8
Operational Definitions ………………………………………………………….12
Theoretical Framework…………………………………………………………..13
Assumptions, Limitations, and Delimitations of Study………………………….14
Assumptions……………………………………………………….................14

viii
Limitations………………………………………………………...................15
Delimitations………………………………………………………................15
Implications of the Study……………………………..…………………………..16
Chapter Summary…………………………………….…………………………..16
Dissertation Organization………………………………………………………...17
2. Literature Review……………………………………………………………...…18
Diversity in Today’s Workforce…………………………………………………18
Multigenerational Cohorts…………………………….…………………………24
Baby Boomers………………………………..………………………………26
Generation Xers………………………………………………………………27
Generation Y………………………………..………………………………..28
Workplace and Employee Engagement.…………………………………………32
Historical Overview……………………………………………………………...38
Theoretical Framework…………………………………………………………..40
Motivation ……………………………………………………………………41
Maslow’s Hierarchy of Needs ……………………………………………….41

ix
Herzburg’s Motivator-Hygiene Theory………………………………………44
Measuring Employee Engagement………………………………………………49
Likert Scales ………………………………………………………………….53
Conclusions……….....……………………………………………...……………54
Methodology……………………………………………………………………..57
Research Design…………………………………………………………………57
Population and Sample…………………………………………………………..61
Data Instrumentation……….………..…………………………………………...64
Data Analysis Plan Research Questions and Hypotheses………………………..68
Statistical Tests……………………………………………………………….70
Operationalization of Variables…..………………..…………………………73
Reliability and Validity…………………………………………………………..74
Reliability Analysis....………………………………………………………...76
Data Collection……………………………………..……………………………77
Data Analysis Procedures………………………………………………………..80
Correlational Analysis………………………………………………………..82

x
Research Questions and Hypotheses………………..…………………………...83
Ethical Considerations…………………………………………………………...84
Summary……….....……………………………………………………..……….85
Results…….……………………………………………………………………...86
Sample Demographics…………………………………………………………...87
Reliability Analysis……………………….…………………………………..…95
Descriptive Statistics and Data Screening……………………………………….96
Research Question 1……...……………………………………………………...97
Hypothesis 1a: Vigor…………………………………………………………97
Hypothesis 1b: Dedication……….………………..………………………….99
Hypothesis 1c: Absorption…………………………………………………..101
Research Question 2……...…………………………………………………….103
Hypothesis 2a…………………………..……………………………………104
Hypothesis 2b………………..………………………………………………106
Hypothesis 2c………………………………………………………………..108
Hypothesis 2d…………… ………………………………………………….109

xi
Hypothesis 2e…………………………………..……………………………111
Research Question 3……...…………………………………………………….113
Hypothesis 3a…………………………..……………………………………114
Hypothesis 3b………………..………………………………………………115
Hypothesis 3c………………………………………………………………..116
Hypothesis 3d…………… ………………………………………………….117
Hypothesis 3e…………………………………..……………………………118
Conclusions……….....………………………………………………………….120
3. Conclusion and Recommendations……………………………………………..122
Causes of Generational Differences in Engagement..………………………….127
Summary………………………………..………………………………………129
Future Research and Limitations…...…………………………………………..130
Implications for Practice ...……………………………………………………..132
References…………………………………………………………………………..134
Appendix …………….……………………………………………………………..148

xii
List of Tables
Table
1 Hypotheses, Statistical Tests, and Scales of Measurement……………….71
2 Reliability Coefficients…………………………………………………...77
3 Year Range of Birth………………………………………………………88
4 Race/Ethnicity………………………………………………………….…88
5 Educational. Attainment………………………………………………….89
6 Years Working at Current Place of Employment……………………...…90
7 Current Role at Job……………………………………………………….91
8 Employment Sector Industry……………………………………………..92
9 Survey Recruitment Organization………………………………………...93
10 Summary of Demographic Variables……………………………………..93
11 Reliability Coefficient…………………………………………………….95
12 Descriptive Statistics……………………………………………………...96
13 Group Means for Vigor by Generational Cohort…………………………97
14 ANOVA Summary Table for Vigor by Generational Cohort…………….98
15 Group Means for Dedication by Generational Cohort…………………..100
16 ANOVA Summary Table for Dedication by Generational Cohort……..100
17 Group Means for Absorption by Generational Cohort………………….102
18 ANOVA Summary Table for Absorption by Generational Cohort……..102

xiii
19 Group Means for Goal Internalization Motivation for Generational
Cohort…………………………………………………………………...104
20 ANOVA Summary Table for Goal Internalization Motivation by
Generational Cohort……………………………………………………..105
21 Group Means for External Self-Concept Motivation by Generational
Cohort…………………………………………………………………...107
22 Group Means for External Self-Concept Motivation by Generational
Cohort…………………………………………………………………...107
23 Group Means for Intrinsic Process Motivation by Generational Cohort..109
24 ANOVA Summary Table for Intrinsic Process Motivation by Generational
Cohort…………………………………………………………………...109
25 Group Means for Internal Self-Concept Motivation by Generational
Cohort…………………………………………………………………...110
26 ANOVA Summary Table for Internal Self-Concept Motivation by
Generational Cohort……………………………………………………..110
27 Group Means for Instrumental Motivation by Generational Cohort……110
28 ANOVA Summary Table for Instrumental Motivation by Generational
Cohort…………………………………………………………………...111
29 Correlation Matrix………………………………………………………113
30 Criteria for Interpreting Magnitude Correlations………………………..114
31 Summary of Hypothesis and Outcomes ………………………………...120

xiv
List of Figures
Figure
1 Maslow’s Hierarchy of Needs…………………………………………….42
2 Vigor by Generational Cohort…………………………………………….99
3 Dedication by Generational Cohort……………………………………...101
4 Absorption by Generational Cohort……………………………………...103
5 Goal Internalization by Generational Cohort……………………………106
6 External Self-Concept Motivation by Generational Cohort……………..108
7 Instrument Motivation by Generational Cohort……………………….…112
8 Goal Internalization and Work Engagement…………………………..…115
9 Goal Internalization and Motivation…………………………………..…116
10 Internal Self-Concept Motivation and Work Engagement………………118
11 Instrumental Motivation and Work Engagement………………………..119

1
CHAPTER 1
INTRODUCTION
The United States’ workforce currently comprises an unprecedented four
generations of workers: the traditionalists, the Baby Boomers, Generation X, and
Generation Y. The Traditionalists, also known as the Veterans, are the subset of the
workforce born between 1922 and 1945; the Baby Boomers were born between 1946
and 1964; Generation X (or “Gen Xers”), were born between 1965 and 1983, and
Generation Y (or “Millennials”) were born between 1984 and 2002. While this blend
of generations adds valuable diversity to the workforce, it also adds complexity: four
generations are working side-by-side, each at different life stages and with conflicting
needs. Research suggests (Howe & Strauss, 1991) that each generation employs a
unique outlook on the workplace environment; each generation brings to the
workplace differences in attitudes, behaviors, expectations, habits, as well as
motivational buttons. Furthermore, all workers come to the workplace with their own
frames of reference, as well as their own needs and values—many of which are based
on shared early social and economic experiences that are unique to each individual
generation (Hoew & Strauss, 1991). Thus, one of the primary challenges for
researchers and practitioners is to understand the similarities and differences between
each generation.
Companies are constantly faced with the challenge of attracting and retaining
highly-engaged employees. According to Kahn (1990), engagement can be defined
as “the way in which people connect themselves to their work roles, as well as how

2
they express themselves physically, cognitively and emotionally during the
performance of these roles” (p.694). Additionally, May, Gilson, and Harter (2004)
suggested that engagement pertains to how individuals apply themselves while
performing their job in relation to the active use of emotions, behaviors, and cognitive
skills. Furthermore, Schaufeli, Bakker, and Salanova (2006) stated, “engaged
employees have a sense of energetic and effective connection with their work
activities, and they see themselves as able to deal well with the demands of their jobs”
(p. 702). This latter definition of employee engagement includes three sub-
dimensions: vigor, dedication, and absorption. These elements refer to the level of
energy, involvement, and concentration the employee has towards his or her job,
while vigor represents high devotion to one’s work. These definitions have in
common a sense that engagement is a response to one’s work in which an individual
decides to invest in himself or herself or not.
The negative impacts of generational differences, combined with the lack of
employee/workplace engagement, can result in high levels of employee turnover and
burnout, which can impede an organization’s ability to grow and therefore maximize
profits. Maslach, Schaufeli, and Leiter (2001) defined burnout as the opposite of
engagement – it is where the employee feels overwhelmed by their work and ceases
or reduces effort towards completing it. The research done by Maslach et al. (2001)
built on previous work by Kahn (1990), posited that job engagement is associated
with three psychological conditions: (a) sustainable workload, (b) relevant
recognition and rewards, and (c) supportive work environment, and valued work.

3
Additionally, Kahn (1990) suggested that employees are engaged when their work is
psychologically meaningful. As such, burned-out workers feel exhausted and
unenthusiastic whereas engaged workers display high energy levels and mental
resilience, which makes them enthusiastic about what they do (Schaufeli & Bakker,
2003).
In addition to the lack of employee/workplace engagement and high levels of
employee burnout that generational differences bring to the forefront, generational
differences also negatively impact organizational leadership. Human Resource
professionals have observed conflict among employees as a result of generational
differences, especially as it relates to communication and cultural expectations
(Aggarwal & Bhargave, 2009). Thus, it may be argued that generational differences
not only affect the workplace in terms of individuals, but also in terms of
organizational performance. Furthermore, Bakker (2011) found an association
between lower employee engagement and workplace matters, such as job satisfaction
and employee performance and productivity.
Hence, one possible way for organizations to keep employee engagement
high, as well as job satisfaction, employee performance and productivity levels, is to
motivate each generational cohort based on their needs and expectations. Motivation
as it relates to the workforce provides a common thread across all generations and
may provide insight into the multi-generational challenge. Motivation is typically
described as a force, either intrinsic or extrinsic, that helps an individual achieve their
goals. Workplace motivation occurs through both extrinsic (external) and intrinsic

4
(internal) dynamics. Extrinsic motivators in the work environment include salaries,
bonuses, commissions, health care insurance, promotions, vacations, stock options,
and other tangible rewards (Robbins, 2001). Intrinsic motivational factors in the
workplace include job satisfaction, public and personal recognition, positive
relationships with managers and coworkers, and the ability to influence the work
situation (Thomas, 2009). Understanding the differences in motivating factors among
differing age groups can aid employers in designing effective recruiting and retention
strategies to successfully manage the challenges of a multi-generational workforce,
while maintaining and optimizing organizational performance and productivity
(Parker et al., 2003).
Organizations are always seeking highly engaged employees. As such, the
possibility of generational differences in the workplace is important in terms of
organizational leadership. This is because one of the main objectives of any
organization is to develop employees who are productive, innovative, profitable, less
likely to be absent, and have low turnover rates. Therefore, organizations need to
understand how best they can manage the different generations present in today’s
force so that employee work engagement can be fostered to ensure that all employees
are maximally productive. This study tested potential differences in perceptions of
workplace engagement between the generations that are currently in the workforce.
The study also outlined the problems facing organizational leadership and suggested
strategies to keep a multigenerational workforce highly engaged and highly
productive.

5
Statement of the Problem
According to Macey and Schneider (2008), employees who are engaged tend
to demonstrate higher levels of job satisfaction, productivity, and performance when
compared to their disengaged counterparts. This problem is that differences between
generational cohorts suggest an adverse impact on employee work engagement. As a
consequence, today’s organizations face the difficult challenge of attracting and
retaining highly-engaged employees. Studies showed that attrition and career
changes constantly impacted the workforce in 2013, as more than 20% of employees
worldwide reported that they intended to find a new job within the next year
(Castellano, 2013). Therefore, organizations need to understand these generational
differences and how they impact workplace engagement in order to improve their
employees’ capabilities, which in turn should have positive results on both individual
and organizational performance.
Purpose of the Study
Today’s workforce is changing. The Baby Boomers are now entering their late
60s and there is an influx of Millennials entering the workplace. There are important
ramifications for this development in terms of employee engagement. According to
Gallup’s engagement study, less than one-third (31.5%) of U.S. workers were
engaged in their jobs in 2014 (Adkins, 2015). The recent literature suggested that
companies are struggling to engage the modern 21st century workforce. However,
there is limited literature in research pertaining to the knowledge of engagement in
the current workforce setting among different generations to identify its predictors

6
and consequences. To cite Macey and Schneider (2008), it is important to recognize
that employee engagement is a “desirable condition which an employee exhibits high
levels of involvement, commitment, passion, enthusiasm, focused effort and energy”
(p.16).
The purpose of this study is to determine whether a relationship exists
between generational cohorts in the current workforce and the level of work
engagement, and if so, to what degree? The study also seeks to determine the
relationship, if any, between what motivates each generational cohort, as well as the
relationship between motivation resources and employee engagement. Additionally,
this study will help to understand whether motivation sources have any relationship to
the level of workplace engagement, which in turn would assist organizations in the
recruiting and retention process. Specifically, does the source of engagement differ
across generations, and if so how does this impact each group’s engagement with
their work? This study will conclude with suggestions on how to accommodate each
group based on the results of the study.
Significance of the Study
There are many challenges associated with effectively managing the present-
day multigenerational workforce. Given the demographic mix, it is important for any
organization to understand how to integrate and leverage what each cohort has to
offer in order to improve job satisfaction, productivity, performance, and retention. If
a company has positive employee engagement overall across the organization, it
could deliver a competitive advantage to the organization (Bakker, Schaufeli, Leiter,

7
& Taris, 2008). Employees who are engaged will work harder, for longer hours, and
develop better solutions to problems, leading to optimal organizational outcomes
(Bakker et al., 2008.) This study contributes to the field by adding to the present
empirical research on generational differences in the workplace, as well as its impact
on employee/workplace engagement. Secondly, literature reviews suggest that there
are differences and similarities between generational cohorts. Most of the studies
have focused on the differences between generations rather than a combination of
both views. Thus, this study contributes to leadership literature by providing insights
into what keeps employees motivated and engaged at work, particularly by exploring
differences among generations evaluating the self-perception of generational cohorts
as compared to how others perceive them; it will aid in building a stronger foundation
to understand better generational similarities and differences.
Third, this study contributes to further understanding on how to motivate a
multigenerational workforce from an employer’s perspective and develop solutions
that keep each generation engaged based on the factors that are most likely to
motivate them. Fourth, this study increases knowledge about the relationship between
employee perception and workplace engagement. When dealing with organizations,
it is important to understand both perception and reality in order to create a plan that
can bridge the gap. Finally, this study brings together two different streams of
research: generational differences and employee engagement. It provides quantitative
evidence of the influence of generational differences on employee engagement and

8
offers organizations the insight to develop appropriate strategies to foster and increase
employee engagement.
Research Questions
The study seeks to determine whether potential differences in perceptions of
workplace engagement exist among the four generations currently present in the
workforce, as well as outlines the problems facing organizational leadership and
suggest strategies to keep a multigenerational workforce highly engaged and
productive. Specifically, the research will answer:
RQ1: Is there a difference in the level of engagement among generational
cohorts in the workforce?
RQ2: Is there is a significant difference in the level of engagement among
generational cohorts in the workforce?
RQ3: Does a relationship exist between generational cohorts in the current
workforce and the level of work engagement? If so, to what degree?
RQ4: What are the factors that motivate each generational cohort?
RQ5: Is there a relationship between motivation resources and employee
engagement?
Definition of Terms
For the purposes of this study, the following key terms have been identified as
they relate to the topic:
Absorption - One of the three ways in which employee engagement is
measured by focusing on being completely and happily consumed by work and not
9
wanting to detach from the work because time passes so quickly that everything else
is forgotten (Schaufeli, 2006).
Baby Boomers (Boomers) - The cohort of Americans born between 1946 –
1964.
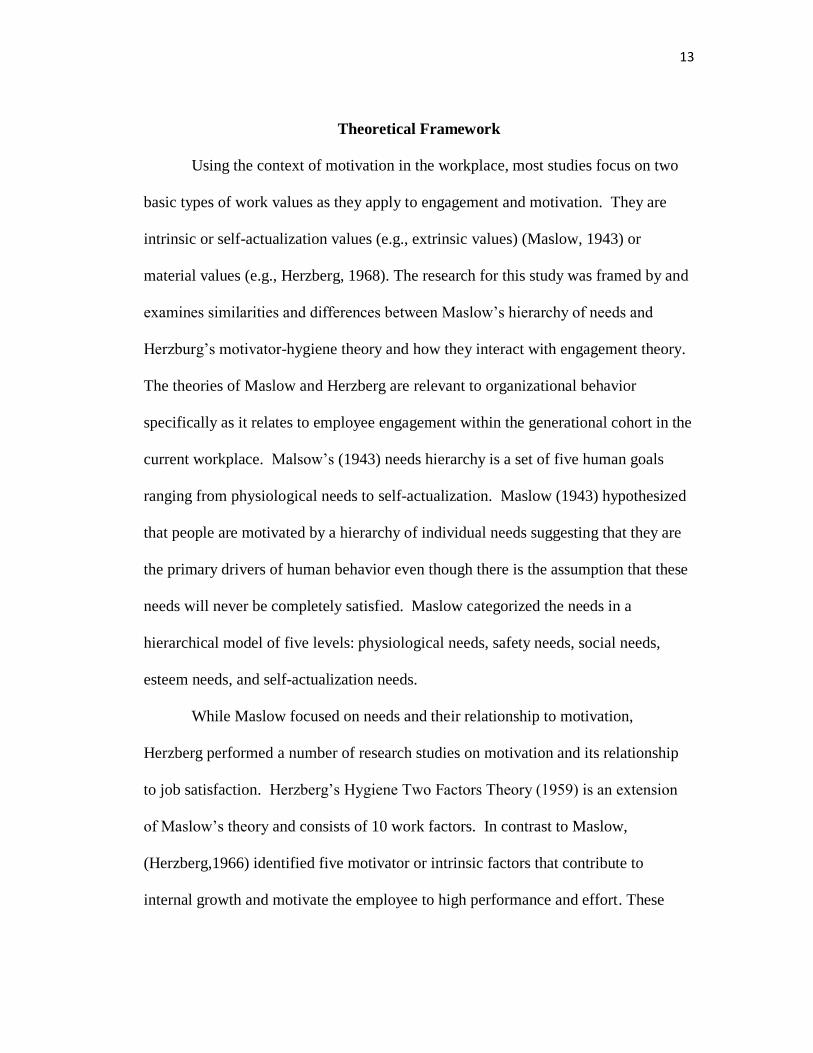
Engagement - Maslach, Schaulfeli, and Leiter (2001) defined engagement as
an affective, motivational state of fulfillment normally characterized by vigor,
dedication and absorption; An emotional connection an employee feels toward his or
her employment organization, which tends to influence his or her work-related
behavior and level of effort; A separate construct representing a positive, fulfilling,
work-related state of mind characterized by vigor, dedication, and absorption
(Demerouti et al., 2001).
Dedication - One of the three ways in which employee engagement is
measured by describing the sense of significance, enthusiasm, and pride an employee
has for the job. Dedication also describes the feeling of inspiration and challenge an
employee feels by work (Schaufeli, 2009).
Diversity - Acknowledging, understanding, accepting, valuing, and
celebrating differences among people with respect to age, class, ethnicity, gender,
physical and mental ability, race, sexual orientation, spiritual practice, and public
assistance status (Esty, Griffin, & Schorr-Hirsh1995).
Employee Hygiene - The components of Herzburg’s motivator-hygiene
theory that represent the cause for employee dissatisfaction in the workplace
(Herzberg et al., 1959).

10
Employee Motivation - The components of Herzberg’s motivator-hygiene
theory that represent the causation and basis for employee satisfaction in the
workplace (Herzberg et al., 1959).
Generation - Kuppershcmidt (2000) defined a generation as an identifiable
group sharing years of birth and significant life events that occur in critical stages of
their lives.
Generation Cohort - “…shaped by events or circumstances according to
which phase of life its members occupy at the time” (Howe & Strauss, 2007, p. 42).
The group in which employees are categorized both by age and identity (Howe &
Strauss, 1991).
Generation X (GenXer) - The cohort of Americans born between 1965 –
1982.
Job Satisfaction - Wright and Davis (2003) defined job satisfaction as the
representation of employees and their work environment by comparing what they
expect to receive versus what they have actually received.
Millennials - The cohort of Americans born between 1983 – 1997.
Motivation-Hygiene Theory - Job satisfaction theory by Frederick Herzberg
that states that factors involved in yielding job satisfaction are separate and different
from the factors leading to job dissatisfaction (Herzberg, 1959).
Motivation-Hygiene Theory Hygiene Factors - Hygiene factors extrinsic to
the job that produce job dissatisfaction and that include: supervision, salary, policy

11
and administration, interpersonal relationships, and working conditions (Herzberg,
1968).
Motivation-Hygiene Theory Motivator Factors - Motivator factors intrinsic
to the job that produce job satisfaction that include: achievement, recognition, work
itself, responsibility, and advancement.
Organizational Commitment - Saks (2006) defined organizational
commitment as the attitude and attachment that people have toward their
organization.
Needs - Used by Maslow to refer to a hierarchy of physiological, safety, love,
esteem and self-actualization necessities (Maslow, 1943).
Perceived Organizational and Supervisor Support - Kahn (1990) suggested
that perceived organizational and supervisory support are the amount of care and
support employees believe they receive from their organization.
Personal Engagement - The behaviors by which employees bring in or leave
out their personal selves during work role performances (Kahn, 1990).
Rewards and Recognition - Maslach, Schaufeli, and Leiter (2001) defined
rewards and recognition as the perception of benefits received from performing a
role. Maslach et al.(2001) suggested that a lack of rewards and recognition can lead to
burnout, while the presence of rewards and recognition can be important for
engagement.

12
Satisfaction - A multi-dimensional concept that includes perceptions about
the ability of work to fulfill needs (cognitive aspects) and attitudes within the context
of the job (affective aspects).
Utrecht Work Engagement Scale (UWES) - A 17-question survey
instrument used by researchers, leaders and organizations to measure the vigor,
dedication and absorption levels of employee engagement conditions in the
workplace (Schaufeli et al., 2006). The original UWES-17 instrument was reduced
from 17 questions to 9 questions to improve its performance (Schaufeli et al., 2006).
Vigor - One of the three ways in which employee engagement is measured by
describing high levels of energy and resilience, the willingness to invest effort, not
being easily fatigued, and persistence in the face of workplace difficulties (Schaufeli,
2009).
Operational Definitions
Employee Engagement - Construct measured by the Utrecht Work
Engagement Scale (Schaufeli, 2009).
Identified Generational Cohort - The age group in which employees
identify themselves to be a member of, measured by the answer to the multiple choice
questions on the survey.
Job Satisfaction - The components of Maslow’s hierarchy of needs (Maslow,
1943).
Demographics - Data gathered from survey respondents including age,
gender, job title, and job department in which the employee works.
13
Theoretical Framework
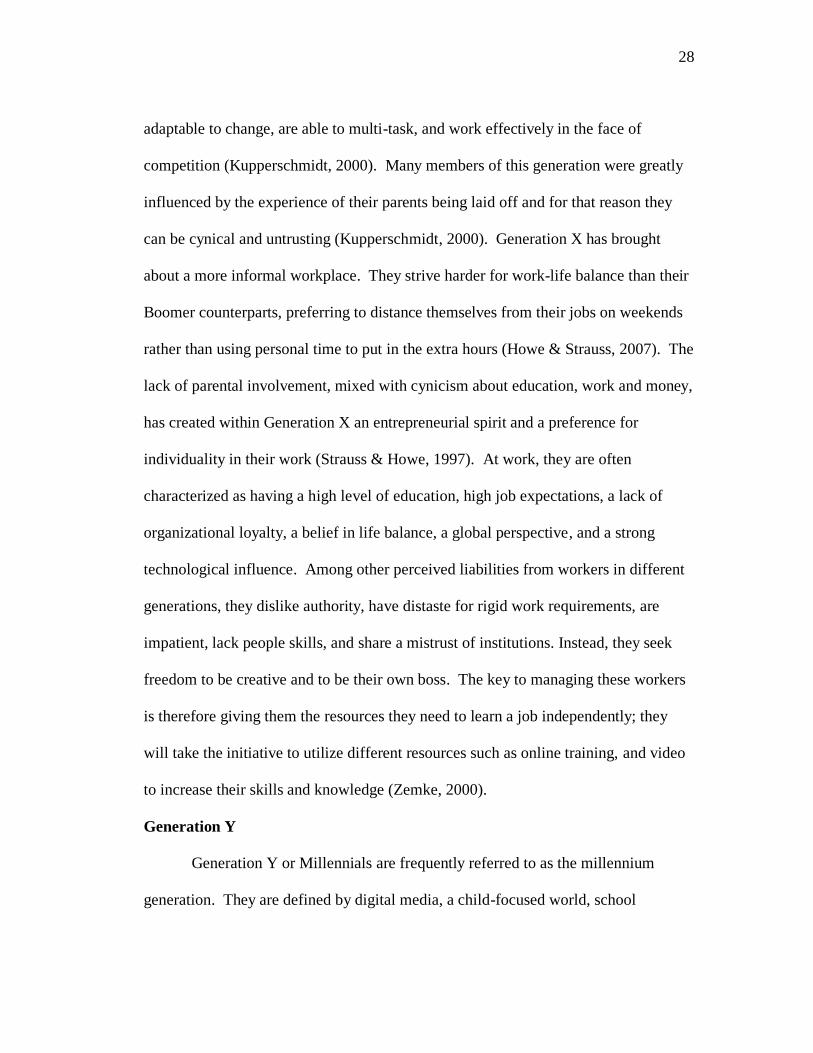
Using the context of motivation in the workplace, most studies focus on two
basic types of work values as they apply to engagement and motivation. They are
intrinsic or self-actualization values (e.g., extrinsic values) (Maslow, 1943) or
material values (e.g., Herzberg, 1968). The research for this study was framed by and
examines similarities and differences between Maslow’s hierarchy of needs and
Herzburg’s motivator-hygiene theory and how they interact with engagement theory.
The theories of Maslow and Herzberg are relevant to organizational behavior
specifically as it relates to employee engagement within the generational cohort in the
current workplace. Malsow’s (1943) needs hierarchy is a set of five human goals
ranging from physiological needs to self-actualization. Maslow (1943) hypothesized
that people are motivated by a hierarchy of individual needs suggesting that they are
the primary drivers of human behavior even though there is the assumption that these
needs will never be completely satisfied. Maslow categorized the needs in a
hierarchical model of five levels: physiological needs, safety needs, social needs,
esteem needs, and self-actualization needs.
While Maslow focused on needs and their relationship to motivation,
Herzberg performed a number of research studies on motivation and its relationship
to job satisfaction. Herzberg’s Hygiene Two Factors Theory (1959) is an extension
of Maslow’s theory and consists of 10 work factors. In contrast to Maslow,
(Herzberg,1966) identified five motivator or intrinsic factors that contribute to
internal growth and motivate the employee to high performance and effort. These

14
factors are directly related to the employee’s relationship to their job. They include
the work involved, achievement, responsibility, recognition, and advancement. These
motivating factors contribute to one’s job satisfaction thus creating a positive attitude
and feeling towards work (Herzberg, 1966). The five hygiene or extrinsic factors are
derived from the actual work environment and describe the relationship to the
environment. These factors have little effect on positive job attitudes and can create
job dissatisfaction (Herzberg, 1966). They include feelings about supervision, salary,
policy and administration, interpersonal relationships, as well as working conditions.
Assumptions, Limitations, and Delimitations of the Study
Assumptions
This study will be based on three assumptions. The first assumption is that the
participants would be available and provide clear, honest, and unbiased feedback
relative to the topic. The second assumption is that participants will respond to the
survey questions related to employee engagement and demographic profile. The
researcher assumed that a quantitative approach would be the most effective means
for achieving the goals of the study, which is to identify generational cohort
relationships to employee engagement in the workforce. For this reason, the study
was conducted under the third assumption that the Utrecht Work Engagement Scale
(UWES) (Schaufeli & Bakker, 2003) instrument is a valid and reliable means for
identifying and measuring high and low levels of employee work engagement.
Limitations

15
The intended sample population group for this study is individuals in the
current workforce connected via professional networking groups. Therefore, it may
not be possible to generalize the findings of this study to include the entire United
States’ workforce. Secondly, this research will rely on self-reported data and,
therefore, will be limited to fact that it can be independently verified. Additionally,
the findings of the study may not answer the objectives of the research if study
participants fail to answer the questionnaire with candor. Finally, the researcher has
detected biases in the previous literature in field (Kuppershcmidt, 2000) meaning that
the motivation theory presented in the study was based on an American culture. In
particular, some research has failed to support the assumptions that: (a) all members
of a generation are impressed by the same social and historical events (Richman,
2006); (b) many core characteristics and values of a generation are set for their life
span (Shaw, 2005); and (c) members of a generational cohort experience the same
events the same way (Baumruk, 2004). Therefore, to avoid perpetuating these biases
as well as ensure the validity of this study, the researcher intends to be selective of the
data to be studied and how the researcher has chosen to represent generational
cohorts.
Delimitations
The delimitations of the study are: (a) participation is delimited to an alumni
group in the northeast region of the United States who (i) can be classified as Baby
Boomer, Generation X’er or Generation Y, and (ii) who are currently employed in the
U.S. workforce; (b) in order to assure the reliability of the data collected, the

16
instrumentation (questionnaire) will not include any open-ended questions; a Likert-
type scale with an instrument (questionnaire) designed specifically for the proposed
study will be utilized (UWES-9) developed by Schaufeli et al. (2006).
Implications of the Study
Understanding differences in workplace engagement among the generational
cohorts that comprise today's workforce could help employers create work
environments, which can optimize performance and productivity. Increasing
employee engagement could create positive change by helping organizational leaders
implement strategies to increase productivity, which could ultimately lead to
increased profitability. Increasing organizational profitability could create a stable
workforce, a better economy, and enhanced longevity. Progressing the research on
employee engagement should also interest leaders of academic institutions who are
focused on developing strategies for organizations to increase employee engagement.
The results of this study may consequently help organizations minimize overall
employee turnover and burnout while at the same time identifying any gaps that exist
between generation cohorts and work engagement that impede an organization’s
success.
Chapter Summary
This chapter established the foundation and purpose for this research study.
The chapter encompasses an overview of employee engagement and the challenges it
represents for organizational leaders. In order for an organization to succeed and
maintain a competitive edge, it is important for the leadership of the organization to

17
provide a supportive environment to motivate each of the generational cohorts, which
will foster the generation of a highly-engaged workforce. Thus, the research studied
whether a relationship exists among generational cohorts in the current workforce, as
well as the relationship between motivation resources and employee engagement. For
this objective, a validated model of workplace engagement (UWES-9) is appropriate
to measure the level of engagement based on the designated current workforce.
Another validated model (MSI) was appropriate to understand the differences in
motivation sources between generations and how the differences might relate to
employee engagement in each generational cohort.
Dissertation Organization
Chapter 2 focuses on a review of the literature on generational theories,
workplace engagement, and motivation theories as they apply to the research. The
review includes a brief overview of literature regarding generation cohorts and their
link to employee engagement. Chapter 3 contains a discussion of the methodology,
research design, data collection, and data analysis methods used in the study. It also
covers a discussion of population, sampling, instrumentation and measurement issues,
the validity and reliability of the study, and ethical considerations. Chapter 4 presents
the analyses and results of the data collected for the study, while Chapter 5 provides
conclusions based on the analysis of the data.

18
CHAPTER 2
LITERATURE REVIEW
This chapter will present a review of the literature used to examine the
relationship between generational cohorts and employee engagement with particular
attention to the human behavior associated with the four generational types found in
today’s workforce. Therefore, this chapter will: (a) examine the diversity of today’s
workforce; (b) discuss the concept of a multigenerational workforce; (c) discuss the
concept of employee engagement, as well as its various dimensions and its evolution;
(d) present an assessment of the historical overview of employee engagement; (e)
examine the link between motivational theories and engagement integration; and (f)
discuss the tool used to measure employee engagement, as well as its applicability to
this study. The literature review includes generational research findings, analysis of
the current workforce, and theories surrounding employee engagement. As the
workplace evolves, historical research will provide a foundation for how
organizations can manage highly- engaged and satisfied multigenerational
employees—both as individuals as and as team members—ultimately increasing
retention and productivity.
Diversity in Today’s Workforce
Rising globalization and the development of a world economy often requires
the interaction between people of diverse populations. The diversity of people
encompasses both the similarities and differences between the members of a group.
Etsy, Griffin, and Hirsch (1995) described the act of accepting diversity as

19
“acknowledging, understanding, accepting, valuing, and celebrating differences
among people with respect to age, class, ethnicity, gender, physical and mental
ability, race, sexual orientation, spiritual practice, and public assistance status” (p. 2).
Employers in all sectors are increasingly focused on attracting and retaining a diverse
workforce as well as creating an environment, where different generations can work
together and interact effectively. Thus, one of the biggest challenges facing managers
today is how to lead a multigenerational workforce. The age spectrum in the
workforce is now so wide that many organizations have four generations of
employees working alongside one another. Employees from different generations
may have varying expectations of their work experience and, therefore, may approach
professional responsibilities differently and prefer different incentives or motivational
methods.
According to a 2012 report from the Bureau of Labor and Statistics (BLS,
2012), approximately 243 million individuals were classified as “working-age” in the
United States, with 155 million people actively employed or seeking employment.
Furthermore, it is estimated that 96% of the current U.S. workforce includes three
different generations: Baby Boomers (34%), Generation X (37%), and Millennials
(25%) (BLS, 2012). The remaining 4% includes the oldest generation or
Traditionalists, most of whom are retired. Additionally, by the year 2020, the U.S.
labor force is projected to reach more than 164 million people, an increase of 5.9%
(BLS, 2012). As such, organization leaders must have an understanding of the work

20
values specific to each of these generations if they are to manage and mentor them
both individually, and as members of a diverse workplace.
While a diverse workplace presents many advantages for an organization,
there are challenges to managing these populations. Managing diversity requires
more than simply acknowledging differences between people. It is also important to
recognize the value of these differences, promote inclusiveness, and prevent or
combat discrimination. Additionally, leaders need to remember that diversity is not
about differences among groups; but it is, instead, about differences among
individuals. Therefore, it is crucial to respect the fact that each individual is unique
and does not represent or speak for a particular group. Hence, Esty, Griffin, and
Schorr-Hirsh (1995) argued that organizations that focus on creating a culture of
diversity in the workplace can increase productivity and competitive opportunities,
enhance recruitment and creativity, reduce litigation, and overall build an admirable
business image.
In order to understand generational differences, it is important to set a clear
definition of the term “generation.” There are many available studies on generations,
each using its own parameters for defining these groups. Several definitions exist,
but once stated, studies support differences and preferences in view of the workplace.
The following four definitions of generation capture some of these differences: (i) a
birth cohort identified by the trends and events in history (political, economic and
social), where generations occur in four 20-year recurring cycles equaling 80 years
total or the span of one lifetime (Howe & Strauss, 1991); (ii) an identifiable group

21
(cohort) that shares birth years, age, location, and significant life events at critical
developmental stages, divided by 5-7 years into first wave, core group and last wave
(Kupperschmidt, 2000, p. 66); (iii) an identifiable group that shares a common
historical experience, with the time span between each generation shortening as the
pace of change accelerates (Martin & Tulgan, 2001); and (iv) a cohort born in the
same general time span that shares key experiences and is defined by common tastes
and attitudes, as well as shares economic, social, sociological and demographic
experiences (Zemke, Raines, & Filipczak, 2000).
Despite the differences in mapping the groups, researchers agree that each
generation is characterized in large partly by the historical context into which the
members were born. Circumstances, such as world events and the economy, create
shared experiences (Zemke, 2011; Raines, 2003; Howe & Strauss, 2000), which in
turn dictate cultural experiences (Twenge, 2006). For example, Kuppershcmidt
(2002), who examined the conflict between the four generations comprising today's
nursing workforce, defined a generation as an “identifiable group that shares years of
birth and significant life events that occur in critical stages of their lives.”
Additionally, Karl Mannheim, who may be regarded as the grandfather of
generational research as a result of his 1923 essay entitled “The Problem of
Generations,” postulated that young generations are imperfectly socialized because of
a gap between the ideals learned from older generations (such as their parents)
combined with what they learn from their own life experiences (Pilcher, 1994).

22
Neil Howe and William Straus, leading researchers on the subject of
generations, expanded upon the theory of generations and brought popularity to the
theory in their book entitled, “Generations: The History of America's Future, 1584 to
2069.” According to researchers Howe and Strauss (1991), generational theory is
based on the idea that key historical events and personal experiences during the first
twenty years of life have the powerful ability to create a common ground for shared
beliefs, values, and attitudes towards others. Other factors such as gender, religion,
education, social class, ethnicity, and race may also have an influence on identity,
both as an individual and within a group. Therefore, it is important to be careful
when evaluating generational characteristics to avoid inaccurate stereotypes and the
misrepresentation of groups. Thus, generally speaking, a generation is said to span
approximately 20 years.
Recently, researchers have increasingly scrutinized generational differences in
the workplace since these differences can present challenges in the area of
organizational leadership, employee engagement, performance, productivity, and
employee retention. Of the four generations in the current workforce, the Millennials,
the largest and youngest generation now entering the workplace, has aroused the
highest interest. With regards to the Baby Boomers, the most experienced group,
there is concern for what will happen when they begin to retire—a loss of institutional
knowledge and the task of replacing it. Hence, organizations are adamant about
adjusting their recruiting, training, and retention strategies to accommodate this shift
in the workforce.

23
Therefore, the goal of this research is to help promote the success of business
organizations by obtaining an understanding of the impact generational differences
have on overall productivity and performance, and to do so with a view towards
influencing the outcome. Although the literature confirms generational differences
exist with respect to work values and attitudes, limited attention has been given to
employee engagement, specifically how it may differ for each generation, as well as
its impact on the workplace. Today’s workforce has undergone several changes in
terms of how people get to work in addition to how, when, and where business is
conducted. Therefore, to manage complete and diverse work streams, leaders must
understand the impact of these changes on a multigenerational workforce in order to
effectively lead the organization. Thus, it may be argued that recognizing differences
and understanding each generation and how they influence change is enlightening and
of great value to employers (Twenge, 2006).
In summary, today’s workforce is increasing in diversity, and as a
consequence, organizations must create a work environment where different
generation can work together. However, while having diverse workforces can
positively impact organizations (for example, by increasing productivity and
creativity), managing a diverse workforce can be challenging especially as it relates
to generational differences. This challenge may be attributed to the fact that
assumptions of generational characteristics may influence a biased perspective of
inaccurate stereotypes. As such, it is important to be careful when evaluating
generational characteristics so as to avoid and the misrepresentation of groups. The

24
next section will discuss diversity as it relates to generational
characteristics/differences and multigenerational cohorts.
Multigenerational Cohorts
Employing a multigenerational workforce can be very beneficial to
companies. A workforce composed of differently-aged demographics creates an
environment where each generation brings different skills and talents to the table.
This variety of skills can come together to promote the innovative use of technology,
robust mentoring, and a proud tradition and continuity. Younger professionals have
grown-up in a high-tech world, and for that reason, the effective use of business
technology tools comes quite easily to them, especially when compared to their more
mature counterparts. On the other hand, more mature members of a workforce have
the advantage of deeply established core business skills. A balance of tenure and
experience helps organizations to connect better and meet customer needs.
Organizations benefit when they leverage their employees by valuing knowledge,
experience, and skill above age, seniority, or gender and when they recognize that
employees of all ages create opportunities to teach, share, and learn from each other.
In effect, respecting the importance of a multigenerational workforce creates an
opportunity to maintain continuity in skill and leadership development while also
planning succession strategies.
Glass (2007) argued that there are many challenges associated with
effectively managing a multigenerational workforce including differences in work
ethic, the way employees manage change, and the way they perceive organizational

25
hierarchy. Members of different generations can have different ideas about how work
is done. For example, Baby Boomers believe that working long hours demonstrates
dedication and commitment while the younger generations prefer flexible work
arrangements. According to Glass (2007), younger generations focus more on the
outcome over the process; they are less concerned with how much work is done
where. In the workplace, some of these challenges are heightened by outdated human
resource policies/corporate philosophies, ineffective internal communication, lack of
collaborative decision-making, and lack of internal training programs, which
emphasizes understanding and embraces the differences between groups.
Additionally, conflicts can arise when employees have differing behavioral
expectations (Strauss & Howe, 1991). Hence, it may be argued that the perception of
job satisfaction among a multigenerational workforce varies and thus it may affect the
performance of organizations.
As a result, this study seeks to examine whether generational differences in
employee engagement exist; and if so, do they vary among Baby Boomers,
Generation X, and Millennial generations in the workplace? Historians, sociologists,
and educators have assigned an assortment of names for each of the four generations.
While birth years assigned for each may vary depending on the source from which
data is derived, this research will utilize the following birth ranges for the four major
generations of the 20th
century (Sullivan, Forret, Carraher, & Mainiero, 2009):
Traditionalist, also known as Veterans, were born between 1922 and 1945; Baby
Boomers, were born between 1946 and 1964; Generation X, known as Gen Xers,

26
were born between 1965 and 1983; and Generation Y, also known as Millennial, were
born between 1984 and 2002. Even though four generations are represented in
today’s workforce, due to the low numbers of Traditionalists (now 70-91 years old),
they will not be included. This study will therefore focus on three cohorts only: Baby
Boomer, Gen Y, and Gen X.
Baby Boomers
Baby Boomers earned their name due to the boom in births between 1946 and
1964. This generation grew up embracing the idea of entitlement and expecting the
best from life (Kupperschmidt, 2000). Boomers entered the workplace at a time when
leadership and formal authority were considered to be synonymous (Crumpacker &
Crumpacker, 2007). They were profoundly affected by the Vietnam War, the civil
rights movement, the class of the Kennedys, Kennedy’s and King’s assassinations,
the Watergate sexual revolution (Barford & Hester, 2011) and Woodstock (Adams,
2000). From a diversity point of view, Boomers are less ethnically and culturally
diverse compared to other generations. According to the Pew Research Center
(2010), Non-Hispanics (whites) make up 73% of Boomers. Boomers were found to
have a positive work ethic, especially as it relates to their strength as team players and
mentors, which positively effects change through a strong work commitment
(Kupperschmidt, 2000).
These cohorts value management more than any other generation; therefore,
managers should involve them in the planning process to gain buy in and avoid
problems that may arise (Zemke et al., 2000). Boomers currently hold many of the

27
executive level positions in corporate America. They are known as workaholics, often
putting their jobs before their families (Strauss & Howe, 1997). Boomers believe that
work is a priority and by paying their dues with loyalty and tenure there comes the
reward of seniority (Crumpacker & Crumpacker, 2007). Among their perceived
liabilities of workers in different generations, they expect everyone to be workaholics,
they dislike conflict, they do not like change, and they are self-centered and
judgmental towards others who do not see their point of view (Zemke et al., 2000).
They are the true workaholics of all the generations, but they will strive to find a
better work/life balance as their financial needs dictates that they stay in the
workforce a longer time (Zemke et al., 2000). Thus, this generation is expected to
remain in the workforce longer as some want to continue to work as long as they
physically can, while others cannot afford to retire, either because they failed to save
enough for retirement or because they took a big hit to their retirement funds during
the 2008-2009 recession. While this generation has had a major influence on the
American workforce, they are beginning to enter retirement.
Generation X’ers
Watergate, the Energy Crisis, having single parents, Y2K, activism, corporate
downsizing, and the end of the Cold War, influenced generation X’ers. While many
of them had true dual income families (working moms), they had divorced parents.
As a result, they were the first generation of latchkey kids. In terms of diversity,
GenXers are made up of 62% non-Hispanic whites (Pew Research Center, 2010).
Gen X’ers are competent with technology and comfortable with diversity. They are
28
adaptable to change, are able to multi-task, and work effectively in the face of
competition (Kupperschmidt, 2000). Many members of this generation were greatly
influenced by the experience of their parents being laid off and for that reason they
can be cynical and untrusting (Kupperschmidt, 2000). Generation X has brought
about a more informal workplace. They strive harder for work-life balance than their
Boomer counterparts, preferring to distance themselves from their jobs on weekends
rather than using personal time to put in the extra hours (Howe & Strauss, 2007). The
lack of parental involvement, mixed with cynicism about education, work and money,
has created within Generation X an entrepreneurial spirit and a preference for
individuality in their work (Strauss & Howe, 1997). At work, they are often
characterized as having a high level of education, high job expectations, a lack of
organizational loyalty, a belief in life balance, a global perspective, and a strong
technological influence. Among other perceived liabilities from workers in different
generations, they dislike authority, have distaste for rigid work requirements, are
impatient, lack people skills, and share a mistrust of institutions. Instead, they seek
freedom to be creative and to be their own boss. The key to managing these workers
is therefore giving them the resources they need to learn a job independently; they
will take the initiative to utilize different resources such as online training, and video
to increase their skills and knowledge (Zemke, 2000).
Generation Y
Generation Y or Millennials are frequently referred to as the millennium
generation. They are defined by digital media, a child-focused world, school

29
shootings, terrorist attacks, AIDS, and 9/11. Millennials are the first generation to
enter the workforce having grown up with information technology available at all
times and they are the most educated generation with more than half (54%) having
some kind of education—the highest of any of the cohorts. It is very common for
them to have grown up as children of divorced parents. They often came from
smaller households with parents who had the resources to give them more material
items and attention. These circumstances often resulted in a very scheduled and
sheltered life. Sometimes parents of this generation have been called “helicopter
parents” because of their excessive attention and the need to oversee every aspect of
their children lives (Glass, 2007).
Many perceive Generation Y as entitled when it comes to professional and
career-related matters (Pew Research Center, 2010). Their technological savvy ways
influence their work value system such that they believe they can work flexibly
anytime and anyplace, and that they should be evaluated on work productivity and not
how, where, or when they get it done. Their work ethic does not mandate ten-hour
days and they demand much in the way of a work/life balance. This may create some
friction among the other cohorts who have a different view of the workplace.
According to a survey conducted by Pew Research Center (2010), Millennials value
parenthood and marriage far above career and financial success. While they are
distrustful of organizations and hierarchy, they are more loyal to groups and bosses
than previous generations. They also have strong expectations of their bosses and
managers when it comes to mentoring and helping them to meet professional goals.

30
While they may want long-term relationships with employers, they want it on their
own terms. They have experienced a “real revolution” decrease in career ambition in
favor of more family time, less travel, and less professional pressure. They thrive in a
collaborative work environment and want to enhance their work skills by continuing
their education. Additionally, millennials demand more information and
communication with employers regarding their specific needs (Hankin, 2004;
Terjesen, Vinnicombe, & Freeman, 2007).
In order to successfully manage and lead the blended workforce, leaders must
understand all generations to maximize their potential while comprehending that they
each define work and work/life balance differently. One generation may define it as
working longer hours to achieve a goal, while another might define it as leveraging
technology to be more efficient while still delivering on the same goal (Zemke,
2000). Furthermore, the differences between the generations can create
misunderstandings that might result in workplace conflict (Strauss & Howe, 1991)
since views and values tend to differ among the generational cohorts. According to
Zemke et al. (2000), each cohort is driven by a combination of varying perspectives,
personal ethics, and management styles. Organizations that do not invest in
understanding and leveraging the strengths and differences of each generation will
see a negative impact on employees. Employees are unlikely to embrace
opportunities to learn and enhance skills from each other if it is not a priority for the
leadership team. As a consequence, it may be argued that this impacts employee’s
engagement.

31
To summarize, employing a multigenerational workforce can be very
beneficial to companies since each generation brings different skills and talents to the
organization. Historians, sociologists, and, as noted, educators, have assigned an
assortment of names for each of the four generations: Traditionalist, also known as
Veterans, born between 1922 and 1945; Baby Boomers, born between 1946 and
1964; Generation X known as Gen Xers, born between 1965 and 1983; and
Generation Y, also known as Millennial, born between 1984 and 2002. While the
literature shows that there are many challenges associated with effectively managing
a multigenerational workforce including, for example, the differences in work ethic
and the way employees manage change, members of different generations can have
different ideas about how work is done. Studies show that Baby Boomers have a
positive work ethic, especially as it relates to strength as team players and mentors.
In contrast, Generation Xer’s seek freedom to be creative and even to be their own
bosses. On the other hand, Generation Y’s work ethic does not mandate ten-hour
days and they demand much in the way of a work/life balance. As such, they seek
long-term relationships with their employers, on their own terms. In light of the
foregoing, it may be postulated that each cohort is driven by a combination of varying
perspectives, personal ethics, and management styles; if organizations that do not
invest in understanding and leveraging these variations in strengths and differences,
this may have a negative impact on employee engagement. Therefore, the next
section will discuss diversity as it relates to workplace and employee engagement.

32
Workplace and Employee Engagement
Research shows that work engagement is credited with having a positive
effect on business outcomes and that employees are an asset to an organization
(Artur, 1994; Becker & Huslid, 2000). Therefore, using the organization’s
intellectual capital has become an even greater source of competitive advantage. The
most widely-used definition of intellectual capital is, “knowledge that is of value to
an organization” (Buckingham & Vosburgh, 2001). It essentially represents the value
of an organization’s skills sets and their competitiveness as an enterprise.
Organizations have recently begun analyzing employee engagement as it relates to
motivation and performance (Gallup). When evaluating the factors that contribute to
employee engagement, it is important to consider whether or not the same techniques
work for employees from different generations, especially to attract and retain highly
skilled employees. It is even more critical today for employers to understand and
adjust the training, development and work-life needs of a diverse workforce, and to
work together effectively to remain competitive in the global marketplace. Despite
capturing the attention of management and human resources professionals, one of the
first challenges presented by the literature is the lack of a universal definition of
employee engagement. Several definitions exist, most from a practitioner’s point of
view. Most scholarly definitions of employee engagement are centered on the
emotions, behaviors, and cognitive elements. Despite these various definitions, for
the purpose of this study, engagement will be defined as a positive, fulfilling work-
related state of mind characterized by vigor, dedication, and absorption (Schaufeli,

33
Salanova, Gonzalez-Romá, & Bakker, 2002). In other words, engagement is a
positive state of being when completing duties at work.
Workplace engagement and its definitions and uses are very similar to another
highly used term, employee engagement. Workplace engagement is defined as
lowering a worker’s burnout level through increased, employee’s efforts, dedication
to one’s job, and the organization and absorption of the employee’s job task
(Schaufeli & Bakker, 2003). Employee engagement refers to an individual’s feelings
and attitude towards their job and is defined by employee characteristics such as job
satisfaction, motivation, and work commitment (Chat-Uthai, 2013). Given the
comparable definition of work engagement and employee engagement, the
terminology, findings, benefits, and recommendations will be considered synonyms
for the purposes of this research.
Research on work engagement has developed in a relatively sequential
manner, which includes personal engagement, burnout/engagement, work
engagement, and employee engagement. Kahn (1990) first discussed engagement
theory from a human resources context, where he introduced the concepts of personal
engagement and personal disengagement. Kahn went on to establish a theoretical
framework to understand when, why, and to what degree individuals invest
themselves in their work performance. He explored engagement and disengagement
between two groups of workers in a qualitative study using grounded theory and
defined employee engagement as “the harnessing of organization members’ selves to
their work roles; in engagement, people employ and express themselves physically,
34
cognitively, and emotionally during role performances” (p.694). According to Kahn,
engagement implies being psychologically as well as physically present when
occupying and performing an organizational role. Conversely, personal
disengagement is the separation of the self from one’s role and is exhibited by a lack
of physical involvement, cognitive vigilance, and emotional investment. The
cognitive aspect of employee engagement represents employees’ beliefs about the
organization, its leaders, and the working conditions; the emotional aspect represents
how employees feel about each of these three factors and whether they have positive
or negative attitudes toward the organization and its leaders; and the physical aspect
of employee engagement concerns the physical energies exerted by individuals to
accomplish their roles. Thus, Khan (1992, p.322), theorizes that when an individual
finds meaning, feels safe, and has the necessary external and internal resources to
fulfill their work role, he or she will be personally engaged and be “fully present.”
Only one study has been conducted to empirically test and build upon Kahn’s (1990)
model of engagement. May, Gilson, and Harter (2004) and Csikszentmihalyi (1990)
considered constructs of job involvement and flow to be more aligned with
engagement. Job involvement is defined as “a cognitive or belief state of
psychological identification” (Kanungo, 1982). This view differs from engagement
in that it is aligned more with how an individual applies him or herself while
performing work duties. By definition, job involvement is centered on the mental
state of mind, while engagement encompasses emotions and behaviors, and flow is
defined as the “holistic sensation that people feel when they act with total

35
involvement” (Csikszentmihalyi, 1975, p.136). May et al. (2004) found that there are
three psychological conditions related to engagement or disengagement at work:
meaningfulness, safety, and availability. Overall, while all three psychological
components result in significant positive engagement, meaningfulness is found to
have the strongest relation to different employee outcomes because it mediates the
effects of job enrichment and work role fit. Therefore, implementing strategies that
focus on increasing job involvement can contribute to enhancing organizational
effectiveness and efficiency, which can lead to employees being more engaged in
their work due to a more meaningful and fulfilling experience.
An alternative model of engagement is found in literature on “burnout,”
wherein the opposite concept involves an erosion of engagement in one’s job
(Maslach, Schaufelli, & Leiter, 2001). According to Maslach et al. (2001), a decrease
in the following six specific areas leads to engagement or burnout: sustainable
workload, feelings of choice and control, appropriate recognition and reward, a
supportive work community, fairness and justice, and meaningful and valued work.
Engagement, conversely, is expected to mediate the link between these six work-life
factors and various work outcomes. Additionally, the findings of May et al. (2004)
support that of Maslach et al. (2001regarding the notion of meaningful and valued
work as associated with engagement. An important distinction between engagement
and burnout is that the latter relates specifically to job demands. Engagement, on the
other hand, is indicated by job resources such as job control, the availability of
learning opportunities, access to necessary materials, participation in the decision-

36
making process, positive reinforcement, and support from colleagues (Freeney &
Tiernan, 2006).
Recognizing that engagement and burnout are experienced as opposite
psychological states, Schaufeli et al. (2002) suggested that an employee who
experiences low burnout may not be experiencing high engagement. For the purposes
of this dissertation, engagement is a key component in understanding the relationship
between generational cohorts, employee engagement, and job satisfaction. The
definition of engagement will be aligned with Schaufeli et al. (2002) who defined it
as “a positive fulfilling, work-related state of mind characterized by vigor, dedication
and absorption,” where vigor is energy, mental resilience, invested effort, and
persistence; dedication is the feeling of significance, enthusiasm, inspiration, pride,
and challenge; and absorption is being fully concentrated and happily engrossed in
work such that time passes quickly and one has a difficult time detaching from work
(p.74). According to the model, employees are highly engaged when they
demonstrate a passion for their work and are highly involved with being part of the
work. The study further indicates that engagement is not a momentary and specific
state but is “a more persistent and pervasive affective—a cognitive state that is not
focused on any particular object, event, individual or behavior.” (Schaufeli et al.,
2002, p. 702). As noted by Schaufeli and Bakker (2004), engaged employees are
likely to have a greater allegiance to their organization and are therefore less likely to
leave their jobs.
37
In summary, despite the lack of a universal definition of employee
engagement, organizations have recently begun analyzing employee engagement as it
relates to motivation and performance—specifically vigor, dedication, and
absorption. It has been postulated that employers need to understand and adjust the
training, development, and work-life needs of a diverse workforce in order to increase
productivity and retention. Additionally, theoretical frameworks were established to
understand when, why, and to what degree individuals invest themselves in their
work performance and it has been suggested that engagement implies being
psychologically as well as physically present when occupying and performing an
organizational role (Khan, 1990). Similarly, May, Gilson, and Harter (2004), and
Csikszentmihalyi (1990) considered job involvement to be aligned with engagement.
Therefore, it may be argued that implementing strategies that focus on increasing job
involvement lead to employees being more engaged in their work. By contrast, an
alternative model of engagement is found in the literature on “burnout,” wherein the
opposite concept involves an erosion of engagement in one’s job (Maslach,
Schaufelli, & Leiter, 2001). An important distinction, however, between engagement
and burnout is that the latter relates specifically to job demands. As such, an
employee who experiences low burnout may not necessarily be experiencing high
engagement. Therefore, the next section will examine employee engagement for a
historical perspective in order to understand better what makes an employee engaged
in their job.

38
Historical Overview
Although it has been acknowledged and accepted that employee engagement
is a multi-faceted construct, as previously suggested by Kahn (1990). Truss et al.
(2006) defined employee engagement simply as “passion for work,” a psychological
state that encompasses the three dimensions of engagement as discussed by Kahn.
“Passion for work” therefore captures the common theme that runs through all these
definitions.
Robinson, Perryman, and Hayday (2004) identified key behaviors associated
with employee engagement as: belief in the organization, desire to work to make
things better, understanding of the business context and the “bigger picture,” being
respectful of/and helpful to colleagues, willingness to “go the extra mile”, and
keeping up to date with developments in the field. Additionally, the research has
found that employee engagement is closely linked to feelings and perceptions about
being valued and involved. The key drivers of engagement have been identified as
effective leadership, two-way communication, high levels of internal co-operation, a
focus on employee development, a commitment to employee well-being and clear,
accessible human resources policies and practices to which managers at all levels
adhered.
A more recent model was developed by Saks (2006) to expand on the social
exchange theory, which suggests that employees will choose their level of
engagement based on what they receive in return from their organizations. Saks
(2006) suggested that neither the Kahn (1990) nor the Maslach et al.’s (2001)
39
engagement models addressed the psychological conditions or predecessors that were
necessary for engagement. As such, Saks (2006) went on to define employee
engagement as having two dimensions: job engagement and organization
engagement. Saks (2006) surveyed 102 employees in a variety of industries, and in
one study tested a model of antecedents and consequences of job and organizational
engagement. To measure the job and organization engagement constructs, Saks
developed two 6-item scales to assess an individual’s psychological presence in their
job and organization. Drawing conclusions from this empirical study, Saks found that
job characteristics and organizational support are predictors of job engagement, and
that organizational support is a significant predictor of organizational engagement
with procedural justice approaching significance.
To cite Saks (2006), a stronger theoretical explanation of employee
engagement can be found in Social Exchange Theory (SET). One of the key
principles of SET is that relationships evolve over time into trusting, loyal, and
mutual commitments as long as the parties abide by certain “rules of exchange” in
that the actions of one party lead to a response or actions of the other party
(Cropanzano & Mitchell, 2005). This exchange can be viewed as both financially
and socially economical. This view is consistent with Robinson et al.’s (2004)
description of engagement as a two-way relationship between employer and
employee. When individuals perceive receipt of organizational support, they are
more likely to return the gesture (Cropanzano & Mitchell, 2005). Thus, Saks further

40
argued that one way for individuals to repay their organizations is through their level
of engagement at work.
To summarize, employee engagement is a multi-faceted construct with a central
theme of “passion for work.” The literature shows that there are key behaviors
associated with employee engagement, which are closely linked to feelings and
perceptions about being valued and involved. Further studies suggested that
employees will choose their level of engagement based on what they receive in return
from their organizations. However, recent studies argue that past engagement models
(Kahn, 1990; Maslach et al., 2001) do not address the psychological conditions or
predecessors that are necessary for engagement. As such, employee engagement has
been defined as having two dimensions: job engagement and organization
engagement (Saks, 2006). This view is consistent with another by Robinson et al.
(2004), who defined engagement as a two-way relationship between employer and
employee—but what factors positively influenced this two-way relationship? Hence,
the next section will discuss motivational factors as it relates to employee
engagement.
Theoretical Framework
Using the context of motivation in the workplace, most studies focus on two
basic types of work values as they apply to engagement and motivation. They are
intrinsic or self-actualization values (e.g., extrinsic values: Maslow, 1943) or material
values (e.g., Herzberg, 1968).

41
Motivation
Motivation as it relates to the workforce provides a common thread across all
generations and may provide insight into the multi-generational challenge. Motivation
can be linked to job satisfaction, productivity and performance, as well as to the
decision factors employees use to remain committed to a job or leave an organization.
Understanding the differences in motivating factors among differing age groups can
aid employers in designing effective recruiting and retention strategies that more
successfully manage the challenges of a multi-generational workforce, while
maintaining and optimizing organizational performance and productivity (Parker et
al., 2003).
Maslow’s Hierarchy of Needs
The research for this study has been framed by and examines similarities and
differences between Maslow’s hierarchy of needs and Herzburg’s motivator-hygiene
theory and how they interact with engagement theory. The theories of Maslow and
Herzberg are relevant to organizational behavior specifically as it relates to employee
engagement within the generational cohort in the current workplace. Malsow’s needs
hierarchy is a set of five human goals ranging from physiological needs to self-
actualization. Maslow (1943) hypothesized that people are motivated by a hierarchy
of individual needs, suggesting that they are the primary drivers of human behavior
even though there is the assumption that these needs will never be completely
satisfied. When one need is fulfilled, a person seeks to fulfill the next one, and so on.
The theory suggests that an individual’s needs must be satisfied at the lower levels

42
before they progress to higher, more complex levels because once low-level needs are
satisfied, individuals are no longer motivated by them and need to move to the next
level of needs in order to find new motivations. Maslow categorized the needs in a
hierarchical model of five levels: physiological needs, safety needs, social needs,
esteem needs, and self-actualization needs. One of the limitations of Malsow’s
hierarchy is that it assumes a person can only be motivated by one predominant
category at a time (Maslow, 1943). Implementing Maslow’s theory in the workplace
would mean creating company cultures, policies, and reward and recognition
programs that address all levels of his hierarchical needs theory at any given time at
an individual level. See Figure 1.
Figure 1. Maslow’s hierarchy of needs.

43
Physiological needs are described as the basic needs for survival, food, water,
breathing, and sex. Within the workplace they can be described as salary and work
conditions. The second level in his hierarchy of needs motivation theory is safety
needs, which can be described as those needs related to the security of a person’s
body, employment, family, health, and property. In the workplace, safety needs could
include job security and feeling of a safe working environment. The third level is
social needs, which include the need for belonging, love, and affection. Employee
relationships, such as cooperative peers or a good boss at work, help fulfill this need
for acceptance and compassion. In the workplace, love and belonging are associated
with having a friend at work and research shows this improves employee productivity
and engagement (Rath, 2011). The fourth level, esteem, is the need for both self-
esteem and to feel esteem from others. This can be defined by positive self-image
and respect and recognition from others. In the workplace, it could include individual
employee recognition or being recognized for performing well while working on a
team (Rath, 2011). The last level is self-actualization, which is reached only after all
other needs are met. This can be described as someone doing what they believe they
were destined to be doing. In the workplace, this is can be hard to achieve; but one
often knows and feels something is lacking. According to this theory, organizations
can expect increased employee engagement as employees’ needs are met. Once all
the needs are met, full potential can be reached.
To validate Maslow’s theory, in a study conducted by Rath and Harter (2011),
it was found that increased employee engagement enhances work production and
44
satisfaction while allowing employees to feel better about their work and themselves.
The study suggests that organizations need to make their employees feel connected to
company goals and also that their work is contributing to the organization’s big
picture of success (Rath & Harter, 2011). This approach will help organizations
maximize their full potential in the marketplace. Additionally, Rath and Harter found
that measuring well-being provides a strong benchmark for determining the influence
organizations have on their customers and the communities they serve. Upon
completion of the research, five distinct statistical factors emerged, namely: (1) career
well-being focusing on how you occupy your time or simply liking what you do every
day; (2) social well-being, having strong relationships and love in your life; (3)
financial well-being, effectively managing your economic life; (4) physical well-
being, having good health and enough energy to get things done on a daily basis; and
(5) community well-being, the sense of engagement you have with the area where
you live. Furthermore, Rath and Harter (2011) also found that an employee with low
engagement and a low level of well-being will negatively impact selected group
performance; however, when managers and leaders invest in employee well-being,
they positively influence the organization’s overall growth in the process.
Herzburg’s Motivator-Hygiene Theory
While Maslow focused on needs and the relationship to motivation, Herzberg
performed a number of research studies on motivation and its relationship to job
satisfaction. Herzberg’s Hygiene Two Factors Theory (Herzberg, 1959) is an

45
extension of Maslow’s theory. His 1966 Motivation-Hygiene Theory is a two-factor
theory consisting of 10 work factors.
In contrast to Maslow, Herzberg (1966) identified five motivator or intrinsic
factors that contribute to internal growth and motivate the employee to high
performance and effort. These factors are directly related to the employee’s
relationship to their job. They include the work involved, achievement,
responsibility, recognition, and advancement. These motivating factors contribute to
one’s job satisfaction, thus creating a positive attitude and feeling towards work
(Herzberg, 1966). The five hygiene or extrinsic factors are derived from the actual
work environment and describe the relationship to the environment. These factors
have little effect on positive job attitudes and can create job dissatisfaction (Herzberg,
1966). They include feelings about supervision, salary, policy and administration,
interpersonal relationships, as well as working conditions.
The findings that led to the development of Herzberg's motivation theory
suggest that employee satisfaction is based on two sets of factors: motivators, which
when present, would lead to increased job satisfaction, and hygiene, if absent, would
create job dissatisfaction. Herzberg went on to conclude that job satisfiers and job
dissatisfiers are associated with job context. Hygiene factors cause demotivation and
refer to pay, work conditions, policies, administrative efficiency, style of supervision,
and relationships between employees. This resulted in labelling satisfiers as
motivators and dissatisfiers as hygiene factors. Therefore, it has been found that
factors related to work, such as recognition, increased responsibility, and

46
advancement are what make employees satisfied. As such, basic needs do not give
motivation but merely create a favorable work environment. Conversely, what makes
workers unhappy is how they are treated, not the content of what they do. Hence, it
may be argued that the absence of hygiene factors will decrease employee
engagement.
Thus, Herzberg’s theory provides a good framework for identifying the
factors, which affect job satisfaction. These factors, however, may not always pertain
to every situation; as such, one of the major disadvantages of Herzberg’s model is
that it is a generalization that may not be appropriately applied to all groups of
employees or individuals within an organization. What motivates one individual
might be a de-motivator for another. As an example, increased responsibility may
motivate one worker by building self-worth, while for a new mother it is transitioning
back to work, the added responsibility which may include longer working hours and
may be a demotivator due to a lack of work-life balance.
On the other hand, the primary advantage of Herzberg's theory is that it
provides practical solutions for organizations to help identify broader issues that need
to be addressed. The theory also recognizes the fact that motivation comes from
within the individual as opposed to any external factors. Herzberg believes that
organizations could motivate employees by adopting an inclusive culture, which
focus on improving the nature and content of the actual job through: (a) job
enlargement, where workers are given a greater variety of tasks to perform to make
the work more interesting; (b) job enrichment, where workers are given a wider range

47
of more complex and challenging tasks to give a greater sense of achievement; and
(c) empowerment by delegating more power to employees to make their own
decisions regarding their working lives.
In summary, there are some similarities and distinct differences between the
two theories. The Maslow hierarchy of needs impacts all work levels and
performance based on whether a person desires to meet unsatisfied individual needs.
Conversely, Herzberg’s motivation-hygiene theory has no hierarchy but is rather a
linear model of satisfaction-no satisfaction and dissatisfaction-no dissatisfaction.
Additionally, Maslow’s (1943) theory talks about the needs that must be fulfilled in
order to motivate a person, while Herzberg theory (1966) talks about the causes of
satisfaction and dissatisfaction. Furthermore, Maslow’s theory is based on the
concept of human needs and their satisfaction, while Herzberg’s theory is based on
the use of motivators. Moreover, Maslow states that fulfilling each stage is a
motivator; however, Herzberg agrees that fulfilling the hygiene stage only results in
an employee being in a neutral state and that satisfaction and motivation only come
from the 2nd stage (motivator). In terms of similarities, Herzberg's hygiene has the
same criteria as Maslow's physiological, safety, and belongingness needs as they
relate to the workplace and, specifically, to pay and work conditions. Herzberg’s
motivators and Maslow’s esteem and self-actualization are also similar as they relate
to work-- specifically recognition, achievement, and advancement. Hygiene factors
that can lead to dissatisfaction include company policies, supervision, the relationship
with one’s boss, work conditions, pay and relationships with peers (Herzberg, 1974).

48
Motivators leading to job satisfaction include achievement recognition, growth,
advancement/promotion, the job itself, and recognition. Hence, hygiene factors are
predominantly extrinsic factors, while motivators are the intrinsic factors to the
individual. Therefore, it may be argued that management must address both hygiene
factors and motivators since job enrichment is required for intrinsic motivation.
To summarize, motivation as it relates to the workforce provides a common
thread across all generations and may provide insight into the multi-generational
challenge since it is linked to job satisfaction, productivity and performance, as well
as to the decision factors employees use to remain committed to a job or leave an
organization. Thus, using the context of motivation in the workplace, most studies
focus on two basic types of work values as they apply to engagement and motivation:
intrinsic or self-actualization values (e.g., extrinsic values) (Maslow, 1943) or
material values (e.g., Herzberg, 1968). The research for this study was framed by and
examines similarities and differences between Maslow’s hierarchy of needs and
Herzburg’s motivator-hygiene theory and how they interact with engagement theory.
The theories of Maslow and Herzberg are relevant to organizational behavior
specifically as it relates to employee engagement within the generational cohort in the
current workplace. Malsow’s needs hierarchy is a set of five human goals:
physiological needs, safety needs, social needs, esteem needs, and self-actualization
needs. While Maslow focused on needs and the relationship to motivation, Herzberg
performed a number of research studies on motivation and its relationship to job
satisfaction. Herzberg’s Hygiene Two Factors Theory (1959) is an extension of

49
Maslow’s theory and it consists of 10 work factors. In contrast to Maslow, Herzberg
identified five motivator or intrinsic factors that contribute to internal growth and
motivate the employee to high performance and effort (Herzberg, 1966). These
factors are directly related to the employee’s relationship to their job and thus can be
used to measure employee engagement. Therefore, the next section will discuss
measuring employee engagement in multigenerational cohorts.
Measuring Employee Engagement
To measure employee engagement, this study will utilize the Utrecht Work
Engagement Scale (UWES), a self-reporting questionnaire. The Utrecht Work
Engagement Scale was first developed by researchers, Schaufeli and Bakker (2003).
They sought to examine the relationship between engagement and burnout; it was
perceived that engagement is the opposite of burnout. Schaufeli and Bakker codified
two versions of the UWES, a seventeen-item and a nine-item version confirming
validity, as well as a three-factor structure for each instrument. The Utrecht Work
Engagement Scale (UWES) has been designed to measure work engagement
according to three dimensions: vigor, dedication, and absorption. This refers to the
level of energy, involvement, and concentration of the employee towards his or her
job each of which are assessed by six, five, and six items respectively. To measure
engagement, this 17-item scale, known as UWES-17, is the most accepted instrument
in the literature to date, having been validated and utilized extensively in a number of
countries (Schaufeli, Bakker, & Salanova, 2004; Schaufeli, Bakker, & Salanova,
2006).

50
Macey and Schneider (2008) described the UWES as one of the few surveys
that measure employee engagement with validity and reliability. Each of the
elements of the questionnaire is measured based upon self-reporting on how
frequently the respondent reports feeling a specific characteristic at work. Vigor is
measured using six questions that refer to high levels of energy and resilience, the
willingness to invest effort, not being easily fatigued, and persistence in the face of
workplace difficulties. Employees who score high in the area of vigor exhibit
behaviors that include having high energy, a high passion for life and work, and a
sense of endurances when working (Schaufeli & Bakker, 2003). The six indicators
are: (1) at my work, I feel bursting with energy; (2) on my job, I feel strong and
vigorous; (3) when I get up in the morning, I feel like going to work; (4) I can
continue working for very long periods at a time; (5) at my job I am very resilient,
mentally; and (6) at my work I always persevere, even when things do not go well.
Dedication is measured by five questions that refer to developing a sense of
significance from work and a feeling of enthusiasm and pride in one’s work. These
questions also measure a feeling of being inspired and challenged by the work being
done. Employees who score high in the area of dedication identify strongly with their
work and find work meaningful, inspiring, and challenging. High scores in this area
apply to employees who feel enthusiastic about work and have a high level of pride in
what they are doing (Schaufeli & Bakker, 2003). The five indicators are: (1) I find
the work that I do full of meaning and purpose; (2) I am enthusiastic about my job;

51
(3) my job inspires me; (4) I am proud of the work I do; and (5) to me, my job is
challenging.
Absorption is measured using six questions that refer to being completely and
totally involved in work to a point that an employee has difficulty detaching from
work and time passes by quickly. Employees who score high in the area of
absorption are often immersed and have difficulty separating themselves from work.
Therefore, for this type of employee, time at work goes by very quickly; therefore,
things happening around them are not a priority at the time (Schaufeli & Bakker,
2003). The six indicators are: (1) time flies when I am working; (2) when I am
working, I forget everything else around me; (3) I feel happy when I am working
intensely; (4) I am immersed in my work; (5) I get carried away when I am working;
and (6) it is difficult to detach myself from my work.
This measure of engagement and motivation aligns with the satisfaction
theories of both Maslow and Herzberg based on research conducted regarding both
external and internal motivating factors, as well as employee engagement as it relates
to job satisfaction and performance. Each dimension is measured in the UWES based
upon how frequently the respondent reports feeling a specific characteristic at work.
Research findings indicate that there are consistently strong relationships between
increased job demands and burnout (Schaufeli and Bakker, 2003). Additionally, the
researchers found that the relationships were much weaker between job resources and
burnout and that there was an inverse relationship between engagement and turnover
intention.

52
Despite widespread use of the UWES-9, there is still a question raised
concerning its construct validity dimensionality. Mills, Culbertson, and Fullagar
(2012) compared and contrasted the scale’s development of both the original 17-item
UWES-17 and the recent shorter 9-item UWES, which they argued might be
methodologically flawed and, thus, they suggested possible ways to improve it.
Based on this research, the UWES-9 yielded some inconsistent results, which the
researchers attributed to either the nature of the sample or issues with Item 14 in the
absorption factor, “I get carried away when I am working.” Despite the findings,
Mills et al. (2012) stated that the UWES-9 could serve as a viable and perhaps even
preferable alternative to the longer UWES-17, as it is simpler and easier to follow as
well as delivers similar findings.
Similarly, De Bruin and Henn (2013) examined the validity of the UWES
instrument, specifically the measurement dimensionality and ultimately construct
validity of the UWES–9. They examined the instruments general factor saturation,
the effect of multidimensionality on the interpretation of the total score, and the
convergent and discriminant validity of its subscale. Their findings provide clear
empirical support for using the total score of the UWES–9 as suitable for research.
However, they do not recommend using three sub-scale scores or using them as
separate independent or separate dependent variables. Hence, the current study will
use the original theory of Schaufeli et al. (2002), which stated workplace engagement
growth is correlated with an increase of vigor, dedication, and absorption. Thus, the

53
assumption is that a lower work engagement level entails the reduction of one or
more of these items.
Likert Scales
A Likert scale is a psychometric response scale mainly used in questionnaires
to obtain participants level of agreement with a statement or set of statements. It is a
non-comparative scaling technique that only measures a single trait. Respondents are
asked to indicate their level of agreement to a given statement using an ordinal
number. Likert scales usually have five potential choices (strongly agree, agree,
neutral, disagree, strongly disagree) but can sometimes they go up to ten or more.
Each score can be measured individually or summed with a related question to create
a score for a group of statements. The final average score represents overall the level
of accomplishment or attitude toward the subject matter. One of the advantages of
the Likert Scales is that they do not expect a simple yes/no answer from the
respondent, but rather allow for degrees of opinion and even no opinion at all. This
allows for quantitative data collection and easier analysis of a specific topic. One of
the drawbacks of this type of assessment methodology is there can be some limitation
in the level of honesty when people realize that their attitudes are being measured.
Therefore, for this study, the survey will align with Schaufeli et al.’s (2002) definition
of engagement. The survey will include six, five, and six items respectively for the
vigor, dedication and absorption variables.
To summarize, employee engagement is measured using (UWES), a self-
reporting questionnaire which has been designed to measure work engagement

54
according to the three dimensions: vigor, dedication, and absorption. The UWES also
aligns with the satisfaction theories of both Maslow and Herzberg. Firstly, vigor is
measured using six questions that refer to high levels of energy and resilience, the
willingness to invest effort, not being easily fatigued, and persistence in the face of
workplace difficulties. Secondly, dedication is measured by five questions that refer
to developing a sense of significance from work and a feeling of enthusiasm and pride
in one’s work. Employees who score high in the area of vigor exhibit behaviors that
include having high energy, a high passion for life and work, and a sense of
endurances when working. Additionally, employees who score high in the area of
dedication identify strongly with their work and find work meaningful, inspiring and
challenging. Thirdly, absorption is measured using six questions that refer to being
completely and totally involved in work to a point that the employee has difficulty
detaching from work and time passes by quickly. Employees who score high in the
area of absorption are often immersed and have difficulty separating themselves from
work. Additionally, the study will employ the use of Likert scales, a psychometric
response scale mainly used in questionnaires to obtain participants level of agreement
with a statement or set of statements, to administer the UWES questionnaire,
Conclusion
The workplace is complex and changing. A review of the literature has
revealed the manner in which employee engagement has been conceptualized in
many different ways. Employee engagement constructs associate engagement with
high energy and absorption in the work done (Kahn, 1990; Macey & Schneider, 2008;

55
May et al., 2004; Saks, 2006; Schaufeli et al., 2002). Although the models include
some variations, they rely on antecedents for employee engagement. When
comparing the noted models, there are apparent similarities and differences. Although
there is no single agreed upon definition, engagement is defined as a multi-faceted
construct. All models propose that employee engagement is a valid construct that is
important in explaining employee behavior in the workplace. The existence of
different definitions creates challenges in understanding the current state of
knowledge of employee engagement as each study examines it under a different
protocol, using different measures of engagement under different circumstances. In
any case, research models assert that the work environment affects employee
engagement and that it will have certain consequences for the employee and the
organization, such as worker loyalty, an organization that is competitive in the
marketplace and employee intellectual capital.
Therefore, given the unique characteristics of each generational group, the
study seeks to fill the gaps in the literature by providing additional knowledge of
engagement in current work force settings among different generations in order to
identify its predictors and consequences. Research indicates that by better
understanding engagement, new strategies may be developed that may increase levels
of employee engagement, thereby possibly decreasing the costly negative effects of
disengagement. As such, this research will be grounded on the generational cohort
theory, which states that adults have core values shaped by the historic and social
aspects of the society they experience at critical developmental stages throughout
56
their childhood (Kupperschmidt, 2000). Furthermore, this research will be grounded
theoretically on the engagement theory as defined by Khan (1990) and further
developed by Schaufeli and Baker (2004), Maslow’s (1943) Hierarchy of Needs, and
Herzberg’s (1959) Motivation-Hygiene Theory. The research for this study will
examine the similarities and differences between Maslow’s hierarchy of needs and
Herzburg’s motivator-hygiene theory and how they interact with engagement theory
as originally researched by Khan and further developed by Schaufeli et al. (2002),
with a specific focus on employee vigor, dedication, and absorption. Specifically,
this study will examine how these theories relate to employee engagement within the
generational cohorts currently in the workforce.

57
CHAPTER 3
METHODOLOGY
The purpose of this current study was to examine the similarities and
differences regarding the perceptions of workplace engagement among the four
generations of the current workforce. The goal was to provide organizations with a
framework to create a workplace culture where all individuals feel respected, valued,
engaged, and appreciated for who they are and what they have contributed. Although
employee engagement has been the subject of many studies, further research—
including four generations and the use of a larger diverse sample population—is
necessary to fill the gap in the literature associated with the challenges of engaging a
multigenerational workforce in order to better understanding how to attract, develop,
and retain valuable employees. Therefore, the scope of this chapter is to discuss the:
(a) research design; (b) population and sample; (c) instrumentation, as well as its
validity and reliability; (d) data collection procedures; and (e) data analyses
procedures.
Research Design
The study employed the use of a quantitative descriptive correlational design
to collect data regarding the perceptions of workplace engagement among the four
generations of the current workforce. According to Creswell (2005), quantitative
research is most appropriate when variables are identified and easy to measure.
Therefore, a quantitative approach is appropriate since the goal of the study is to
identify and explain any relationship between the stated variables. Additionally,

58
quantitative research outcomes are intended to describe and explain the relationship
between variables, as well as the magnitude of the specific phenomena as it relates to
the influence of one variable over another. Creswell (2005) further noted that
correlational designs are appropriate to determine the possible relationship between
the independent and dependent variables.
A quantitative methodology involved the empirical analysis of data that has
been collected from a sample of people from a specific population, with the aim of
making generalizable observations of the population based on the measure of
relationships (Creswell, 2005). Therefore, to cite Creswell, “quantitative research is
based on theories, when the researcher asks specific, narrow questions to test his or
her hypotheses” (p. 46) and it provides explanations of the variables being studied.
Thus, Creswell (2003) associates quantitative approaches with “post positivist claims
for developing knowledge” (p.18), whereby the researcher obtains statistical data
from the data obtained with “predetermined instruments.”
In contrast, qualitative research seeks to answer the “how” and “why”
opposed to “how often” and “how many.” Therefore, qualitative research is
concerned with opinions, feelings, and experiences and is aimed at describing social
phenomena as they occur naturally, that is, no attempt is made to manipulate the
situation, as is the case in quantitative research (Creswell, 2003). Additionally,
qualitative studies are also more difficult to replicate accurately at large, have
complex scales, thus leading to the possibility of less concrete conclusions being
rendered in terms of hypothesis testing and building a solid theory (Lim, 1995;

59
Sackman, 1991). Hence, Creswell (2005) proposed that quantitative methods are
most appropriate for testing theories and hypotheses.
Although the value of qualitative approaches in examining and analyzing case
studies has been widely demonstrated, there are limitations to this approach as far as
the scope of sampling. These limitations would hinder the researcher’s effort to
capture an actual representation as opposed to a projected representation of
generational cohorts in the current workforce. Therefore, qualitative designs are
appropriate when answering broad questions and when little is known about a
phenomenon (Newman, 2003), which is not the case for the problem under study.
Therefore, a quantitative method was deemed suitable because of the comparative and
descriptive nature of the research questions, while minimizing researcher personal
biases.
There are four main types of quantitative research designs: descriptive,
correlational, quasi-experimental, and experimental (Creswell, 2005). This study
employed the use of a correlational research design since the study was specific and
narrow in scope. Creswell (2005) explained that “correlational research designs
involve the use of statistical tests to define the degree of relationships between two or
more variables” (p. 52) and that the goal of a correlational study is to determine
whether a predictive relationship exists between the variables (Ellis & Levy, 2009).
Furthermore, according to Vogt (2009), correlation does not equate to causation. Vogt
went on to attribute this to the fact that correlational research design approaches
provide weak or partial evidence about causation and that variables that are strongly

60
linked causally may not be strongly correlated, and vice versa. Thus, for the purposes
of this study, a correlational research design was most appropriate since it provided
the researcher with a framework for studying any possible relationship between
perceived differences between generation cohorts and workplace engagement
(Salkind, 2006).
The quantitative, correlational method was also compared to the qualitative
designs such as phenomenology, ethnography, case study, grounded theory, and
historical research in order to determine the best research approach. These research
designs are subjective, which allows the researcher to collect data from sources that
are non-numerical and as such are subjected to possible researcher bias (Johnson &
Christensen, 2008). Therefore, a qualitative research design was not appropriate for
the scope of this research study due to possible researcher biases. To cite Johnson and
Christensen (2008), a correlational research design is “a form of nonexperimental
research in which the primary independent variable of interest is a quantitative
variable” (p. 44) since this design is not subjective and is based on the collection of
numeric data; thus, any possible researcher biases will be eliminated. Therefore, a
correlational research design was decided as the most appropriate for this study.
Additionally, correlational designs can be exploratory or predictive and are
appropriate for use when determining whether any relationship exists between
variables without claiming causality (Creswell, 2005). An explanatory correlational
research design is appropriate to determine the degree of covariance between two
variables and the characteristics of such research which includes: (a) the researcher is

61
interested in correlating two or more variables; (b) data collection occurs at one point
in time; (c) data collection consists of information from a single group of participants
for each variable; (d) data analysis involves correlation statistical tests; and (e)
conclusions are the results of the statistical tests. Conversely, prediction correlational
designs are appropriate when a researcher wants to predict how the outcome of one
variable is altered upon variation of the predictors or independent variables. It is
usually the case that a prediction equation is employed, which identifies the degree
and direction of the variables (Creswell, 2005). Thus, since this study sought to test
hypotheses that correlate workplace engagement and the five motivation sources, as
well as did not attempt to control or manipulate the variables, a deductive approach
was deemed necessary to answer the main research questions originally formulated.
Furthermore, since the present study was not intended to measure causality, utilizing
an exploratory correlational design was most appropriate to measure the degree of
relationship between the motivational sources and the level of engagement. The
research questions were formulated and supported by hypotheses predicting a
relationship between work engagement and each of the motivation sources.
Population and Sample
A population is a group of individuals who share characteristics that make
them unique from other groups (Creswell, 2005). The population for this study
included working professional who lived in the United States in entry level, mid- and
senior-level management working in different business sectors such as Sales,
Marketing, IT, HR, Consumer Packaged Goods (CPG), and not-for-profit at the time

62
of the study. Individuals of all races and ethnicities were randomly recruited for the
study via LinkedIn group: a sample frame of the large LinkedIn groups with a
combined total of approximately 23,000 working professionals was solicited to
participate in the survey. The sample include members of the different cohorts
represented in today’s workforce: Traditionalist also known as Veterans, born
between 1922 and 1945; Baby Boomers, born between 1946 and 1964; Generation X
also known as Gen Xers, born between 1965 and 1983; and Generation Y also known
as Millennial, born between 1984 and 2002. Even though four generations are
represented in today’s workforce, due to the low numbers Traditionalists (now 70-91
years old), were not be included. This study will therefore focus on three cohorts:
Baby Boomer, Gen Y, and Gen X.
Individuals born between 1946 and 1964 are considered Baby Boomers. In
contrast to the recent generations, they value management more than any other
generation. As such, managers should involve them in the planning process to gain
buy in and avoid problems that may arise (Zemke et al., 2000). Boomers currently
hold many of the executive level positions in corporate America. They are known as
workaholics, often putting their jobs before their families (Strauss & Howe, 1997).
While this generation has had a major influence on the American workforce, they are
beginning to enter retirement.
Generation X is comprised of individuals born between 1965 and 1983. Gen
X’ers are competent with technology and comfortable with diversity. They are
adaptable to change and able to multi-task and work effectively in the face of

63
competition (Kupperschmidt, 2000). Many members of this generation have been
greatly influenced by the experience of their parents being laid off and for that reason,
they can be cynical and untrusting (Kupperschmidt, 2000). Generation X has brought
about a more informal workplace. They strive harder for a work-life balance than
their Boomer counterparts, preferring to distance themselves from their jobs on
weekends rather than using personal time to put in the extra hours (Howe & Strauss,
1993).
Generation Y are individuals born between the period 1984 to 2002. They are
frequently referred to as the Millennium generation. Digital media, a child-focused
world, school shootings, terrorist attacks, AIDS, and 9/11 define them. Millennials
are the first generation to enter the workforce having grown up with information
technology available at all times and are the most educated generation with more than
half (54%) having some kind of education—the highest of any of the cohorts. Many
perceive Generation Y as entitled when it comes to professional and career-related
matters (Pew Research Center, 2010). Their technological savvy influences their
work value system, such that they believe they can work flexibly anytime and
anyplace and that they should be evaluated on work productivity--not how, where, or
when they get it done. Their work ethic does not mandate ten-hour days and they
demand much in the way of work/life balance.
By sourcing a larger population and using random sampling within the
database, it was felt that an adequate response rate would better support

64
generalization and ensure representation from all four generations. To cite Robson
(2002), “the larger the sample, the lower the likely error in generalizing” (p. 261).
Data Instrumentation
This study employed the use of two main instruments to measure the
correlation between work engagement and motivational sources. Firstly, the
Motivation Sources Inventory survey instrument (MSI) as developed by Barbuto and
Scholl (1998) was used to measure each participant’s motivation sources. The
theoretical concept of Motivation Sources Inventory suggests five sub-scales with a
pre-defined number of unique loading items per sub-scale that seems to capture the
domains of interest for each source of motivation (Barbuto & Scholl,1998). This
approach is appropriate for this study because it recognizes that each source of
motivation exists in various proportions in each employee, but in varying degrees.
This is important because no person is motivated exclusively by just one source of
motivation, and everybody has a different weighting between intrinsic and extrinsic
motives. The first publication in 1998 was based on testing 60 items, namely 12
questions assigned to each Source of Motivation.
According to the MSI, there are five sources of individual motivation:
intrinsic process, instrumental, internal self-concept, external self-concept, and goal
internalization. Barbuto and Scholl (1998) confirmed the validity of the MSI by
using a sample of 156 upper level undergraduate students. Measuring the internal
consistencies of each sub-scale confirms the reliability of the instrument via
Cronbach’s coefficient. The main findings of this investigation are a relatively high

65
validity and reliability of the measure. Measuring internal consistencies of each
subscale confirms the reliability of the instrument. Cronbach’s coefficient for each
sub-scale varies between .88 and .92; a LISREL maximum likelihood confirmatory
factor analysis produced a goodness of fit of .92 (Barbuto & Scholl, 1998, p. 1017).
Both statistics indicate that the 30-item model is adequate to measure the five sources
of motivation (Barbuto & Scholl, 1998). Barbuto (2001) proposed that “using ratio
analysis for each of the five sub-scales will . . . produce stronger results than simple
summated scored for each sub-scale” (p. 386) and he made a recommendation to
“incorporate these ratios in further studies to assess divergent and convergent validity
across samples” (p. 386). Additionally, the Motivation Sources Inventory model and
the developed scales can be used for empirical inquiries. The MSI was selected over
other instruments as it contains a more comprehensive model of motivation.
Authorization to use the MSI scale is shown in Appendix E. According to the
MSI instrument, five sources of individual motivation exist: intrinsic process,
instrumental, internal self-concept, external self-concept, and goal internalization.
The MSI was selected over other instruments as it contains a more comprehensive
model of motivation. Other instruments focus on only one aspect of motivation, for
instance the JD-R model. In the MSI section of the questionnaire, participants
indicated the extent of their agreement with each item using a Likert-type scale
ranging from 1 (strongly disagree) to 6 (strongly agree). This instrument was selected
to measure the sources of employee motivation that can be related to factors affecting
employee engagement based on validity.

66
Secondly, the UWES-9 developed by Schaufeli, Bakker, and Salanova (2006),
based on the original 17-item UWES (Schaufeli & Bakker, 2003), was used to
measure work engagement. Authorization to use the UWES-9 scale is shown in
Appendix D. The UWES-9 was selected for this study because it has been
extensively used across countries to measure workplace engagement; hence its
validity. UWES-9 entails measuring three scales as follows: vigor, dedication, and
absorption. Participants were asked to rate each statement using a Likert-type scale to
indicate how often they have experienced the stated feeling. The scale ranges from 0
(never) to 6 (every day/always). From Schaufeli, Salanova, Gonzalez-Roma, and
Bakker’s (2002) definition that employee engagement is characterized by vigor,
dedication and absorption, the survey included six, five, and six items respectively for
the vigor, dedication, and absorption variables. Therefore, the instrument’s
quantitative results are valuable for determining employee engagement and
satisfaction within the organization.
Vigor was measured using six questions that refer to high levels of energy and
resilience, the willingness to invest effort, not being easily fatigued, and persistence
in the face of workplace difficulties. According to Schaufeli and Bakker (2003),
employees who scored high in the area of vigor exhibit behavior that includes having
high energy, a high passion for life and work, and a sense of endurances when
working. The six indicators are:
1. At my work, I feel bursting with energy.
2. On my job, I feel strong and vigorous.

67
3. When I get up in the morning, I feel like going to work.
4. I can continue working for very long periods at a time.
5. At my job, I am very resilient mentally.
6. At my work, I always persevere, even when things do not go well.
Dedication was measured on the basis of five questions that refer to
developing a sense of significance from work and a feeling of enthusiasm and pride in
one’s work. These questions also measured a feeling of being inspired and
challenged by the work being done. Employees who scored high in the area of
dedication identify strongly with their work and find work to be meaningful, inspiring
and challenging. High scores in this area identify employees who feel enthusiastic
and have a high level of pride in the work they are doing (Schaufeli & Bakker, 2003).
The five indicators are:
1. I find the work that I do full of meaning and purpose.
2. I am enthusiastic about my job.
3. My job inspires me.
4. I am proud of the work I do.
5. To me, my job is challenging.
Absorption was measured using six questions that refer to being completely
and totally involved in work to a point where an employee has difficulty detaching
from work and time passes quickly. Employees who scored high in the area of
absorption are often immersed and have difficulty separating themselves from work.
For this type of employee, time at work passes very quickly; therefore, the things

68
happening around them are not a priority at the time (Schaufeli & Bakker, 2003).
The six indicators are:
1. Time flies when I’m working.
2. When I am working, I forget everything else around me.
3. I feel happy when I am working intensely.
4. I am immersed in my work.
5. I get carried away when I’m working.
6. It is difficult to detach myself from my work.
The concept that represents the dependent variables in this study is
engagement, while the independent variable is the generational cohort. The study
does not address other factors that may influence differences, such as geography or
industry, nor serves as a longitudinal study on the implementation of engagement
programs. As such, the researcher does not intend to provide solutions, but rather to
further the study of this topic and validate existing perceptions. Thus, additional
measurements used in the research are inclusive of: (a) scholarly review of leadership
and psychology research journals that provide relevant findings and insight on the
subject, as well as indicated areas of further research; and (b) a review of existing
data on employee job satisfaction levels versus engagement and perception.
Data Analysis Plan
Research Question and Hypotheses
The researcher will examine the following questions in this current study:

69
RQ1: To what extent is there a difference in the various levels of work
engagement (vigor, dedication, and absorption) across generational cohorts in the
workplace?
The hypotheses related to the first research question were as follows:
H1a: There is a significant difference in the work engagement element of vigor
across generational cohorts.
H1b: There is a significant difference in the work engagement element of
dedication across generational cohorts.
H1c: There is a significant difference in the work engagement level of
absorption across generational cohorts.
RQ2: To what extent is there a difference in the various motivation drivers
(goal internalization, external self-concept, intrinsic process, internal self-concept,
and instrumental motivation) across general cohorts in the workplace?
The hypotheses related to the second research question are as follows:
H2a: There is a significant difference in goal internalization work motivation
across generational cohorts in the workplace.
H2b: There is a significant difference in external self-concept work motivation
across generational cohorts in the workplace.
H2c: There is a significant difference in intrinsic process work motivation
across generational cohorts in the workplace.
H2d: There is a significant difference in internal self-concept work motivation
across generational cohorts in the workplace.

70
H2e: There is a significant difference instrumental motivation across
generational cohorts in the workplace.
RQ3: To what extent is there a relationship between each motivation driver
(goal internalization, external self-concept, intrinsic process, internal self-concept,
and instrumental motivation) and overall work engagement?
The hypotheses associated with the third research question are as follows:
H3a: There is a significant relationship between goal internalization work
motivation and overall workplace engagement.
H3b: There is a significant relationship between external self-concept work
motivation and overall workplace engagement.
H3c: There is a significant relationship between intrinsic process work
motivation and overall workplace engagement.
H3d: There is a significant relationship between internal self-concept work
motivation and overall workplace engagement.
H3e: There is a significant relationship between instrumental motivation work
motivation and overall workplace engagement.
Statistical Tests
Research questions 1 and 2 and the related hypotheses were tested with eight
one-way ANOVAs, one for each hypothesis. The independent variable is the
generational cohort with five levels. (See Appendix A.) Depending upon the
distribution of data, however, some categories had to be excluded. The dependent
variables were the various levels of work engagement (vigor, dedication, and

71
absorption) and the various motivation drivers (goal internalization, external self-
concept, intrinsic process, internal self-concept, and instrumental motivation).
Research question 3 was investigated with the Pearson r. The dependent variable was
overall work engagement. The independent variables were the various motivation
drivers (goal internalization, external self-concept, intrinsic process, internal self-
concept, and instrumental motivation). Table 1 provides the hypotheses, statistical
tests, and scales of measurement of the data.
Table 1
Hypotheses, Statistical Tests, and Scales of Measurement
Hypothesis Statistical
Test
Independent
Variable/Scale of
Measurement
Dependent
Variable/Scale of
Measurement
H1a: There is a significant
difference in the work
engagement element of
vigor across generational
cohorts.
One-Way
ANOVA
Generational
cohort/Nominal
Vigor/Interval
H1b: There is a significant
difference in the work
engagement element of
dedication across
generational cohorts.
One-Way
ANOVA
Generational
cohort/Nominal
Dedication/Interval
H1c: There is a significant
difference in the work
engagement level of
absorption across
generational cohorts.
One-Way
ANOVA
Generational
cohort/Nominal
Absorption/Interval
H2a: There is a significant One-Way Generational Goal

72
difference in goal
internalization work
motivation across
generational cohorts in
the workplace.
ANOVA cohort/Nominal internalization/Interval
H2b: There is a significant
difference in external
self-concept work
motivation across
generational cohorts in
the workplace.
One-Way
ANOVA
Generational
cohort/Nominal
External self-
concept/Interval
H2c: There is a significant
difference in intrinsic
process work motivation
across generational
cohorts in the workplace.
One-Way
ANOVA
Generational
cohort/Nominal
Intrinsic process/Interval
H2d: There is a significant
difference in internal
self-concept work
motivation across
generational cohorts in
the workplace.
One-Way
ANOVA
Generational
cohort/Nominal
Internal self-
concept/Interval
H2e: There is a significant
difference in
instrumental motivation
across generational
cohorts in the workplace.
One-Way
ANOVA
Generational
cohort/Nominal
Instrumental
motivation/Interval
H3a: There is a significant
relationship between goal
internalization work
motivation and overall
workplace engagement.
Pearson r Goal
internalization/Interval
Overall workplace
engagement/Interval

73
H3b: There is a significant
relationship between
external self-concept
work motivation and
overall workplace
engagement.
Pearson r External self-
concept/Interval
Overall workplace
engagement/Interval
H3c: There is a significant
relationship between
intrinsic process work
motivation and overall
workplace engagement.
Pearson r Intrinsic process/Interval Overall workplace
engagement/Interval
H3d: There is a significant
relationship between
internal self-concept
work motivation and
overall workplace
engagement.
Pearson r Internal self-
concept/Interval
Overall workplace
engagement/Interval
H3e: There is a significant
relationship between
instrumental motivation
work motivation and
overall workplace
engagement.
Pearson r Instrumental/Interval Overall workplace
engagement/Interval
Operationalization of Variables
Work engagement, which consisted of the subscales (vigor, dedication, and
absorption) were measured by Utrecht Work Engagement Scale (Schaufeli, 2009).

74
The various motivation drivers (goal internalization, external self-concept, intrinsic
process, internal self-concept, and instrumental motivation) were measured by the
Motivation Sources Inventory (Barbuto & Scholl, 1998). Generational cohorts were a
demographic variable with five levels as indicated in Appendix A. However,
depending on the distribution of data, some categories had to excluded.
Reliability and Validity
Regardless of the methodology design (qualitative, quantitative, or mixed
methods), the researcher had to produce results that are believable, accurate, and
useful (Creswell, 1998). Validity is the extent to which an instrument measures what
it is supposed to measure and performs as it is designed to perform. Validity is
generally measured in degrees and involves collecting and analyzing data to assess
the accuracy of an instrument. In this study, there were internal and external threats
to validity. Internal validity threats are associated with data collection procedures
(Creswell, 2009) and refer to the confidence that other alternative explanations are
unlikely for the findings. External validity, or generalizability, refers to the extent
that the findings will hold true for other settings and circumstances. Although content
validity is the weakest level of assessing internal validity, it is of great importance in
studies designed to ascertain individual attitudes (Creswell, 2009).
The validity of the UWES-9 was confirmed in a multinational study covering
10 countries, resulting in high correlation with the original UWES-17 scale
(Schaufeli, Bakker, & Salanova, 2006, p. 712). Correlation exceeded .90 in all
countries except in France (-.81, median .91). Correlation between the short 3-item

75
scale DE scale and the original 5-item scale exceeded .95 in all countries (median
.96). The correlations between the short version AB scale and the original 6-item
scale exceeded 0.90 except in Belgium (r = .85) and Spain (r = .89). Cronbach’s
coefficient was used to measure the internal consistency of the UWES-9. The
measure represents reliability. Cronbach’s alpha of the 3-item VI scale varied across
countries between .60 and .88. Internal consistency of the DE scale varied between
.75 and .90. The internal consistency of the AB scale varied between .66 and .86.
Cronbach’s alpha for the 9-item scale varied between .85 and .92 across all 10
countries. In only three cases was Cronbach’s alpha lower than .70.
Several studies have been completed to test the validity of the UWES. Mills,
Culbertson, and Fullagar (2012) completed a construct validation of the UWES
(Schaufeli et al., 2002) and UWES-17 (Schaufeli et al., 2006). They found that it has
been a proven analytical tool. The UWES-17 instrument was based on the three work
engagement characteristics—vigor, absorption, and dedication—which have been
consistently found to have high correlation resulting in criticism of the instrument.
As a result, the authors reduced vigor and absorption into one category, which
resulted in the development of the UWES-9 from the initial origin of the UWES-17
(Schaufeli et al., 2006, p. 701). The work engagement characteristics (vigor,
absorption, and dedication) were positively correlated and have been proven to be
consistent.
The MSI developed by Barbuto and Scholl (1998) was used to measure the
five sources of motivation correlated with work engagement. The MSI was selected
76
over other instruments as contains a more comprehensive model of motivation. Other
instruments focus on only one aspect of motivation, for instance the JD-R model.
According to the MSI, there are five sources of individual motivation: intrinsic
process, instrumental, internal self-concept, external self-concept, and goal
internalization. Barbuto and Scholl (2005) confirmed the validity of the MSI having
used a sample of 156 upper level undergraduate students. Measuring internal
consistencies of each subscale confirmed the reliability of the instrument. Cronbach’s
coefficient for each sub-scale varied between .88 and .92 (Barbuto & Scholl, 2005, p.
1017). Barbuto, Trout, and Brown (2004) noted that the Motivation Sources
Inventory has produced Cronbach's coefficient, α, ranging from .60 to .93 for
populations from urban business, health care and social service workers, education
professionals and college students as well as from .69 to .81 measuring the five
sources of motivation for a sample of 168 agricultural workers located in the
Midwestern United States. Furthermore, Barbuto and Scholl (2005) reported
Cronbach’s coefficients of .71 to .85 produced by the Motivation Sources Inventory
in measuring leaders’ sources of motivation.
Reliability Analysis
The reliability of the subscales for the sample was tested with Cronbach’s
alpha. For the five sources of motivation on the MSI, the internal consistency ranged
from .69 for internal process motivation to .80 for external self-concept motivation.
On the UWES, which measured work engagement, the internal consistency ranged

77
from .80 for absorption to .87 for vigor with an overall reliability of .93. The
minimum acceptable reliability is .70. Reliability coefficients are presented in Table
2.
Table 2
Reliability Coefficients
Subscale Cronbach’s alpha
Intrinsic Process Motivation .687
Instrumental Motivation .714
External Self-Concept Motivation .798
Internal Self-Concept Motivation .753
Goal Internalization Motivation .777
Vigor .867
Dedication .847
Absorption .802
Work Engagement .926
Data Collection
An online survey generated data pertaining to the variables in the current
study. Survey techniques are a common tool in quantitative research, making it
possible to ask numerous questions of many people in a short period (Neuman, 2005).

78
The data was collected through the use of two instruments combined into one survey
questionnaire. The first was the Motivation Sources Inventory (MSI) instrument
(Barbuto & Scholl, 1998), which asked participants to rate their level of motivation.
The second instrument used was the Utrecht Worker Engagement Survey (UWES)
(Schaufeli & Bakker, 2004), which requested that participants in the study rate their
level of work engagement. Engagement was measured using the shortened Utrecht
Work Engagement Scale (UWES) comprised of 17 items (Schaufeli & Bakker, 2003).
The survey consisted of questions using a 7-point Likert scale as the rating
mechanism and the process was executed online using Survey Monkey. Each of the
elements of the questionnaire was measured based upon self-reporting on how
frequently the respondent reports feeling a specific characteristic at work.
The data for this study were collected via the use of a survey. A survey is a
descriptive research method and is useful when a researcher wishes to collect data on
phenomena that cannot be directly observed. Survey research illustrates the
principles of correlational research because it provides an accurate and efficient
means for describing people's thoughts, opinions, and feelings. Survey research and
correlational research rely on surveys to sample many respondents who answer the
same questions (Neuman, 2005).
For this research study, an online survey was chosen for several reasons.
Online surveys can be easily distributed through email messages; participants can
efficiently be sent reminder email messages to participate; the cost of labor and
printed mailed surveys is reduced; easier data preparation as data can easily be

79
transferred to statistical software; and the bias of personal interviews or face-to-face
surveys can be avoided. The survey instruments used a Likert-type scale to gather
information about the specific variables. The Likert-type scale is a variation of a
summated rating scale allowing respondents to express a favorable or unfavorable
attitude toward the object of interest (Cooper & Schindler, 2006). Additionally,
Likert-type items can provide an ordinal measure of a person’s attitude (Neuman,
2005). These types of scales are usually built with four to eight categories.
The data collection process consisted of the recruitment of participants using
the LinkedIn Network of Executing Women, Managing a Multigenerational
Workforce and Philadelphia SHRM groups, and the Survey Monkey database based
on the inclusion criteria, introduction of the research study, a random sampling
method to obtain completed surveys and a signed electronic consent form. A sample
frame of the large LinkedIn groups with a combined total of approximately 23,000
working professionals was solicited to participate in the survey. By sourcing a larger
population and using a random sampling within the database, an adequate response
rate would better support generalization and ensure representation from all four
generation; “The larger the sample, the lower the likely error in generalizing”
(Robson, 2002, p. 261). The LinkedIn groups included all generational cohorts in the
population because of their size. This is important because of the focus of the
research questions posited here.
The UWES scale consisted of three (3) underlying factors: vigor, dedication,
and absorption. Participants were expected to be honest while responding to the

80
online questionnaire of approximately 43 questions, taking approximately 15 minutes.
The questionnaire consisted of demographic questions: sex, birth date range,
education, position job level, and industry along with the UWES-9, and the MSI scale
questionnaires. The UWES-9 questionnaire included nine questions to measure work
engagement. The MSI scale included six questions for each of the motivation
sources: intrinsic process motivation, instrumental motivation, external self-concept
motivation, internal self-concept, and goal internalization. There was no interaction
between the researcher and the participant unless the participant contacted researcher
to clarify concerns, questions, or discuss withdrawal procedures. The data were
analyzed after the participants completed the surveys to ensure that the measures were
free from error, there was no missing data in the completed surveys, and the study
results produced consistent results.
Data Analyses Procedures
The objective in quantitative correlational research is to use statistical
procedures to determine the strength of the relationship between two variables
(Creswell, 2005). Therefore, multiple regression analysis was used to test, analyze,
and predict the relational effect on the variables. The first part of the analysis
consisted of identifying differences in motivational sources and work engagement
levels (dependent variables) between generations (independent variables). These
differences, if any, would indicate whether generational shifting at the workplace has
had any effect on motivational sources and work engagement levels. The second part
of the analysis involved a correlational design that served to identify any relationship

81
between motivational sources (independent variable) and work engagement
(dependent variables). The survey results were downloaded from the SurveyMonkey
server into the researcher’s computer using Excel and then analyzed in Statistical
Package for the Social Sciences (SPSS). SPSS was appropriate for calculations that
were more complex. The reliability and validity of the study data were determined
using Cronbach’s alpha using the F-test to test the validity of the multiple regression
model. Additionally, SPSS was used to conduct the demographics and multiple
regression analyses.
To test hypothesis H1 and H2 and their sub-sets hypotheses, an Analysis of
Variance (ANOVA) was conducted to determine the relationship of the constructs in
the study. Cooper and Schindler (2003) described the ANOVA as a statistical method
that uses the variances of each population to define differences among means. One
assumption of the ANOVA is that the variances of the populations are the same.
Therefore, a test of equal variance was conducted prior to the analysis of the data.
ANOVA was conducted and after assumptions were met. The ANOVA statistic was
useful in determining if any of the descriptive variables like gender, years of
experience, and type of organization influence the relationship between perceived
generational differences and motivation. Partial correlations controlled for any
affects by the intervening variables like years of experience, role, gender, and type of
organization. Descriptive statistics were used to determine the mean, median, and
standard variation within variables. Inferential statistics aided with testing
hypotheses and determined the existence of relationships. Inferential statistics

82
offered a precise way to infer results from the sample to the population (Neuman,
2005).
The results of the ANOVA were in a table format. The p value in the table
denoted if the level means were significantly different from each other. To reject the
null hypothesis, the p value should be less than or equal to the α level selected. For
the purpose of the present study, the α level selected was .05. If a statistical
difference was found using ANOVA, Tukey’s multiple comparison test method was
used to compare the generations against each other. The result of Tukey’s test
involved the use of confidence intervals, which serve to determine whether two
means are different. If the interval contains zero, the difference between means is not
statistically significant. The p value can also be used to determine whether pairs of
means are different.
Correlational Analysis
The correlation coefficient measures how much two variables covary
(Neuman, 2005). As suggested by Creswell (2005), the Spearman rho (rs) correlation
coefficient can be useful for nonlinear data. The value r, also called rho, represents
the Pearson correlation coefficient; it is one of the most commonly used measures of
linear relationship between two variables. Partial correlation statistical analysis was
useful in determining the amount of variance explained by intervening variables. The
purpose of multiple regression statistics is to predict future values by examining
combined relationships of independent variables to predict a single dependent
variable. Multiple regression statistics is not the intent of the current study. The intent

83
of the study is to use the Pearson correlation to measure a linear relationship between
generational cohorts and workplace engagement.
Research Question and Hypotheses
The researcher will examine the following questions in this current study:
RQ1: How does the level of work engagement vary by generational cohorts in the
workplace?
a. How do age differences influence employee engagement?
b. How do generational differences influence employee engagement?
The hypotheses related to the first research question were as follows:
H1: Work engagement levels vary across generational cohorts.
H1a: Work engagement element of vigor varies across generational
cohorts.
H1b: Work engagement element of dedication varies across generational
cohorts.
H1c: Work engagement level of absorption varies across generational
cohorts.
RQ2: What are the motivation drivers predominant in each generational cohort?
The hypotheses related to the second research question were as follows:
H2a: Goal internalization work motivation varies across generational
cohort.
H2b: External self-concept work motivation varies across generational
cohort.

84
H2c: Intrinsic process work motivation varies across generational cohort.
H2d: Internal self-concept work motivation varies across generational
cohort.
H2e: Instrumental motivation varies across generational cohort.
RQ3: What is the relationship between each of the sources of motivation and work
engagement?
The hypotheses associated with the third research question are as follows:
H3a: There is a relationship between motivation and workplace
engagement.
H3b: There is a correlation between the overall level of employee
engagement and intrinsic and extrinsic work factors.
H33: There is no correlation between the overall level of employee
engagement and intrinsic and extrinsic work factors.
Ethical Considerations
The research design attended to matters of confidentiality, privacy, avoidance
of harm to participation, and informed consent. Cross-sectional designs do not
require the tracking of participants and this helps to ensure anonymity. There was no
need to keep lists of names or to match names to responses. The information
gathered was not threatening in nature; except for the initial demographic questions,
private information was not collected. Given the topic of the survey and the
anonymity provided, there was little risk of harm to participants in the study. This
study was not personally intrusive, called for no human experiments, and did not

85
create an environment that might result in physical or emotional harm. The survey
was conducted with full disclosure to the participants, who were required to give
informed consent before entering the online survey. As an additional precaution,
permission to conduct the study was obtained from the LinkedIn group administrators
and organization. The University’s Human Subjects Review Committee (HSRC)
approved the study.
Summary
This chapter includes details of the methodology selected for the present
study. A quantitative descriptive correlational cross-sectional research method was
designed to examine patterns and relationships between work engagement and
motivation sources across generations.

86
CHAPTER 4
RESULTS
The primary purpose of this study was to determine if and to what extent
significant differences exist between generational cohorts in the workforce relative to
work engagement and motivational sources. A secondary purpose of this study was to
determine if and to what extent relationships exist between work engagement and
motivational sources. The significance of this study lies in the fact that there are many
challenges associated with effectively managing the present day multigenerational
workforce. Given the demographic mix, it is important for any organization to
understand how to integrate and leverage what each cohort has to offer in order to
improve job satisfaction, productivity, performance, and retention. If a company has
a positive workplace engagement overall in the organization, it could deliver a
competitive advantage to the organization (Bakker, Schaufeli, Leiter, & Taris, 2008).
This study contributes to the field by adding to the present limited empirical research
data on generational differences in the workplace, as well as its impact on
employee/workplace engagement.
The data were collected through the use of two instruments combined into one
survey questionnaire. Instruments consisted of the Utrecht Work Engagement Scale
(UWES) and the Motivation Sources Inventory survey instrument (MSI). The UWES
is a 17-question survey Likert instrument used by researchers, leaders, and
organizations to measure the vigor, dedication, and absorption levels of employee
87
engagement conditions in the workplace (Schaufeli et al., 2006). The original
UWES-17 instrument was reduced from 17 questions to 9 questions to improve its
performance (Schaufeli et al., 2006). The MSI (1998) was used to measure each
participant’s motivation sources. According to the MSI, there are five sources of
individual motivation: intrinsic process, instrumental, internal self-concept, external
self-concept, and goal internalization. The MSI is also a Likert type instrument.
The survey was launched through SurveyMonkey®, a web-based data
collection tool. The data collection process consisted of the recruitment of
participants using the LinkedIn Network of Executing Women, Managing a
Multigenerational Workforce, the Philadelphia Society for Human Resource
Management (SHRM) groups, and the SurveyMonkey® database. After data
collection concluded, the survey responses were exported to Excel and subsequently
imported into SPSS for analysis.
Chapter 4 is organized by a discussion of the sample demographics, reliability
analysis, descriptive statistics and data screening, research questions/hypothesis
testing, and conclusions. Data were analyzed with SPSS 23 for Windows. The
following provides a discussion of the sample demographics.
Sample Demographics
The sample consisted of 185 participants; 60.5% (n = 112) were females and
39.5% (n = 73) were males. Specific ages ranged from 19 to 73 (M = 39.89, SD =
9.46). The Traditionalists, also known as the Veterans, are those workers born
between 1922 and 1945; the Baby Boomers were born between 1946 and 1964;

88
Generation X or Gen Xers, were born between 1965 and 1983; and Generation Y or
Millennials, were born between 1984 and 2002. The majority of participants (60%, n
= 111) were born between 1965 and 1982. Approximately 26% were born between
1983 and 1987; and 13% (n = 24) were born between 1946 and 1964. Year range of
birth is presented in Table 3
Table 3
Year Range of Birth
Year n=185 % Valid % Cumulative %
Born in 1943 or earlier 0.5 0.5 0.5
1946 – 1964 13.0 13.0 13.6
1965 – 1982 60.0 60.3 73.9
1983 – 1997 25.9 26.1 100.0
Regarding race, approximately half (51.4%, n = 95) were African American or
Black; 41.1% (n = 76) were White; and 4.3% (n = 8) were “other.” Two percent (n =
4) were of Hispanic or Latino origin. Race/ethnicity is presented in Table 4.
Table 4
Race/Ethnicity
Race %
Other 4.3
African American or Black 51.4
Hispanic or Latino origin 2.2
Asian 1.1
White 41.1
Note. Other = mixed races, Haitian or Kenyan.

89
Regarding highest level of education completed, 88.6% (n = 164) had
bachelor’s degrees or higher. Specifically, 41.6% (n = 77) had baccalaureates; 32.4%
(n = 60) had master’s degrees; and 11.9% (n = 22) had doctoral degrees. Educational
attainment is presented in Table 5.
Table 5
Educational Attainment
Educational Attainment %
Some college, no degree 7.6
Associates Degree; Technical School 3.8
Bachelor’s Degree 41.6
Master’s Degree 32.4
Professional school degree (MD, DDC, JD, etc) 2.7
Doctorate degree (PhD, EdD, etc) 11.9
In the sample of respondents, full-time employees (96.8%, n = 179)
outnumbered part-time employees (2.7%, n = 5), those who worked 20 hours a week
or less. One participant (0.5%) did not answer. Seven percent (n = 13) had worked in
their current positions of employment for more than 20 years; 41.1% (n = 76) had
worked in their positions 1-5 years; and 16.2% (n = 30) had worked in their positions
6-10 years. See Table 6.

90
Table 6
Years Working at Current Place of Employment
Years %
Less than 1 year 6.5
1 year - 5 years 41.3
6 years – 10 years 16.3
11 years – 15 years 14.7
16 years – 20 years 14.1
More than 20 years 7.1
Thirty-seven percent (n = 69) were not in a supervisor or leadership role;
18.4% (n = 34) were senior managers/directors; and 16.2% (n = 30) were first-level
supervisors, managers, or front-line managers. Nearly 4% (n = 7) were contract
employees or consultants and 5.4% (n = 10) were “other,” which consisted of
teachers, adjunct professors, school counselors, teacher assistants, etc. Current role at
job is presented in Table 7.
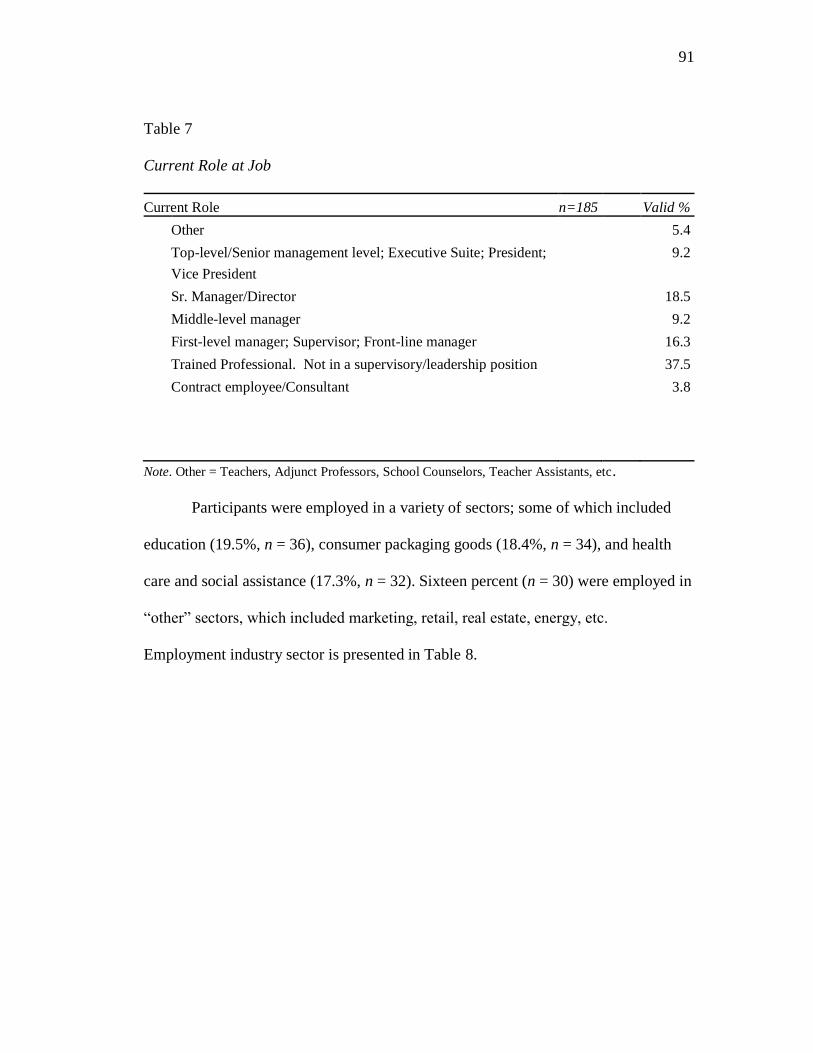
91
Table 7
Current Role at Job
Current Role n=185 Valid %
Other 5.4
Top-level/Senior management level; Executive Suite; President;
Vice President
9.2
Sr. Manager/Director 18.5
Middle-level manager 9.2
First-level manager; Supervisor; Front-line manager 16.3
Trained Professional. Not in a supervisory/leadership position 37.5
Contract employee/Consultant 3.8
Note. Other = Teachers, Adjunct Professors, School Counselors, Teacher Assistants, etc.
Participants were employed in a variety of sectors; some of which included
education (19.5%, n = 36), consumer packaging goods (18.4%, n = 34), and health
care and social assistance (17.3%, n = 32). Sixteen percent (n = 30) were employed in
“other” sectors, which included marketing, retail, real estate, energy, etc.
Employment industry sector is presented in Table 8.

92
Table 8
Employment Sector Industry
Sector n=185 %
Other 16.2
Financial Industry 9.7
Consumer Packaging Goods (CPG) 18.4
Education 19.5
Health Care and Social Assistance 17.3
Information Technology 5.4
Legal Services 0.5
Hospitality 2.2
Manufacturing and Product Development 3.8
Public Service; Government 7.0 Note. Other = Marketing, retail, real estate, energy, etc.
Forty percent (n = 74) of respondents learned about the survey from the
Managing a Multi-Generational workforce - Linked In Group, and about 40% (n =
73) learned about the survey from other sources, which included friends, Facebook,
co-workers, colleagues, the researcher, etc. The survey recruitment organization is
presented in Table 9.

93
Table 9
Survey Recruitment Organization
Organization n=185 %
Other 42.4
Network of Executive Women (NEW) 12.8
Managing a Multi-Generational workforce - Linked In Group 43.0
Philadelphia SHRM 1.7
Note. Other =, co-workers, colleagues, etc.
Table 10 provides a summary of the demographic variables.
Table 10
Summary of Demographic Variables
Variable n=185 %
Gender Male 39.5%
Female
60.5%
Year Range of Birth Born in 1943 or earlier 0.5%
1946 – 1964 13.0%
1965 – 1982 60.3%
1983 – 1997
26.1%
Race/Ethnicity Other 4.3%
African American or Black 51.4%
Hispanic or Latino origin 2.2%
Asian 1.1%
White
41.1%
Educational Attainment Some college, no degree 7.6%
Associates Degree; Technical School 3.8%
Bachelor’s Degree 41.6%
Master’s Degree 32.4%

94
Professional school degree (MD,
DDC, JD, etc)
2.7%
Doctorate degree (PhD, EdD, etc)
11.9%
Current Job Status Full-Time 97.3%
Part-time (20 hours or less per week)
2.7%
Years Working at Current Place
of Employment
Less than 1 year 6.5%
1 year - 5 years 41.3%
6 years – 10 years 16.3%
11 years – 15 years 14.7%
16 years – 20 years 14.1%
More than 20 years
7.1%
Current Role at Job Other 5.4%
Top-level/Senior management level;
Executive Suite; President; Vice
President
9.2%
Sr. Manager/Director 18.5%
Middle-level manager 9.2%
First-level manager; Supervisor;
Front-line manager
16.3%
Trained Professional. Not in a
supervisory/leadership position
37.5%
Contract employee/Consultant
3.8%
Employment Sector Industry Other 16.2%
Financial Industry 9.7%
Consumer Packaging Goods (CPG) 18.4%
Education 19.5%
Health Care and Social Assistance 17.3%
Information Technology 5.4%
Legal Services 0.5%
Hospitality 2.2%
Manufacturing and Product
Development
3.8%
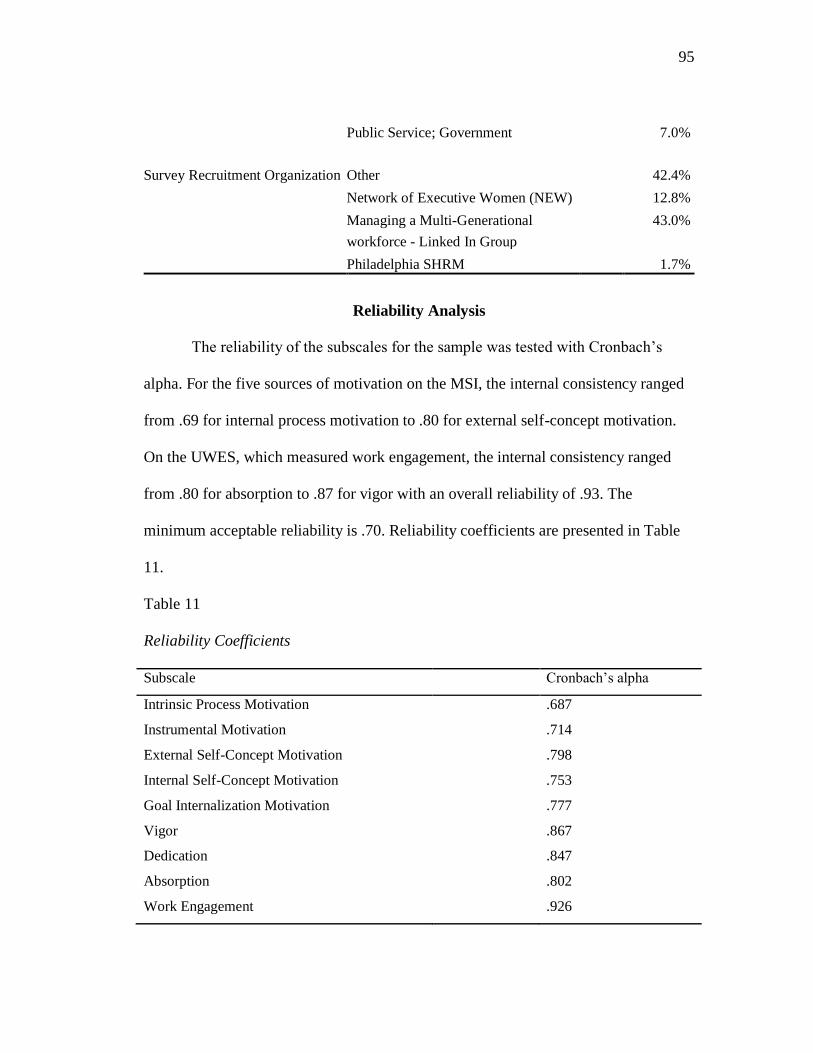
95
Public Service; Government
7.0%
Survey Recruitment Organization Other 42.4%
Network of Executive Women (NEW) 12.8%
Managing a Multi-Generational
workforce - Linked In Group
43.0%
Philadelphia SHRM 1.7%
Reliability Analysis
The reliability of the subscales for the sample was tested with Cronbach’s
alpha. For the five sources of motivation on the MSI, the internal consistency ranged
from .69 for internal process motivation to .80 for external self-concept motivation.
On the UWES, which measured work engagement, the internal consistency ranged
from .80 for absorption to .87 for vigor with an overall reliability of .93. The
minimum acceptable reliability is .70. Reliability coefficients are presented in Table
11.
Table 11
Reliability Coefficients
Subscale Cronbach’s alpha
Intrinsic Process Motivation .687
Instrumental Motivation .714
External Self-Concept Motivation .798
Internal Self-Concept Motivation .753
Goal Internalization Motivation .777
Vigor .867
Dedication .847
Absorption .802
Work Engagement .926

96
Descriptive Statistics and Data Screening
Scores were computed for the subscales by calculating the mean responses for
the items on the scale. The items were measured on a 6-point Likert scale. Therefore,
the mean scores could range from 1 (strongly disagree) to 6 (strongly agree) on the
MSI and from 1 (a few times a year or less) to 6 (everyday) on the UWES. For the
sample, on the MSI, the highest score was obtained for internal self-concept
motivation (M = 5.48, SD = 0.48). The lowest scores were obtained for intrinsic
process motivation (M = 3.21, SD = 0.89) and external self-concept motivation (M =
3.21, SD = 1.08). Scores were approximately equal on the work engagement
subscales of dedication (M = 4.59, SD = 1.26) and absorption (M = 4.60, SD = 1.18).
Descriptive statistics are presented in Table 12.
Table 12
Descriptive Statistics
Variable M SD
Internal Self-Concept Motivation 5.48 0.48
Absorption 4.60 1.18
Dedication 4.59 1.26
Work Engagement 4.54 1.09
Vigor 4.43 1.17
Goal Internalization Motivation 4.09 0.94
Instrumental Motivation 3.63 0.99
Intrinsic Process Motivation 3.21 0.89
External Self-Concept Motivation 3.21 1.08

97
Research Question 1
To what extent is there a difference in the various levels of work engagement
(vigor, dedication, and absorption) across generational cohorts in the workplace? It
was determined that Baby Boomers (1946-1964) had significantly higher vigor (p =
.018) and dedication (p = .043) than the Millennials (1983-1997), but not significantly
higher absorption, p = .081. However, the results for absorption trended in the same
direction as the results for vigor and dedication. The following provides details of the
analyses.
Hypothesis 1a: Vigor
H1a stated that there is a significant difference in the work engagement
element of vigor across generational cohorts. Group means for vigor by generational
cohort are presented in Table 13.
Table 13
Group Means for Vigor by Generational Cohort
Generational Cohort M SD
Baby Boomers (1946 – 1964) 4.96 0.68
Gen Xers (1965 – 1982) 4.44 1.16
Millennials (1983 – 1997) 4.13 1.32
There was a significant difference in the work engagement element of vigor
across generational cohorts, F(2, 180) = 4.12, p = .018. The null hypothesis was that
there was no significant difference in the work engagement element of vigor across
generational cohorts. Each succeeding group was less vigorous. Therefore, the null

98
hypothesis was rejected since there was a significant difference. The ANOVA
Summary Table for vigor by generational cohort is presented in Table 14
Table 14
ANOVA Summary Table for Vigor by Generational Cohort
Source Sum of Squares df Mean Square F p
Between Groups 10.98 2 5.49 4.12 .018
Within Groups 239.60 180 1.33
Total 250.58 182
Scheffe post hoc comparisons revealed that the Baby Boomers (1946-1964)
had significantly higher vigor than the Millennials (1983-1997), p = .018. Baby
Boomers had higher vigor than the Gen-Exers (1965-1982), but it was not
significantly higher, p = .141. Gen-Exers had higher vigor than the Millennials, but it
was not significantly higher, p = .302. This is illustrated in Figure 2.
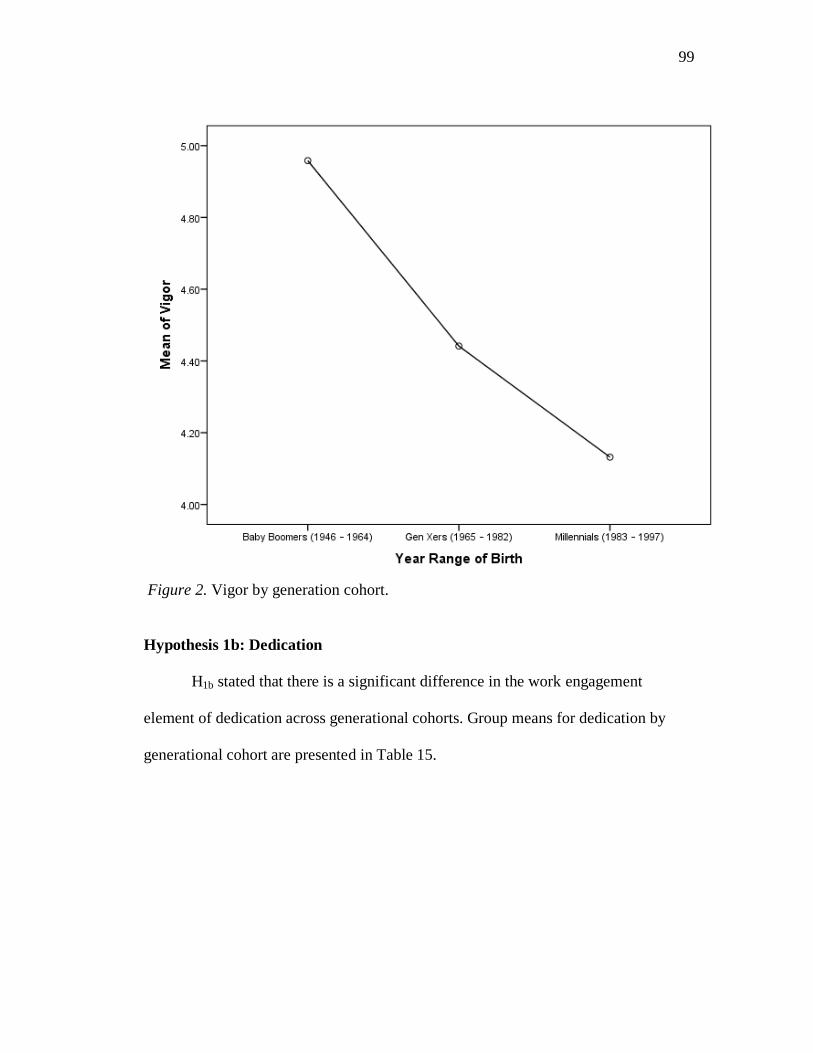
99
Figure 2. Vigor by generation cohort.
Hypothesis 1b: Dedication
H1b stated that there is a significant difference in the work engagement
element of dedication across generational cohorts. Group means for dedication by
generational cohort are presented in Table 15.

100
Table 15
Group Means for Dedication by Generational Cohort
Generational Cohort M SD
Baby Boomers (1946 – 1964) 5.14 0.74
Gen Exers (1965 – 1982) 4.56 1.31
Millennials (1983 – 1997) 4.35 1.29
There was a significant difference in the work engagement element of dedication
across generational cohorts, F(2, 180) = 3.20, p = .043. The null hypothesis was that
there was no significant difference in the work engagement element of dedication
across generational cohorts. Each succeeding group had less dedication towards their
work. Since there was a significant difference, the null hypothesis was rejected. The
ANOVA Summary Table for dedication by generational cohort is presented in Table
16.
Table 16
ANOVA Summary Table for Dedication by Generational Cohort
Source Sum of Squares df Mean Square F p
Between Groups 9.97 2 4.98 3.20 .043
Within Groups 280.03 180 1.56
Scheffe post hoc comparisons revealed that the significant difference existed between
the Baby Boomers (1946-1964) and the Millennials (1983-1997), p = .045. The Baby
Boomers (1946-1964) had significantly higher dedication than the Millennials (1983-
1997). Baby Boomers had higher dedication than the Gen-Exers (1965-1982), but it

101
was not significantly higher, p = .126. Gen-Exers had higher dedication than the
Millennials, but it was not significantly higher, p = .622. This is illustrated in Figure
3.
Figure 3. Dedication by generational cohort.
Hypothesis 1c: Absorption
H1c stated that there is a significant difference in the work engagement level of
absorption across generational cohorts. Group means for absorption by generational
cohort are presented in Table 17.

102
Table 17
Group Means for Absorption by Generational Cohort
Generational Cohort n=183 M SD
Baby Boomers (1946 – 1964) 5.06 0.92
Gen Xers (1965 – 1982) 4.59 1.18
Millennials (1983 – 1997) 4.40 1.25
There was no significant difference in the work engagement element of absorption
across generational cohorts, F(2, 180) = 2.55, p = .081. The null hypothesis was that
there was no significant difference in the work engagement element of absorption
across generational cohorts. Each succeeding group was less absorbed in their work.
Since there was no significant difference, the null hypothesis was not rejected. The
ANOVA Summary Table for absorption by generational cohort is presented in Table
18.
Table 18
ANOVA Summary Table for Absorption by Generational Cohort
Source Sum of Squares df Mean Square F p
Between Groups 6.99 2 3.50 2.55 .081
Within Groups 247.11 180 1.37
Total 254.10 182
Although the results were not statistically significant, they trended in the direction
that Baby Boomers (1946-1964) had higher absorption than the Millennials (1983-
1997) and the Gen-Exers (1965-1982); the Gen-Exers (1965-1982) had higher
absorption than the Millennials (1983-1997). This is illustrated in Figure 4.

103
Figure 4. Absorption by generational cohort.
Research Question 2
To what extent is there a difference in the various motivation drivers (goal
internalization, external self-concept, intrinsic process, internal self-concept, and
instrumental motivation) across general cohorts in the workplace? It was determined
that there were no significant differences in goal internalization (p = .066), external
self-concept (p = .062), intrinsic process (p = .598), and internal self-concept (p =
.141) across general cohorts in the workplace, although trends were observed when
the non-significance was marginal. There was a significant difference in instrumental

104
motivation across generational cohorts, p = .012. Millennials (1983-1997) had
significantly higher instrumental motivation than the Baby Boomers (1946-1964), p =
.012. Millennials (1983-1997) had higher instrumental motivation than the Gen-Exers
(1965-1982), but it was not significantly higher, p = .355. Gen-Exers had higher
instrumental motivation than the Baby Boomers, but it was not significantly higher, p
= .086. The following provides details of the analyses.
Hypothesis 2a
H2a stated that there is a significant difference in goal internalization work
motivation across generational cohorts in the workplace. Group means for goal
internalization motivation by generational cohort by are presented in Table 19.
Table 19
Group Means for Goal Internalization Motivation by Generational Cohort
Generational Cohort M SD
Baby Boomers (1946 – 1964) 4.40 0.77
Gen Xers (1965 – 1982) 4.10 0.90
Millennials (1983 – 1997) 3.87 1.05
There was no significant difference in goal internalization work motivation across
generational cohorts, F(2, 180) = 2.76, p = .066. The null hypothesis was that there
was no significant difference in goal internalization work motivation across
generational cohorts. Each succeeding generation internalized their goals to a lesser
degree, but the effect only trended towards significance. Since there was no

105
significant difference, the null hypothesis was not rejected. The ANOVA Summary
Table for goal internalization motivation by generational cohort is presented in Table
20.
Table 20
ANOVA Summary Table for Goal Internalization Motivation by Generational Cohort
Source Sum of Squares df Mean Square F p
Between Groups 4.75 2 2.37 2.76 .066
Within Groups 154.88 180 0.86
Total 159.62 182
Although the results were not statistically significant, they trended in the direction
that Baby Boomers (1946-1964) had higher goal internalization work motivation than
the Millennials (1983-1997) and the Gen-Exers (1965-1982); the Gen-Exers (1965-
1982) had higher goal internalization work motivation than the Millennials (1983-
1997). This is illustrated in Figure 5.

106
Figure 5. Goal internalization motivation by generational cohort.
Hypothesis 2b
H2b stated that there is a significant difference in external self-concept work
motivation across generational cohorts in the workplace. Group means for external
self-concept work motivation by generational cohort are presented in Table 21.

107
Table 21
Group Means for External Self-Concept Motivation by Generational Cohort
Generational Cohort M SD
Millennials (1983 – 1997) 3.51 1.01
Baby Boomers (1946 – 1964) 3.13 0.92
Gen Xers (1965 – 1982) 3.08 1.12
There was no significant difference in external self-concept work motivation across
generational cohorts, F(2, 179) = 2.82, p = .062. The null hypothesis was that there
was no significant difference in external self-concept work motivation across
generational cohorts. Millennials were motivated by their external self-concept to a
greater degree, while the other groups were roughly equivalent. Since there was no
significant difference, the null hypothesis was not rejected. The ANOVA Summary
Table for external self-concept work motivation by generational cohort is presented in
Table 22.
Table 22
Group Means for External Self-Concept Motivation by Generational Cohort
Source Sum of Squares df Mean Square F p
Between Groups 6.43 2 3.21 2.82 .062
Within Groups 203.94 179 1.14
Although the results were not statistically significant, they trended in the direction
that the Millennials (1983-1997) had higher external self-concept work motivation

108
than the Baby Boomers (1946-1964) and the Gen-Exers (1965-1982). This is
illustrated in Figure 6.
Figure 6. External self-concept motivation by generational cohort.
Hypothesis 2c
H2c stated that there is a significant difference in intrinsic process work
motivation across generational cohorts in the workplace. Group means for intrinsic
process work motivation by generational cohort are presented in Table 23.

109
Table 23
Group Means for Intrinsic Process Motivation by Generational Cohort
Generational Cohort M SD
Baby Boomers (1946 – 1964) 3.37 0.90
Millennials (1983 – 1997) 3.23 0.85
Gen Xers (1965 – 1982) 3.17 0.91
There was no significant difference in intrinsic process work motivation across
generational cohorts, F(2, 180) = 0.52, p = .598. The null hypothesis was that there
was no significant difference in intrinsic process work motivation across generational
cohorts. All means of groups were roughly equivalent. Since there was no significant
difference, the null hypothesis was not rejected. The ANOVA Summary Table for
intrinsic process work motivation by generational cohort is presented in Table 24.
Table 24
ANOVA Summary Table for Intrinsic Process Motivation by Generational Cohort
Source Sum of Squares df Mean Square F p
Between Groups 0.82 2 0.41 0.52 .598
Within Groups 142.97 180 0.79
Hypothesis 2d
H2d stated that there is a significant difference in internal self-concept work
motivation across generational cohorts in the workplace. Group means for internal
self-concept work motivation by generational cohort are presented in Table 25.

110
Table 25
Group Means for Internal Self-Concept Motivation by Generational Cohort
Generational Cohort M SD
Baby Boomers (1946 – 1964) 5.61 0.35
Gen Xers (1965 – 1982) 5.49 0.49
Millennials (1983 – 1997) 5.38 0.51
There was no significant difference in internal self-concept work motivation across
generational cohorts, F(2, 180) = 1.98, p = .141. The null hypothesis was that there
was no significant difference in internal self-concept work motivation across
generational cohorts. There was a small effect of internal self-concept motivation
decreasing with each successive group, but the effect was quite small. Since there was
no significant difference, the null hypothesis was not rejected. The ANOVA
Summary Table for internal self-concept work motivation by generational cohort is
presented in Table 26.
Table 26
ANOVA Summary Table for Internal Self-Concept Motivation by Generational
Cohort
Source Sum of Squares df Mean Square F p
Between Groups .91 2 .45 1.98 .141
Within Groups 41.20 180 .23

111
Hypothesis 2e
H2e stated that there is a significant difference in instrumental motivation
across generational cohorts in the workplace. Group means for instrumental
motivation by generational cohort are presented in Table 27.
Table 27
Group Means for Instrumental Motivation by Generational Cohort
Generational Cohort M SD
Millennials (1983 – 1997) 3.86 0.97
Gen Xers (1965 – 1982) 3.62 0.95
Baby Boomers (1946 – 1964) 3.14 1.02
There was a significant difference in instrumental motivation across generational
cohorts, F(2, 180) = 4.51, p = .012. The null hypothesis was that there was no
significant difference in instrumental motivation across generational cohorts. In
contrast to the other sources of motivation, instrumental motivation increased with
each successive generation. Since there was a significant difference, the null
hypothesis was rejected. The ANOVA Summary Table for instrumental motivation
by generational cohort is presented in Table 28.
Table 28
ANOVA Summary Table for Instrumental Motivation by Generational Cohort
Source Sum of Squares df Mean Square F p
Between Groups 8.35 2 4.17 4.51 .012
Within Groups 166.53 180 0.93

112
Scheffe post hoc comparisons revealed that the Millennials (1983-1997), had
significantly higher instrumental motivation than the Baby Boomers (1946-1964), p =
.012. Millennials (1983-1997), had higher instrumental motivation than the Gen-
Exers (1965-1982), but it was not significantly higher, p = .355. Gen-Exers had
higher instrumental motivation than the Baby Boomers, but it was not significantly
higher, p = .086. This is illustrated in Figure 7.
Figure 7. Instrumental motivation by generational cohort.

113
Research Question 3
To what extent is there a relationship between each motivation driver (goal
internalization, external self-concept, intrinsic process, internal self-concept, and
instrumental motivation) and overall work engagement? The inter-correlations are
presented in a correlation matrix. See Table 29. Significance was found at the .01
level for Instrumental Mot, Internal Self-concept, and goal internalization although
the relationships were weak at -.30, .27 and .15 respectively. Due to the weak
relationship, the results are not very meaningful.
Table 29
Correlation Matrix
Variable Work
Engagement
Intrinsic Process Motivation (2) 0.05
Instrumental Motivation (3) 0.30***
External Self-Concept Motivation (4) 0.06
Internal Self-Concept Motivation (5) 0.27***
Goal Internalization Motivation (6) 0.15*
Note. ***p < .001, **p < .01, *p < .05, two-tailed.
For interpretation purposes, Table 30provides the criteria on how the magnitude of
the correlations were interpreted.

114
Table 30
Criteria for Interpreting Magnitude of Correlations
Value of r Magnitude of the Relationship
-1.0 to -0.5 or 1.0 to 0.5 or greater Strong
-0.5 to -0.3 or 0.3 to 0.5 Moderate
-0.3 to -0.1 or 0.3 to 0.1 Weak
-0.1 to 0.1 None or very weak
Hypothesis 3a
H3a stated that there is a significant relationship between goal internalization
work motivation and overall workplace engagement. There was a significant, weak,
positive relationship between goal internalization work motivation and overall
workplace engagement, r(181) = .15, p = .048, two-tailed. The null hypothesis was
that there was no significant relationship between goal internalization work
motivation and overall workplace engagement. Since there was a significant
relationship, the null hypothesis was rejected. As goal internalization work motivation
increased, there was a corresponding increase in overall work engagement. The
coefficient of determination (r2) = .0225, which means that 2.25% of the variance in
overall workplace engagement can be explained by goal internalization work
motivation. A scatterplot of this relationship is illustrated in Figure 8. The
contribution of these variables to work engagement is so minimal it is insignificant.

115
Figure 8. Goal internalization and work engagement.
Hypothesis 3b
H3b stated that there is a significant relationship between external self-concept
work motivation and overall workplace engagement. There was no significant
relationship between external self-concept work motivation and overall workplace
engagement, r(180) = -.06, p = .439, two-tailed. The null hypothesis was that there
was no significant relationship between external self-concept work motivation and

116
overall workplace engagement.
Figure 9. Goal internalization motivation.
Since there was no significant relationship, the null hypothesis was not rejected.
Hypothesis 3c
H3c stated that there is a significant relationship between intrinsic process
work motivation and overall workplace engagement. There was no significant
relationship between intrinsic process work motivation and overall workplace
engagement, r(181) = -.05, p = .539, two-tailed. The null hypothesis was that there
was no significant relationship between intrinsic process work motivation and overall

117
workplace engagement. Since there was no significant relationship, the null
hypothesis was not rejected.
Hypothesis 3d
H3d stated that there is a significant relationship between internal self-concept
work motivation and overall workplace engagement. There was a significant, weak,
positive relationship between internal self-concept work motivation and overall
workplace engagement, r(181) = .27, p < .001 two-tailed. The null hypothesis was
that there was no significant relationship between internal self-concept work
motivation and overall workplace engagement. Since there was a significant
relationship, the null hypothesis was rejected. As internal self-concept work
motivation increased, there was a corresponding increase in overall work
engagement. The coefficient of determination (r2) = .0729, which means that 7.29%
of the variance in overall workplace engagement can be explained by internal self-
concept work motivation. A scatterplot of this relationship is illustrated in Figure 10.
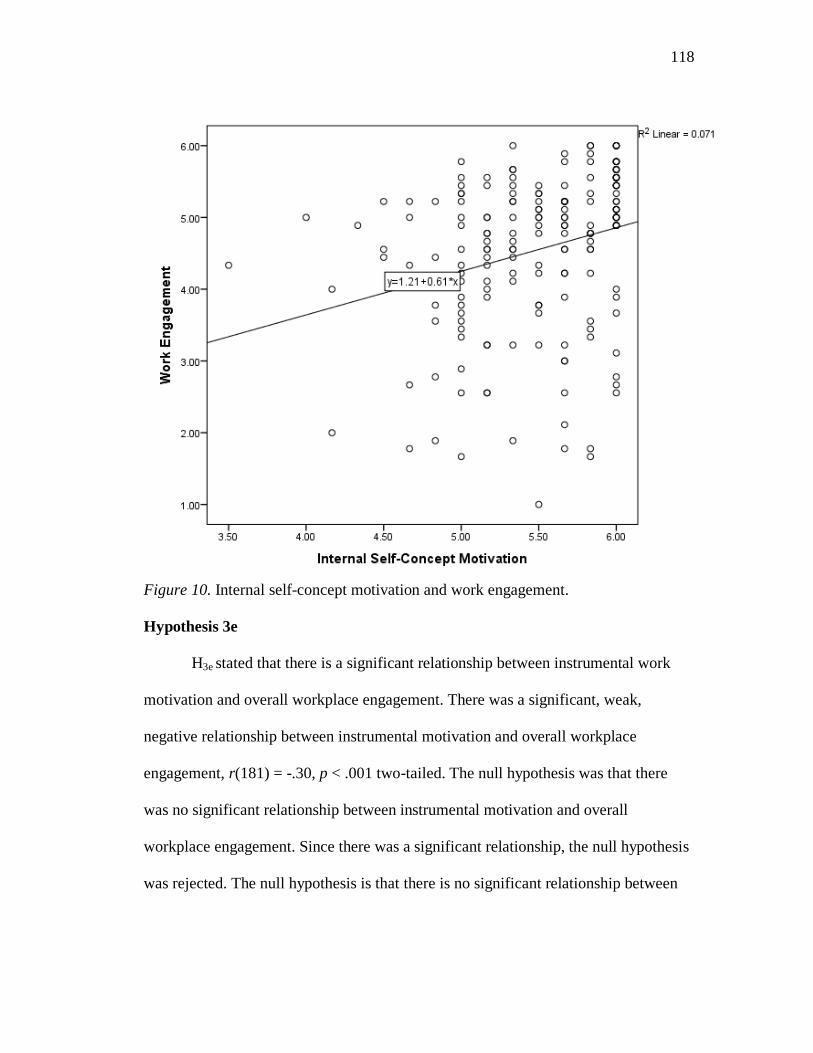
118
Figure 10. Internal self-concept motivation and work engagement.
Hypothesis 3e
H3e stated that there is a significant relationship between instrumental work
motivation and overall workplace engagement. There was a significant, weak,
negative relationship between instrumental motivation and overall workplace
engagement, r(181) = -.30, p < .001 two-tailed. The null hypothesis was that there
was no significant relationship between instrumental motivation and overall
workplace engagement. Since there was a significant relationship, the null hypothesis
was rejected. The null hypothesis is that there is no significant relationship between

119
instrumental work motivation and overall workplace engagement. Since there is a
significant relationship, the null hypothesis is rejected.
As instrumental motivation increased, there was a corresponding decrease in
overall work engagement. The coefficient of determination (r2) = .09, which means
that 9% of the variance in overall workplace engagement can be explained by
instrumental motivation. A scatterplot of this relationship is illustrated in Figure 11
Figure 11. Instrumental motivation and work engagement.
Table 31 provides a summary of all alternative hypotheses tested and their outcomes.

120
Table 31
Summary of Hypotheses and Outcomes
Hypothesis Statistical
Test
Significance Outcome
H1a: There is a significant difference in the work
engagement element of vigor across generational
cohorts.
One Way
ANOVA
p = .018 Supported
H1b: There is a significant difference in the work
engagement element of dedication across
generational cohorts.
One-Way
ANOVA
p = .043 Supported
H2e: There is a significant difference in
instrumental motivation across generational
cohorts in the workplace.
One-Way
ANOVA
p = .012 Supported
H3a: There is a significant relationship between
goal internalization work motivation and overall
workplace engagement.
Pearson r p = .048 Supported
H3d: There is a significant relationship between
internal self-concept work motivation and overall
workplace engagement.
Pearson r p < .001 Supported
H3e: There is a significant relationship between
instrumental motivation work motivation and
overall workplace engagement.
Pearson r p < .001 Supported
Conclusions
Three research questions and 13 associated hypotheses were developed for
investigation. It was determined that Baby Boomers (1946-1964) had significantly
higher vigor and dedication than the Millennials, but not significantly higher
absorption. However, the results for absorption trended in the same direction as the
results for vigor and dedication.

121
It was determined that there were no significant differences in goal internalization,
external self-concept, intrinsic process, and internal self-concept across general
cohorts in the workplace, although trends were observed when the non-significance
was marginal. There was a significant difference in instrumental motivation across
generational cohorts. Specifically, Millennials (1983-1997) had significantly higher
instrumental motivation than the Baby Boomers (1946-1964). Millennials (1983-
1997) had higher instrumental motivation than the Gen-Exers (1965-1982), but it was
not significantly higher. Gen-Exers had higher instrumental motivation than the Baby
Boomers, but it was not significantly higher.
There was a significant, weak, positive relationship between goal
internalization work motivation and overall workplace engagement. There was a
significant, weak, positive relationship between internal self-concept work motivation
and overall workplace engagement. There was a significant, weak, negative
relationship between instrumental motivation and overall workplace engagement.
When results are statistically significant, this means that the probability of them
occurring due to change is less than .05 or five times out of 100. Likewise, if results
are not statistically significant, this means that they are due to chance. Implications
will be discussed in Chapter 5.

122
CHAPTER 5
CONCLUSIONS AND RECOMMENDATIONS
The purpose of this research was to determine the differences between
generational cohorts in the workforce relative to work engagement and motivational
sources. A secondary purpose of the study was to determine if and to what extent a
relationship exists between work engagement and motivational sources. Chapter 1
presented a general overview of the study with a brief discussion of the relevant
literature. Chapter 2 focused on a review of current literature on the topic of
workplace engagement and generational cohorts in the current workforce. Chapter 3
addressed research methodology and placed an emphasis on the research questions
and hypotheses as well as the research design of the study. Chapter 4 was a
presentation of the data analysis and study results. Chapter 5 now provides a
summary of the overall research study including the findings, conclusions,
implications, limitations, and recommendations for further research.
As noted in the literature review, there is a widespread belief among corporate
decision-makers that personality and motivation differ between Millennials,
Generation Xers, and Baby Boomers (Constanza et al., 2012). Specifically,
Millennials are seen as more individualistic and less motivated than previous
generations and each younger generation is viewed as progressively less conservative
and hard-working. However, previous research has found little difference between
these groups in terms of organizational commitment, job satisfaction, and turnover
intentions (Constanza et al., 2012), suggesting that chronic trait differences between

123
groups may be either illusory or simply the result of personalities naturally
developing as a person ages. The current research extends these findings to test
whether the relative sameness of these traits across generations replicates for
motivational traits.
The first trait measured across generations was employee engagement.
Employee engagement is a positive, fulfilling, work-related state of mind
characterized by vigor, dedication, and absorption (Schaufeli et al., 2012).
Engagement has been found to be a relatively stable variable with little change across
one’s age (Mauno et al., 2007; Salanova et al., 2000). This is important for the
purposes of the current study because, if any differences between large groups of
people cannot be attributed to within-person differences, it must be the result of
between-person differences. Because there is little within-person variation for
engagement across the lifespan, if there are differences between groups, it is likely
the result of chronic differences between these groups.
For engagement, surveys of corporations (Adkins, 2015) and countries
(BlessingWhite, 2010) have found systemic differences between groups. For instance,
India was found to have the most engaged workforce (North America was second)
and China the least (BlessingWhite, 2010). The current work tests if such differences
exist between groups when generation is the construct of interest. Specifically, it tests
whether vigor, dedication, and absorption sub-dimensions of engagement differ
between Baby Boomers, Gen Xers, and Millennials. Vigor is defined as “high levels
of energy and mental resilience while working, the willingness to invest effort in

124
one’s work and persistent even in the face of difficulties” (Schaufeli et al., 2002, p.
74), dedication as having “a sense of significance, enthusiasm, inspiration, pride, and
challenge,” and absorption as the “state of being fully concentrated and deeply
engrossed in one’s work, whereby time passes quickly and one has difficulties with
detaching oneself from work” (Schaufeli et al., 2002, p. 74). These are all important
contributors to employee effort and performance and identifying groups that are more
or less likely to exhibit these qualities is therefore of critical interest to organizations.
Park and Gursoy (2012) suggested that there are features of the engagement
construct that would lead to differences between generations. First, because younger
generations value leisure to a greater degree and work centrality to a lower degree
(Christian, Garza, & Slaughter, 2011), Millennials may simply be less motivated to
become fully immersed in their work. Second, this focus on work-life balance at the
expense of fully committing to one’s job may leave Millennials less able to fulfill job
demands. Parks and Gursoy (2012) position Halbesieben et al’s (2009) conservation
of resources theory arguing that younger employees may be more inclined to expend
their resources in off-hours than during work, leading to reduced development of
strategies to meet job demands. This reduction in availability and quality of strategies
to counter demands could then lead to lower engagement with tasks. Therefore,
diverse generational values could have both the direct and indirect effect of reducing
engagement in the millennial workforce. In support of these hypotheses, a survey
conducted by BlessingWhite, Inc. (2010) found that Boomers were the most engaged
with their work (39%), followed by GenXers at (35%), followed by Millennials at

125
(16%). While it is potentially less useful to classify individuals as dichotomously
engaged or not engaged (as opposed to looking at them across a continuum), these
findings do indicate that succeeding generations have been less engaged with their
work.
In support of these findings, Park and Gursoy (2012) found differences in the
level of engagement and its sub-dimensions across generations. Baby Boomers had
higher levels of both dedication and vigor than Gen Xers and Millennials. Gen Xers
scored significantly higher on dedication than Millennials. Regarding absorption,
Baby Boomers scored significantly higher than Gen Xers and Millennials. Overall,
older generations were found to be more engaged with their work. Thus, preliminary
evidence suggests that there are chronic differences between generational groups in
terms of engagement, and the authors have found that these differences existed even
when controlling for age. However, this study relied solely upon participants from the
U.S. hospitality industry, and it may be the case that these effects do not replicate
across industries. In addition, a deeper understanding of the processes which impact
engagement across generations would increase empirical understanding of both the
engagement construct as well as the different generations.
In the current study, a three-factor ANOVA analysis revealed differences in
mean dedication and vigor, but not absorption, across the generational groups. This
indicates that employees in previous generations were more committed to completing
their work in an optimal manner and expended more energy to do so. However, they
were not more likely to become deeply immersed in their work. Note that these

126
results contradict the study of Park and Gursory (2012) that found differences across
all engagement dimensions. These findings may indicate that the hospitality field is
not representative of the entire workforce in terms of generational differences, and
they underlie the need for studying generations across a wide variety of occupations.
Mean levels of engagement decreased across each successive generation. Engagement
is strongly correlated with work performance (r = .35) (Rich, Lepine, & Crawford,
2010). It is also positively related to organizational outcomes such as satisfaction and
commitment (Meyer, 2008). Thus, it is an important factor in individual and
organizational success, and the current research findings that successive generations
are less engaged with their work is therefore troubling.
It is important to consider societal context when making comparisons between
generations. Generational similarities are the result of shared experiences, such as
wars or advances in technology (Schullery, 2013). As our economy has transitioned
to being service-based instead of production-based, it has become heavily reliant on
multi-tasking and switching schemas when necessary. It may therefore be the case
that employees have found fewer means in which to become engaged with their work
– perhaps they spend more of their time putting out the fires of the workday or
jumping between projects with varying members and goals, allowing for less of an
opportunity to truly engage with work. In addition, as average tenure at companies
has decreased, it is possible that employees have begun to feel less beholden to their
employers and are less likely to fully commit to the work provided by organizations
that do not commit to them. Finally, the increased use of technology may lead to

127
employees feeling less engaged. When one can simply hit backspace to delete a text
error, it is less necessary to fully immerse oneself in the task (Casner-Lotto &
Barrington, 2006).
Causes of Generational Differences in Engagement
In an effort to deepen our understanding of whether younger generations are less
engaged, this research has attempted to parse apart the effects of generations upon
engagement. It supports the findings of Park and Gursoy (2012) that successive
generations have been less engaged, although it did not find a difference in the
engagement dimension of absorption. The Job Demands-Resources Model
(Demerouti et al., 2001) indicates that job resources such as managerial support,
specific and timely feedback, and access to resources necessary to complete a task all
enhance engagement in employees. Conversely, demands such as an unmanageable
workload, role confusion, and a perceived lack of support all contribute to employee
burnout (conceived as the theoretical opposite of engagement) and decrease
engagement. However, the relationship between constructs is slightly more nuanced:
job resources also moderate the relationship between demands and engagement
(Bakker, Hannaken, Demerouti, & Xanthopoulou, 2007). For instance, even if an
employee has a heavy workload, if they feel supported by their supervisor and have
the tools they need to complete their work, they may not feel a reduced sense of
engagement. Thus, external factors can directly impact employee engagement.
However, a wide body of research (Crawford et al., 2010; Schaufeli et al., 2007)
indicated that there is also a strong internal drive for engagement that differs between

128
people and across groups. Therefore, an additional goal of the current research was to
determine if the differences in engagement between generations is the result of
internal and/or external factors, and to what degree.
Twenge and colleagues (2010) measured the importance of work-related
values across generations. They found that Boomers were the most invested in
external rewards, followed by Millennials, followed by GenXers. Note that this does
not follow the patterns of engagement described in Park and Gursoy’s (2012)
research, but rather indicates a plateau of the degree to which rewards such as money
and material possessions were motivational with the GenXs, a group commonly
associated with an emphasis on the accumulating of wealth. In terms of internal
reward motivation, each generation values internal rewards less than the previous
generation. This fits with the patterns of engagement as described above, whereby
each successive generation was less engaged with their work. Self-Determination
Theory (Deci & Ryan, 2000) suggests that internal rewards may be more motivating
over time than external rewards, however, and thus there is cause to believe that this
may partially be a function of age.
The current research extends previous findings related to internal and external
drivers to include instrumental motivation, external self-concept-based motivation,
internal self-concept-based motivation, and goal internalization motivation across
generations (Barbuto & Scholl, 1998). This framework allows for greater specificity
based on an integrative model of motivation that has been supported by factor
analyses. Thus, to test whether internal and external motivators differentially impact

129
each generation, this study has measured the levels of each of the motivational factors
across the three generations. Results indicate no significant differences in goal
internalization, external self-concept, intrinsic process, and internal self-concept
across generational cohorts in the workplace. However, there was a significant
difference in instrumental motivation across generational cohorts. Specifically,
Millennials had significantly higher instrumental motivation than Baby Boomers.
Average Millennial instrumental motivation also trended higher than it did for the
Gen-Exers, as did average the instrumental motivation of Gen-Exers in comparison to
Baby Boomers. This indicates that generations attach different degrees of motivation
to achieving external rewards. It may be the case that successive generations have
been less likely to see work as valuable in itself and more as a means to an end. This
would align with the findings related to engagement that also indicated that people
are less fulfilled by their work and suggests that this may be a result of later
generations placing more value outside of work and less value on their lives at work.
In support of this reasoning, there was a negative relationship between instrumental
motivation and overall workplace engagement.
Summary
Given the alignment of the current research with previous empirical findings,
it seems clear that each generation has been less engaged with their work. The current
research offers evidence that this may be related to a changing mindset as to what
work is. Previous generations may have viewed employment as one’s life work and
closely tied into their identity. It seems that current generations do not identify with

130
their work to as strong of a degree and instead value pursuits outside the office in
their search for identity and actualization. Combined with tasks that heavily utilize
technology and task-switching, it may be the case that employees are both less
predisposed to being fully engaged with their work and less likely to receive
opportunities to do so.
Future Research and Limitations
There were several limitations to note in the study. The research was
conducted with a cross-sectional survey-based design, and thus causation cannot be
inferred from results. The research also relied upon the use of an online survey to
capture the opinions of individuals in the current works force. Participating in online
surveys can sometimes be done in an uncontrolled environment and there is no way to
guarantee carefully considered responses. Previous research has found that some
individual-level differences in personality and motivation are the result of the normal
aging cycle, as opposed to differences between generations (Costanza et al., 2012).
While there is evidence that differences in terms of engagement are likely to be the
result of actual between-group disparities, future research could measure this effect
longitudinally and test whether engagement stays relatively stable or develops in a
similar manner within individuals. In addition, while utilizing an audience more
diverse than previous studies (Park & Gursoy, 2012), the current study was limited by
size, geographic location, and business sectors; future research could measure the
effects across new and different groups. For instance, the effect of gender on
engagement could differ across generations, as changing women’s roles within the

131
workforce could seemingly enhance their identification and thus their engagement
with their work, which could lead to the opposite of the effect shown in this study.
An additional limitation lies in the defining of generations. Historians and
academicians may use similar but different birth groupings for each generation. The
researcher defined the generational taxonomy (generation birth years) of Sullivan,
Forret, Carraher, and Mainiero (2009) to correlate each survey participant with a
specific generation; Baby Boomers were born between 1946 and 1964; Generation X,
known as Gen Xers, were born between 1965 and 1983; and Generation Y, also
known as Millennial, were born between 1984 and 2002. Results could have been
different if different generation birth year groupings had been used. Future research
could examine different birth year groupings for a more accurate representation of
values, behaviors, and personalities.
A primary takeaway of this research is that younger generations are lower in
engagement than older ones. However, it may be the case that different types of work
not directly measured via current measures are more engaging for Millennials. For
instance, 21st century literature (Casner-Lotto & Barrington, 2006) suggests that using
technology, high-level thinking, and working in teams are the primary skills that are
predictive of success in the modern economy. It may be the case that these types of
tasks are more engaging to the younger generation than more traditional, production-
based work. It would therefore be potentially fruitful to split engagement across

132
different tasks to measure if Millennials are in fact less engaged or are simply more
selective regarding the work they choose to become fully immersed within.
Future research could also measure a theoretical framework in which sources
of motivation mediate the relationship between generational membership and
employee engagement. It may be the case that motivation “explains” the relationship
between generations and engagement; if this were the case, it would provide
important information regarding the generation and engagement relationship. For
instance, it may be the case that Baby Boomers are more engaged as a result of their
higher levels of internal motivation. In addition, a potential moderating effect of
generations upon job demands and resources and engagement could be tested. It may
be, for instance, that older generations are less likely to perceive a large workload as
“too much,” and thus their engagement may suffer less as the result of it. The J D-R
model has been applied as a measure of the impact of organizational outputs on
employee motivation, and including generation as a moderator potentially fleshes out
the model to measure the interaction of the person and the job on the person.
Implications for Practice
Engagement is strongly associated with work performance (Crawford, Lepine,
& Rich, 2010) as well as job satisfaction and commitment (Macey, 2008). Because
older generations are generally more engaged with their work, one key takeaway is
that companies should not refrain from hiring older staff. It may also be the case that
the findings of this study related to motivational sources provide a context for

133
knowing how to motivate each generation. The tendency to attach motivation to
tangible external rewards is negatively related to engagement, and thus should be
used sparingly by organizations. The tendency towards internal motivation is
positively correlated with engagement, however, and taken together these findings
indicate a preference for finding and hiring the right people in comparison to
increasing buy-in through rewards programs. In other words, hiring naturally-
motivated people, and treating them well, should be emphasized over programs
designed to improve employee motivation.

134
References
Adams, S. J. (2000). Generation X: How understanding this population leads to better
safety programs. Professional Safety, 45, 26–29.
Adkins, A. (2015, January 28). Majority of U.S. employees not engaged despite gains
in 2014. Retrieved December 30th
2016 from
http://www.gallup.com/poll/181289/majority-employees-not-engaged-despite-
gains-2014.aspx.
Aggarwal, U., & Bhargave, S. (2009). Reviewing the relationship between human
resource practices and psychological contract and their impact on employee
attitude and behaviors: A conceptual model. Journal of European Industrial
Training 33(1), 4-31.
Bakker, A. B., Hakanen, J. J., Demerouti, E., & Xanthopoulou, D. (2007). Job
resources boost work engagement, particularly when job demands are
high. Journal of educational psychology, 99(2), 274.
Barbuto, J. E. (2001). An alternative scoring method for the motivation sources
inventory: a case for ratio analysis, Psychological Reports, 88, 385-386.
Barbuto, J. E., & Miller, M. L. (2008, October 2-4). Generation gaps in the
workplace: Exploring differences in work motivation between generational
cohorts. Paper presented at the 51st Annual Meeting of the Midwest Academy
of Management, St. Louis, MO.
Barbuto, J. E., & Scholl, R. (1998). Motivation Sources Inventory: Development and

135
validation of new scales to measure an integrative taxonomy of motivation.
Psychological Reports, 82, 1011-1022.
Barbuto, J. E., Brown, L. L., Wheeler, D. W., & Wilhite, M. S. (2003). Motivation,
altruism, and generalized compliance: A field study of organizational
citizenship
behaviors. Psychological Reports, 92, 498-502.
Barbuto, J. E., Fritz, S. M., & Marx, D. (2000). A field study of two measures of
work
motivation for predicting leaders’ transformational behaviors. Psychological
Reports, 86, 295-300. 89
Barbuto, J. E., Trout, S. K., & Brown, L. L. (2004). Identifying sources of motivation
of adult rural workers. Journal of Agricultural Education, 45(3), 11-21.
Barbuto, J. E., Story, J. S., “Relations between locus of control and sources of work
motivation amongst government workers”, 2008.
Bakker, A. B. (2011). An evidence-based model of work engagement. Current
Directions in Psychological Science, 20(4), 265-269.
Bakker, A. B., Schaufeli, W. B., Leiter, M. P., & Taris, T. W. (2008). Work
engagement: The emergence of a new concept in occupational health
psychology. Work & Stress, 22(3), 187-200.
Bakker, A. B. (2011). An evidence-based model of work engagement. Current
Directions in Psychological Science, 20(4), 265-269.

136
Barbuto, J. E., & Scholl, R. W. (1998). Motivation Sources Inventory: Development
and Validation of New Scale to Measure an Integrative Taxonomy of
Motivation. Psychological Reports, 82(3), 1011-1022.
Barford, I. N., & Hester, P. T. (2011). Analysis of Generation Y workforce
motivation using multiattribute utility theory. Defense Acquisition Research
Journal: A Publication of the Defense Acquisition University, 18(1), 63-80.
Baumruk, R. (2004). The missing link: The role of employee engagement in business
success. Workspan, 47, 48-52.
Blessing-White, Inc. (2005). Employee Engagement Report 2005. Princeton, NJ:
Author.
Buckingham, M., & Vosburgh, R. (2001). The 21st Century human resources
function: It’s the talent, stupid! Human Resource Planning, 24(4), 17–23.
Bureau of Labor Statistics. (2012). Employment outlook: 2010 - 2020. Retrieved from
http://www.bls.gov/opub/mlr/2012/01/art5full.pdf.
Costanza, D. P., Badger, J. M., Fraser, R. L., Severt, J. B., & Gade, P. A. (2012).
Generational differences in work-related attitudes: A meta-analysis. Journal
of Business and Psychology, 27(4), 375-394.
Casner-Lotto, J., & Barrington, L. (2006). Are They Really Ready to Work?
Employers' Perspectives on the Basic Knowledge and Applied Skills of New
Entrants to the 21st Century US Workforce. Partnership for 21st Century
Skills. 1 Massachusetts Avenue NW Suite 700, Washington, DC 20001.
Castellano, S. (2013). Talent retention is a global challenge. T+D, 67(11), 18.

137
Chat-Uthai, M. (2013). Leveraging employee engagement surveys using the turnover
stimulator approach: A case study of automotive enterprises in Thailand.
International Journal of Business & Management, 8(6), 16-21.
Christian, M. S., Garza, A. S., & Slaughter, J. E. (2011). Work engagement: A
quantitative review and test of its relations with task and contextual
performance. Personnel Psychology, 64(1), 89-136.
Cooper, D. R., & Schindler, P. S. (2003). Business research methods (8th ed.). New
York, NY: McGraw-Hill
Cooper, D. R., & Schindler, P. S. (2006). Business research methods (9th ed.). New
York: McGraw-Hill.
Crawford, E. R., LePine, J. A., & Rich, B. L. (2010). Linking job demands and
resources to employee engagement and burnout: a theoretical extension and
meta-analytic test. Journal of Applied Psychology, 95(5), 834
Creswell, J. W. (2003). Research design: Qualitative, quantitative and mixed method
approaches (2nd ed). Thousand Oaks, CA: Sage Publications.
Creswell, J. W. (2005). Educational research: Planning, conducting, and evaluating
quantitative and qualitative research (2nd ed.). Upper Saddle River, NJ:
Merrill Prentice-Hall.
Creswell, J.W. (2009). Research design: Qualitative, quantitative, and mixed methods
approach (3rd ed.). Los Angeles, CA: Sage Publications, Inc.
Crumpacker, M., & Crumpacker, J.D. (2007). Succession planning and generational

138
stereotypes: Should HR consider age-based values and attitudes a relevant
factor or a passing fad? Public Personnel Management, 36(4), 349-369.
Cropanzano, R., & Mitchell, M. S. (2005). Social exchange theory: An
interdisciplinary review. Journal of Management, 31, 874-900.
Csikszentmihalyi, M. (1975). Beyond boredom and anxiety. San Francisco: Jossey-
Bass.
Csikszentmihalyi, M. (1990) Flow: The Psychology of Optimal Experience. New
York: Harper Perennial
De Bruin, G. P., & Henn, C. M. (2013). Dimensionality of the 9-item Utrecht work
engagement scale (UWES-9). Psychological Reports, 112, 788-799.
Deci, E. L., & Ryan, R. M. (2000). The" what" and" why" of goal pursuits: Human
needs and the self-determination of behavior. Psychological inquiry, 11(4),
227-268.
Demerouti, E., Bakker, A. B., Nachreiner, F., & Schaufeli, W. B. (2001). The job
demands-resources model of burnout. Journal of Applied Psychology, 86(3),
499–512.
Ellis, T. J., & Levy, Y. (2009). Towards a guide for novice researchers on research
methodology: Review and proposed methods. Issues in Informing Science &
Information Technology, 6, 323-337
Esty, K., Griffin R., & Schorr-Hirsh, M. (1995). Workplace diversity: A manager’s
guide to solving problems and turning diversity into a competitive advantage.
Massachusetts: Adams Media.

139
Freeney, Y., & Tiernan, J. (2006). Employee engagement: An overview of the
literature on the proposed anti-thesis to burnout. The Irish Journal of
Psychology, 27(3-4), 130-141.
Gallup Organization. (2006). Gallup study: Feeling good matters in the workplace.
Retrieved from
http://www.gallup.com/Search/Default.aspx?s=&p=1&q=employee+engagem
ent+as+it+relates+to+motivation+and+performance&b=Go
Glass, A. (2007). Understanding generational differences for competitive success.
Industrial and Commercial Training, 39(2), 98-103.
Halbesleben, J. R., Harvey, J., & Bolino, M. C. (2009). Too engaged? A conservation
of resources view of the relationship between work engagement and work
interference with family. Journal of Applied Psychology, 94(6), 1452.
Hankin, H. (2004). The new workforce: Five sweeping trends that will shape your
company's future. New York: American Management Association.
Herzberg, F., Mausner, B., & Snyderman, B. B. (2011). The motivation to work (Vol.
1). Transaction publishers.
Herzberg, F., Mausner, B. and Snyderman, B. (1959). The Motivation to Work. New
York, NY: John Wiley and Sons.
Herzberg, F. (1966). Work and the nature of man. New York: Thomas Y. Crowell.
Herzberg, F. (1968). One more time: how do you motivate employees? Harvard
Business Review (January-February):53-62.

140
Herzberg, F. (1974). Motivation-hygiene profiles: Pinpointing what ails the
organization. Organizational Dynamics, 3(2), 18-29.
Howe, N., & Strauss, W. (1991). Generations: The history of America's future, 1584
to 2069. New York: William Morrow and Co.
Howe, N. & Strauss, W. (1993). 13th Gen: Abort, Retry, Ignore, Fail? Vintage Books,
New York.
Howe, N., & Strauss, W. (2000). Millennials rising: The next great generation. New
York: Vintage Books.
Howe, N., & Strauss, W. (2007). The Next 20 Years: How Customer and Workforce
Attitudes Will Evolve. Harvard Business Review, 85(7/8), 42-52.
Johnson, B., & Christensen, L. (2008). Educational research: Quantitative,
qualitative, and mixed approaches (3rd ed.). Los Angeles, CA: Sage.
Kahn, W.A. (1990). Psychological conditions of personal engagement and
disengagement at work. Academy of Management Journal, 33(4), 692-724.
Kahn, W. A. (1992). To be fully there: Psychological presence at work. Human
Relations, 45(4), 321-349.
Kanungo, R. N. (1982). Measurement of job and work involvement.
Jourmal of Applied Psychology, 67, pp. 341-349.
Kupperschmidt, R. (2000). Multigenerational employees: strategies for effective
management. Health Care Management, 19(1), 65-76.

141
Lim, B., (1995). Examining the organizational culture and organizational
performance link. Leadership & Organization Development Journal, 16(5),
16-21.
Macey, W., & Schneider, B. (2008). The meaning of employee engagement.
Industrial and Organizational Psychology, 1(1), 3-30.
Markos, S., & Sridevi, M. S. (2010). Employee engagement: The key to improving
performance. International Journal of Business and Management, 5(12), 89.
Martin, C. A., & Tulgan, B. (2001). Managing Generation Y: Global citizens born in
the late seventies and early eighties. Amherst, MA: HRD Press.
Maslach, C., Schaufelli, W. B., & Leiter, M. P. (2001). Job burnout. Annual Review
of Psychology, 52, 397-422.
Maslow, A. H. (1943). A theory of human motivation. Psychological Review, 50,
394- 395.
Maslow, A. (1954), Motivation and personality. New York: Harper and Row.
Mauno, Kinnunen, U., & Ruokolainen, M. (2007). Job demands and resources as
antecedents of work engagement: A longitudinal study. Journal of
Organizational Behavior, 70, 149-171.
May, D. R., Gilson, R. L., & Harter, L. M. (2004). The psychological conditions of
meaningfulness, safety, availability and the engagement of the human spirit at
work. Journal of Occupational and Organizational Psychology, 77, 11-34.

142
Meyer, J.P., & Gagne’,M. (2008). Employee Engagement from self-determination
theory perspective. Industrial and Organizational Psychology, 1 (2008), 60–
62.
Mills, M., Culbertson, S., & Fullagar, C. (2012). Conceptualizing and measuring
engagement: An analysis of the Utrecht Work Engagement Scale. Journal of
Happiness Studies, 13, 519-545.
Neil, S. (2007). Study: More work needed to lure next Gen talent. Managing
Automation, 22(8), 1-74.
Newman, L. (2003). Social Research Methods: Qualitative and Quantitative
Approaches. (5th ed.). Boston, MA: Pearson Education.
Neuman, W. L. (2005). Social Research Methods: Qualitative and Quantitative
Approaches (6th ed.). Upper Saddle River, NJ: Pearson Education.
Park, J., & Gursoy, D. (2012). Generation effects on work engagement among US
hotel employees. International Journal of Hospitality Management, 31(4),
1195-1202.
Parker, C. P., Baltes, B. B., Young, S. A., Huff, J. W., Altmann, R. A., Lacost, H. A.,
et al. (2003). Relationships between psychological climate perceptions and
work 134 outcomes: A meta analytic review. Journal of Organizational
Behavior, 24(4), 389-416.
Pew Research Center. (2010). Millennials: A portrait of generation next. Retrieved
December 30, 2016 from

143
http://www.pewsocialtrends.org/2010/02/24/millennials-confident-connected-
open-to-change/.
Pilcher, J. (1994). Mannheim’s sociology of generations: An undervalued legacy.
BJS, 45(3), 481-494.
Raines, C. (2003). Connecting generations - The sourcebook for a new workplace.
Menlo Park, CA: Crisp Publications.
Rath, T. (2011). Gallup: Well-being is the next employee engagement, T+D, 65(1),
12.
Rath, T., & Harter, J. (2010). Wellbeing. Personal Excellence Essentials, 15(6), 5.
Rich, B. L., Lepine, J. A., & Crawford, E. R. (2010). Job engagement: Antecedents
and effects on job performance. Academy of management journal, 53(3), 617-
635.
Richman, A. (2006). Everyone wants an engaged workforce how can you create it?
Workspan, 49, 36-39.
Robbins, S. P. (2001). Organizational behavior (9th ed.). Upper Saddle River, NJ:
Prentice Hall.
Robinson, D., Perryman, S., & Hayday, S. (2004). The drivers of employee
engagement. Brighton: Institute for Employment Studies.
Robson, C, (2002). Real world research: a resource for social scientists and
practitioner-researchers. - 2nd ed. Oxford: Blackwell.
Sackman, S. (1991). Uncovering culture in organizations. Journal of Applied
Behavioural Science, 27(3), pp. 295-317.

144
Salkind, N. J. (2006). Exploring research (6th ed.). Upper Saddle River, NJ: Pearson
Education.
Saks, A. M. (2006). Antecedents and consequences of employee engagement. Journal
of Managerial Psychology, 21(6), 600-619.
Salanova, M., Agut, S., Peiro, J.M., 2005. Linking organizational resources and work
engagement to employee performance and customer loyalty: the mediation of
service climate. Journal of Applied Psychology, 90 (6), 1217–1227.
Schaufeli, W. B., Salanova, M., Gonzalez-Roma, V., & Bakker, A. B. (2002). The
measurement of engagement and burnout: A confirmative analytic approach.
Journal of Happiness Studies 3(1), 71-92.
Schaufeli, W. B, & Bakker, A. B. (2003). Utrecht work engagement scale. Retrieved
December 30, 2016 from
http://www.beanmanaged.com/doc/pdf/arnoldbakker/articles/articles_arnold_
bakker_87.pdf
Schaufeli, W. B., & Bakker, A. B. (2004). Job demands, job resources and their
relationship with burnout and engagement: A multi-sample study. Journal of
Organizational Behavior, 25, 293-315.Schaufeli, W. B., Bakker, A. B., &
Salanova, M. (2004). The measurement of work engagement with a short
questionnaire: A cross-national study. Educational and Psychological
Measurement, 2006(66), 701.

145
Schaufeli, W. B., Bakker, A. B., & Salanova, M. (2006). The measurement of work
engagement with a short questionnaire: A cross national study. Educational
and Psychological Measurement, 66(4), 701-716.
Schaufeli, W., Taris, T., & Bakker, A. (2006). Dr. Jekyll of Mr. Hyde? On the
differences in work engagement and workaholism. In R. J. Burke (ed.),
Research companion to work time and work addiction, (pp. 193-217).
Cheltenham, Glos, UK: Edward Elgar.
Schaufeli, W., Bakker, A., & Van Rhenen, W. (2009). How changes in job demands
and resources predict burnout, work engagement, and sickness absenteeism.
Journal of Organizational Behavior, 30, 893-917.
Schullery, N. M. (2013). Workplace engagement and generational differences in
values. Business Communication Quarterly, 76(2), 252-265.
Shaw, K. (2005). An engagement strategy process for communicators. Strategic
Communication Management, 9(3), 26-29.
Sullivan, S. E., Forret, M. L., Carraher, S. M., & Mainiero, L. A. (2009). Using the
kaleidoscope career model to examine generational differences in work
attitudes. Career Development International, 14(3), 284-302.
Smola, K., & Sutton, C. (2002). Generational differences: Revisiting generational
work values for the new millennium. Journal of Organizational Behavior, 23,
363-382.
Strauss, W., & Howe, N. (1997). The fourth turning: What the cycles of history tell us

146
about America’s next rendezvous with destiny. New York, NY: Broadway
Books.
Strauss, W., & Howe, H. (1991). Generations: The history of America’s future, 1584
to 2069. New York: William Morrow & Company, Inc.
Schullery, N. M. (2013). Workplace Engagement and Generational Differences in
Values. Business Communication Quarterly, 76(2), 252-265.
doi:10.1177/1080569913476543
Terjesen, S., Vinnicombe, S., & Freeman, C. (2007) Attracting Generation Y
graduates, organizational attributes likelihood to apply and sex differences.
Career Development International, 12(6), 504-522.
Thomas, K. W., (2009). Intrinsic motivation at work: What really drives employee
engagement.
San Francisco, CA: Berrett-Koehler Publishers, Inc.
Truss, C., Soane, E., Edwards, C., Wisdom, K., Croll, A. and Burnett, J. (2006)
Working Life:Employee Attitudes and Engagement 2006. London, CIPD.
Twenge, J. (2006). Generation me: Why today's young Americans are more confident,
assertive, entitled--and more miserable than ever before. New York: Free
Press.
Twenge, J. M., Campbell, W. K., & Freeman, E. C. (2012). Generational differences
in young adults' life goals, concern for others, and civic orientation, 1966–
2009. Journal of Personality and Social Psychology, 102(5), 1045-1062.
doi:10.1037/a0027408

147
Vogt, W. P. (2009). Quantitative research methods for professionals. Boston, MA:
Allyn & Bacon.
Zemke, R. (2001, July 1). Here come the millennials: Hiring nexters and generation
xers. HighBeam Business. Retrieved December 30, 2016 from
https://business.highbeam.com/137618/article-1G1-77010744/here-come-
millennials.
Zemke, R., Raines, C., & Filipczak, B. (2000). Generations at work: Managing the
clash managing automation, of veterans, boomers, xers, and nexters in your
workplace. United States: American Management Association.

148
Appendix A: Online Survey
Directions: Check the box, in each category that best describes you.
The information you provide will be kept completely confidential and only a description of
the group as a whole will be reported.
Profile
1. Indicate your gender:
Male
Female
2. Write your age on line below:
______
3. Indicate the year range in which you were born:
Born in 1943 or earlier
1944 - 1960
1961 - 1981
1982 – 2002
Born after 2002
5. Indicate is your race: (choose one or more)
African American or Black
Hispanic or Latino origin
American Indian or Alaska Native
Asian
Native Hawaiian/Pacific Islander

149
White
Other or prefer not to respond
6. Indicate the highest level of education you have completed:
High School Diploma/ G.E.D.
Associates Degree; Technical School; Some courses after high school
Bachelor’s Degree
Master’s Degree
PhD; MD; JD; DDS; professional degree
Did not complete High School
7. At your current job, indicate your status:
Full-time
Part-time (20 hours or less per week)
8. Indicate how long you have been working at your current place of employment:
Less than 1 year
1 year - 5 years
6 years – 10 years
11 years – 15 years
16 years – 20 years
More than 20 years
9. Indicate your position at your current job:
Top-level/Senior management level; Executive Suite
President, Vice President

150
Middle-level manager; Department head
First-level manager; Supervisor; Front-line manager
Not in a supervisory/leadership position
Contract employee
Other
10. Indicate the industry sector in which you are employed:
Accounting Services
Auto Sales and Service;
Banking; Financial Services; Insurance; Real Estate;
Consumer Packaging Goods
Educational Services
Health Care and Social Assistance
Information Technology; Journalism; Mass Communications; Media
Legal Services
Leisure and Hospitality; Entertainment, Arts, Recreation
Manufacturing and Product Development; Engineering Services; Construction
Public Service; Government
Retail Sales & Wholesale Trade
Transportation, Warehousing, Logistics
Utilities; Energy; Mining
Other
10. Indicate which one of the following organizations did you receive the survey from;

151
Network of Executing Women ~11K members (confirmed 4/14/2016)
Managing a Multigenerational workforce. ~8K members (confirmed 3/2016)
Philadelphia SHRM ~4K (confirmed 11/2015
Penn State Alumni Chapter
Other
Motivation Source Instrument (MSI)

152

153
Work & Well-being Survey (UWES) ©
The following 17 statements are about how you feel at work. Please read each
statement carefully and decide if you ever feel this way about your job. If you have
never had this feeling, cross the “0” (zero) in the space after the statement. If you
have had this feeling, indicate how often you feel it by crossing the number (from 1 to
6) that best describes how frequently you feel that way.
1. ________ At my work, I feel bursting with energy* (VI1)
2. ________ I find the work that I do full of meaning and purpose (DE1)
3. ________ Time flies when I'm working (AB1)
4. ________ At my job, I feel strong and vigorous (VI2)*
5. ________ I am enthusiastic about my job (DE2)*
6. ________ When I am working, I forget everything else around me (AB2)

154
7. ________ My job inspires me (DE3)*
8. ________ When I get up in the morning, I feel like going to work (VI3)*
9. ________ I feel happy when I am working intensely (AB3)*
10. ________ I am proud on the work that I do (DE4)*
11. ________ I am immersed in my work (AB4)*
12. ________ I can continue working for very long periods at a time (VI4)
13. ________ To me, my job is challenging (DE5)
14. ________ I get carried away when I’m working (AB5)*
15. ________ At my job, I am very resilient, mentally (VI5)
16. ________ It is difficult to detach myself from my job (AB6)
17. ________ At my work I always persevere, even when things do not go well (VI6)
* Shortened version (UWES-9); VI= vigor; DE = dedication; AB = absorption
© Schaufeli & Bakker (2003). The Utrecht Work Engagement Scale is free for use for
non-commercial scientific research. Commercial and/or non-scientific use is
prohibited, unless previous written permission is granted by the authors

155

156