Multicolor Observations of Geostationary Satellites e orts (e.g. 3,6,7, among others) have collected...
4
Multicolor Observations of Geostationary Satellites Henrique R. Schmitt a , Frederick J. Vrba b a Remote Sensing Division, Naval Research Laboratory, Washington, DC20375, USA; b US Naval Observatory, Flagstaff Station, Flagstaff, AZ86001, USA ABSTRACT We present the results of B, V, R and I band observations of a sample of geostationary communications satellites with the U.S. Naval Observatory, Flagstaff Station 40-inch Ritchey telescope. The observations were done in July 2015, and covered 68% of the targets observable from Flagstaff. The targets were observed with an azimuthal solar phase angle smaller than 5 ◦ , in an attempt to sample the satellite properties during the period where they are likely to be at peak brightness. We present the distribution of magnitudes and colors, and interpret these results. We also discuss the application of the results presented in this contribution to the design of future optical interferometers capable of imaging these targets. Keywords: geostationary satellites, photometry, imaging 1. INTRODUCTION Determining the multiwavelenth properties of geostationary satellites is an important piece of information needed to understand these objects. Based on this information one can determine the composition of a satellite as a whole, or the composition of different components of a satellite, 5 and it can also be used as a means to diagnose problems with a satellite. Another important application of this information is in the design of future instruments, such as an interferometer, where this information can be used to optimize performace. Several efforts (e.g. 3,6,7, among others) have collected multiwavelength observations of geosats and GPS satellites. Although the information currently available on these objects is useful for several purposes, sometimes it is limited in the number of objects and may not necessarily have been obtained in a homogeneous way. Here we attempt to overcome some of these issues by obtaining B, V, R and I band images of a large number of geostationary satellites. The different band observations were done within a short period of time and all satellites were observed within a small range of solar azimuthal phase angle. 2. OBSERVATIONS Observations were done with the U.S. Naval Observatory 40 Ritchey telescope, in Flagstaff, AZ, on the nights of July 7 to July 9, 2015. For these observations we used an LN2-cooled 2048×2048 CCD camera with pixel size of 0.68 00 , which corresponds to a field of view of ∼ 23 0 × 23 0 . The filter set selected for these observations was the standard Johnson and Cousins B, V, R and I broad band filters. 1 The observations were done by parking the telescope at an azimuth containing at least one geosat and letting the stars streak by the field, as shown in Fig. 1. Integration times were usually 60, 20, 10 and 10 seconds for B, V, R and I bands, respectively, which ensured shot noise errors < 0.5%. The multi wavelength observations of each satellite was done within ∼15 minutes. In some cases shorter integration times were used to avoid saturation. The data reduction followed standard procedures, including the subtraction of bias frames, the division of the frames by normalized flat-field images and the correction of atmospheric extinction using average extinction values for NOFS. The observational conditions were photometric through most of the 3 nights. In order to calibrate the flux scale of these images we observed a field of photometric calibration stars from Ref. 2 several times during each night. We scheduled the satellite observations at times when the solar azimuthal phase angle was |φ| < 5 ◦ . This was an attempt to observe the satellites at a period of peak brightness, assuming that their solar panels are oriented normal to the Sun. We observed 73 communication satellites, corresponding to ∼68% of the geosats with elevation > 23 ◦ observable from Flagstaff. Further author information: (Send correspondence to H.R.S.)E-mail: [email protected], Telephone: 1 202 767 2977 Copyright © 2016 Advanced Maui Optical and Space Surveillance Technologies Conference (AMOS) – www.amostech.com
Transcript of Multicolor Observations of Geostationary Satellites e orts (e.g. 3,6,7, among others) have collected...

Multicolor Observations of Geostationary Satellites
Henrique R. Schmitta, Frederick J. Vrbab
aRemote Sensing Division, Naval Research Laboratory, Washington, DC 20375, USA;bUS Naval Observatory, Flagstaff Station, Flagstaff, AZ 86001, USA
ABSTRACT
We present the results of B, V, R and I band observations of a sample of geostationary communications satelliteswith the U.S. Naval Observatory, Flagstaff Station 40-inch Ritchey telescope. The observations were done in July2015, and covered 68% of the targets observable from Flagstaff. The targets were observed with an azimuthalsolar phase angle smaller than 5◦, in an attempt to sample the satellite properties during the period where theyare likely to be at peak brightness. We present the distribution of magnitudes and colors, and interpret theseresults. We also discuss the application of the results presented in this contribution to the design of future opticalinterferometers capable of imaging these targets.
Keywords: geostationary satellites, photometry, imaging
1. INTRODUCTION
Determining the multiwavelenth properties of geostationary satellites is an important piece of information neededto understand these objects. Based on this information one can determine the composition of a satellite as awhole, or the composition of different components of a satellite,5 and it can also be used as a means to diagnoseproblems with a satellite. Another important application of this information is in the design of future instruments,such as an interferometer, where this information can be used to optimize performace.
Several efforts (e.g. 3, 6, 7, among others) have collected multiwavelength observations of geosats and GPSsatellites. Although the information currently available on these objects is useful for several purposes, sometimesit is limited in the number of objects and may not necessarily have been obtained in a homogeneous way.Here we attempt to overcome some of these issues by obtaining B, V, R and I band images of a large number ofgeostationary satellites. The different band observations were done within a short period of time and all satelliteswere observed within a small range of solar azimuthal phase angle.
2. OBSERVATIONS
Observations were done with the U.S. Naval Observatory 40 Ritchey telescope, in Flagstaff, AZ, on the nightsof July 7 to July 9, 2015. For these observations we used an LN2-cooled 2048×2048 CCD camera with pixelsize of 0.68′′, which corresponds to a field of view of ∼ 23′ × 23′. The filter set selected for these observationswas the standard Johnson and Cousins B, V, R and I broad band filters.1 The observations were done byparking the telescope at an azimuth containing at least one geosat and letting the stars streak by the field, asshown in Fig. 1. Integration times were usually 60, 20, 10 and 10 seconds for B, V, R and I bands, respectively,which ensured shot noise errors < 0.5%. The multi wavelength observations of each satellite was done within∼15 minutes. In some cases shorter integration times were used to avoid saturation. The data reduction followedstandard procedures, including the subtraction of bias frames, the division of the frames by normalized flat-fieldimages and the correction of atmospheric extinction using average extinction values for NOFS. The observationalconditions were photometric through most of the 3 nights. In order to calibrate the flux scale of these imageswe observed a field of photometric calibration stars from Ref. 2 several times during each night. We scheduledthe satellite observations at times when the solar azimuthal phase angle was |φ| < 5◦. This was an attemptto observe the satellites at a period of peak brightness, assuming that their solar panels are oriented normal tothe Sun. We observed 73 communication satellites, corresponding to ∼68% of the geosats with elevation > 23◦
observable from Flagstaff.
Further author information: (Send correspondence to H.R.S.)E-mail: [email protected], Telephone: 1202 767 2977
Copyright © 2016 Advanced Maui Optical and Space Surveillance Technologies Conference (AMOS) – www.amostech.com

Figure 1. Observed R band image of a field at longitude 99◦ W, containing 4 satellites.
3. RESULTS
The main results of our observations are presented in Figs. 2, 3 and 4. In Fig. 2 we present the distributionof V-band magnitudes of our sample. We find that the distribution has a peak around V=11.5 mag, but wefind sources as bright as 9.5 mag and as faint as 14 mag, corresponding to a brightness range of a factor of100. The distribution of V-I colors is presented in Fig. 3. In this figure we can see that the distribution peaksaround V-I=1.1 mag, with sources as blue as V-I=0.5 or as red as V-I=1.7 mag. For comparison, the Sun hasV-I=0.7 mag, which indicates that satellites look redder than the Sun, and are significantly brighter at longerthan at shorter wavelengths. The result from Fig. 3 indicate that if one was designing an optical interferometerto observe geosats, selecting wavelengths in the range ∼700 nm to ∼ 1µm may by an optimal choice, since thesesatellites are brighter at these wavelenghts. Going towards longer wavelengths (> 1µm) may further improve thesensitivity,6,7 nevertheless, at these wavelengths the radiation becomes dominated by light reflected by the solarpanels.4 In the near-infrared wavelength range the amount of reflected light from the bus would be significantlysmaller than that from the solar panels, thus making it harder to obtain detailed images from the bus.
In Fig. 4 we present the V-I×B-V color-color diagram of the satellites. We can notice in this image that thesatellites split into two groups, separated by a gap of ∼0.2 mag starting at the position B-V=0.7 and V-I=0.7mag and extending to B-V=1.0 and V-I=1.3 mag. We tried to determine if there is any correlation between theground in which the satellites are located and the night of the observations, satellite bus, builder, or age. Sofar we have not been able to determine any correlation. We interpret the difference between these two groupsas due to the materials employed in the construction of the satellites. Based on Fig. 1 in Payne et al. (2006),4
which shows the reflectance of common satellite materials, we can determine that the reflectance of gold has anupturn around 400 nm, which is inside the B-band, going from a reflectance of ∼10% at wavelengths shorter than400nm, to ∼70% around 600nm. In the other hand, kapton has a reflectance of ∼10% for wavelengths shorter
Copyright © 2016 Advanced Maui Optical and Space Surveillance Technologies Conference (AMOS) – www.amostech.com
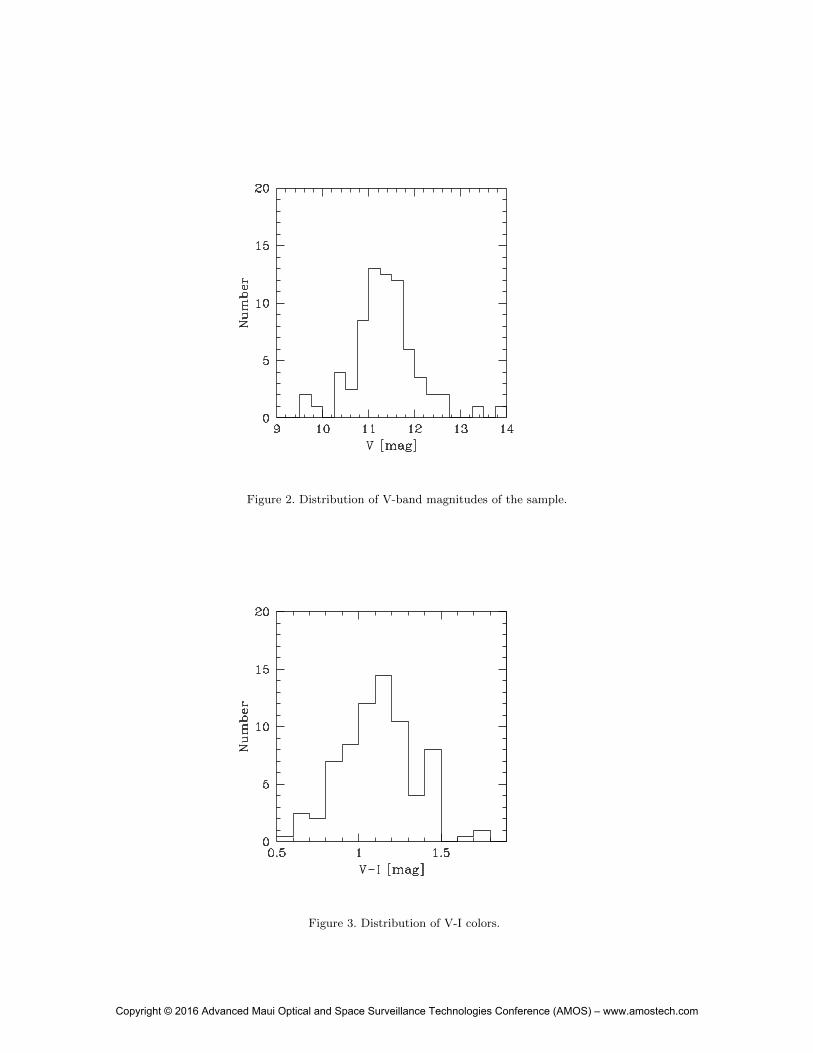
Figure 2. Distribution of V-band magnitudes of the sample.
Figure 3. Distribution of V-I colors.
Copyright © 2016 Advanced Maui Optical and Space Surveillance Technologies Conference (AMOS) – www.amostech.com

Figure 4. V-I X B-V color-color diagram of the satellites.
than 500nm, at this point there is a reflectance upturn, which reaches a peak of ∼45% at 650 nm. Satellites withdifferent amounts of these two materials will have significantly different spectral signatures, which will translateinto different colors. We should emphasize that these two materials, gold and kapton, are being used as anexample. A combination of other materials may produce a similar result.
ACKNOWLEDGMENTS
Basic research at the NLR is supported by 6.1 base funding.
REFERENCES
1. M. S. Bessell, “Photometric Systems”, Annu. Rev. Astron. Astrophys., 43, 293–336 (2005).
2. A. U. Landolt, “UBVRI photometric standard stars in the magnitude range 11.5-16.0 around the celestialequator,” Astronomical Journal, 104(1), 340–371 (1992).
3. T. E. Payne, S. A. Gregory, N. M. Houtkooper, T. W. Burdullis, “Analysis of Multispectral RadiometricSignatures from Geosynchronous Satellites”, SPIE 4847, 332 (2002)
4. T. E. Payne, S. A. Gregory, K. Luu, “Electro-Optical Signatures Comparisons of Geosynchronous Satellites”IEEEAC paper #1500
5. T. E. Payne, A. Chaudhary, S. Gregory, J. Brown, M. Nosek “Signature Intensity Derivative and its Appli-cation to Resident Space Object Typing”, Proceedings of the Amos meeting, Kihei, Maui, HI (2009)
6. D. J. Sanchez, S. A. Gregory, D. Werling, T. E. W. Payne, L. Kann, L. G. Finkner, D. M. Payne, C. K.Davis, “Photometric Measurements of Deep Space Satellites”, SPIE 4091, 164 (2000)
7. Vrba, F. J., Fliegel, H. F., Warner, L. F. 2003, Proceedings of the Amos Meeting, Kihei, Maui, HI (2003)
Copyright © 2016 Advanced Maui Optical and Space Surveillance Technologies Conference (AMOS) – www.amostech.com