Multicentre evaluation of glycated haemoglobin (HbA1c) of Roche Diagnostics in Andalusia
4
Short Communication Multicentre evaluation of glycated haemoglobin (HbA1c) of Roche Diagnostics in Andalusia Ana Sáez-Benito Godino a, ⁎, José Manuel Vergara Chozas a , Apolonia Márquez Ronchel b , Fátima Barrero Alor b , Lara Papay Ramírez c , Nieves María Coronado Álvarez c , José de la Torre Fernández d , Federico Navajas Luque d , Mª. Victoria Camacho Reina e , Rosario Aguilar Peña e , Mª. Lourdes de la Peña Carretero f , Mª. Victoria Romero Sotomayor f a H.U. Puerta del Mar, Cádiz, Spain b H.U. J.R. Jiménez, Huelva, Spain c H.U. San Cecilio, Granada, Spain d H. Axarquía, Vélez-Málaga, Spain e C.H. Ciudad de Jaén, Jaén, Spain f H. Cabra, Córdoba, Spain abstract article info Article history: Received 22 August 2013 Received in revised form 26 March 2014 Accepted 5 April 2014 Available online xxxx Keywords: Diabetes Evaluation Glycated haemoglobin HbA1c Immunoturbidimetric inhibition method Multicentre study Background: A Spanish multicentre evaluation of the third generation of Roche Diagnostics immunoturbidimetric inhibition method (TINIA) is presented for quantification of haemoglobin A1c (HbA1c) in whole blood. Methods: The analytical performance of the TINIA test was evaluated and blood sample results were com- pared with two other widely used analysers, Bio-Rad Variant II and Adams Arkray HA-8160, based on HPLC. Results: Within- and between-batch imprecision (coefficients of variation (CVs)) for HbA1c levels of 5, 6, 7 and 8% were 0.77, 1.23, 1.35 and 1.26% and 2.38, 1.51, 1.76 and 2.16%, respectively. For low (5.4% A1c) and high (10.1% A1c) quality control samples, the within and between-batch %CV were: 1.26; 1.43 and 2; 1.71 respective- ly. The test met the expected performance in most aspects, except for linearity, that is under the reported range, and HbF interferences, detected for levels over 7.5%. There was a good concordance between the results of TINIA and Variant-IIt in the whole range and with HA-8160 only up to levels of 9%. Between-batch imprecision suggests more frequent calibrations than reported by the provider to maintain variability within the limits established by clinical practice guidelines. Conclusions: The assay meets the necessary quality standards for routine use, as long as we keep the analyt- ical variability within narrow limits. The results may be interchangeable with the tested HPLC systems, but HbF interference is not detected and it happens at lower levels than reported. © 2014 The Canadian Society of Clinical Chemists. Published by Elsevier Inc. All rights reserved. Introduction In this study we evaluated the metrological characteristics of the de- termination of HbA1c from Roche Diagnostics by immunoturbidimetric inhibition method Gen.3, (TINIA), and our objective was the validation of its performance on the established recommendations [1] and com- pare it with the most common HPLC techniques (Adams Arkray HA- 8160 and Bio-Rad Variant II turbo) in our country according to external quality control (49% and 25%, respectively). Materials and methods The metrological performance of TINIA technique was evaluated and subsequently compared with the two HPLC methods already men- tioned in six hospitals: Cádiz (C1); Granada (C2); Vélez-Málaga (C3); Cabra (C4), Huelva (C5) and Jaén (C6). All hospitals were using the Adam-Arkray HA-8160 from Menarini® except C4, which was using the Variant II turbo from BioRad®. In all centres a basic preliminary study for the installation of the test was carried out, following the NIST-NCCLS EP10-A2 guide [2]. In C1 a full metrological study of the technique was also carried out, following the guidelines NIST-NCCLS-EP-6A, EP5-A2 [2] for the study of linearity, pre- cision and accuracy and Peters and Westgard protocols for carry-over determination [3]. Clinical Biochemistry xxx (2014) xxx–xxx ⁎ Corresponding author. E-mail address: [email protected] (A. Sáez-Benito Godino). CLB-08685; No. of pages: 4; 4C: http://dx.doi.org/10.1016/j.clinbiochem.2014.04.006 0009-9120/© 2014 The Canadian Society of Clinical Chemists. Published by Elsevier Inc. All rights reserved. Contents lists available at ScienceDirect Clinical Biochemistry journal homepage: www.elsevier.com/locate/clinbiochem Please cite this article as: Sáez-Benito Godino A, et al, Multicentre evaluation of glycated haemoglobin (HbA1c) of Roche Diagnostics in Andalusia, Clin Biochem (2014), http://dx.doi.org/10.1016/j.clinbiochem.2014.04.006
-
Upload
ma-victoria -
Category
Documents
-
view
218 -
download
0
Transcript of Multicentre evaluation of glycated haemoglobin (HbA1c) of Roche Diagnostics in Andalusia

Clinical Biochemistry xxx (2014) xxx–xxx
CLB-08685; No. of pages: 4; 4C:
Contents lists available at ScienceDirect
Clinical Biochemistry
j ourna l homepage: www.e lsev ie r .com/ locate /c l inb iochem
Short Communication
Multicentre evaluation of glycated haemoglobin (HbA1c) of RocheDiagnostics in Andalusia
Ana Sáez-Benito Godino a,⁎, José Manuel Vergara Chozas a, Apolonia Márquez Ronchel b, Fátima Barrero Alor b,Lara Papay Ramírez c, Nieves María Coronado Álvarez c, José de la Torre Fernández d, Federico Navajas Luque d,Mª. Victoria Camacho Reina e, Rosario Aguilar Peña e,Mª. Lourdes de la Peña Carretero f, Mª. Victoria Romero Sotomayor f
a H.U. Puerta del Mar, Cádiz, Spainb H.U. J.R. Jiménez, Huelva, Spainc H.U. San Cecilio, Granada, Spaind H. Axarquía, Vélez-Málaga, Spaine C.H. Ciudad de Jaén, Jaén, Spainf H. Cabra, Córdoba, Spain
⁎ Corresponding author.E-mail address: [email protected] (A. Sáez-Be
http://dx.doi.org/10.1016/j.clinbiochem.2014.04.0060009-9120/© 2014 The Canadian Society of Clinical Chem
Please cite this article as: Sáez-Benito GodinoClin Biochem (2014), http://dx.doi.org/10.10
a b s t r a c t
a r t i c l e i n f oArticle history:
Received 22 August 2013Received in revised form 26 March 2014Accepted 5 April 2014Available online xxxxKeywords:DiabetesEvaluationGlycated haemoglobinHbA1cImmunoturbidimetric inhibition methodMulticentre study
Background: A Spanish multicentre evaluation of the third generation of Roche Diagnosticsimmunoturbidimetric inhibition method (TINIA) is presented for quantification of haemoglobin A1c (HbA1c)in whole blood.
Methods: The analytical performance of the TINIA test was evaluated and blood sample results were com-pared with two other widely used analysers, Bio-Rad Variant II and Adams Arkray HA-8160, based on HPLC.
Results: Within- and between-batch imprecision (coefficients of variation (CVs)) for HbA1c levels of 5, 6, 7and 8% were 0.77, 1.23, 1.35 and 1.26% and 2.38, 1.51, 1.76 and 2.16%, respectively. For low (5.4% A1c) and high(10.1% A1c) quality control samples, the within and between-batch %CVwere: 1.26; 1.43 and 2; 1.71 respective-ly. The test met the expected performance inmost aspects, except for linearity, that is under the reported range,and HbF interferences, detected for levels over 7.5%. There was a good concordance between the results of TINIAandVariant-IIt in thewhole range andwithHA-8160 only up to levels of 9%. Between-batch imprecision suggestsmore frequent calibrations than reported by the provider tomaintain variability within the limits established by
clinical practice guidelines.Conclusions: The assaymeets the necessary quality standards for routine use, as long aswe keep the analyt-ical variability within narrow limits. The results may be interchangeable with the tested HPLC systems, but HbFinterference is not detected and it happens at lower levels than reported.
© 2014 The Canadian Society of Clinical Chemists. Published by Elsevier Inc. All rights reserved.
Introduction
In this studywe evaluated themetrological characteristics of the de-termination of HbA1c from Roche Diagnostics by immunoturbidimetricinhibition method Gen.3, (TINIA), and our objective was the validationof its performance on the established recommendations [1] and com-pare it with the most common HPLC techniques (Adams Arkray HA-8160 and Bio-Rad Variant II turbo) in our country according to externalquality control (49% and 25%, respectively).
nito Godino).
ists. Published by Elsevier Inc. All rig
A, et al, Multicentre evaluatio16/j.clinbiochem.2014.04.006
Materials and methods
Themetrological performance of TINIA techniquewas evaluated andsubsequently compared with the two HPLC methods already men-tioned in six hospitals: Cádiz (C1); Granada (C2); Vélez-Málaga (C3);Cabra (C4), Huelva (C5) and Jaén (C6). All hospitals were using theAdam-Arkray HA-8160 from Menarini® except C4, which was usingthe Variant II turbo from BioRad®.
In all centres a basic preliminary study for the installation of the testwas carried out, following theNIST-NCCLS EP10-A2 guide [2]. In C1 a fullmetrological study of the technique was also carried out, following theguidelines NIST-NCCLS-EP-6A, EP5-A2 [2] for the study of linearity, pre-cision and accuracy and Peters and Westgard protocols for carry-overdetermination [3].
hts reserved.
n of glycated haemoglobin (HbA1c) of Roche Diagnostics in Andalusia,

Fig. 1. Raising differences in %HbA1c between TINIA and HPLC for increasing levels of%HbF.
2 A. Sáez-Benito Godino et al. / Clinical Biochemistry xxx (2014) xxx–xxx
HPLC was considered the reference method and a maximum differ-ence of 0,5% HbA1c between TINIA andHPLCwas established as our tar-get. The samples were processed first by HPLC, which uses the captubes, and in less than 2 h time were put through the Roche C6000.
Imprecision of TINIA-Gen3was expressed as the coefficient of varia-tion (CV%) for within-run and between-run studies. For this purpose,two levels of HbA1c control materials or Roche HbA1c and four levelsof HbA1c in patient samples were used.
Data analysis
Statistical analysiswas performed using SPSS 15.0 (SPSS Inc., Chicago,IL) and MedCalc statistical software. According to the Kolmogorov–Smirnoff–Lilliefors test, HbA1c showed not-normal distribution for allmethods, so that nonparametric tests were applied: Spearman correla-tion coefficient and Passing–Bablock regression, if permitted by theCusum test (p b 0.05). Concordance was evaluated between methodsby the Lin correlation coefficient and differences by the Bland–Altmangraphic method. The Jonckheere–Terpstra test was applied in the studyof interferences by foetal haemoglobin (HbF) to assess interquartiledifferences, since the categorical variable had an ordinal sense.
Calibrators and control samples
C.f.a.s HbA1c calibrator from Roche Diagnostics® and a system ofIFCC certified calibrators were used for linearity and retrieval studies.Normal and pathological controls provided by their manufacturerwere used for each system.
Study samples
Different samples sent for the control of glycaemic status, wereanalysed between July and August 2011, considering samples evenlydistributed throughout the range of linearity. Samples were processedon the same day by the two analyzers in each centre.
Interferences
We evaluated possible interferences selecting 35 samples whichpresented a high level of labile A1c (L-A1c), 29 samples with ahigh level of HbF and 36 samples of blood from carriers of different
Please cite this article as: Sáez-Benito Godino A, et al, Multicentre evaluatioClin Biochem (2014), http://dx.doi.org/10.1016/j.clinbiochem.2014.04.006
haemoglobin variants, all chosen from the chromatogram data mea-sured by HPLC.
Results
Imprecision
For patient levels of 5, 6, 7 and 8% HBA1c and low (5.4% A1c) andhigh (10.1% A1c) quality control samples, the intraserial and interserial%CVwere: 0.77; 1.23; 1.35; 1.01; 1.26; 1.43 and 2.38; 1.51; 1.76; 2.16; 2;1.71 respectively.
Linearity
Roche HbA1c reaction is linear in the studied range (graphic repre-sentation and r = 0.998), although lower than that reported by thesupplier.
Accuracy by recovery study
The level of recovery is good throughout the range of clinicaldecision, producing a small proportional systematic error, manifestedmainly at levels above 10% HbA1c. The coefficient of determination(r2) obtained was 0.9995, confirming the linearity of the technique inthat range (5.1 to 12.32%).
Carry-over
There is no carry-over between samples.
SelectivityDifferences between the two analytical methods were calculated
and the correlation with the concentration of L-A1c and HbF werestudied.
The results obtained for the regression line, Spearman's Rho coeffi-cient, coefficient of determination (r2) and Lin concordance coefficientfor samples with high levels of L-A1c or HbF are summarised in Table 1.
Interference by L-A1c
The results showed a lack of correlation between the obtained differ-ences between bothmethods and the high levels of L-A1c. Concordancewas only from moderate to substantial according to McBride's Scale.
Nevertheless more than 90% showed a negative difference betweenmethods higher than the mean difference obtained in the wholecomparison study, suggesting that there is a tendency to obtain highernegative differences between bothmethods in hyperglycaemic sampleswith L-A1c over 2%.
Interference by foetal Hb
There was a significant correlation between the differences betweenmethods and the level of HbF (Rho= 0.486, p= 0.008) (See Fig. 1.) andthe regression curve best fits to a cubic model (r2 = 0.34, p = 0.014).Therefore, the correlations between HbA1c and HbF were studied sepa-rately for each method, finding that the relation with HPLCwas not sig-nificant (Rho = −0.282, p = 0.139), whereas there was a significantrelation with TINIA (Rho = −0.425, p = 0.022).
Subsequently, differences between different quartiles were assessedby the Jonckheere–Terpstra test (p = 0.024), the largest differenceoccurring in the fourth quartile (Q4: N7.5%).
n of glycated haemoglobin (HbA1c) of Roche Diagnostics in Andalusia,
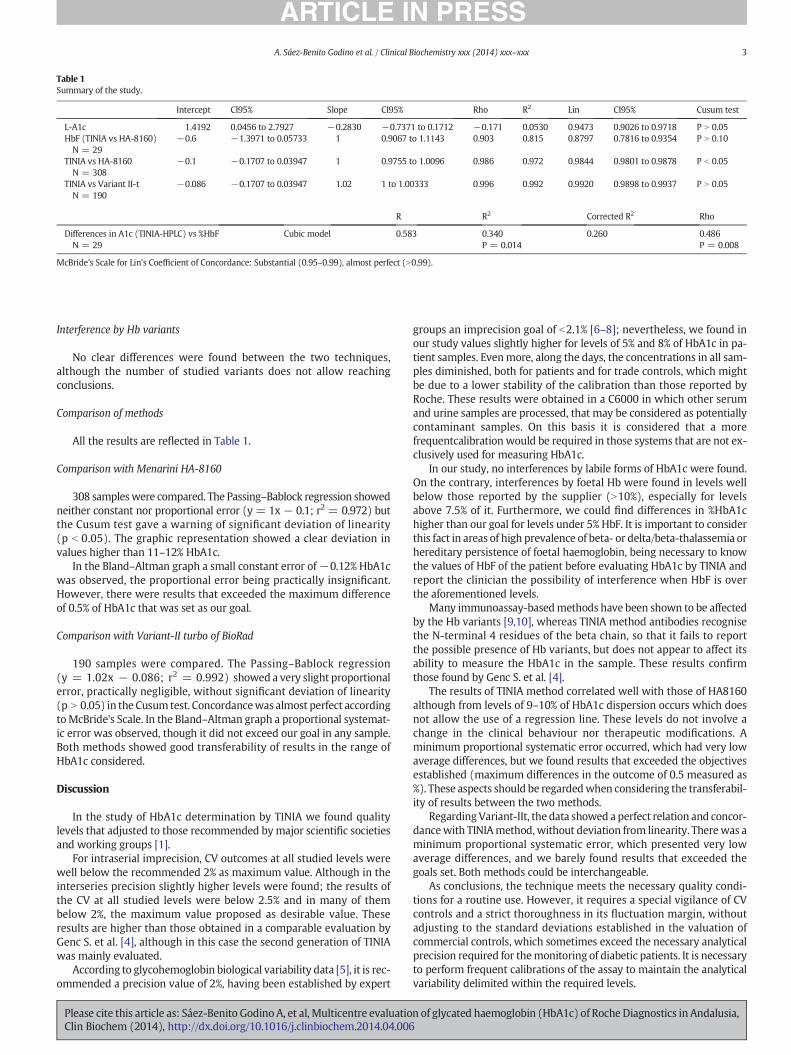
Table 1Summary of the study.
Intercept CI95% Slope CI95% Rho R2 Lin CI95% Cusum test
L-A1c 1.4192 0.0456 to 2.7927 −0.2830 −0.7371 to 0.1712 −0.171 0.0530 0.9473 0.9026 to 0.9718 P N 0.05HbF (TINIA vs HA-8160)N = 29
−0.6 −1.3971 to 0.05733 1 0.9067 to 1.1143 0.903 0.815 0.8797 0.7816 to 0.9354 P N 0.10
TINIA vs HA-8160N = 308
−0.1 −0.1707 to 0.03947 1 0.9755 to 1.0096 0.986 0.972 0.9844 0.9801 to 0.9878 P b 0.05
TINIA vs Variant II-tN = 190
−0.086 −0.1707 to 0.03947 1.02 1 to 1.00333 0.996 0.992 0.9920 0.9898 to 0.9937 P N 0.05
R R2 Corrected R2 Rho
Differences in A1c (TINIA-HPLC) vs %HbFN = 29
Cubic model 0.583 0.340P = 0.014
0.260 0.486P = 0.008
McBride's Scale for Lin's Coefficient of Concordance: Substantial (0.95–0.99), almost perfect (N0.99).
3A. Sáez-Benito Godino et al. / Clinical Biochemistry xxx (2014) xxx–xxx
Interference by Hb variants
No clear differences were found between the two techniques,although the number of studied variants does not allow reachingconclusions.
Comparison of methods
All the results are reflected in Table 1.
Comparison with Menarini HA-8160
308 sampleswere compared. The Passing–Bablock regression showedneither constant nor proportional error (y = 1x − 0.1; r2 = 0.972) butthe Cusum test gave a warning of significant deviation of linearity(p b 0.05). The graphic representation showed a clear deviation invalues higher than 11–12% HbA1c.
In the Bland–Altman graph a small constant error of−0.12% HbA1cwas observed, the proportional error being practically insignificant.However, there were results that exceeded the maximum differenceof 0.5% of HbA1c that was set as our goal.
Comparison with Variant-II turbo of BioRad
190 samples were compared. The Passing–Bablock regression(y = 1.02x − 0.086; r2 = 0.992) showed a very slight proportionalerror, practically negligible, without significant deviation of linearity(p N 0.05) in the Cusum test. Concordancewas almost perfect accordingtoMcBride's Scale. In the Bland–Altman graph a proportional systemat-ic error was observed, though it did not exceed our goal in any sample.Both methods showed good transferability of results in the range ofHbA1c considered.
Discussion
In the study of HbA1c determination by TINIA we found qualitylevels that adjusted to those recommended bymajor scientific societiesand working groups [1].
For intraserial imprecision, CV outcomes at all studied levels werewell below the recommended 2% as maximum value. Although in theinterseries precision slightly higher levels were found; the results ofthe CV at all studied levels were below 2.5% and in many of thembelow 2%, the maximum value proposed as desirable value. Theseresults are higher than those obtained in a comparable evaluation byGenc S. et al. [4], although in this case the second generation of TINIAwas mainly evaluated.
According to glycohemoglobin biological variability data [5], it is rec-ommended a precision value of 2%, having been established by expert
Please cite this article as: Sáez-Benito Godino A, et al, Multicentre evaluatioClin Biochem (2014), http://dx.doi.org/10.1016/j.clinbiochem.2014.04.006
groups an imprecision goal of b2.1% [6–8]; nevertheless, we found inour study values slightly higher for levels of 5% and 8% of HbA1c in pa-tient samples. Evenmore, along the days, the concentrations in all sam-ples diminished, both for patients and for trade controls, which mightbe due to a lower stability of the calibration than those reported byRoche. These results were obtained in a C6000 in which other serumand urine samples are processed, that may be considered as potentiallycontaminant samples. On this basis it is considered that a morefrequentcalibration would be required in those systems that are not ex-clusively used for measuring HbA1c.
In our study, no interferences by labile forms of HbA1c were found.On the contrary, interferences by foetal Hb were found in levels wellbelow those reported by the supplier (N10%), especially for levelsabove 7.5% of it. Furthermore, we could find differences in %HbA1chigher than our goal for levels under 5% HbF. It is important to considerthis fact in areas of high prevalence of beta- or delta/beta-thalassemia orhereditary persistence of foetal haemoglobin, being necessary to knowthe values of HbF of the patient before evaluating HbA1c by TINIA andreport the clinician the possibility of interference when HbF is overthe aforementioned levels.
Many immunoassay-basedmethods have been shown to be affectedby the Hb variants [9,10], whereas TINIA method antibodies recognisethe N-terminal 4 residues of the beta chain, so that it fails to reportthe possible presence of Hb variants, but does not appear to affect itsability to measure the HbA1c in the sample. These results confirmthose found by Genc S. et al. [4].
The results of TINIA method correlated well with those of HA8160although from levels of 9–10% of HbA1c dispersion occurs which doesnot allow the use of a regression line. These levels do not involve achange in the clinical behaviour nor therapeutic modifications. Aminimum proportional systematic error occurred, which had very lowaverage differences, but we found results that exceeded the objectivesestablished (maximum differences in the outcome of 0.5 measured as%). These aspects should be regardedwhen considering the transferabil-ity of results between the two methods.
RegardingVariant-IIt, the data showed a perfect relation and concor-dancewith TINIAmethod,without deviation from linearity. Therewas aminimum proportional systematic error, which presented very lowaverage differences, and we barely found results that exceeded thegoals set. Both methods could be interchangeable.
As conclusions, the technique meets the necessary quality condi-tions for a routine use. However, it requires a special vigilance of CVcontrols and a strict thoroughness in its fluctuation margin, withoutadjusting to the standard deviations established in the valuation ofcommercial controls, which sometimes exceed the necessary analyticalprecision required for themonitoring of diabetic patients. It is necessaryto perform frequent calibrations of the assay to maintain the analyticalvariability delimited within the required levels.
n of glycated haemoglobin (HbA1c) of Roche Diagnostics in Andalusia,

4 A. Sáez-Benito Godino et al. / Clinical Biochemistry xxx (2014) xxx–xxx
More studies would be required in carriers of HbF and structuralvariants to obtain conclusive results for TINIA.
Acknowledgements
This paper has been designed and developed under the supervisionof the Sociedad Andaluza de Análisis Clínicos (Andalusian Society of Clin-ical Analysis) and in centres belonging to the Andalusian Health Service(Servicio Andaluz de Salud). We are grateful to its president, Dr.Fernando Rodríguez Cantalejo, for his confidence in us to carry outthis paper.
We thank Dr. Dª. Ángeles Bailén García, director of the Unidad deGestión de Labortorios (Laboratory Management Unit) of the Hospitalde Cádiz, who allowed us to perform the evaluation in this laboratory.We also would like to thank the entire laboratory who participated in
the evaluation.We thank Dr. D. Jacobo Díaz Portillo for reviewing the statistical
methodology applied to the study and the results and conclusionsarisen therefrom.
Roche Diagnostic has provided the reagents necessary to carry outthe study.
The authors declare no conflict of interest.
Please cite this article as: Sáez-Benito Godino A, et al, Multicentre evaluatioClin Biochem (2014), http://dx.doi.org/10.1016/j.clinbiochem.2014.04.006
References
[1] Goodall I, Colman PG, Schneider HG, McLean M, Barker G. Desirable performancestandards for HbA(1c) analysis — precision, accuracy and standardisation: consen-sus statement of the Australasian Association of Clinical Biochemists (AACB), theAustralian Diabetes Society (ADS), the Royal College of Pathologists of Australasia(RCPA), Endocrine Society of Australia (ESA), and the Australian Diabetes EducatorsAssociation (ADEA). Clin Chem Lab Med 2007;45:1083–97.
[2] (NCCLS)(USA) NCCLS. Evaluation protocols; 1994.[3] JaWJ Peters T. Evaluation of methods. In: Tietz NorbertW, editor. Textbook of clinical
chemistry. Philadelphia: WB Saunders Company; 1986. p. 421.[4] Genc S, Omer B, Aycan-Ustyol E, Ince N, Bal F, Gurdol F. Evaluation of turbidimetric
inhibition immunoassay (TINIA) and HPLC methods for glycated haemoglobindetermination. J Clin Lab Anal 2012;26:481–5.
[5] Ricos C, Alvarez V, Cava F, Garcia−Lario JV, Hernandez A, Jimenez CV, et al. Currentdatabases on biologic variation: pros, cons and progress. Scand J Clin Lab Invest1999;59:491–500.
[6] Rohlfing Curt, H.-M.W., Little Randie, Lee Grotz V, Tennill Alethea, England Jack, et al.Biological variation of glycohemoglobin. Clin Chem 2002;48:1116–8.
[7] Larsen ML, Fraser CG, Petersen PH. A comparison of analytical goals forhaemoglobin A1c assays derived using different strategies. Ann Clin Biochem1991;28(Pt 3):272–8.
[8] Sacks DB, Arnold M, Bakris GL, Bruns DE, Horvath AR, Kirkman MS, et al. Guidelinesand recommendations for laboratory analysis in the diagnosis and management ofdiabetes mellitus. Diabetes Care 2011;34(6):e61–99.
[9] Bry L, Chem PC, Sacks DB. Effects of haemoglobin variants and chemically modifiedderivates on assays for glycohemoglobin. Clin Chem 2001;47:153–63.
[10] Sacks DB. Hemoglobin variants and haemoglobin A1c analysis: problems solved. ClinChem 2003;49:1245–7.
n of glycated haemoglobin (HbA1c) of Roche Diagnostics in Andalusia,