Multi-view Repetitive Structure Detection
8
Multi-view Repetitive Structure Detection Nianjuan Jiang Ping Tan Loong-Fah Cheong National University of Singapore Abstract Symmetry, especially repetitive structures in architecture are universally demonstrated across countries and cultures. Existing detection methods mainly focus on the detection of planar patterns from a single image. It is difficult to apply them to detect repetitive structures in architecture, which abounds with non-planar 3D repetitive elements (such as balconies and windows) and curved surfaces. We study the repetitive structure detection problem from multiple images of such architecture. Our method jointly analyzes these im- ages and a set of 3D points reconstructed from them by structure-from-motion algorithms. 3D points help to rec- tify geometric deformations and hypothesize possible lattice structures, while images provide denser color and texture information to evaluate and confirm these hypotheses. In the experiments, we compare our method with existing al- gorithm. We also show how our results might be used to assist image-based modeling. 1. Introduction Repetitive structures are commonly observed in archi- tecture. They can be utilized in architecture modeling to achieve data completion, refinement or compression as demonstrated in recent works [21, 31]. However, it is a dif- ficult problem to detect these structures automatically. Existing works on symmetry detection mainly focus on the detection of planar patterns from a single 2D image. There is a series of works, e.g. [14, 16, 11, 9, 22, 23, 12, 28], to categorize and detect symmetries. When the repetitive structure lies on a curved surface, the detection is compli- cated by the deformation of repetitive elements and their lattice structure. To handle this problem, Hays et al. [9] and Park et al. [22] iteratively rectify the surface and detect a lattice structure in the rectified surface. However, this si- multaneous estimation of deformation and lattice structure leads to complicated optimization. It is also difficult to ap- ply them to non-planar 3D repetitive elements. Real buildings often contain 3D repetitive structures such as balconies and windows. They can lie on curved building fac ¸ades, which makes the detection even harder. (a) (b) Figure 1. (a) Lattice detected by our method with curved surfaces and non-planar repetitive elements. (b) Top: the rectified image. The non-planar repetitive element makes the rectified image asym- metric. Bottom: the reconstructed 3D points are sparse and noisy. Some examples of such buildings are provided in Figure 1. Focusing on these challenging data, we study repetitive structuredetection from multiple images of the same scene. We employ the structure-from-motion algorithm to recon- struct 3D point cloud from these images. There are two na¨ ıve ways for repetitive structure detectionbased on our in- put. First, we might rectify these images and detect repeti- tive pattern in the rectified picture with conventional meth- ods. However, as shown at the top of Figure 1 (b), the non-planar repetitive elements (e.g. the red balconies) could make the rectified image asymmetric. Second, we might ap- ply 3D symmetry detection methods, e.g. [24, 19, 5], to the reconstructed 3D points. However, our points are too sparse and noisy, as shown at the bottom of Figure 1 (b), to apply these methods, which require local geometric features such as surface curvatures. Hence, we propose to jointly analyze the reconstructed points and the multi-view images for repetitive structure de- tection. We first identify repetitive 3D points according to their image appearance in multiple views. We then estimate the underlying surface of these points by assuming that they can be described by a ruled quadric model, and rectify it to a plane to facilitate the analysis. Translation and reflection symmetry are hypothesized from the 3D points in the rec- 1
Transcript of Multi-view Repetitive Structure Detection

Multi-view Repetitive Structure Detection
Nianjuan Jiang Ping Tan Loong-Fah CheongNational University of Singapore
Abstract
Symmetry, especially repetitive structures in architectureare universally demonstrated across countries and cultures.Existing detection methods mainly focus on the detection ofplanar patterns from a single image. It is difficult to applythem to detect repetitive structures in architecture, whichabounds with non-planar 3D repetitive elements (such asbalconies and windows) and curved surfaces. We study therepetitive structure detection problem from multiple imagesof such architecture. Our method jointly analyzes these im-ages and a set of 3D points reconstructed from them bystructure-from-motion algorithms. 3D points help to rec-tify geometric deformations and hypothesize possible latticestructures, while images provide denser color and textureinformation to evaluate and confirm these hypotheses. Inthe experiments, we compare our method with existing al-gorithm. We also show how our results might be used toassist image-based modeling.
1. Introduction
Repetitive structures are commonly observed in archi-tecture. They can be utilized in architecture modelingto achieve data completion, refinement or compression asdemonstrated in recent works [21, 31]. However, it is a dif-ficult problem to detect these structures automatically.
Existing works on symmetry detection mainly focus onthe detection of planar patterns from a single 2D image.There is a series of works, e.g. [14, 16, 11, 9, 22, 23, 12, 28],to categorize and detect symmetries. When the repetitivestructure lies on a curved surface, the detection is compli-cated by the deformation of repetitive elements and theirlattice structure. To handle this problem, Hays et al. [9] andPark et al. [22] iteratively rectify the surface and detect alattice structure in the rectified surface. However, this si-multaneous estimation of deformation and lattice structureleads to complicated optimization. It is also difficult to ap-ply them to non-planar 3D repetitive elements.
Real buildings often contain 3D repetitive structuressuch as balconies and windows. They can lie on curvedbuilding facades, which makes the detection even harder.
(a) (b)Figure 1. (a) Lattice detected by our method with curved surfacesand non-planar repetitive elements. (b) Top: the rectified image.The non-planar repetitive element makes the rectified image asym-metric. Bottom: the reconstructed 3D points are sparse and noisy.
Some examples of such buildings are provided in Figure1.Focusing on these challenging data, we study repetitivestructuredetection from multiple images of the same scene.We employ the structure-from-motion algorithm to recon-struct 3D point cloud from these images. There are twonaıve ways for repetitive structure detectionbased on our in-put. First, we might rectify these images and detect repeti-tive pattern in the rectified picture with conventional meth-ods. However, as shown at the top of Figure1 (b), thenon-planar repetitive elements (e.g. the red balconies) couldmake the rectified image asymmetric. Second, we might ap-ply 3D symmetry detection methods, e.g. [24, 19, 5], to thereconstructed 3D points. However, our points are too sparseand noisy, as shown at the bottom of Figure1 (b), to applythese methods, which require local geometric features suchas surface curvatures.
Hence, we propose to jointly analyze the reconstructedpoints and the multi-view images for repetitive structure de-tection. We first identify repetitive 3D points according totheir image appearance in multiple views. We then estimatethe underlying surface of these points by assuming that theycan be described by a ruled quadric model, and rectify it toa plane to facilitate the analysis. Translation and reflectionsymmetry are hypothesized from the 3D points in the rec-
1
tified surface, and then validated in the images to make itrobust to noisy 3D points. The detected repetitive structurecan help us to enhance the quality of the reconstructed 3Dpoints, which can benefit image-based modeling works like[29, 30].
2. Related Works
Many symmetry detection algorithms have been pro-posed. Most of them [26, 14, 25, 15, 18, 11] focused onplanar patterns. These methods can be regarded as lo-cal or global according to their methodologies. Local ap-proaches like [25, 18, 15] extract a sparse set of correspond-ing features and hypothesize symmetry foci from pair-wisematches. These symmetry foci are then identified either viasome voting schemes in a Hough transform fashion [25, 18]or exhaustive search in the parameter space [15]. Globalapproaches use autocorrelation [14], the Fourier transform[11], or co-occurrence matrices [26] for discovering peri-odic patterns. All these methods share a common disadvan-tage in that both the repetitive elements and the underlyingsurface of these elements are assumed to be mostly flat andfrontoparallel in the image. Hence, they can hardly be ap-plied to our data.
When a planar pattern is imaged from a slanted view-point, there is significant foreshortening effect. Corneliusand Loy [6] proposed a method to detect planar bilateralsymmetry under such kind of perspective distortions. Wuet al. [28] rectified images according to vanishing pointsto facilitate repetitive structure detection. It is more chal-lenging when the repetitive pattern lies on a curved sur-face, which causes spatially variant deformation. Hays etal. [9] iteratively rectified and estimated the topological lat-tice. This was further extended in [22] with the mean-shiftbelief propagation method to optimize the position of all lat-tice grids together. However, these methods require compli-cated optimization. Furthermore, they do not consider non-planar 3D repetitive elements, which are common in realbuildings. In comparison, we utilize multiple images and3D information from multi-view reconstructions for non-planar repetitive structure detection.
There are also a number of methods to detect symmetryin 3D data. Pauly et al. [24] and Mitra et.al. [19] esti-mated symmetry of dense laser scanned 3D data by analyz-ing its geometric signatures such as curvatures and tangentcoordinate systems. In comparison, Bokeloh et al. [2] de-signed a novel ‘line features’ for symmetry detection. Ina recent work, Bokeloh et al. [3] further applied the de-tected symmetries for inverse procedure modeling. Combeset.al [5] computed the symmetry plane of bilateral objectsfrom laser scanned point clouds. Thrun and Wegbreit [27]searched for symmetries based on a hierarchical generate-and-test procedure. All these works require dense 3D pointclouds for symmetry detection. Though we reconstruct 3D
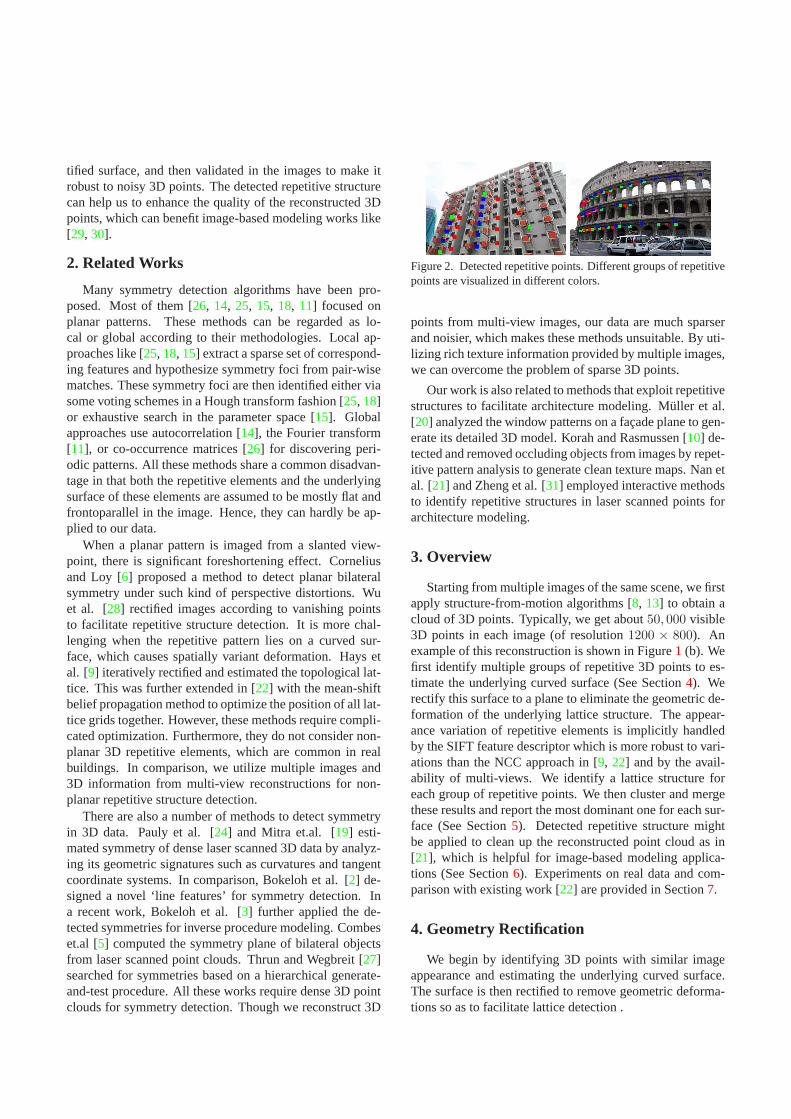
Figure 2. Detected repetitive points. Different groups of repetitivepoints are visualized in different colors.
points from multi-view images, our data are much sparserand noisier, which makes these methods unsuitable. By uti-lizing rich texture information provided by multiple images,we can overcome the problem of sparse 3D points.
Our work is also related to methods that exploit repetitivestructures to facilitate architecture modeling. Muller et al.[20] analyzed the window patterns on a facade plane to gen-erate its detailed 3D model. Korah and Rasmussen [10] de-tected and removed occluding objects from images by repet-itive pattern analysis to generate clean texture maps. Nan etal. [21] and Zheng et al. [31] employed interactive methodsto identify repetitive structures in laser scanned points forarchitecture modeling.
3. Overview
Starting from multiple images of the same scene, we firstapply structure-from-motion algorithms [8, 13] to obtain acloud of 3D points. Typically, we get about50, 000 visible3D points in each image (of resolution1200 × 800). Anexample of this reconstruction is shown in Figure1 (b). Wefirst identify multiple groups of repetitive 3D points to es-timate the underlying curved surface (See Section4). Werectify this surface to a plane to eliminate the geometric de-formation of the underlying lattice structure. The appear-ance variation of repetitive elements is implicitly handledby the SIFT feature descriptor which is more robust to vari-ations than the NCC approach in [9, 22] and by the avail-ability of multi-views. We identify a lattice structure foreach group of repetitive points. We then cluster and mergethese results and report the most dominant one for each sur-face (See Section5). Detected repetitive structure mightbe applied to clean up the reconstructed point cloud as in[21], which is helpful for image-based modeling applica-tions (See Section6). Experiments on real data and com-parison with existing work [22] are provided in Section7.
4. Geometry Rectification
We begin by identifying 3D points with similar imageappearance and estimating the underlying curved surface.The surface is then rectified to remove geometric deforma-tions so as to facilitate lattice detection .

4.1. Repetitive Points Identification
We use the SIFT features [17] already extracted for 3Dreconstruction. We associate each reconstructed 3D pointwith these features in multiple images where it is visible.We exhaustively check all pairs of SIFT descriptors fromdifferent 3D points. Repetitive points are identified if theangle between their descriptors is smaller than a threshold�1 (20 degrees, in our implementation).
We consider the matching of repetitive points as anequivalence relationship. In other words, if two points bothmatch with a third point, we also consider these two pointsas matched repetitive points. At the end of this step, wehave repetitive 3D points in different groups according totheir image appearance. Some of the detected repetitivepoints are shown in Figure2. Points from the same groupare marked in the same color.
4.2. Structure Estimation
These repetitive points could lie on a curved surface,which causes geometric deformation of the lattice structureand complicates the detection. We recover and rectify thissurface to facilitate the detection. We assume this surfaceiseither a plane or a ruled quadric, which is true for most realbuildings.
We apply RANSAC [7] to fit either a quadric or a planeto each group of 3D points and select the model with mostinliers. For every nine sampled points that pass the degen-eracy testing, we fit a quadric using the normalized linearsolution. The quadric is further converted to its canonicalform and classified into ruled quadric, degenerate quadricand general quadric based on rough rank estimation. Wekeep only ruled quadrics to describe points on curved sur-faces, and the rest will be described using planes.
Different point groups (e.g. different corners on therepetitive balconies) often lie on similar surfaces that dif-fer from each other by a small translation. We cluster thesegroups together. Ruled quadrics and planes are clusteredseparately. For this clustering, we simply stack all the 16elements inQ or the normal of the planes to characterize agroup. Two groups are clustered together if their 3D pointconstellations are close in space and their normalized para-metric model vectors span an angle less than�2. (We fix itat 2 degrees in our implementation.)
The surface fitting can then be refined from multiplegroups. Suppose the groupsg1, g2, ⋅ ⋅ ⋅ , gN are clustered to-gether. We refine the surfaceS, a ruled quadric or a plane,by minimizing the following objective function
N∑
i=1
∑
p∈gi
R(p− di,S). (1)
Here,R(x,S) is the algebraic distance between a 3D pointx to the surfaceS. di is a translation in 3D space, which
(a) (b)Figure 3. Surface fitted to multiple groups of repetitive 3D points.
allows the surface of different groups to differ from eachother by a translation. This minimization is solved in aniterative fashion. In each iteration, we first fix alldi to esti-mateS and then fixS to estimatedi for each group respec-tively. Both estimations only involve a linear equation andthe whole process converges quickly. We begin this itera-tive fitting by lettingdi equal to zero. Some surface fittingresults are illustrated in Figure3. These surfaces are thenrectified to a plane to facilitate the analysis.
5. Joint Repetitive Structure Detection
We jointly analyze the reconstructed point cloud andmulti-view images for repetitive structure detection. We use3D points to initialize repetitive structure hypotheses andverify them in images. Note that after we rectify the curvedsurface, like in the case of the Rome Colosseum example,the original rotational symmetry becomes a translationalsymmetry. Hence, we only consider points that are relatedby translations or reflections in the rectified surface. Thistreatment of rotational symmetries is more general than thatin [24], which estimates a 3D rotation axis and an angularinterval and cannot handle elliptic cylinders like the RomeColosseum example.
5.1. Translational Lattice Detection
We first detect the underlying lattice for each group ofpoints. We then consolidate these results to choose the mostreliable parametric model for all groupsg1, g2, ⋅ ⋅ ⋅ , gN thatshare the same surfaceS.
Lattice initialization The 2D lattice structure is charac-terized by its two basis vectors. In the rectified surface, wecheck all pairs of repetitive points within a group, and com-pute a translation between each pair. A naıve lattice detec-tion is to select the highest two local peaks in the histogramof these translations as the basis vectors. However, its per-formance is poor because the reconstructed 3D points arequite sparse and noisy. We treat these local peaks as candi-date basis vectors and verify them according to the imagesas detailed below. An example histogram is provided in thefirst row of Figure4.
Lattice validation To verify a basis vector, we select a3D point as reference. Multiple grid points can be predicted

Figure 4. Top row: the histogram of pairwise translations and thedetected lattice from this raw histogram. Bottom row: the imagevalidation score of pairwise translations and the detected latticefrom this score. In both rows, the two selected lattice basis vectorsare circled in red. Note that in the original histogram space, one ofthe correct basis vectors has very low vote.
Figure 5. The red cross is a reference point. Blue and white circlesindicate valid and invalid grid points. The SIFT descriptor of eachpoint is obtain from its own most frontoparallel image. The twogreen cross are the two farthest reconstructed points on the grid,which help to decide the width of the grid.
on the line passing through the reference point along the di-rection of that vector. We compare the SIFT descriptors ofthese grid points to that of the reference point. If the anglebetween them is smaller/larger than2�1 1, we consider thegrid point is valid/invalid. To handle appearance variationcaused by foreshortening, the SIFT descriptor of a point iscomputed in its most frontoparallel image, which is the onewhere the line connecting the camera center and that pointis closest to the local orientation of the curved surface. Thisis illustrated in Figure5, where the red crosses are the refer-ence points, blue and white circles are valid and invalid gridpoints. The SIFT descriptors of the reference point and thegrid points are computed from different images.
For each basis vector, we exhaustively check all refer-ence points and define its image validation score as the totalnumber of valid grid points. However, this score defini-tion can be biased by directions with large number of rep-etitions, e.g. the vertical direction in tall building faca¸des.
1We use a looser threshold than the one in the detection of repetitive3D points.
Figure 6. The red cross is a reference 3D point. Blue and whitecircles indicate valid and invalid grid points. The grid is extendedone row in the top. Only one of the extended grid points is valid.
Hence, instead of using the number of valid grid points, weuse the ratio between this number and the total number ofgrid points within a boundary. The sum of this ratio overall reference points is defined as the image validation scoreof a basis vector. To decide this boundary, as illustrated inFigure5, We search for two farthest reconstructedon-grid3D points located on both sides of the reference point inthe feature group. We consider a point to be on-grid if thedistance between it and certain grid point is smaller than athresholdT1 (10% of the basis vector length). Starting fromthese two initial points, we move them away from the refer-ence point along the line until a significant portionT2 (50%in our experiments) of the grid points within them are in-valid. We then trim all the invalid grid points at both endsto obtain the grid’s boundary.
After calculating an image validation score for all candi-date basis vectors as shown in the second row of Figure4,we can choose two of them to form the lattice structure. Wesort these vectors in descending order of their lengths, andanalyze them from top to bottom of the queue one by one.A vector with longer length is discarded, if it can be repre-sented as an integer combination of the rest of the queue. Iftwo vectors are along the same direction, we only keep theone with higher score. Finally, we select two vectors withhighest score from the remaining ones.
Lattice bundary estimation Once the two basis vectorsare selected, we proceed to generate the lattice grids. Themain challenge here is to decide a precise boundary of thelattice. We start from a 3D point and expand the grid by onerow/column at a time, as shown in Figure6. If the propor-tion of invalid points in an expanded row/column exceedsthe significance thresholdT2, we stop and try to expandalong the other directions. The lattice is finalized once allfour directions cannot be expanded.
Lattice consolidation In real buildings, all the repetitivepoint groups on the same curved surface (e.g., differentgroups of repetitive corners on balconies) share the samelattice structure. Hence, we can consolidate the detectionamong these groups and generate one final result for eachsurface. We form multiple clusters of lattice structures. Twolattices are clustered together if the difference between theirtranslation vectors is smaller than the thresholdT1. Among
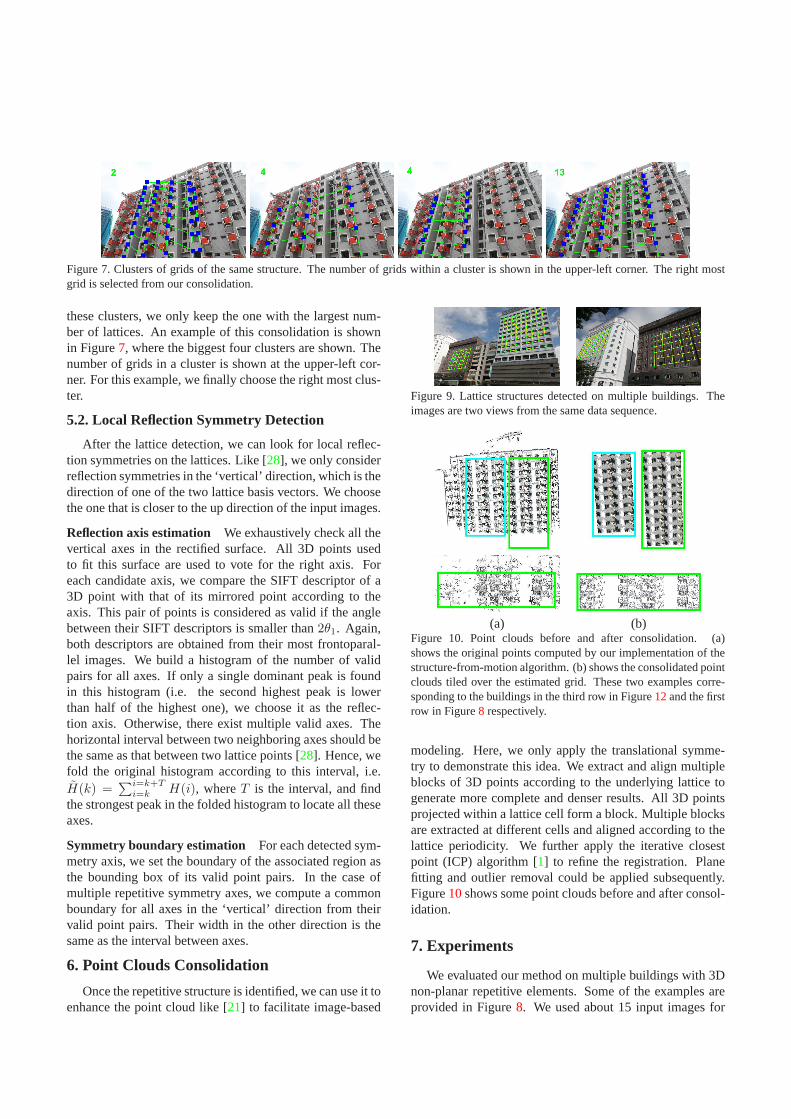
Figure 7. Clusters of grids of the same structure. The number of grids within a cluster is shown in the upper-left corner. The right mostgrid is selected from our consolidation.
these clusters, we only keep the one with the largest num-ber of lattices. An example of this consolidation is shownin Figure7, where the biggest four clusters are shown. Thenumber of grids in a cluster is shown at the upper-left cor-ner. For this example, we finally choose the right most clus-ter.
5.2. Local Reflection Symmetry Detection
After the lattice detection, we can look for local reflec-tion symmetries on the lattices. Like [28], we only considerreflection symmetries in the ‘vertical’ direction, which isthedirection of one of the two lattice basis vectors. We choosethe one that is closer to the up direction of the input images.
Reflection axis estimation We exhaustively check all thevertical axes in the rectified surface. All 3D points usedto fit this surface are used to vote for the right axis. Foreach candidate axis, we compare the SIFT descriptor of a3D point with that of its mirrored point according to theaxis. This pair of points is considered as valid if the anglebetween their SIFT descriptors is smaller than2�1. Again,both descriptors are obtained from their most frontoparal-lel images. We build a histogram of the number of validpairs for all axes. If only a single dominant peak is foundin this histogram (i.e. the second highest peak is lowerthan half of the highest one), we choose it as the reflec-tion axis. Otherwise, there exist multiple valid axes. Thehorizontal interval between two neighboring axes should bethe same as that between two lattice points [28]. Hence, wefold the original histogram according to this interval, i.e.H(k) =
∑i=k+T
i=k H(i), whereT is the interval, and findthe strongest peak in the folded histogram to locate all theseaxes.
Symmetry boundary estimation For each detected sym-metry axis, we set the boundary of the associated region asthe bounding box of its valid point pairs. In the case ofmultiple repetitive symmetry axes, we compute a commonboundary for all axes in the ‘vertical’ direction from theirvalid point pairs. Their width in the other direction is thesame as the interval between axes.
6. Point Clouds Consolidation
Once the repetitive structure is identified, we can use it toenhance the point cloud like [21] to facilitate image-based
Figure 9. Lattice structures detected on multiple buildings. Theimages are two views from the same data sequence.
(a) (b)Figure 10. Point clouds before and after consolidation. (a)shows the original points computed by our implementation of thestructure-from-motion algorithm. (b) shows the consolidated pointclouds tiled over the estimated grid. These two examples corre-sponding to the buildings in the third row in Figure12and the firstrow in Figure8 respectively.
modeling. Here, we only apply the translational symme-try to demonstrate this idea. We extract and align multipleblocks of 3D points according to the underlying lattice togenerate more complete and denser results. All 3D pointsprojected within a lattice cell form a block. Multiple blocksare extracted at different cells and aligned according to thelattice periodicity. We further apply the iterative closestpoint (ICP) algorithm [1] to refine the registration. Planefitting and outlier removal could be applied subsequently.Figure10shows some point clouds before and after consol-idation.
7. Experiments
We evaluated our method on multiple buildings with 3Dnon-planar repetitive elements. Some of the examples areprovided in Figure8. We used about 15 input images for

Figure 8. Results of repetitive structure detection. (a) and (b) are the left most and right most views of all input images. The detectedrepetitive points are overlaid on the image (the same group of repetitive points are visualized in the same color). (c) and (d) show thedetected lattice and local reflection symmetry respectively.
each example2. As a rough average, our 3D reconstruc-tion algorithm reconstructed about 100,000 points for eachexample and 50,000 visible points for each image, whichis quite sparse compared with the image resolution, about1200×800 pixels in our experiments. The first two columnsof Figure8 show the left most and right most views of eachbuilding. The matched repetitive points are overlaid in theseimages, where points of the same color are from the samegroup. Typically, our program identified about 50 groupsof repetitive points on each example. The detected latticeis shown in (c). For each example, we provide a few (1-3)
2This is not a guideline on the number of views that should be used. Aslong as reasonable reconstruction can be obtained, one can use as few astwo views.
different lattice that share the same basis vectors. In theseexamples (especially the first three rows), the repetitive el-ements are clearly non-planar. Yet our algorithm still cor-rectly identified the lattice. The detected reflection symme-try is visualized in (d). The reflection axis is shown in greenand the boundary is indicated by a yellow box. Note thatour method works for images with multiple buildings, seeFigure9. Furthermore, we apply RANSAC iteratively forsurface detection within a repetitive point group, repetitivestructure on multiple similar buildings can also be detected,e.g. the first example in Figure12..
Additional results are reported in Figure12. In theseexamples, (a) shows one of the input image with detectedrepetitive points. (b) is the estimated surfaces. To demon-

(a) (b) (c)Figure 11. The first row is the lattice detected by our method, andthe second row is that by [22]. (a)both methods detected correctlattice. (b)our method detected partial lattice and [22] detectedwrong lattice. (c)our method outperformed [22] in this case.
strate the potential in image-based modeling, we furthermanually create a mesh for one repetitive element accord-ing to its consolidated 3D point cloud3. This mesh is thentiled over the lattice to generate the result shown in (d).
Comparison with [22] We compared our method with[22] on 16 different scenes with 373 images in total. Weused the code provided by the authors. Some detection re-sults from both methods are provided in Figure11. It isclear that [22] tends to fail when the repetitive element re-sides on a non-planar surface. We consider the detectiona failure if a)no lattice is detected. b)wrong basis vectorsare detected. or c)the detected lattice region is less than30% of the actual one in the image. We evaluate the per-formance of both methods by two different counting rules:1)use each image as a data sample. 2)use each sequenceas a data sample, and score according to the best result inthe sequence. Our method succeeds in 81 and 100 percentof these images, respectively. In comparison, the methodin [22] can only handle 22 and 75 percent of the data, re-spectively4. We believe the strength of our method stemsfrom the joint analysis of multi-view images and the recon-structed 3D points.
Point cloud consolidation To exemplify the point cloudconsolidation, we provide examples before and after con-solidation in Figure10. It is clear that the original recon-structed points are much sparser with many holes. In com-parison, the consolidated results capture the shape detailmuch better. These examples correspond to the buildingsin the third row in Figure12 and the first row in Figure8respectively. Please refer to their pictures to verify the geo-metric details.
3Note that this element could be automatically generated by applyingmethods like [4].
4Refer to supplementary data for detailed results.
8. Conclusion and Discussion
We present a method to detect architecture symmetriesfrom multi-view images. Our method jointly analyzes theseimages and a cloud of 3D points reconstructed from them.We fit quadrics or planes to these 3D points to initializerepetitive structure detections and verify these initializa-tions according to images which contain dense color andtexture information. The fitting works well most of the time,though it confuses shallowly curved surfaces with planessometimes. Our method contains a number of thresholds,i.e. �1, �2, T1, T2, to decide if two SIFT features are similar,and if two groups are close to each other. However, since weapply them on normalized data, these parameters are easy toset and they are all fixed in our experiments. Thus, we con-clude that the use of multiple views and joint analysis of 2Dand 3D information make the algorithm capable of handlingchallenging data.
Acknowledgements
We thank the anonymous reviewers for their valuablefeedbacks and Han Shuchu for his technique assistance.This work was supported by the Singapore grant R-705-000-018-279, R-263-000-555-112 and R-263-000-620-112.
References
[1] P. J. Besl and N. D. McKay. A method for registration of 3-dshapes.IEEE Trans. Pattern Anal. Mach. Intell., 14(2):239–256, 1992.5
[2] M. Bokeloh, A. Berner, M. Wand, H.-P. Seidel, andA. Schilling. Symmetry detection using feature lines.Com-puter Graphics Forum, 28, 2009.2
[3] M. Bokeloh, M. Wand, and H.-P. Seidel. A connection be-tween partial symmetry and inverse procedural modeling.ACM Trans. Graph. (Proc. of SIGGRAPH), 29, 2010.2
[4] A. Chauve, P. Labatut, and J. Pons. Robust piecewise-planar3d reconstruction and completion from large-scale unstruc-tured point data. InProc. of CVPR, 2010.7
[5] B. Combes, R. Hennessy, J. Waddington, N. Roberts, andS. Prima. Automatic symmetry plane estimation of bilateralobjects in point clouds. InProc. of CVPR, 2008.1, 2
[6] H. Cornelius and G. Loy. Detecting bilateral symmetry inperspective. InProc. of CVPR Workshop, 2006.2
[7] M. A. Fischler and R. C. Bolles. Random sample consensus:a paradigm for model fitting with applications to image anal-ysis and automated cartography.Commun. ACM, 24(6):381–395, 1981.3
[8] R. Hartley and A. Zisserman.Multiple View Geometry inComputer Vision. Cambridge University Press, New York,NY, USA, 2003.2
[9] J. Hays, M. Leordeanu, A. A. Efros, and Y. Liu. Discoveringtexture regularity as a higher-order correspondence problem.In Proc. of ECCV, 2006.1, 2
[10] T. Korah and C. Rasmussen. Analysis of building textures forreconstructing partially occluded facades. InProc. of ECCV,2008.2

Figure 12. Additional results. (a) shows one of the input images with detected repetitive points (the same group of repetitive points arevisualized in the same color). The underlying surface of these feature points is visualized in (b). (c) shows the estimated lattice. (d) is the3D model of the surface.
[11] S. Lee, R. T. Collins, and Y. Liu. Rotation symmetry groupdetection via frequency analysis of frieze-expansions. InProc. of CVPR, 2008.1, 2
[12] S. Lee and Y. Liu. Skewed rotation symmetry group detec-tion. IEEE Trans. Pattern Anal. Mach. Intell., 2010.1
[13] M. Lhuillier and L. Quan. Match propagation for image-based modeling and rendering.IEEE Trans. Pattern Anal.Mach. Intell., 24(8):1140–1146, 2002.2
[14] Y. Liu, R. T. Collins, and Y. Tsin. A computational modelfor periodic pattern perception based on frieze and wallpapergroups.IEEE Trans. Pattern Anal. Mach. Intell., 26(3):354–371, 2004.1, 2
[15] Y. Liu, J. Hays, Y. Xu, and H. Shum. Digital papercutting.In SIGGRAPH Technical Sketch, 2005.2
[16] Y. Liu, W.-C. Lin, and J. Hays. Near-regular texture analysisand manipulation.ACM Trans. Graph., 23:368–376, August2004.1
[17] D. G. Lowe. Distinctive image features from scale-invariantkeypoints.Int. J. Comput. Vision, 60(2):91–110, 2004.3
[18] G. Loy and J. Eklundh. Detecting symmetry and symmetricconstellations of features. InProc. of ECCV, 2006.2
[19] N. J. Mitra, L. J. Guibas, and M. Pauly. Partial and ap-proximate symmetry detection for 3d geometry.ACM Trans.Graphics (Proc. of SIGGRAPH), 2006.1, 2
[20] P. Muller, G. Zeng, P. Wonka, and L. Van Gool. Image-basedprocedural modeling of facades.ACM Trans. Graph. (Proc.of SIGGRAPH), 26(3):85, 2007.2
[21] L. Nan, A. Sharf, H. Zhang, D. Cohen-Or, and B. Chen.Smartboxes for interactive urban reconstruction.ACM Trans.Graphics (Proc. of SIGGRAPH), 2010.1, 2, 5
[22] M. Park, K. Brocklehurst, R. T. Collins, and Y. Liu. De-formed lattice detection in real-world images using mean-
shift belief propagation.IEEE Trans. Pattern Anal. Mach.Intell., 2009.1, 2, 7
[23] M. Park, K. Brocklehurst, R. T. Collins, and Y. Liu.Translation-symmetry-based perceptual grouping with appli-cations to urban scenes. InACCV (3), pages 329–342, 2010.1
[24] M. Pauly, N. J. Mitra, J. Wallner, H. Pottmann, and L. J.Guibas. Discovering structural regularity in 3d geometry.ACM Trans. Graphics (Proc. of SIGGRAPH), 2008.1, 2, 3
[25] V. S. N. Prasad and L. S. Davis. Detecting rotational sym-metries. InProc. of ICCV, 2005.2
[26] V. Starovoitov, S. Jeong, and R. Park. Texture periodic-ity detection: Features, properties, and comparisons.IEEETrans. Systems, Man and Cybernetics, Part A, 28(6):839 –848, 1998.2
[27] S. Thrun and B. Wegbreit. Shape from symmetry. InProc.of ICCV, pages 1824–1831, 2005.2
[28] C. Wu, J.-M. Frahm, and M. Pollefeys. Detecting large repet-itive structures with salient boundaries. InProc. of ECCV,2010.1, 2, 5
[29] J. Xiao, T. Fang, P. Tan, P. Zhao, E. Ofek, and L. Quan.Image-based facade modeling.ACM Trans. Graph. (Proc.of SIGGRAPH Asia), 27(5):1–10, 2008.2
[30] J. Xiao, T. Fang, P. Zhao, M. Lhuillier, and L. Quan. Image-based street-side city modeling.ACM Trans. Graphics (Proc.of SIGGRAPH Asia), 2009.2
[31] Q. Zheng, A. Sharf, G. Wan, Y. Li, N. J. Mitra, D. Cohen-Or, and B. Chen. Non-local scan consolidation for 3d urbanscenes.ACM Trans. Graphics (Proc. of SIGGRAPH), 2010.1, 2