Multi-Vendor RTU Retrofit Controller Field Study Final Report
50
SAN DIEGO GAS AND ELECTRIC COMPANY EMERGING TECHNOLOGIES PROGRAM PROJECT ID ET12SDGE0003 MULTI-VENDOR RTU RETROFIT CONTROLLER FIELD STUDY FINAL REPORT PREPARED FOR KATE ZENG, NATHAN TAYLOR SAN DIEGO GAS AND ELECTRIC COMPANY 8306 CENTURY PARK COURT SAN DIEGO, CA 92123 PREPARED BY BO WHITE, MARC ESSER NEGAWATT CONSULTING, INC. WWW.NEGAWATTCONSULT.COM 11/12/2013
Transcript of Multi-Vendor RTU Retrofit Controller Field Study Final Report

MULTI-VENDOR RTU RETROFIT CONTROLLER FIELD STUDY FINAL REPORT NEGAWATT CONSULTING
Page 1 of 50
SAN DIEGO GAS AND ELECTRIC COMPANY
EMERGING TECHNOLOGIES PROGRAM
PROJECT ID ET12SDGE0003
MULTI-VENDOR RTU RETROFIT
CONTROLLER FIELD STUDY FINAL REPORT
PREPARED FOR KATE ZENG, NATHAN TAYLOR
SAN DIEGO GAS AND ELECTRIC COMPANY
8306 CENTURY PARK COURT
SAN DIEGO, CA 92123
PREPARED BY BO WHITE, MARC ESSER
NEGAWATT CONSULTING, INC.
WWW.NEGAWATTCONSULT.COM
11/12/2013

MULTI-VENDOR RTU RETROFIT CONTROLLER FIELD STUDY FINAL REPORT NEGAWATT CONSULTING
Page 2 of 50
Acknowledgements
San Diego Gas and Electric Company (SDG&E) and the authors of this report would like to acknowledge
the assistance and cooperation of our host site EMD Millipore (Sorrento Valley, San Diego, CA) and their
knowledgeable staff that went out of their way to allow for our onsite testing and interviews. We would
also like to thank the technology vendors that we evaluated, for their contributions above and beyond,
and for their willingness to share more details about their products and services than the average
customer would ever want to know.
Project Team
SDG&E- Kate Zeng, Emerging Technologies Program Manager; Nate Taylor, Project Manager
Host Site Staff- Tony Williams, Joel Oropesa, & Mando Zapanta: Facility Management
NegaWatt Consulting- Bo White, Project Engineer; Marc Esser, Principal
Disclaimer
While SDG&E and the authors of this report did their best to come up with sensible results and
recommendations, this report is provided as-is. The models, figures, formulas, and recommendations
may not be appropriate or accurate for some situations. It is the reader’s responsibility to verify this
report, and apply the findings appropriately when used in other settings or context. Readers are
responsible for all decisions and actions taken based on this report and for all consequences thereof.

MULTI-VENDOR RTU RETROFIT CONTROLLER FIELD STUDY FINAL REPORT NEGAWATT CONSULTING
Page 3 of 50
Executive Summary Four different retrofit RTU controllers were tested on four 7.5 ton heat pumps serving office space at
one building in San Diego. The operation of those units was alternated on a weekly basis from baseline
to retrofit mode. Proper operation of the each controller was verified and the features of the controllers
were compared to each other. Total heat pump electric power was measured at 1 minute intervals. The
data was then resampled at hourly and daily intervals and was compared to various independent
variables. Linear regression models were created to normalize for those independent variables and
energy savings was calculated. The energy savings results and modeling statistics are shown in Figure 1.
One of the four controllers was omitted because of unforeseen circumstances. The other three
controllers performed as expected when compared to the vendor’s claims and the existing research.
The market opportunity, applicable codes and standards, cost-influencing factors, customer feedback,
applicable incentive programs, error analysis, benefits, and risks were also studied. A major finding was
that substantial re-commissioning of the existing equipment and control system might be necessary to
ensure proper controller operation. These controllers add energy saving features to less efficient
constant speed equipment but they do not inherently fix all existing problems.
Unit #, Baseline/Retrofit, Heat/Cool
Independent Variable(s)
R² CVRMSE # of Observations
Date Filtering RTU Energy Savings
HP-17, Baseline, Cooling Daily outside dry bulb temperature
0.78 0.27 77 Business days after 9/2/2012
HP-17, Retrofit, Cooling 0.81 0.37 89 24%
HP-17, Baseline, Heating 0.78 0.40 62
HP-17, Retrofit, Heating 0.72 0.47 54 26%
HP-17, Annual Total 26%
HP-26, Baseline, Cooling Daily outside dry bulb temperature
0.82 0.14 40 Business days after 1/11/2013
HP-26, Retrofit, Cooling 0.85 0.13 50 18%
HP-26, Baseline, Heating 0.82 0.25 30
HP-26, Retrofit, Heating 0.72 0.20 27 3%
HP-26, Annual Total 13%
HP-27, Baseline, Cooling Daily outside dry bulb temperature
0.83 0.15 41 Business days after 2/15/2013
HP-27, Retrofit, Cooling 0.81 0.24 63 27%1
HP-27, Baseline, Heating N/A N/A N/A
HP-27, Retrofit, Heating N/A N/A N/A N/A2
HP-27, Annual Total N/A2 Figure 1: Statistics & Savings Calculations
1 Please note that the economizer appeared to be malfunctioning and was not corrected for. 2 Insufficient heating data

MULTI-VENDOR RTU RETROFIT CONTROLLER FIELD STUDY FINAL REPORT NEGAWATT CONSULTING
Page 4 of 50
Table of Contents
Acknowledgements ................................................................................................................................. 2
Project Team ........................................................................................................................................... 2
Disclaimer ............................................................................................................................................... 2
Executive Summary ................................................................................................................................. 3
Document Change Tracking ..................................................................................................................... 5
List of Figures .......................................................................................................................................... 6
Introduction ............................................................................................................................................ 7
Project Objective ..................................................................................................................................... 8
Project Methodology ............................................................................................................................... 9
Technology Overview .......................................................................................................................... 9
Host Site Overview .............................................................................................................................. 9
Measurement & Verification Plan Overview ...................................................................................... 11
Market Overview ................................................................................................................................... 12
Opportunity ....................................................................................................................................... 12
Products and Systems ........................................................................................................................ 12
Applicable codes and standards ............................................................................................................. 13
Project Results and Discussion ............................................................................................................... 14
Detailed Host System Description ...................................................................................................... 14
System Deployment and Operations-Related Roles and Responsibilities ........................................ 15
List of Controlled Points ................................................................................................................. 15
Sequence of Operations ................................................................................................................. 15
System Cost and Cost-Influencing Factors .......................................................................................... 16
Verification of System Operation and Design ..................................................................................... 17
Evaluation of Impact to Host Site Staff ............................................................................................... 22
Customer Feedback ........................................................................................................................... 22
Energy & Cost Savings........................................................................................................................ 22
Applicability of existing rebate and incentive programs ..................................................................... 25
Energy Efficiency Business Incentive .............................................................................................. 26
On-Bill Financing ............................................................................................................................ 26
Education Partnership Program ..................................................................................................... 27

MULTI-VENDOR RTU RETROFIT CONTROLLER FIELD STUDY FINAL REPORT NEGAWATT CONSULTING
Page 5 of 50
Project Error Analysis......................................................................................................................... 27
Project Plan Deviation.................................................................................................................... 27
Anomalous Data and Treatment .................................................................................................... 27
Technical, Statistical, and Error Analysis ......................................................................................... 28
Conclusions ........................................................................................................................................... 29
Benefits ............................................................................................................................................. 29
Possible Risks..................................................................................................................................... 29
System and Technology Improvement Opportunities......................................................................... 29
Applicability of Case Study Findings to Other Load Types and Sectors ................................................ 29
Considerations for Large-scale and Persistent Market Implementation .............................................. 29
Possible future Study ......................................................................................................................... 29
Glossary and Acronyms ......................................................................................................................... 30
References ............................................................................................................................................ 31
Appendix A: Project Plan ....................................................................................................................... 34
Appendix B: Measurement & Verification Plan ...................................................................................... 41
Appendix C: Peer Review Certificate ...................................................................................................... 50
Document Change Tracking Document Date List of Changes
07/25/2013 Initial version
11/01/2013 Peer review edits
11/12/2013 Edited per technical discussion with a vendor and added Appendices

MULTI-VENDOR RTU RETROFIT CONTROLLER FIELD STUDY FINAL REPORT NEGAWATT CONSULTING
Page 6 of 50
List of Figures Figure 1: Statistics & Savings Calculations ................................................................................................ 3
Figure 2: Technology comparison chart ................................................................................................... 9
Figure 3: Building Features .................................................................................................................... 10
Figure 4: Heat pump equipment schedule ............................................................................................. 10
Figure 5: BMS screenshot of a typical heat pump (HP-20 shown) ........................................................... 11
Figure 6: Electric Usage in SDG&E region (Itron, Inc., 2006) ................................................................... 12
Figure 7: List of Controlled Points per Technology ................................................................................. 15
Figure 8: Typical supply fan speeds for VAV RTUs (PNNL, 2013) ............................................................. 16
Figure 9: Typical day of HP-17 operation in retrofit mode ...................................................................... 18
Figure 10: HP-17 Modes of operation .................................................................................................... 18
Figure 11: Typical day of HP-26 operation in retrofit mode .................................................................... 19
Figure 12: HP-26 Modes of operation .................................................................................................... 20
Figure 13: Typical day of HP-27 operation in retrofit mode .................................................................... 20
Figure 14: HP-27 Modes of operation .................................................................................................... 21
Figure 15: Daily Cooling and Heating Energy Consumption for HP-17 and HP-26 .................................... 24
Figure 16: Daily Cooling Energy Consumption for HP-27 ........................................................................ 24
Figure 17: Summary of SDG&E incentive programs ................................................................................ 25
Figure 18: Examples of eligible HVAC systems (SDG&E, 2012) ................................................................ 26
Figure 19: On Bill Financing loan terms (SDG&E, 2012) .......................................................................... 27
MULTI-VENDOR RTU RETROFIT CONTROLLER FIELD STUDY FINAL REPORT NEGAWATT CONSULTING
Page 7 of 50
Introduction As stated in Appendix A: Project Plan,
Packaged air conditioning units (i.e. RTUs) accounted for 46% of main commercial cooling
equipment as of 2003 according to the Department of Energy Buildings Energy Data Book
(Department of Energy, 2012a). The average EER efficiency of RTUs in service in 2010 was 11.2
even though the best-available on the market was 13.9 (Department of Energy, 2012b). The EER
values at the pilot site range from 8.7 to 13.2 as per the nameplates. Many installed RTUs,
including those at the pilot site, have constant volume fans and compressors which are
inefficient when compared to variable speed equipment. Ventilation levels are often excessive
and compressors often deliver too much cooling and/or short cycle.
The median lifetime of commercial RTUs is 15 years (Department of Energy, 2012c) which may
help to explain the poor efficiencies of in-service RTUs and why retrofit energy-saving
controllers have market potential.
There are various retrofit controller products on the market. One product each from four vendors is
evaluated in this study. Their different features, energy saving methods, and cost will be compared.

MULTI-VENDOR RTU RETROFIT CONTROLLER FIELD STUDY FINAL REPORT NEGAWATT CONSULTING
Page 8 of 50
Project Objective [Updated copy of a similar section in Appendix A: Project Plan]
The primary goal of this study is to confirm plausibility and actual energy savings of each technology.
Savings will be assessed based on measurements and calculations for energy, demand, and cost. The
functionality of each technology will also be reviewed and confirmed.
Overall, we can summarize the goals of this assessment project as follows:
1. Describe system setup, operations, and functionality 2. Quantify energy savings, cost and simple payback time 3. Analyze factors that may cause variations in energy savings, cost and payback times under
different circumstances such as different base RTUs or different climate zones. 4. Review utility programs with respect to their present applicability to this technology and provide
recommendations as to how utilities could further support this technology 5. Research the potential market size and possible barriers to adoption, given enough information 6. Gather and present customer feedback 7. Suggest possible improvements to the technology, if applicable 8. Assess risks introduced by this technology, if any
Four different vendors’ products were evaluated. One product per vendor for a total of 4 products was
evaluated. Given the dissimilarities, these four products were compared and contrasted qualitatively.
While the savings calculations are tabulated for brevity, the reader shall be wary of making quantitative
comparisons of the products given the sample size of one each and the fact that each product affects a
different heating, ventilation, and air conditioning (HVAC) zone of the building.
The savings in one case was calculated over the (filtered) measurement period only per (ASHRAE, 2002)
instead of over a typical meteorological year. Here, the filtered data set was too small to yield
acceptable regression models over both the baseline and retrofit periods.

MULTI-VENDOR RTU RETROFIT CONTROLLER FIELD STUDY FINAL REPORT NEGAWATT CONSULTING
Page 9 of 50
Project Methodology [Full details can be found in Appendix A: Project Plan and Appendix B: Measurement & Verification Plan]
The Project Plan contains detailed information on the following:
Technology description
Description of incumbent technology
Project Goals
Technology Application
Project Milestones
The M&V Plan contains detailed information on the following:
Test Site Description
Measurement & Verification Options
Data Collection / Analysis Procedures
Calculations of Energy Savings
Cost savings calculations
Technology Overview [Updated copy of a similar section in Appendix A: Project Plan]
All four technologies studied here are controllers which are designed to be retrofitted onto existing,
packaged RTUs preferably 5 tons or larger. All technologies involve innovative control of either the fans,
compressors, or both. Figure 2 provides a table of the features and attributes of each technology,
labeled per the heat pump number on which they are installed for the sake of anonymity. Statements
from each vendor concerning the operating life of their products were not given but warranty lengths as
far as they are known are included.
Technology feature HP-17 HP-20 HP-26 HP-27
Compressor cycling X X X
Compressor speed control X
Compressor short cycling awareness X X X
Supply fan speed control X X
Economizer control X
Demand control ventilation (DCV) option X
FDD option X
Applicable to packaged units X X X X
Applicable to split systems X X X
Reduces energy X X X X
Reduces demand X X Figure 2: Technology comparison chart
Host Site Overview [Updated copy of a similar section in Appendix B: Measurement & Verification Plan]
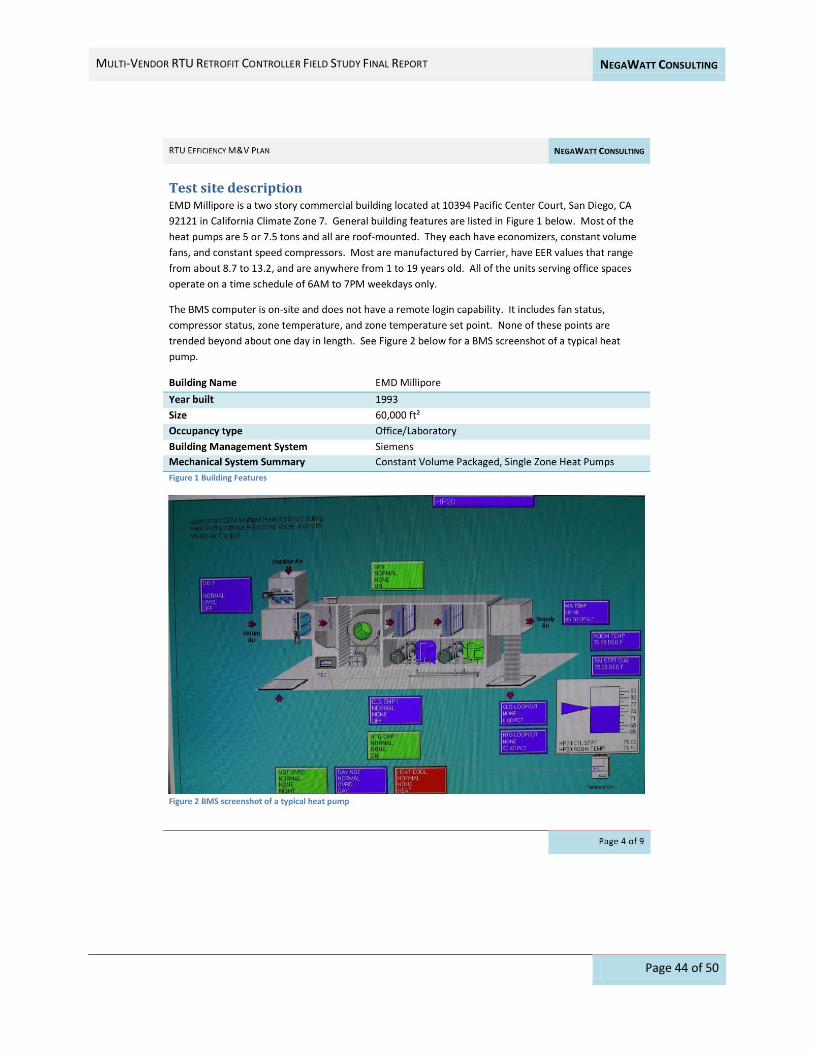
EMD Millipore is a two story commercial building located at 10394 Pacific Center Court, San Diego, CA
92121 in California Climate Zone 7. General building features are listed in Figure 3.

MULTI-VENDOR RTU RETROFIT CONTROLLER FIELD STUDY FINAL REPORT NEGAWATT CONSULTING
Page 10 of 50
Building Feature Building Attribute
Building Name EMD Millipore
Year built 1993
Size 60,000 ft²
Location Sorrento Valley, San Diego, CA 92121
California Climate Zone 7
Occupancy type Office/Laboratory
Occupancy schedule Monday – Friday, 06:00 – 19:00
Building Management System Siemens
Mechanical System Summary Constant Volume Packaged, Single Zone Heat Pumps Figure 3: Building Features
Four heat pumps were utilized in this study. All have cooling capacities of 7.5 tons, all are packaged
rooftop units, and all serve office spaces. They each have economizers, constant volume fans, and two
constant speed compressors each. They are all manufactured by Carrier, have EER values that range
from about 8.7 to 11.2, and are anywhere from 4 to 20 years old (as of 2013). All operate on weekly
time schedules. For a full equipment schedule, see Figure 4.
Figure 4: Heat pump equipment schedule
The BMS computer is on-site, does not have remote login capability, and the author was not granted
access beyond a few cursory viewings. It includes fan status, compressor status, zone temperature, and
zone temperature set point. The occupied and unoccupied heating and cooling set points on
05/03/2013 were 65/70/74/82°F for HP-17 and 65/72/73.5/82°F for HP-26. None of these points are
trended to the author’s knowledge. HP-27 has a vendor installed thermostat with occupied set points of
70/74°F and, accidentally, the supply fan is forced into ventilation mode overnight. The HP-20 set points
are not provided because an energy savings calculation will not be provided for that unit. See Figure 5
for a BMS screenshot of a typical heat pump.
Unit # Make
Model #,
Tonnage, Serial # Qty Type
Refri-
gerant Volt. Ph. Hz RLA LRA Qty Type Volt. Ph. Hz FLA
Area
Function
Area
(sqft)
HP-17 Carrier
50TCQD08A2A6A0A0A0,
7.5 Tons, 4309G30655
1
1
scroll
scroll
R-410A
R-410A
460
460
3
3
60
60
6.1
6.1
41
41
2
1
Outdoor
Indoor
460
460
1
3
60
60
0.8
3.4
Offices,
Cubicles 1600
11.2,
12.4
2009, good, charge,
replace caps
HP-20 Carrier
50QJ0----0,
7.5 tons, 0593G10652
1
1
hermetic
hermetic
R-22
R-22
460
460
3
3
60
60
7.9
7.0
49.5
49.5
1
1
Outdoor
Indoor
460
460
3
3
60
60
1.5
2.6
Corridor,
Offices 1875
8.7,
---
1993, poor, brittle
coils, many repairs
HP-26 Carrier
50HJQ008---621--,
7.5 Tons, 1207G50873
1
1
scroll
scroll
R-22
R-22
460
460
3
3
60
60
6.4
6.4
44
44
2
1
Outdoor
Indoor
460
460
1
3
60
60
0.7
3.4 Offices 1100
10.3,
10.5
2007, fair, clean
corrosion, charge
HP-27 Carrier
50LJQ008610,
7.5 Tons, 0393G04434
1
1
scroll
scroll
R-22
R-22
460
460
3
3
60
60
7.9
7.0
49.5
49.5
1
1
Outdoor
Indoor
460
460
3
3
60
60
1.5
2.6 Cubicles 1900
9.1,
10.3
1993, poor, brittle coil,
charge, replace caps
Quality Control
Inspection Results
Unit Compressor Fans Area Served
EER,
IPLV

MULTI-VENDOR RTU RETROFIT CONTROLLER FIELD STUDY FINAL REPORT NEGAWATT CONSULTING
Page 11 of 50
Figure 5: BMS screenshot of a typical heat pump (HP-20 shown)
Measurement & Verification Plan Overview [Full details can be found in Appendix B: Measurement & Verification Plan]
System setup and operation, roles and responsibilities, cost and cost influencing factors, system
functionality, impact to host site staff, customer feedback, energy reduction, and applicability of existing
SDG&E programs are all evaluated. Emphasis is placed on the following aspects:
Verification of system operation and design
Do the controllers work as stated?
Do the controllers work automatically?
Is the zone temperature set point satisfied?
Do the RTU components react as expected and such that no components are excessively worn?
Potential energy and cost savings
Energy savings and simple payback periods were calculated to the extent possible and without
incentives or rebates. Consequently, the payback calculation is only a rough estimate. One year of
recent utility bills for the host site were studied to determine the cost of electricity. Parts and
installation costs per technology were those from this particular project with any revisions noted.
Customer feedback
Does the customer like the system? Would they purchase it independent from this project?
What would he or she improve to make the system more attractive?
Did the system require further training for the host site staff?
Applicability of SDG&E incentive and rebate programs
We review relevant SDG&E programs with respect to this technology, and provide recommendations for
where we believe program support may apply.
Conclusions
Benefits of each technology
Improvement opportunities for each technology
Applicability of this study to other load types and sectors
Considerations for large-scale market implementation
Potential future study

MULTI-VENDOR RTU RETROFIT CONTROLLER FIELD STUDY FINAL REPORT NEGAWATT CONSULTING
Page 12 of 50
Market Overview
Opportunity According to (W. Wang, 2012), packaged RTUs are predominantly used in stand-alone retail and medium
office building types. Average savings of multi-speed fan control and DCV are about 40% of building
HVAC energy use (assuming a baseline of constant speed fans and no DCV). The California Commercial
End-Use Survey (Itron, Inc., 2006) indicates that the combined annual HVAC electric usage of small office
(< 30,000 ft²) and retail building types in the SDG&E region is 514 GWh (see Figure 6). As an arbitrary
example, let’s assume the products were installed at 10% of all available California sites each year (this
is for illustration purposes only and not meant to suggest that 10% market penetration can or will be
accomplished). Energy savings in the SDG&E region would then be about 20 GWh.
Figure 6: Electric Usage in SDG&E region (Itron, Inc., 2006)
Products and Systems A list of vendors and products competing in this market sector is provided below in alphabetical order.
Some of these products may be a better representation of the products in this study than others.3
All Original Equipment Manufacturers implement similar features in their higher end products
Catalyst by Transformative Wave Technologies (Transformative Wave Technologies, 2013)
Digi-RTU by Bes-Tech (Bes-Tech, 2013)
Enerfit by Enerfit (Enerfit, 2013)
Energy WorkSite by NorthWrite (NorthWrite, 2013)
IntelliCon-CAC by Intellidyne (Intellidyne, LLC, 2013)
Optimum Energy (Optimum Energy, 2013)
PACE2 by PaceControls (PaceControls, 2013)
Swarm Energy Management by REGEN Energy (REGEN Energy, 2013)
UtilityPRO thermostats by Honeywell (Honeywell, 2013)
VPower by Viridity Energy (Viridity Energy, 2013) 3 The list is in alphabetical order, provided as is, not exhaustive, and the selection is arbitrary. The authors of this report do not endorse or guarantee, and disclaim any responsibility for: the content, products or services offered, their performance or suitability, and any consequences or damages, incidental or otherwise, that may result from their consideration or use.

MULTI-VENDOR RTU RETROFIT CONTROLLER FIELD STUDY FINAL REPORT NEGAWATT CONSULTING
Page 13 of 50
Applicable codes and standards The current 2008 Building Energy Efficiency Standards (California Energy Commission, 2010) state in
Section 121 that mechanically ventilated spaces must be continually ventilated during occupied hours.
Furthermore, the outside air flow rate must meet certain tabulated values based on room area, room
type of use, and occupant quantity. While there are some exceptions that allow for reduced airflow, the
regulations disallow “fan cycling” control in which fans are turned off when the zone temperature is
within the dead-band between the heating and cooling set points. This is pertinent to this study of
retrofit RTU controllers given that many existing RTUs have been found to be in violation (Architectural
Energy Corporation, 2003). When this condition is fixed as can happen in the scope of a retrofit project,
RTU energy use increases and reduces the payback period of a retrofit controller.
In addition, the 2008 Building Energy Efficiency Standards state in Section 144 (l) that single zone
systems with a cooling capacity greater than or equal to 110,000 Btu/hr must have at least two speed
supply fan motors. Furthermore, the upcoming 2013 Standards that go into effect January 1, 2014 will
include the following RTU-related change according to (California Energy Commission, 2013):
1. Added requirements for Fan Control and Integrated Economizers. Packaged units down to 6 tons must be VAV with the ability to modulate cooling capacity to 20% of maximum. Economizers must also be able to modulate cooling capacity to match VAV units. (Section 140.4(c) & (e))
According to Table 140.4-D in (California Energy Commission, 2013), the VAV requirement for 6 ton units
will go into effect on 1/1/2016 while the same requirement for 7.5 ton units will go into effect on
1/1/2014.
The 2013 Standards (Section 120.2(i)) also make fault detection and diagnostics (FDD) a mandatory
measure for all air-cooled unitary direct-expansion units with cooling capacities greater than or equal to
54,000 Btu/hr.
These new regulations reinforce the idea that retrofit RTU controllers must be cost competitive with
new RTUs. The least expensive 7.5 ton unit purchased after 1/1/2014 will have at least a two speed
supply fan motor, an integrated economizer, and FDD. So, it will also reap much of the same energy
reduction of some of the technologies evaluated here.

MULTI-VENDOR RTU RETROFIT CONTROLLER FIELD STUDY FINAL REPORT NEGAWATT CONSULTING
Page 14 of 50
Project Results and Discussion
Detailed Host System Description Expounding upon section Technology Overview, here are more details of each of the four technologies
using the heat pump numbers as proxy names to preserve anonymity. Photos are also omitted to
preserve anonymity.
HP-17
The main product is a microprocessor-embedded VFD which is installed within the fan section of the
RTU cabinet and in series with the thermostat wiring. The following sensors are also added and
communicate with the VFD: outside air temperature, return air temperature, discharge air temperature,
and return air CO₂. During calls for ventilation, heating, or cooling, the product analyzes the temperature
data and calculates optimal fan speed, making the supply fan variable instead of constant speed.
The microprocessor also assumes control of the economizer. It makes the economizer an integrated
economizer meaning that it allows the damper to be fully open during compressor operation when
helpful. It controls the damper by differential dry bulb temperature. It closes the damper during
occupied hours. Finally, it adds demand control ventilation, reducing ventilation during periods of low
CO₂.
Optionally, additional hardware can be mounted in a waterproof box on the exterior of the RTU to
provide additional features. This hardware can communicate with the local utility to participate in
demand response programs. Web-based monitoring, FDD, alarming, and BMS capabilities can also be
added.
The vendor claims to save 25 to 40% of HVAC energy. They include a 5 year hardware warranty.
Compressor operation is not affected.
HP-20
This product saves energy by taking over control of and allegedly improving the cycling of the
compressors. The vendor claims to reduce electrical consumption by 10 to 20%. The product is cube
shaped, is small enough to hold in one hand, and is installed inside the RTU cabinet near the OEM
controls and in series with the thermostat wiring. One device is required per compressor. The required
power input is 24/115/220 VAC at 5 Watts. The product includes an algorithm which studies the existing
cycle pattern and then intelligently reduces compressor runtime while still maintaining the thermostat
set points. It is especially effective when the existing RTU is oversized and the OEM compressor cycling
sequence of operations is not optimized for the actual thermal load of the zone. The product includes a
15 year replacement warranty for manufacturing defects.
HP-26
This product is similar to HP-20. It cycles the compressors more frequently (but not too frequently) and
with overall reduced runtime. The vendor claims that each compressor “runs less but on average more-
efficiently”. They claim to reduce demand, too. One device is required to control heating and another to

MULTI-VENDOR RTU RETROFIT CONTROLLER FIELD STUDY FINAL REPORT NEGAWATT CONSULTING
Page 15 of 50
control cooling (the next generation model will only require one piece of hardware). An outside air
sensor is also installed.
HP-27
This product consists of one VFD which simultaneously controls the supply fan and both compressors
and requires that the existing thermostat be replaced with a vendor provided thermostat (unless the
facility staff gives the vendor full and real time access to the BMS). The product leaves the existing
economizer and outdoor fan control intact.
The VFD includes a proprietary algorithm which decides when to stage on each compressor and what
speed to run whatever components are enabled to run. The thermostat is a programmable type with
time scheduling capabilities.
System Deployment and Operations-Related Roles and Responsibilities
Facility staff operation & maintenance duties are not intended to be increased as a result of the
installation of any of these retrofit products. However, HVAC maintenance providers should understand
the basic operation of the products so that they may troubleshoot any possible failures.
The vendor is responsible to provide operation and maintenance documentation and/or training to the
facility staff. They should also give the facility staff contact information for customer support.
List of Controlled Points
The BMS points which are controlled by the various technologies are listed in Figure 7.
Controlled Point HP-17 HP-20 HP-26 HP-27
Compressor 1 start/stop X X X
Compressor 2 start/stop X X X
Compressor 1 speed X
Compressor 2 speed X
Supply fan speed X X
Economizer damper position X Figure 7: List of Controlled Points per Technology
Sequence of Operations
Basic outlines of the sequence of operations are provided below per technology. Please note that the
vendors withheld precise details for proprietary reasons. For generic heat pump sequence of operations,
please refer to (W. Wang, 2012).
HP-17
No specific sequence of operations was provided, likely for proprietary reasons. However, a recent PNNL
presentation (PNNL, 2013) gives some values of typical supply fan speeds at the various modes of RTU
operation (see Figure 8). The vendor did verify the 40% setting for ventilation mode.

MULTI-VENDOR RTU RETROFIT CONTROLLER FIELD STUDY FINAL REPORT NEGAWATT CONSULTING
Page 16 of 50
Figure 8: Typical supply fan speeds for VAV RTUs (PNNL, 2013)
HP-20
The product intercepts thermostat cooling and heating calls, saves energy by occasionally preventing
them, and never adds such calls. After it analyzes the existing cycle pattern, it calculates an optimal
“hold off” time during which it prevents the compressors from running starting at the point in time of a
compressor call from the thermostat. The product also includes an anti-short-cycle timer which prevents
the compressor from restarting for a certain span of time after stopping to prevent excessive
compressor wear (default is 2 minutes).
HP-26
This product only affects compressor cycling, like HP-20, but the sequence of operation is different. Each
hardware component has dip switches which the installing contractor sets to match certain
characteristics of each compressor. Based on the dip switch positions and the measured outside air
temperature, an algorithm on the device calculates the optimal compressor runtime during a cooling call
from the thermostat. Without the device, the compressor(s) would remain on during the entire duration
of a cooling call. With the device, the compressors instead cycle on and off.
HP-27
This product takes control of all RTU operation except the economizer and the condenser fan, which
retain their OEM sequences. To the best of our knowledge, the economizer is non-integrated and
controlled with outside air dry bulb temperature. The condenser fan is interlocked with the first stage
compressor. The vendor’s product sends start/stop signals to both compressors and to the supply fan.
One signal from one VFD is delivered to all of the enabled components. An embedded algorithm is used
to calculate which components to enable and to calculate the optimal VFD output frequency based on
the current zone and outside air temperatures. During a ventilation only period, the supply fan speed is
always set to run at 30% speed. No other sequence of operations details were shared with us by the
vendor.
System Cost and Cost-Influencing Factors [Updated copy of a similar section in Appendix A: Project Plan]
RTU retrofit controllers may be installed in any building that has existing RTUs. However, the controllers
are most cost effective when the existing RTUs meet all or most of the following conditions:

MULTI-VENDOR RTU RETROFIT CONTROLLER FIELD STUDY FINAL REPORT NEGAWATT CONSULTING
Page 17 of 50
Fans and compressors are constant volume and speed
RTU has no economizer or non-integrated economizer
Zone has highly variable occupancy but RTU does not have DCV
Manufacturer nameplate rated EER is low and/or part load efficiency is poor
Tonnage is at least 5 tons but preferably higher (because of fixed cost per RTU)
RTU annual runtime is high
RTU is in decent condition (if in poor condition, it is difficult to commission the new controllers)
RTU is less than about 10 years old (if the RTU will be replaced soon, a retrofit isn’t worthwhile)
RTU is continually delivering ventilation during occupied hours per Title 24
BMS is in good operating condition (or no BMS but a well-functioning thermostat instead)
High level of facility staff engagement in maintaining, monitoring, and optimizing their RTUs
The item about ventilation is noted because according to Small HVAC System Design Guide
(Architectural Energy Corporation, 2003), the indoor fans in about 38% of the existing RTUs in California
are cycled improperly. The fans are off during occupied periods when there is call for cooling or heating.
This isn’t code compliant. If this condition is found on-site and if facility staff corrects it, energy savings
will be substantially negated when compared to non-code-compliant operation.
The items about the BMS and facility staff engagement are important because most of the controllers
studied do not replace the thermostat or disconnect the BMS. The algorithms assume that these devices
are working properly, that they are no improper BMS operator overrides, and that all set points are code
compliant and reasonable.
Verification of System Operation and Design HP-17
At the RTU, we visually verified that the fan was running at reduced speed during ventilation only mode.
In the zone, we verified that airflow was emitting from the diffusers. While collecting data on a weekly
basis, we verified that the power signature of the RTU was reasonable. A typical day of retrofit operation
is shown in Figure 9. As expected for June in San Diego, it was mildly cold in the morning and mildly
warm in the afternoon. The RTU was off during the night, went into heating mode around 6 AM, then
ventilation mode, then two stages of cooling cycled on/off during midday. During the unoccupied
period, the compressors cycled from cooling mode to completely off indicating that perhaps the
unoccupied temperature set points were in operator override. The unoccupied period also indicates that
the parasitic power of the VFD and all other control components is about 120 Watts. The occupied
period indicates that the RTU power during ventilation mode is about 180 Watts, during heating mode
(likely one stage) the power is about 9 kW, during two stages of cooling is about 5.6 kW, and during one
stage is about 3.5 kW.

MULTI-VENDOR RTU RETROFIT CONTROLLER FIELD STUDY FINAL REPORT NEGAWATT CONSULTING
Page 18 of 50
Figure 9: Typical day of HP-17 operation in retrofit mode
Figure 10 shows similar results. It is a plot of the maximum 1-minute interval power measurements per
hour for both the baseline and retrofit data sets during business days after September 2, 2012. The data
near 0 represent periods when the RTU was off or was in retrofit ventilation mode. The data near 1 kW
represent periods of baseline ventilation mode or retrofit economizer mode. The data near 3.5 kW
represents one stage of cooling and the cloud above that represents two stages of cooling. The largest
savings are during ventilation mode and some savings occur during cooling mode as indicated by the
blue clouds being slightly lower than the red clouds. The clouds above 6 kW indicate one and two stages
of heat pump heating. The energy use is significantly higher here and it appears that the heat pump uses
the second stage more often during the retrofit mode. This may be due to the erratic behavior of the
RTU during unoccupied periods. If the RTU comes on during the weekend before a week of baseline
operation, heating energy will be reduced unfairly as compared to normal weekend operation prior to a
retrofit period.
Figure 10: HP-17 Modes of operation

MULTI-VENDOR RTU RETROFIT CONTROLLER FIELD STUDY FINAL REPORT NEGAWATT CONSULTING
Page 19 of 50
HP-20
This particular installation of this product ultimately failed for some undetermined reason. During our
study, the outdoor coil iced over and we determined that the two products (one per compressor) were
wired backwards. The second stage compressor was being used as the first stage and therefore the
outdoor fan was not turning on.
After this was fixed, we discovered that the RTU was stuck in ventilation mode for weeks on end. We
first concluded that the parasitic power of the products was too large for the aged existing transformer.
As the contractor was about to replace it, the compressors started operating again so they did not install
it. Later, the compressors failed again. The owner then called off further repairs and instructed us to
uninstall the products.
HP-26
Figure 11 shows a typical day of HP-26 retrofit operation. The unit comes on at 6 AM, maintains
ventilation during occupied hours, enables two stages of compressors regularly to maintain zone
temperature, and enables one stage of cooling during the unoccupied night hours to presumably satisfy
an unusually low cooling setup temperature set point. Please note that multiple thermostats in multiple
rooms in the zone are averaged to yield the “zone temperature”. The zone temperature data in the plot
is for one room only.
Figure 12 shows the modes of operation. Starting from the bottom, the horizontal cloud near 1 kW is
supply fan only operation, the next cloud up is one stage of cooling, then two stages of cooling, then one
stage of heating. The second stage of heating is never used.
Figure 11: Typical day of HP-26 operation in retrofit mode

MULTI-VENDOR RTU RETROFIT CONTROLLER FIELD STUDY FINAL REPORT NEGAWATT CONSULTING
Page 20 of 50
Figure 12: HP-26 Modes of operation
HP-27
Figure 13 shows a typical day of HP-27 retrofit operation. Ventilation is maintained during occupied
hours (at a low wattage given the reduced speed of the VFD) and the compressors cycle on to maintain
cooling. Please note that the supply fan continues to provide ventilation during unoccupied hours.
Figure 14 shows the modes of operation. No heating ever occurs which is reasonable given that this heat
pump is one of two heat pumps serving an interior zone of open office space. There are multiple clouds
(or lines of data) near the bottom of the plot given the multiple speeds delivered to the supply fan and
compressors.
Figure 13: Typical day of HP-27 operation in retrofit mode

MULTI-VENDOR RTU RETROFIT CONTROLLER FIELD STUDY FINAL REPORT NEGAWATT CONSULTING
Page 21 of 50
Figure 14: HP-27 Modes of operation
Above and beyond our analysis of the data, the HP-27 vendor answered our questions concerning their
implementation of variable speed operation to compressors which were originally designed to be
constant speed. They provided us with a bulletin about the same subject written by the parent company
of Copeland, a major compressor manufacturer (Emerson Climate Technologies, 2011). After reviewing
it, we engaged in the following question and answer session with the vendor:
Author: Have you checked that these particular Copeland compressors at EMD are part of the
model families that they discuss in the [Copeland] bulletin? If they are not listed one could imply
that they are not approved for this type of operation. Either way minimum frequency would be
45Hz, did you dial that in?
Vendor: The low limit is determined based on oil return. We have come up [with] a technique,
which allows much lower than stated low limit. If oil return is not ensured, the compressor can be
burned in matter of minutes…The Copeland compressor for air conditioning is the same type. The
minimum frequency is 45HZ based on Copeland recommendation. We have come up a technique,
which allows much lower frequency. The major reason for the low frequency limitation is due to
lubrication. Our technique has solved this issue.
Author: Regarding soft start [and according to the Copeland bulletin], "The VFD must be able to
deliver sufficient power at the lower frequencies to ensure that the compressor accelerates to
nominal speed in approximately 3 seconds or less....Longer ramp up times could result in
inadequate lubrication". I imagine this is part of your control strategy as well?
Vendor: We use a special VFD, which delivers more torque at low speed and ensures proper
lubrication at start up as well…
Author: Lastly, I am learning from the bulletin that attaching VFDs to some compressors that
have "conventional capacity control methods" is not a good idea…Do we know whether there
may be a conflict in this respect at EMD?

MULTI-VENDOR RTU RETROFIT CONTROLLER FIELD STUDY FINAL REPORT NEGAWATT CONSULTING
Page 22 of 50
Vendor: Yes. For some of the compressors from Copeland, VFDs can’t be implemented directly
without other treatment. For example, VFD should not be implemented for lubricant injected
compressor.
We have not verified the above claims. However, in the course of our testing we did witness a related
event. It was initially found that the first compressor would not turn on during a cold start. The vendor
subsequently reprogrammed their controller to deliver more current in these cases and the issue was
resolved. The HP-27 vendor has also stated that, since this test was conducted, their control strategy has
been updated to provide further savings. We have not verified this claim either.
Evaluation of Impact to Host Site Staff The host site staff was most concerned about occupant comfort and HVAC maintenance. When a
product prevented an RTU from satisfying the zone temperature set point or when troubleshooting was
required, the staff was understandably disappointed. However, when that product was quickly repaired
and when the M&V data showed that energy was being saved, the staff was happy to keep the product
installed.
Customer Feedback Aside from the persistent failure of HP-20, there was minimal impact to the occupants. The only other
zone in which the occupants noticed a difference was the HP-17 zone. They noticed that the supply
diffusers were much less drafty and much quieter when the heat pump was in retrofit mode.
Energy & Cost Savings There were a few circumstances which complicated our energy and cost savings calculations. First, we
only installed one product each for the four vendors so the sampling error was substantial. PECI’s
Premium Ventilation Package Testing (PECI, 2008) report takes the same stance when discussing the
various methods of calculating RTU related energy savings:
Field-based monitoring approach – there have been some attempts to collect field data for
HVAC systems pre- and post-retrofit and use that data to generate savings. So far, this method
has been elusive, and the sample sizes or time of data collection have been too small to
generate data that can be used to generate savings with a high degree of confidence.
Another complication is that the BMS occasionally had errant operator overrides or behaved erratically
for some unknown reason. Also, the vendors tuned their algorithms a few times during the M&V period.
In addition, creating weather normalized regressions is difficult with heat pumps given that both heating
and cooling can occur each day and both use electricity.
Data collection began on 08/24/2012 and ended on 08/02/2013. For HP-17, data prior to 09/02/2012
was ignored because some of the timestamps were invalid and separately because the logger was
replaced with a newer model. For HP-26, data prior to 01/11/2013 was ignored for a few reasons. First,
the heating data was marred by a miscommunication in which the heating mode remained in retrofit
mode during weeks which were intended to be baseline periods. Also, the outdoor fan failed and was

MULTI-VENDOR RTU RETROFIT CONTROLLER FIELD STUDY FINAL REPORT NEGAWATT CONSULTING
Page 23 of 50
offline for a short period. A few subsequent weeks during which the compressors failed due to some
existing flaw in the existing equipment or controls were also ignored. For HP-27, data prior to
02/15/2013 was ignored for a few reasons. First, the second stage compressor was failing during that
period. Second, the vendor was continually improving their algorithms during that period and
consequently their product was not ready to be tested.
In all cases, weekends were ignored since the HVAC schedule commanded the equipment off during
those days. Holidays were ignored since the building was mostly empty and had very little HVAC load in
the office space. Virtually all Fridays were ignored since the equipment was switched over between
retrofit and baseline mode on those days.
Consequently, the numbers of daily observations shown in Figure 1 are lower than they otherwise would
have been.
Our calculations varied slightly per heat pump. In all cases, 1-minute interval RTU power data and hourly
outside air NOAA dry bulb temperature data was used to determine the modes of operation, to
determine the best method to separate heating from cooling, and to identify anomalous data to
remove. Then, daily RTU cooling energy use and daily heating energy use were compared to various
independent variables and the best regression models were chosen.4 The independent variables tested
included average NOAA dry bulb temperature, wet bulb temperature, dew point temperature, and
measured average daily zone temperature. The daily NOAA data was from the GSOD dataset for San
Diego Miramar NAS and the hourly NOAA data was from the QCLCD dataset for San Diego Montgomery
Field (the hourly Miramar data was missing days of data). In all cases, the best correlations were found
using the single independent variable of daily NOAA dry bulb temperature.5
Four regressions (baseline cool, retrofit cool, baseline heat, retrofit heat) were attempted so that all
could be used against TMY3 data (for Miramar NAS and aggregated to daily values) to calculate annual
savings. If only the cooling models yielded acceptable correlation, then only annualized cooling savings
were calculated. The scripting language Python was used for all calculations and plotting.
For HP-17, Figure 10 was used to separate the heating from the cooling hours. Then, those respective
hours were summed per day. Then, daily cooling sums below 1 kWh were removed since those days
essentially have no significant amount of cooling. For heating, daily temperatures above 69 F were
ignored because above that temperature there was only a small amount of heating. Daily heating sums
above 60 kWh were also ignored because they only occurred at very low temperatures and seemed to
be correlated with erratic RTU behavior at night or on the weekend. The heating and cooling scatter
plots are shown in Figure 15 and the savings and modeling statistics are tabulated in Figure 1. Similar
methods of filtering were used for HP-26 and the results are also shown in those same figures.
4 Please note that the author also up-sampled to weekly intervals to see if that would yield better regression statistics than daily intervals. It did not and consequently those results are omitted. 5 The author considered not normalizing for weather given the long data collection duration and the regular
(weekly) switchovers from baseline to retrofit modes. However, this was abandoned because the correlation between RTU energy and dry bulb temperature was fairly high.
MULTI-VENDOR RTU RETROFIT CONTROLLER FIELD STUDY FINAL REPORT NEGAWATT CONSULTING
Page 24 of 50
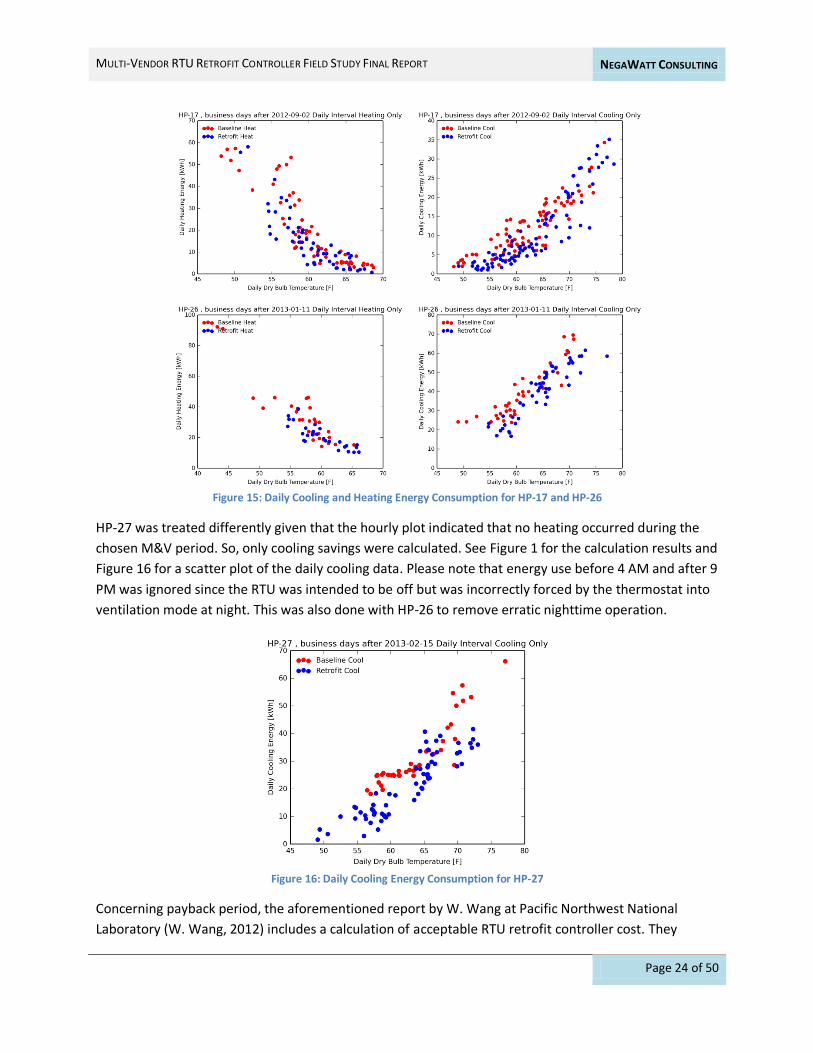
Figure 15: Daily Cooling and Heating Energy Consumption for HP-17 and HP-26
HP-27 was treated differently given that the hourly plot indicated that no heating occurred during the
chosen M&V period. So, only cooling savings were calculated. See Figure 1 for the calculation results and
Figure 16 for a scatter plot of the daily cooling data. Please note that energy use before 4 AM and after 9
PM was ignored since the RTU was intended to be off but was incorrectly forced by the thermostat into
ventilation mode at night. This was also done with HP-26 to remove erratic nighttime operation.
Figure 16: Daily Cooling Energy Consumption for HP-27
Concerning payback period, the aforementioned report by W. Wang at Pacific Northwest National
Laboratory (W. Wang, 2012) includes a calculation of acceptable RTU retrofit controller cost. They

MULTI-VENDOR RTU RETROFIT CONTROLLER FIELD STUDY FINAL REPORT NEGAWATT CONSULTING
Page 25 of 50
assume a 3 year payback period, savings of about 40% of annual HVAC energy use, and they run their
calculations for two different building types. The report states, “The controller cost can range between
$4,180 and $8,390 for the retail building and between $1,560 and $2,990 for the office building.” The
PNNL calculations could most closely be applied to the technologies installed on HP-17 and HP-27 since
those controllers vary the supply fan speed (among other things). HP-20 and HP-26 only affect
compressor cycling and are not expected to reap that level of savings.
In our study, HP-17 installed controller cost was $3800, HP-26 was $950, and HP-27 was $8500.
Assuming a blended electricity consumption rate of $0.08/kWh and annual savings of about 2700 kWh
for HP-17, the simple payback period for HP-17 without incentives is 17.5 years. Using our calculated
annual savings of about 2860 kWh, the simple payback period for HP-26 without incentives is 4.2 years.
Applicability of existing rebate and incentive programs There are various energy use reduction and demand reduction programs and tariffs available
throughout SDG&E. Some provide ongoing or event-based operative incentives, while others provide
one-time incentives geared towards reducing the customer’s initial investment. It is important to note
that participants cannot receive incentives from more than one program for the same project, unless
stated otherwise in the program materials. A summary of all the programs in SDG&E territory is shown
in Figure 17 and a detailed discussion of some of the relevant programs follows.
Program Name Applies as is
Applies w/ changes
Discussion summary More on Page…
Energy Efficiency Business Rebates
Yes VFDs qualify for $80 rebate per unit
Energy Efficiency Business Incentives
Yes Directly applicable due to use of variable speed drives and/or motor upgrades
26
On Bill Financing Yes Can be applied to any incentive program 26
Education Partnership Program Yes Useful if a college has numerous RTUs 27
Base Interruptible Program (BIP)
No Yes This demand response program could work with the one web enabled product we tested (HP-17)
Capacity Bidding Program (CBP) No No This demand response program is designed for specific aggregators.
Critical Peak Pricing (CPP-D and CPP-E)
No Yes This is a tariff change which benefits customers who shift demand. If enough VFD-type controllers were installed, it could make financial sense.
Summer Saver No No SDG&E uses their own third party wireless boxes to enable participation here
TA/TI No Yes This automated demand response program could work with the web enabled product we tested (HP-17)
Savings By Design No No This program is for new construction only Figure 17: Summary of SDG&E incentive programs

MULTI-VENDOR RTU RETROFIT CONTROLLER FIELD STUDY FINAL REPORT NEGAWATT CONSULTING
Page 26 of 50
Energy Efficiency Business Incentive
SDG&E offers an Energy Efficiency Business Incentive (EEBI) to customers involved in the installation of
new high-efficiency equipment or systems (SDG&E, 2012). The projects that fall within EEBI generally
consist of the retrofit of existing equipment/systems. Eligibility consists of any commercial, industrial or
agricultural customer who pays the public goods charge regardless of size or project scope.
Figure 18: Examples of eligible HVAC systems (SDG&E, 2012)
The reviewed technologies should be directly applicable to this incentive structure due to the use of
variable speed drives and/or the implementation of motor upgrades (see Figure 18). The EEBI program is
a statewide program and therefore the incentives paid off of verified savings should be a constant
throughout California. It is important to note that the incentive is capped at “50% of your project cost”
(SDG&E, 2012).
Please note that the Energy Savings Bid Program was discontinued on December 31, 2012 (SDG&E,
2012). It was consolidated into the EEBI program.
On-Bill Financing
In addition to the incentives allowed by EEBI, SDG&E also offers an On-Bill Financing (OBF) program
(SDG&E, 2012). This can be applicable in conjunction with any utility incentive program. The program
offers to finance, at 0% interest, energy-efficient business improvements through the SDG&E bill. This
allows a commercial customer to pay for energy efficient programs with the savings acquired from
energy efficient technology, with no out of pocket expenses.
When applying OBF to the technology it is very important to note the maximum loan amounts per type
of SDG&E customer. SDG&E divides the energy consumers into two categories: taxpayer-funded and
non-taxpayer-funded. Taxpayer funded entities are defined as a customer that uses tax revenue to pay
utility bills. Taxpayer funded customers are entitled to an interest free loan maximum of $250,000 per
project. Non-taxpayer-funded customers are entitled to an interest free loan maximum of $100,000 per
project. Figure 19 shows these figures and additional terms.

MULTI-VENDOR RTU RETROFIT CONTROLLER FIELD STUDY FINAL REPORT NEGAWATT CONSULTING
Page 27 of 50
Figure 19: On Bill Financing loan terms (SDG&E, 2012)
Education Partnership Program
The Education Partnership Program is one of SDG&E’s Energy Efficiency Partnership Programs (SDG&E,
2012). The goal is to permanently reduce demand and energy use on college campuses. According to the
Partnership website, “The program employs four key strategies to meet its goals: energy efficiency
retrofits, monitoring based commissioning (MBCx), emerging technology demonstrations, and training
and education.” (UC/CSU/IOU Energy Efficiency Partnership, 2007)
This particular project falls under the energy efficiency retrofit category and SDG&E provides incentives
of $0.24/kWh and $1.00/therm. It would be most useful for campuses with numerous RTUs.
Project Error Analysis
Project Plan Deviation
The primary deviation is that we did not analyze the M&V data for HP-20. That product failed for
undetermined reasons and the owner was not interested in continuing that test. In addition, we did not
calculate annual heating energy savings for HP-27. There was insufficient heating data after poor data
was removed.
Anomalous Data and Treatment
Here is a concise list of the anomalous data and how we treated it:
1. We ignored every day when a switchover was made between baseline and retrofit control. As a result, most Fridays were thrown out.
2. Some heat pumps occasionally turned on during the nights and weekends. We completely ignored the weekends under the assumption that they were intended to be forced off by the facility staff. Then, we filtered out nighttime hours when the heat pump experienced unusually high or low daily heating energy use.
3. HP-20 had iced over outdoor coils on multiple mornings and experienced a long stretch of time during which the compressors did not turn on. We are not sure of the reason for this and attempts to correct the problem failed. So, we are withholding all judgment on its performance aside from suggesting some precautions for future installations. It was removed from the M&V study.
4. The aged compressors on HP-27 failed to turn on for weeks until we discovered that the retrofit controller was not giving enough current to the compressors during a cold start. The algorithm was updated and the poor data was ignored.

MULTI-VENDOR RTU RETROFIT CONTROLLER FIELD STUDY FINAL REPORT NEGAWATT CONSULTING
Page 28 of 50
5. HP-17 fan speed was initially too low during heating and perhaps causing re-entrainment of supply air into return air registers. The algorithm was updated and unusually high or low daily heating energy use was ignored.
6. An HP-26 condenser fan blade assembly fell off of its shaft so the few days before the repair were omitted.
7. HP-26 experienced a long stretch of time during which the compressors did not turn on. After reviewing the BMS graphic and set point, it appeared that a certain point was improperly overridden. This issue was then fixed and those days of failed compressor operation were omitted.
8. The HP-26 supply fan did not turn on during some occupied hours due to the incorrect setting of the fan cycling BMS data point. This was later corrected by the facility manager and that data was ignored.
9. On HP-26, we didn’t properly disable the heating controller from Sept 12 to Dec 12. That data was ignored.
10. On HP-27, the vendor’s thermostat improperly forces the heat pump to provide ventilation throughout the night when the unit should be off. This anomaly was corrected for by ignoring all energy use at night.
11. On HP-27, the economizer appeared to be malfunctioning. This was not corrected for.
Technical, Statistical, and Error Analysis
Coefficient of determination (R²) and coefficient of variation of the root mean squared error (CV-RMSE)
were used to determine model uncertainty. Those calculations are shown in Project Results and
Discussion section. Our first rounds of simple regressions did not yield good correlation so we made
small iterations to our strategy until we arrived at acceptable correlations. For instance, we used
different independent variables, inferred the building heating/cooling balance point from our scatter
plots, and calculated multiple variable regressions using Python scripts.
Our measurement error was as follows:
Power meter errors are about 1%
NOAA weather data has assumed error of zero per (ASHRAE, 2002)
Net Determination Bias was also calculated. However, overall savings uncertainty calculations are not
included.

MULTI-VENDOR RTU RETROFIT CONTROLLER FIELD STUDY FINAL REPORT NEGAWATT CONSULTING
Page 29 of 50
Conclusions
Benefits The main benefit is that energy savings can be substantial. RTU operation may also be improved,
especially if the existing RTU is oversized or the supply diffusers are drafty. Better zone temperature
management is possible. The RTUs could potentially last longer given less runtime and slower speeds. In
most cases, the installation is relatively simple with little zone downtime and minimal occupant impact.
Possible Risks These products add complexity to an existing RTU, add potential points of failure, and may increase
required RTU maintenance. The payback period may be long unless incentives are added. It may be
difficult to prove energy savings unless numerous HVAC units are retrofitted. Choosing appropriate heat
pumps on which to install may be difficult. An RTU must first be in decent condition before the product
is installed or it will be difficult to commission. An up-front survey of the equipment by an experienced
HVAC mechanic may be required.
System and Technology Improvement Opportunities Product cost and installation cost should be minimized to improve payback period. The product should
be simplified to the extent possible to reduce its potential for failure. FDD would be a worthwhile
addition given the upcoming code requirements. Finally, the sequence of operations should be tuned to
the RTU on which the product is installed. This could reduce the potential for failure.
Applicability of Case Study Findings to Other Load Types and Sectors This report most directly applies to office buildings, restaurants, and retail. These buildings on average
likely all have constant volume RTUs serving non-critical spaces.
Considerations for Large-scale and Persistent Market Implementation Vendors should be careful not to overstate the market potential of their products. Buildings with only a
few rooftop units, with dilapidated rooftop units, and/or without a decent HVAC maintenance program
are not good prospective customers. Payback period would lengthen if significant on-site commissioning
or troubleshooting is required.
Possible future Study M&V sampling error would be greatly reduced if multiple controllers by the same vendor were installed
and tested in multiple building types in multiple climate zones. Another potential study would be to
calculate savings using Energy Plus whole building models as was done in (W. Wang, 2012). However,
specific sequence of operations details from each vendor would be needed.

MULTI-VENDOR RTU RETROFIT CONTROLLER FIELD STUDY FINAL REPORT NEGAWATT CONSULTING
Page 30 of 50
Glossary and Acronyms ASHRAE – American Society of Heating, Refrigerating, and Air-Conditioning Engineers
BMS – Building Management System
CAV – Constant Air Volume
CDD – Cooling Degree Days
CEC – California Energy Commission
CEUS – California End-User Survey
CV-RMSE – Coefficient of variation of the root mean squared error
DCV – Demand control ventilation
DOE – Department of Energy
EEBI – Energy Efficiency Business Incentive
EPA – Environmental Protection Agency
FDD – Fault Detection and Diagnostics
HDD – Heating Degree Days
HVAC – Heating, Ventilation, and Air Conditioning
IPMVP – International Performance Measurement & Verification Protocol
IV – Independent Variables
MBCx – Monitoring based commissioning
M&V – Measurement and Verification
NAS – Naval Air Station
NOAA – National Oceanic and Atmospheric Administration
OBF – On-Bill Financing
OEM – Original Equipment Manufacturer
PECI – Portland Energy Conservation, Inc.
PG&E – Pacific Gas & Electric
R² – Coefficient of determination
RTU – Packaged Rooftop Unit
SDG&E – San Diego Gas & Electric
TMY3 – Typical Meteorological Year 3
VAV – Variable Air Volume
VFD – Variable Frequency Drive
MULTI-VENDOR RTU RETROFIT CONTROLLER FIELD STUDY FINAL REPORT NEGAWATT CONSULTING
Page 31 of 50
References Architectural Energy Corporation. (2003). Small HVAC System Design Guide. Sacramento: California
Energy Commission.
ASHRAE. (2002). ASHRAE Guideline 14-2002 Measurement of Energy and Demand Savings. Atlanta:
ASHRAE.
Bes-Tech. (2013). Retrieved from Bes-Tech - Building Energy Solutions and Technologies:
http://www.bes-tech.net/
California Energy Commission. (2010, 01). 2008 Building Energy Efficiency Standards for Residential and
Nonresidential Buildings. Retrieved 01 30, 2013, from Building Energy Efficiency Program -
California Energy Commission: http://www.energy.ca.gov/2008publications/CEC-400-2008-
001/CEC-400-2008-001-CMF.PDF
California Energy Commission. (2013). 2013 Building Energy Efficiency Standards - Marked Version.
Retrieved from 2013 Building Energy Efficiency Standards Related Documents:
http://www.energy.ca.gov/2012publications/CEC-400-2012-004/CEC-400-2012-004-15DAY.pdf
California Energy Commission. (2013). Summary of Changes for the 2013 Standards Update. Retrieved
from 2013 Building Energy Efficiency Standards - California Energy Commission:
http://www.energy.ca.gov/title24/2013standards/2013-03-
12_Changes_for_the_2013_Update_to_Building_Energy_Efficiency_Standards.pdf
Department of Energy. (2012a, March). Buildings Energy Data Book. Retrieved July 27, 2012, from U.S.
DOE Energy Efficiency and Renewable Energy (EERE) Home Page:
http://buildingsdatabook.eren.doe.gov/TableView.aspx?table=5.3.12
Department of Energy. (2012b, March). Buildings Energy Data Book. Retrieved July 27, 2012, from U.S.
DOE Energy Efficiency and Renewable Energy (EERE) Home Page:
http://buildingsdatabook.eren.doe.gov/TableView.aspx?table=5.3.5
Department of Energy. (2012c, March). Buildings Energy Data Book. Retrieved July 27, 2012, from U.S.
DOE Energy Efficiency and Renewable Energy (EERE) Home Page:
http://buildingsdatabook.eren.doe.gov/TableView.aspx?table=5.3.9
Emerson Climate Technologies. (2011). Use of Variable Frequency Drives (VFDs) with Copeland Scroll and
Discus Compressors. Sidney: Emerson Climate Technologies.
Enerfit. (2013). Retrieved from ENERFIT - The HVAC Retrofit That Makes Your Unit Energy Fit:
http://www.enerfit.com/
Honeywell. (2013). Demand Response. Retrieved from
https://buildingsolutions.honeywell.com/Cultures/en-US/Markets/Utilities/DemandResponse/

MULTI-VENDOR RTU RETROFIT CONTROLLER FIELD STUDY FINAL REPORT NEGAWATT CONSULTING
Page 32 of 50
Intellidyne, LLC. (2013). Retrieved from Intellidyne The Power To Save: http://intellidynellc.com/
Itron, Inc. (2006). California Commercial End-Use Survey (CEUS). Retrieved 01 15, 2013, from California
Energy Commission: http://www.energy.ca.gov/ceus/
NorthWrite. (2013). Retrieved from NorthWrite: http://www.northwrite.com/default.asp
Optimum Energy. (2013). Retrieved from Optimum Energy | Architecting Intelligent Energy Solutions:
http://optimumenergyco.com/
PaceControls. (2013). Retrieved from PaceControls Proven, Patented Energy-Saving HVACR Technology:
http://pacecontrols.com/
PECI. (2008). Premium Ventilation Package Testing, Decision Framework Matrix Report - Task 5.
Portland: PECI.
PNNL. (2013, 06 17). June 17, 2013: Advanced RTU Campaign Webinar. Retrieved from Past Webinars |
The Better Buildings Alliance:
https://www4.eere.energy.gov/alliance/sites/default/files/uploaded-
files/AdvancedRTUCampaignWebinar6-17-2013.pdf
REGEN Energy. (2013). Retrieved from Take Your World by Swarm with Swarm Energy Management |
REGEN Energy Inc.: http://www.regenenergy.com/
SDG&E. (2012, 06 18). 2012 Statewide Customized Offering Procedures Manual for Business. Retrieved
02 14, 2013, from Home | San Diego Gas & Electric:
http://www.sdge.com/sites/default/files/documents/572141448/Customized%201.0%20Policy.
pdf?nid=1291
SDG&E. (2012). On-Bill Financing | San Diego Gas & Electric. Retrieved 01 30, 2013, from Home | San
Diego Gas & Electric: http://www.sdge.com/bill-financing
SDG&E. (2012). On-Bill Financing Application. Retrieved 02 14, 2013, from Home | San Diego Gas &
Electric: http://www.sdge.com/sites/default/files/documents/278842558/On-
Bill%20Financing%20Application.pdf?nid=2440
SDG&E. (2012). Save Energy. Earn Incentives. | San Diego Gas & Electric. Retrieved 01 30, 2013, from
Home | San Diego Gas & Electric: http://www.sdge.com/save-energy-earn-incentives
SDG&E. (2012). Savings Tailored to Your Business | San Diego Gas & Electric. Retrieved 02 14, 2013, from
Home | San Diego Gas & Electric: http://www.sdge.com/savings-tailored-your-business
SDG&E. (2012). University and College Partnerships | San Diego Gas & Electric. Retrieved 02 14, 2013,
from Home | San Diego Gas & Electric: http://www.sdge.com/our-commitment/statewide-
partnerships/university-and-college-partnerships

MULTI-VENDOR RTU RETROFIT CONTROLLER FIELD STUDY FINAL REPORT NEGAWATT CONSULTING
Page 33 of 50
Transformative Wave Technologies. (2013). Retrieved from About TWT:
http://transformativewave.com/About.aspx
UC/CSU/IOU Energy Efficiency Partnership. (2007). Retrieved 02 14, 2013, from UC/CSU/IOU Energy
Efficiency Partnership: http://www.uccsuiouee.org/
Viridity Energy. (2013). Retrieved from Viridity Energy: http://viridityenergy.com/
W. Wang, Y. H. (2012). Energy Savings and Economics of Advanced Control Strategies for Packaged Heat
Pumps. Richland: Pacific Northwest National Laboratoy.

MULTI-VENDOR RTU RETROFIT CONTROLLER FIELD STUDY FINAL REPORT NEGAWATT CONSULTING
Page 34 of 50
Appendix A: Project Plan

MULTI-VENDOR RTU RETROFIT CONTROLLER FIELD STUDY FINAL REPORT NEGAWATT CONSULTING
Page 35 of 50

MULTI-VENDOR RTU RETROFIT CONTROLLER FIELD STUDY FINAL REPORT NEGAWATT CONSULTING
Page 36 of 50

MULTI-VENDOR RTU RETROFIT CONTROLLER FIELD STUDY FINAL REPORT NEGAWATT CONSULTING
Page 37 of 50

MULTI-VENDOR RTU RETROFIT CONTROLLER FIELD STUDY FINAL REPORT NEGAWATT CONSULTING
Page 38 of 50

MULTI-VENDOR RTU RETROFIT CONTROLLER FIELD STUDY FINAL REPORT NEGAWATT CONSULTING
Page 39 of 50

MULTI-VENDOR RTU RETROFIT CONTROLLER FIELD STUDY FINAL REPORT NEGAWATT CONSULTING
Page 40 of 50

MULTI-VENDOR RTU RETROFIT CONTROLLER FIELD STUDY FINAL REPORT NEGAWATT CONSULTING
Page 41 of 50
Appendix B: Measurement & Verification Plan
MULTI-VENDOR RTU RETROFIT CONTROLLER FIELD STUDY FINAL REPORT NEGAWATT CONSULTING
Page 42 of 50

MULTI-VENDOR RTU RETROFIT CONTROLLER FIELD STUDY FINAL REPORT NEGAWATT CONSULTING
Page 43 of 50
MULTI-VENDOR RTU RETROFIT CONTROLLER FIELD STUDY FINAL REPORT NEGAWATT CONSULTING
Page 44 of 50

MULTI-VENDOR RTU RETROFIT CONTROLLER FIELD STUDY FINAL REPORT NEGAWATT CONSULTING
Page 45 of 50
MULTI-VENDOR RTU RETROFIT CONTROLLER FIELD STUDY FINAL REPORT NEGAWATT CONSULTING
Page 46 of 50

MULTI-VENDOR RTU RETROFIT CONTROLLER FIELD STUDY FINAL REPORT NEGAWATT CONSULTING
Page 47 of 50

MULTI-VENDOR RTU RETROFIT CONTROLLER FIELD STUDY FINAL REPORT NEGAWATT CONSULTING
Page 48 of 50

MULTI-VENDOR RTU RETROFIT CONTROLLER FIELD STUDY FINAL REPORT NEGAWATT CONSULTING
Page 49 of 50
MULTI-VENDOR RTU RETROFIT CONTROLLER FIELD STUDY FINAL REPORT NEGAWATT CONSULTING
Page 50 of 50
Appendix C: Peer Review Certificate
Alternative Energy Systems Consulting, Inc.
www.aesc-inc.com
(760) 931-2641
_____________________________________________________________________________________
Carlsbad, 11/14/2013
This report file, named
“Multi-Vendor RTU Retrofit Controller Final report 2013-11-12.pdf”
And titled
“Multi-Vendor RTU Retrofit Controller Field Study Final Report”
Has been peer reviewed by us, and our suggestions for improvement have been incorporated. Based on
the information available, we believe that the research was conducted in a sound and rigorous manner
and that the results are accurate and complete as presented.
Antonio Corradini, PE
Director of Engineering of Alternative Energy Systems Consulting Inc.