Multi-temporal LIDAR data for forestry an approach … › 2018 › presentations › Multi...Forest...
17
11 April 2018 Locate Conference Forest yield predictions from multi-temporal LiDAR data UniSA Stefan Peters, Jixue Liu, David Bruce, Jiuyong Li ForestrySA Jim O’Hehir, Mary-Anne Larkin, Anthony Hay Multi-temporal LIDAR data for forestry – an approach to investigate timber yield changes 1
Transcript of Multi-temporal LIDAR data for forestry an approach … › 2018 › presentations › Multi...Forest...

11 April 2018 Locate Conference
Forest yield predictions from multi-temporal LiDAR data
UniSA
Stefan Peters, Jixue Liu, David Bruce, Jiuyong Li
ForestrySA
Jim O’Hehir, Mary-Anne Larkin, Anthony Hay
Multi-temporal LIDAR data for forestry –
an approach to investigate timber yield changes
1

11 April 2018 Locate Conference
Forest yield predictions from multi-temporal LiDAR data
Intro
Study
area
Data-
processing
Modeling
Conclusion
• Use of existing ALS datasets
• Model and predict the ‘change’
Why investigating Multi-Temporal LIDAR data ?
2

11 April 2018 Locate Conference
Forest yield predictions from multi-temporal LiDAR data
Intro
Study
area
Data-
processing
Modeling
Conclusion
𝑃𝑖𝑛𝑒 𝑡𝑟𝑒𝑒 𝑊𝑜𝑜𝑑 𝑉𝑜𝑙𝑢𝑚𝑒 = 𝐷𝐵𝐻
200
2∗ 3.142 ∗ 𝑡𝑟𝑒𝑒_ℎ𝑒𝑖𝑔ℎ𝑡 ∗ 0.35
Determining Timber Yield
3
nikon.com
Measuring circumference DBH
𝐷𝐵𝐻 = 𝐷𝑖𝑎𝑚𝑒𝑡𝑒𝑟 𝑎𝑡 𝑏𝑟𝑒𝑎𝑠𝑡 ℎ𝑒𝑖𝑔ℎ𝑡 (𝑎𝑡 1.37𝑚)
Measuring tree height
11 April 2018 Locate Conference
Forest yield predictions from multi-temporal LiDAR data
Intro
Study
area
Data-
processing
Modeling
Conclusion
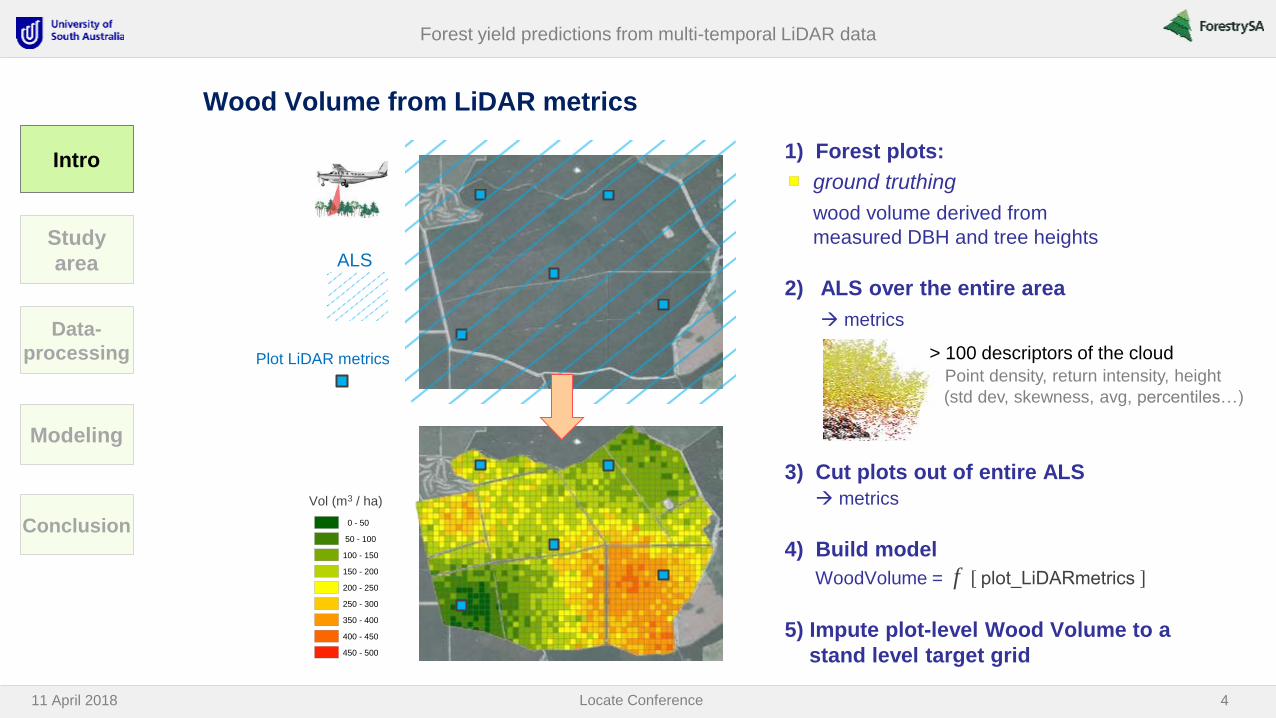
1) Forest plots:
ground truthing
wood volume derived from
measured DBH and tree heights
2) ALS over the entire area
metrics
3) Cut plots out of entire ALS
metrics
4) Build model
WoodVolume = f plot_LiDARmetrics
5) Impute plot-level Wood Volume to a
stand level target grid
Wood Volume from LiDAR metrics
4
ALS
Vol (m3 / ha)
Legend
Y time1
Yield_p_Ha
50 - 55
56 - 60
61 - 65
66 - 69
70 - 72
73 - 75
76 - 80
81 - 85
86 - 95
Y time2
Yield_time
0 - 50
50 - 100
100 - 150
150 - 200
200 - 250
250 - 300
350 - 400
400 - 450
450 - 500
Plot LiDAR metrics > 100 descriptors of the cloud
Point density, return intensity, height
(std dev, skewness, avg, percentiles…)

11 April 2018 Locate Conference
Forest yield predictions from multi-temporal LiDAR data
Intro
Study
area
Data-
processing
Modeling
Conclusion
5

11 April 2018 Locate Conference
Forest yield predictions from multi-temporal LiDAR data
Intro
Study
area
Data-
processing
Modeling
Conclusion
• Single tree type: Radiata Pine
• Planted in 1997
• ~ evenly distributed
Forest features
6

11 April 2018 Locate Conference
Forest yield predictions from multi-temporal LiDAR data
Intro
Study
area
Data-
processing
Modeling
Conclusion
Discrete multi-return Airborne Lidar Scanning (ALS)
7
Flight / data characteristics 2012 ALS flight 2015 ALS flight
Data supplier De Bruin Spatial Technologies AAM
Date of acquisition 15.01.2012 01.04.2015
Data format LAS 1.2 LAZ 1.4
Flying altitude (m ASL) 800 1300
Scan Angle (°) 15 28
Scan overlap (%) 25 15
Mean footprint diameter (cm) 19 25
Mean point density 8.9 8
Point density range inside inventory plots (m-2)
3.4 - 9.2 4 - 8
Horizontal / Vertical accuracy 0.5 m / 0.25 m RMS (1 Sigma) 0.5 m / 0.25 m RMS (1 Sigma)
Datum and projection GDA 1994 / MGA Zone 54 GDA 1994 / MGA Zone 54
ALS metadata
11 April 2018 Locate Conference
Forest yield predictions from multi-temporal LiDAR data
Intro
Study
area
Data-
processing
Modeling
Conclusion
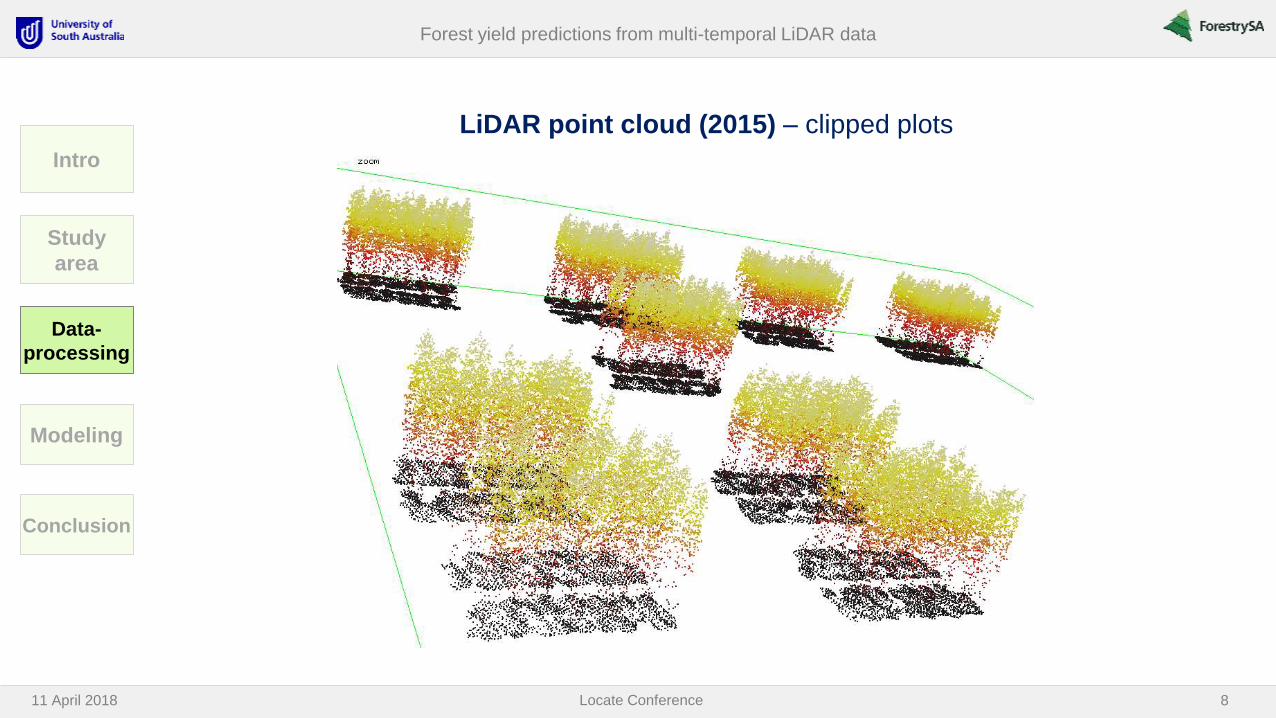
LiDAR point cloud (2015) – clipped plots
8

11 April 2018 Locate Conference
Forest yield predictions from multi-temporal LiDAR data
Intro
Study
area
Data-
processing
Modeling
Conclusion
LIDAR point cloud (LIDAR.las)
LIDAR.laz
Forest boundaries
(.shp)
Initial input data
plot boundaries (.shp)
Ground truth plot tree data: heights, DBH, age etc. (.xls)
forest.laz
convert to
clip
remove outlier
normalize
CHM (.img)
Spike free CHM
Spatial alignment
temporal alignment with
LIDAR flight date
tree wood volume
calculation
LIDAR.laz
Tree / plot wood volume (and
further change information, such as thinning or fire)
buffer 2m
PlotTreeBuffer Polygons.shp
thiessen
PlotTree Thiessen.shp
clip
clip
PlotTreeCrowns.shp
Zonal Statistics - Build Raster
Attribute Table - Raster to Polygon
PlotTreeCrowns withHeight.shp
for each
temporal
LIDAR data
set
clip
ArcGIS model Python script
TreeCrowns.laz
lascanopy
Tree Crown Forest Metrics development of LIDAR derived
wood volume MODEL (e.g. kNN imputation) create
Fishnet
Grid Cells .shp
apply MODEL (imputation)
Forest / Stand Wood Volumes
Lastools batch scripts
aggregate cells
lascanopy
Grid Forest Metrics
LiDAR and
GIS data
processing
flowchart
plot tree stem xy positions
On screen digitizing or TS/GNSS or ITD
input
Method/ tool
output
ArcGIS
Lastools
Grid Cells with predicted
Wood Volumes 9

11 April 2018 Locate Conference
Forest yield predictions from multi-temporal LiDAR data
Intro
Study
area
Data-
processing
Modeling
Conclusion
Plot data
Timber yield modelling: Cost effective update of timber yield estimates
10
time 2 to be
updated
time 1
ALS 1
Vol (m3 / ha)
Legend
Y time1
Yield_p_Ha
50 - 55
56 - 60
61 - 65
66 - 69
70 - 72
73 - 75
76 - 80
81 - 85
86 - 95
Y time2
Yield_time
0 - 50
50 - 100
100 - 150
150 - 200
200 - 250
250 - 300
350 - 400
400 - 450
450 - 500
ALS 2
Plot data

11 April 2018 Locate Conference
Forest yield predictions from multi-temporal LiDAR data
Intro
Study
area
Data-
processing
Modeling
Conclusion
time 2 to be updated
ALS 2015
…first test at our study area
11
time 1
ALS 2012
Timber yield modelling: II) Cost effective update of timber yield estimates

11 April 2018 Locate Conference
Forest yield predictions from multi-temporal LiDAR data
Intro
Study
area
Data-
processing
Modeling
Conclusion
Approach A:
12
* K-Nearest Neighbors prediction model
(k=2, 6-fold cross validation)
plot lidar data
time 1
Approach B:
I grid wood volume time 1
plot lidar data
time 2
II grid level wood volume growth rate (time 1 - 2)
grid wood volume time 2
grid wood volume time 2
measured plot volume
time 2
measured plot volume
time 1
plot lidar data
time 1
measured plot volume increments (time 1 - 2)
kNN* classification
grid level lidar data
time 1 Apply
kNN* classification
grid level lidar data
time 1 Apply
kNN* classification
Apply

11 April 2018 Locate Conference
Forest yield predictions from multi-temporal LiDAR data
Intro
Study
area
Data-
processing
Modeling
Conclusion
Approach A and B grid prediction: relative difference: 1%
Models A and B applied to predict grid-level wood volumes
13
Approach A Approach B
GridID Pred Vol 2015 GridID Pred Vol
2012 Pred Vol Rate Calc Vol 2015
1 24.23 25 17.805 0.379597 24.5637
2 22.46 26 17.805 0.381722 24.6016
3 22.46 27 17.58 0.381722 24.2907
… … … … … …
263 24.12 263 16.395 0.381722 22.6533
264 24.12 264 15.7 0.423105 22.3427
Vol total:
RMSE (plots):
5751.41
1.51
Vol total:
RMSE (plots):
5783.8
1.70
all wood
volumes in m3

11 April 2018 Locate Conference
Forest yield predictions from multi-temporal LiDAR data
Intro
Study
area
Data-
processing
Modeling
Conclusion
Resulting Grid map compared with Site Quality map (2007)
14
Site Quality map (Manual assessment) of wood volume at age 10 (2007)
2015 LiDAR based volume prediction
11 April 2018 Locate Conference
Forest yield predictions from multi-temporal LiDAR data
Intro
Study
area
Data-
processing
Conclusion
Modeling
Proof of concepts:
- Multi-temporal LiDAR data added values
- Model, estimate, predict change of timber yield
- ALS + UAV-LiDAR for cost efficient update of yield estimates
…potentially applied to other applications
(agriculture, vegetation monitoring…)
Conclusion
15

11 April 2018 Locate Conference
Forest yield predictions from multi-temporal LiDAR data
Intro
Study
area
Data-
processing
Conclusion
Modeling
• Enhance wood volume change model and future prediction
– Larger test area
– 3+ multitemporal LiDAR scans
– Higher point density (30 ppm2)
• Investigate change in more detail
– Change of basal area, biomass, …
– Thinning, Harvested trees, gap dynamics, damaged crowns
Outlook
16

11 April 2018 Locate Conference
Forest yield predictions from multi-temporal LiDAR data
Further information:
17
Many thanks