Multi-scale comparisons of tree composition in Amazonian terra ...
13
Biogeosciences, 6, 2719–2731, 2009 www.biogeosciences.net/6/2719/2009/ © Author(s) 2009. This work is distributed under the Creative Commons Attribution 3.0 License. Biogeosciences Multi-scale comparisons of tree composition in Amazonian terra firme forests E. N. Honorio Coronado 1,4 , T. R. Baker 2 , O. L. Phillips 2 , N. C. A. Pitman 3 , R. T. Pennington 4 , R. V ´ asquez Mart´ ınez 5 , A. Monteagudo 2 , H. Mogoll ´ on 6 , N. D ´ avila Cardozo 7 , M. R´ ıos 7 , R. Garc´ ıa-Villacorta 7 , E. Valderrama 7 , M. Ahuite 7 , I. Huamantupa 5 , D. A. Neill 8 , W. F. Laurance 9 , H. E. M. Nascimento 9,10 , S. Soares de Almeida 11 , T. J. Killeen 12 , L. Arroyo 13 , P. N´ u˜ nez 14 , and L. Freitas Alvarado 1 1 Instituto de Investigaciones de la Amazon´ ıa Peruana, Av. A. Jos´ e Qui ˜ nones km 2.5, Iquitos, Peru 2 Earth and Biosphere Institute, School of Geography, University of Leeds, Leeds, UK 3 Center for Tropical Conservation, Duke University, Durham, USA 4 Royal Botanic Garden Edinburgh, 20a Inverleith Row, Edinburgh EH3 5LR, UK 5 Proyecto Flora del Per´ u, Jard´ ın Bot´ anico de Missouri, Oxapampa, Peru 6 Finding Species, 6930 Carroll Ave., Suite 600, P.O. Box 5289, Takoma Park, MD 20912, USA 7 Facultad de Ciencias Biol´ ogicas, Universidad Nacional de la Amazon´ ıa Peruana, Iquitos, Peru 8 Missouri Botanical Garden, c/o Naturaleza y Cultura Internacional, Loja, Ecuador 9 Smithsonian Tropical Research Institute, Balboa, Panama 10 Biological Dynamics of Forest Fragments Project, Manaus, Brazil 11 Museu Paraense Emilio Goeldi, 66.040170 Bel´ em, Par´ a, Brazil 12 Center for Applied Biodiversity Science, Conservation International, Washington D.C., USA 13 Museo Noel Kempff Mercado, Santa Cruz, Bolivia 14 Herbario Vargas, Universidad Nacional San Antonio Abad del Cusco, Cusco, Peru Received: 9 December 2008 – Published in Biogeosciences Discuss.: 29 January 2009 Revised: 3 November 2009 – Accepted: 3 November 2009 – Published: 30 November 2009 Abstract. We explored the floristic composition of terra firme forests across Amazonia using 55 plots. Firstly, we examined the floristic patterns using both genus- and species- level data and found that the species-level analysis more clearly distinguishes among forests. Next, we compared the variation in plot floristic composition at regional- and continental-scales, and found that average among-pair floris- tic similarity and its decay with distance behave similarly at regional- and continental-scales. Nevertheless, geographical distance had different effects on floristic similarity within re- gions at distances <100 km, where north-western and south- western Amazonian regions showed greater floristic varia- tion than plots of central and eastern Amazonia. Finally, we quantified the role of environmental factors and geographical distance for determining variation in floristic composition. A partial Mantel test indicated that while geographical distance appeared to be more important at continental scales, soil fer- tility was crucial at regional scales within western Amazonia, Correspondence to: E. N. Honorio Coronado ([email protected]) where areas with similar soil conditions were more likely to share a high number of species. Overall, these results suggest that regional-scale variation in floristic composition can rival continental-scale differences within Amazonian terra firme forests, and that variation in floristic composition at both scales is influenced by geographical distance and environ- mental factors, such as climate and soil fertility. To fully account for regional-scale variation in continental studies of floristic composition, future floristic studies should focus on forest types poorly represented at regional scales in current datasets, such as terra firme forests with high soil fertility in north-western Amazonia. 1 Introduction One of the scientific challenges in tropical forest ecology is to map and understand the patterns of floristic composi- tion and diversity (Prance et al., 2000; Phillips and Miller, 2002). Describing these patterns is important for predict- ing the mechanisms that determine species distributions and Published by Copernicus Publications on behalf of the European Geosciences Union.
Transcript of Multi-scale comparisons of tree composition in Amazonian terra ...

Biogeosciences, 6, 2719–2731, 2009www.biogeosciences.net/6/2719/2009/© Author(s) 2009. This work is distributed underthe Creative Commons Attribution 3.0 License.
Biogeosciences
Multi-scale comparisons of tree composition in Amazonian terrafirme forests
E. N. Honorio Coronado1,4, T. R. Baker2, O. L. Phillips2, N. C. A. Pitman3, R. T. Pennington4, R. Vasquez Martınez5,A. Monteagudo2, H. Mogollon6, N. Davila Cardozo7, M. Rıos7, R. Garcıa-Villacorta7, E. Valderrama7, M. Ahuite7,I. Huamantupa5, D. A. Neill8, W. F. Laurance9, H. E. M. Nascimento9,10, S. Soares de Almeida11, T. J. Killeen12,L. Arroyo 13, P. Nunez14, and L. Freitas Alvarado1
1Instituto de Investigaciones de la Amazonıa Peruana, Av. A. Jose Quinones km 2.5, Iquitos, Peru2Earth and Biosphere Institute, School of Geography, University of Leeds, Leeds, UK3Center for Tropical Conservation, Duke University, Durham, USA4Royal Botanic Garden Edinburgh, 20a Inverleith Row, Edinburgh EH3 5LR, UK5Proyecto Flora del Peru, Jardın Botanico de Missouri, Oxapampa, Peru6Finding Species, 6930 Carroll Ave., Suite 600, P.O. Box 5289, Takoma Park, MD 20912, USA7Facultad de Ciencias Biologicas, Universidad Nacional de la Amazonıa Peruana, Iquitos, Peru8Missouri Botanical Garden, c/o Naturaleza y Cultura Internacional, Loja, Ecuador9Smithsonian Tropical Research Institute, Balboa, Panama10Biological Dynamics of Forest Fragments Project, Manaus, Brazil11Museu Paraense Emilio Goeldi, 66.040170 Belem, Para, Brazil12Center for Applied Biodiversity Science, Conservation International, Washington D.C., USA13Museo Noel Kempff Mercado, Santa Cruz, Bolivia14Herbario Vargas, Universidad Nacional San Antonio Abad del Cusco, Cusco, Peru
Received: 9 December 2008 – Published in Biogeosciences Discuss.: 29 January 2009Revised: 3 November 2009 – Accepted: 3 November 2009 – Published: 30 November 2009
Abstract. We explored the floristic composition of terrafirme forests across Amazonia using 55 plots. Firstly, weexamined the floristic patterns using both genus- and species-level data and found that the species-level analysis moreclearly distinguishes among forests. Next, we comparedthe variation in plot floristic composition at regional- andcontinental-scales, and found that average among-pair floris-tic similarity and its decay with distance behave similarly atregional- and continental-scales. Nevertheless, geographicaldistance had different effects on floristic similarity within re-gions at distances<100 km, where north-western and south-western Amazonian regions showed greater floristic varia-tion than plots of central and eastern Amazonia. Finally, wequantified the role of environmental factors and geographicaldistance for determining variation in floristic composition. Apartial Mantel test indicated that while geographical distanceappeared to be more important at continental scales, soil fer-tility was crucial at regional scales within western Amazonia,
Correspondence to:E. N. Honorio Coronado([email protected])
where areas with similar soil conditions were more likely toshare a high number of species. Overall, these results suggestthat regional-scale variation in floristic composition can rivalcontinental-scale differences within Amazonian terra firmeforests, and that variation in floristic composition at bothscales is influenced by geographical distance and environ-mental factors, such as climate and soil fertility. To fullyaccount for regional-scale variation in continental studies offloristic composition, future floristic studies should focus onforest types poorly represented at regional scales in currentdatasets, such as terra firme forests with high soil fertility innorth-western Amazonia.
1 Introduction
One of the scientific challenges in tropical forest ecologyis to map and understand the patterns of floristic composi-tion and diversity (Prance et al., 2000; Phillips and Miller,2002). Describing these patterns is important for predict-ing the mechanisms that determine species distributions and
Published by Copernicus Publications on behalf of the European Geosciences Union.

2720 E. N. Honorio Coronado et al.: Tree composition comparisons of Amazonian forests
developing effective conservation strategies in the face of de-forestation and climate change. Although progress is beingmade in assembling the large datasets that are required to un-derstand patterns of tropical forest diversity (e.g. ter Steegeet al., 2006; Pitman et al., 2008), large gaps remain, and therole of different processes determining these patterns at lo-cal, regional, and continental scales is poorly understood. Itis therefore important to develop principles from existing in-formation that can both inform current conservation policyand direct future research.
While there are practical challenges with species-basedanalyses in hyper-diverse Amazonian forests (e.g. Phillipset al., 2003), ideally it is preferable to study variation atthe species, rather than family or genus level, because it isspecies that typically show restricted distributions and henceshould best define floristic patterns. For example, phyto-geographic patterns of Brazilian savannah woodland wereonly clarified using species-level data on floristic composi-tion (Ratter et al., 2003) and gradients in the floristic com-position of plots of the Amazonian floodplain were recentlyresolved by species-level analysis (Wittmann et al., 2006). Inaddition, for a series of forest inventories in western Amazo-nia, Higgins and Ruokolainen (2004) showed that a reduc-tion in taxonomic resolution, from species to genus to familylevel, resulted in a decrease in the mean floristic differencebetween sites (0.88, 0.58 and 0.32 respectively). This declinesuggested that species-level analysis best resolved floristicdifferences between sites. However, in terms of describingthe patterns of floristic variation in Amazonia, most studieshave typically focused on either genus or family level com-parisons (e.g. Terborgh and Andresen, 1998; ter Steege etal., 2000, 2006). In contrast, studies at a species level haveusually either focused on restricted areas in western Ama-zonia (e.g. Higgins and Ruokolainen, 2004; Phillips et al.,2003; Duque et al., 2009) or on a few taxa (e.g. Tuomistoet al., 2003a; Vormisto et al., 2004). Full species-level stud-ies of floristic composition remain difficult to carry out ata continental scale in Amazonia because of the high diver-sity and difficulties of developing datasets with consistentidentifications and nomenclature (Higgins and Ruokolainen,2004). However, largely based on recent taxonomic publica-tions (e.g. Vasquez, 1997; Jørgensen and Leon-Yanez, 1999;Ribero et al., 1999), current ecological datasets do containreliable species-level information for many taxa. These datacould offer insights into whether results from current family-and genus-level analyses of floristic composition are likely toresemble future full species-level analyses.
A second feature of current published analyses is that theytypically focus on a single spatial scale. However, under-standing the relative magnitude of regional and continentalvariation in species composition is important for assessingthe sensitivity of continental-scale compositional patterns torestricted sampling of regional floristic variation. For exam-ple, north-western Amazonia is known for its high beta di-versity at a regional scale (Tuomisto et al., 2003a), but it is
not known how this variability compares to continental-scalepatterns of floristic composition, or to what extent differentforests in this region resemble communities in other parts ofAmazonia. It is also important to consider floristic patternsat different scales, because the mechanisms that determinethese patterns may differ. For example, at a continental-scale, broad gradients in tree composition in Amazonia havebeen related to variation in environmental conditions such assoil fertility and dry season length (Terborgh and Andresen,1998; ter Steege et al., 2000, 2006). The principal gradient infloristic composition contrasts the eastern regions of Amazo-nia (Guiana Shield and Brazil) that are geologically older andhave poorer soils, with western areas where sediments fromthe Andes have been deposited more recently (Quesada et al.,2009a). In addition, a second gradient in composition is as-sociated with the gradient in climate seasonality from south-eastern (southern Bolivia and central Brazil) to north-western(Colombia, Ecuador, and northern Peru) Amazonia. How-ever, at a regional scale within western Amazonia, floristicpatterns have been related to dispersal limitation due to geo-graphical distance, the capacity of a few groups of species todominate large areas (“oligarchies”), large geological units,as well as fine-scale soil heterogeneity (e.g. Pitman et al.,2001; Phillips et al., 2003; Tuomisto et al., 2003a; Vormistoet al., 2004; Fine et al., 2005; Macıa and Svenning, 2005;Montufar and Pintaud, 2006; Ruokolainen et al., 2007; Pit-man et al., 2008; Duque et al., 2009). Different factors maywell be important at different scales but the relative impor-tance of geographical distance and environmental conditions,at both regional and continental scales, has not been studiedin Amazonia.
In this study we address three questions related to floristicpatterns within Amazonia terra firme forests: (1) Do genus-and species-level data give similar patterns of floristic com-position? (2) Is regional- and continental-scale variation infloristic composition similar in magnitude? (3) Do environ-mental factors and geographical distance have a similar rolein explaining floristic dissimilarity at regional and continen-tal scales in Amazonian forests?
2 Materials and methods
2.1 Tree floristic plot data
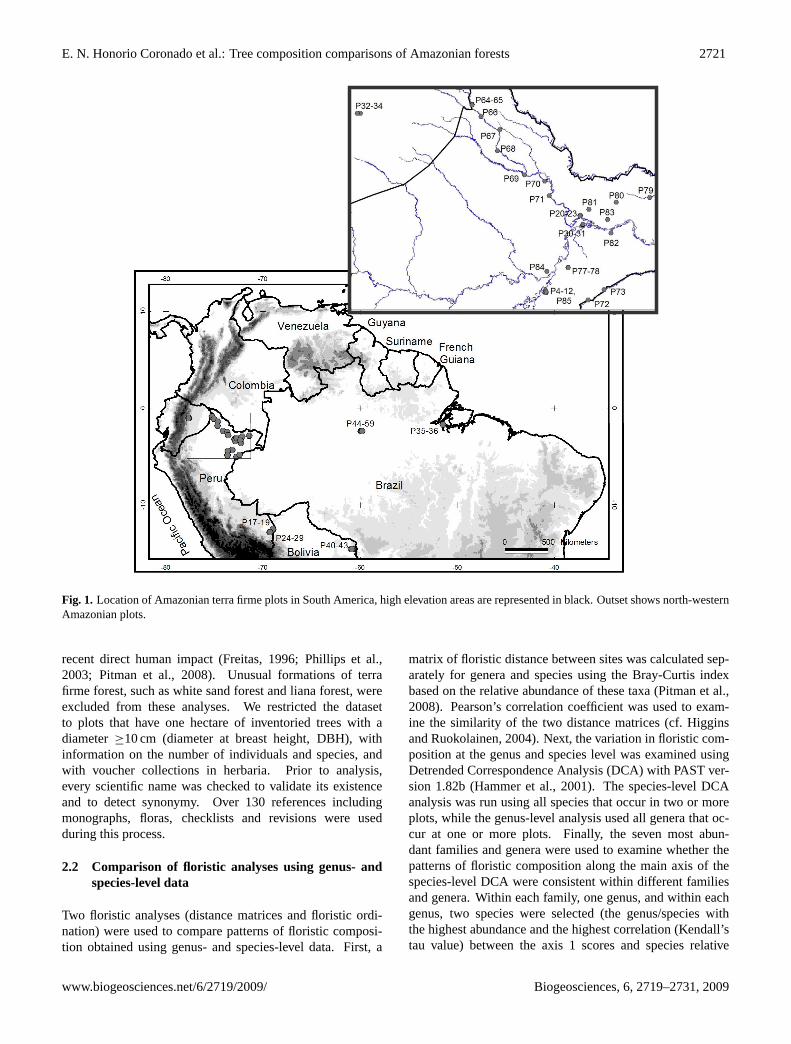
We compiled 55 floristic tree inventories of terrafirme Amazonian forests (supplementary mate-rial (http://www.biogeosciences.net/6/2719/2009/bg-6-2719-2009-supplement.pdf), Fig. 1), of which 30plots are in north-western (NWA; Ecuador and Peru), 13in south-western (SWA; Peru and Bolivia), ten in central(CA; Brazil), and two in eastern regions of Amazonia (EA;Brazil). These plots represent the broad gradients in soilfertility and dry season length across Amazonia (Sombroek,2000; 2001). None of the plots are believed to have had
Biogeosciences, 6, 2719–2731, 2009 www.biogeosciences.net/6/2719/2009/
E. N. Honorio Coronado et al.: Tree composition comparisons of Amazonian forests 2721
1
Figure 1.
Fig. 1. Location of Amazonian terra firme plots in South America, high elevation areas are represented in black. Outset shows north-westernAmazonian plots.
recent direct human impact (Freitas, 1996; Phillips et al.,2003; Pitman et al., 2008). Unusual formations of terrafirme forest, such as white sand forest and liana forest, wereexcluded from these analyses. We restricted the datasetto plots that have one hectare of inventoried trees with adiameter≥10 cm (diameter at breast height, DBH), withinformation on the number of individuals and species, andwith voucher collections in herbaria. Prior to analysis,every scientific name was checked to validate its existenceand to detect synonymy. Over 130 references includingmonographs, floras, checklists and revisions were usedduring this process.
2.2 Comparison of floristic analyses using genus- andspecies-level data
Two floristic analyses (distance matrices and floristic ordi-nation) were used to compare patterns of floristic composi-tion obtained using genus- and species-level data. First, a
matrix of floristic distance between sites was calculated sep-arately for genera and species using the Bray-Curtis indexbased on the relative abundance of these taxa (Pitman et al.,2008). Pearson’s correlation coefficient was used to exam-ine the similarity of the two distance matrices (cf. Higginsand Ruokolainen, 2004). Next, the variation in floristic com-position at the genus and species level was examined usingDetrended Correspondence Analysis (DCA) with PAST ver-sion 1.82b (Hammer et al., 2001). The species-level DCAanalysis was run using all species that occur in two or moreplots, while the genus-level analysis used all genera that oc-cur at one or more plots. Finally, the seven most abun-dant families and genera were used to examine whether thepatterns of floristic composition along the main axis of thespecies-level DCA were consistent within different familiesand genera. Within each family, one genus, and within eachgenus, two species were selected (the genus/species withthe highest abundance and the highest correlation (Kendall’stau value) between the axis 1 scores and species relative
www.biogeosciences.net/6/2719/2009/ Biogeosciences, 6, 2719–2731, 2009

2722 E. N. Honorio Coronado et al.: Tree composition comparisons of Amazonian forests
abundance). For these two taxa within each family or genus,the direction of the correlation between the axis 1 scores andrelative abundance was compared.
2.3 Variation of floristic composition at continental andregional scales
The average floristic similarity and the decay in floristic sim-ilarity with distance were used to compare continental- andregional- floristic patterns. As above, floristic similarity wascalculated using the Bray-Curtis index based on the relativeabundance of species. First, the average (±95% confidencelimit) floristic similarity was calculated at a continental scaleusing all 55 plots and for each region using 30 plots fromNWA, 13 plots from SWA and 12 plots C&E Amazonia,based on 1000 randomly selected pairs of plots within eachgroup. The distribution of floristic similarities was comparedfor all plots, and separately for plots located at distances of<100 or≥100 km. Next, the decay of floristic similarity withdistance was compared between regions and at a continentalscale. Values of geographical distance between plots weretransformed using natural log [ln(x)] to represent the neutraltheory (Hubbell, 2001), that predicts non-linear distance de-cay in floristic similarity. Overlapping 95% confidence lim-its of the intercepts and slopes of the relationship betweenfloristic distance and ln(distance) was used to test for signif-icant differences in the decay of floristic similarity betweenregions and at a continental scale.
2.4 Role of environmental factors and geographical dis-tance in explaining floristic dissimilarity at regionaland continental scales
Partial Mantel tests were used to test the relative influence ofgeographical distance and environmental factors, such as cli-mate (dry season length - DSL) and soil fertility, as determi-nants of the floristic dissimilarity at continental and regionalscales (Tuomisto et al., 2003a; Ruokolainen et al., 2007).The partial Mantel test involves computing the Pearson cor-relation coefficient or standardized Mantel statistic (r) as ameasure of the strength of relationship between two distancematrices, while controlling for correlations with a third dis-tance matrix. Significance was assessed using a Monte Carlorandomization procedure to estimate the probability of er-ror by comparing observed distributions of r against the dis-tribution of random values generated by permuting one ofthe matrices and recalculatingr 999 times (p < 0.001). Thefloristic dissimilarity between two plots was calculated us-ing the Bray-Curtis index based on the relative abundanceof species. Dry season length was calculated as the averagenumber of months per year with rainfall<100 mm. A varietyof methods for quantifying soil fertility were used dependingon the available data. First, for all plots, we used a sim-ple classification developed by Malhi et al. (2004), in whichsoils were classified in eight soil fertility categories (see sup-
plementary material:http://www.biogeosciences.net/6/2719/2009/bg-6-2719-2009-supplement.pdf). In addition, we alsoused plot-level soil data from two databases, one related toplots of NWA (Pitman et al., 2008) and the other related toplots of RAINFOR (Quesada et al., 2009b). These data quan-tify the nutrient content of surface soils (0–20 cm) per eachplot based on at least five random sampling points. Sam-ples were analyzed at La Molina National Agrarian Univer-sity, Peru (Pitman et al., 2008) or the University of Leeds,UK (Quesada et al., 2009b). Soil fertility was quantified inthree ways using these data. Firstly, using the exchangeablecations (Ca++, Mg++, K+, Na+, Al+++) and the sum ofbase cations (SB=Ca+++Mg+++K++Na+) (Huston, 1980),secondly, including only two exchangeable cations (Ca++
and Mg++) and thirdly using all the additional availablesoil data (percentage of sand, clay and silt, and pH in bothdatabases; percentage of organic material, phosphorus, andpotassium – Pitman et al., 2008, and total reserve bases,total extractable P, total P, and total N and C – Quesadaet al., 2009b). Because of the differences in protocols toanalyse soil fertility, the plots associated with each detailedsoil database were analysed separately. Soil data were log-transformed following Phillips et al. (2003). Differences be-tween plots were expressed in Euclidean distances computedseparately for each factor.
3 Results
3.1 Floristic data
The 55 floristic inventories (plots) compiled from Amazo-nia have a total of 32 515 trees with diameter≥10 cm, ofwhich 55% were from the thirty plots of north-western Ama-zonia (NWA), 22% from the 13 plots of south-western Ama-zonia (SWA) and the rest from the twelve plots of central andeastern Amazonia (C&EA). Across all the plots, on average,99.0% of trees were identified to family, 95.8% to genus, and73.2% to species. After the exclusion of the 26.8% of treeswith no reliable species-level scientific name, 93 families,473 genera and 1661 species remained in the entire datasetof which 512 species occurred only in one plot.
3.2 Comparison of floristic analyses using genus- andspecies-level data
The correlation between distance matrices demonstrated thatonly 57% of the floristic variation at the species level wasexplained by the genus-level data. Overall, the species-levelanalysis detected greater floristic differences between plotsthan the genus-level analysis as the average floristic dif-ference between sites increased when the level of analysischanged from genus (0.63) to species (0.87). However, or-dination using DCA showed that the affinities between plotsat the genus and species level were broadly similar (Fig. 2).
Biogeosciences, 6, 2719–2731, 2009 www.biogeosciences.net/6/2719/2009/

E. N. Honorio Coronado et al.: Tree composition comparisons of Amazonian forests 2723
1
Figure 2a.
(a)
Axis 1
Axis
2
1
Figure 2b.
(b)
Axis 1
Axis
2
Fig. 2. DCA ordinations of the relative abundance of(a) 473 genera, and(b) 1149 species (excluding those that occur at only one plot)occurring in 55 Amazonian terra firme plots. Symbols: (1) C and E; (©) NW, and (�) SW Amazonia.
The relatively low correlation between species- and genus-level distance matrices was caused by a specific group ofsites: plots from Manaus and Caxiuana (C&EA), Jenaro Her-rera, Quebrada Blanco and some of the plots from the NapoRiver (NWA) were rather similar in terms of genus-levelcomposition, and were only distinguished using species-level
analysis (Fig. 2). If these plots are excluded, the axis 1DCA scores for the two ordinations calculated using genusand species data, were very similar and closely correlated(slope = 1.06±0.16,r2
= 0.84).
Additional results also suggested that the species-level data were more effective than the genus level at
www.biogeosciences.net/6/2719/2009/ Biogeosciences, 6, 2719–2731, 2009

2724 E. N. Honorio Coronado et al.: Tree composition comparisons of Amazonian forests
distinguishing between plots. For example, in the DCA atthe genus level, the first axis explained only 42.0% of thefloristic variation, while at the species level, the equivalentvalue was 72.5%. In addition, the percentage of species witha strong correlation with the first axis (6.4% of species withtau≥0.5) was higher than the percentage of genera (3.2% ofgenera with tau≥0.5).
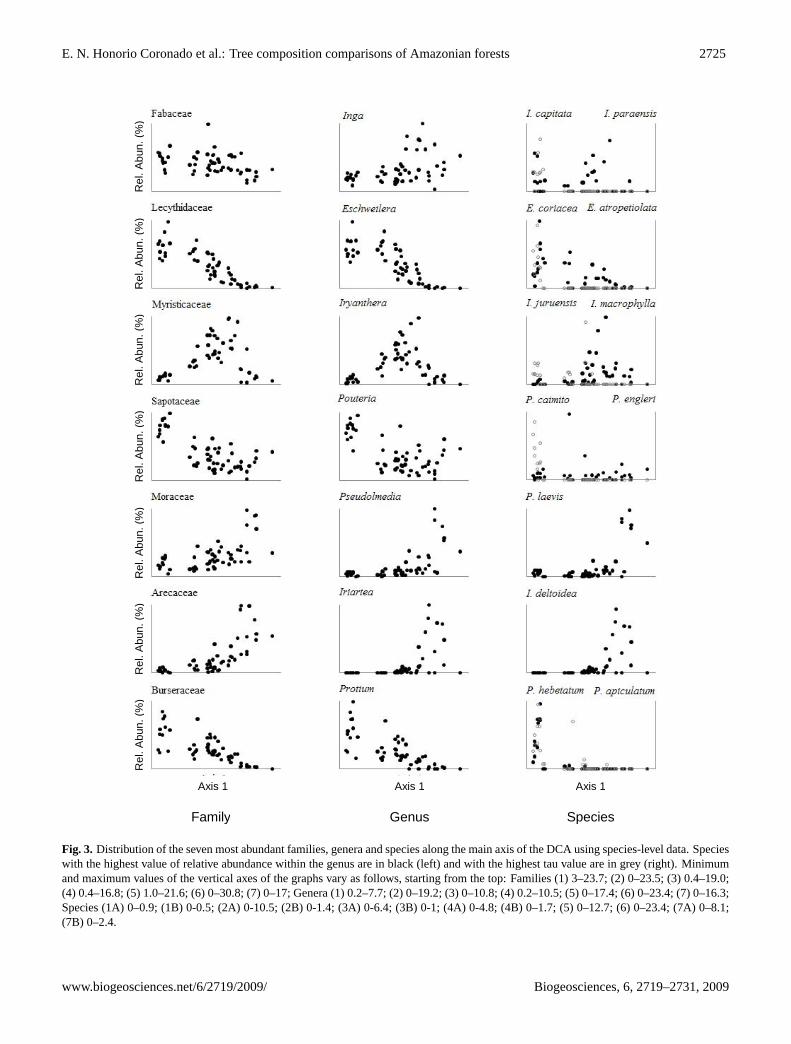
In general, along the first axis, plots were distributedaccording to the regions where they occurred, along aneast/west axis: plots with low scores on axis 1 were foundin C&E Amazonia and plots with high axis 1 scores oc-cur in WA (Fig. 2). Lecythidaceae, Sapotaceae and Burs-eraceae and the generaEschweilera, Pouteria and Protiumincreased in abundance from EA to WA, while the Moraceaeand Arecaceae and their generaPseudolmediaand Iriarteashowed the opposite trend; the only well-distributed familywas the Fabaceae. The Myristicaceae and its genusIryan-therawere more abundant in most of the north-western Ama-zonian plots. While the most abundant species showed simi-lar relationships between their relative abundance and axis 1scores as their respective genus and family, other species,such asPouteria engleriand Inga capitata(Fig. 3) demon-strated that rather different patterns could be found withinsome groups, highlighting the value of species-level analy-ses.
3.3 Variation of floristic composition at regional andcontinental scales
At a continental scale, floristic similarity values ranged from0.3% (plot 41 vs. plot 78) to 70.3% (plot 42 vs. plot 43)showing that some plots contained almost entirely differentspecies, while others were almost identical. Even thoughhigh similarity values were common between plots locatedclosed to each other, high values were also found betweenplots separated by great distances. For example, a similar-ity value of 17.0%±1.5 was found between plots from Tam-bopata and Cuzco Amazonico in SWA, and plots from Yana-mono, Buenavista, Rio Orosa and Jatun Sacha in NWA thatare 930–1600 km apart. High similarity values (13.2%±1.2)were also found between plots separated by similar long dis-tances (approx. 1550 km), between plots from Jenaro Her-rera in NWA and plots from Manaus in CA. At a regionalscale, floristic similarity values ranged from 1.6% (plot 4 vs.plot 34) to 61.5% (plot 77 vs. plot 78) in NWA, from 4.8%(plot 29 vs. plot 41) to 70.3% (plot 42 vs. plot 43) in SWA,and from 13.1% (plot 35 vs. plot 54) to 57.9% (plot 56 vs.plot 57) in C&EA.
The average floristic similarity between plots at a con-tinental scale was 0.135 – lower than the values for thedifferent regions – 0.198 in NWA, 0.224 in SWA, and0.366 in C&E Amazonia. However, none of these val-ues were significantly different (95% Confidence limits:ALL = 0.021–0.475; NWA = 0.054–0.417; SWA = 0.059–0.603; C&EA = 0.138–0.562). There were greater differ-
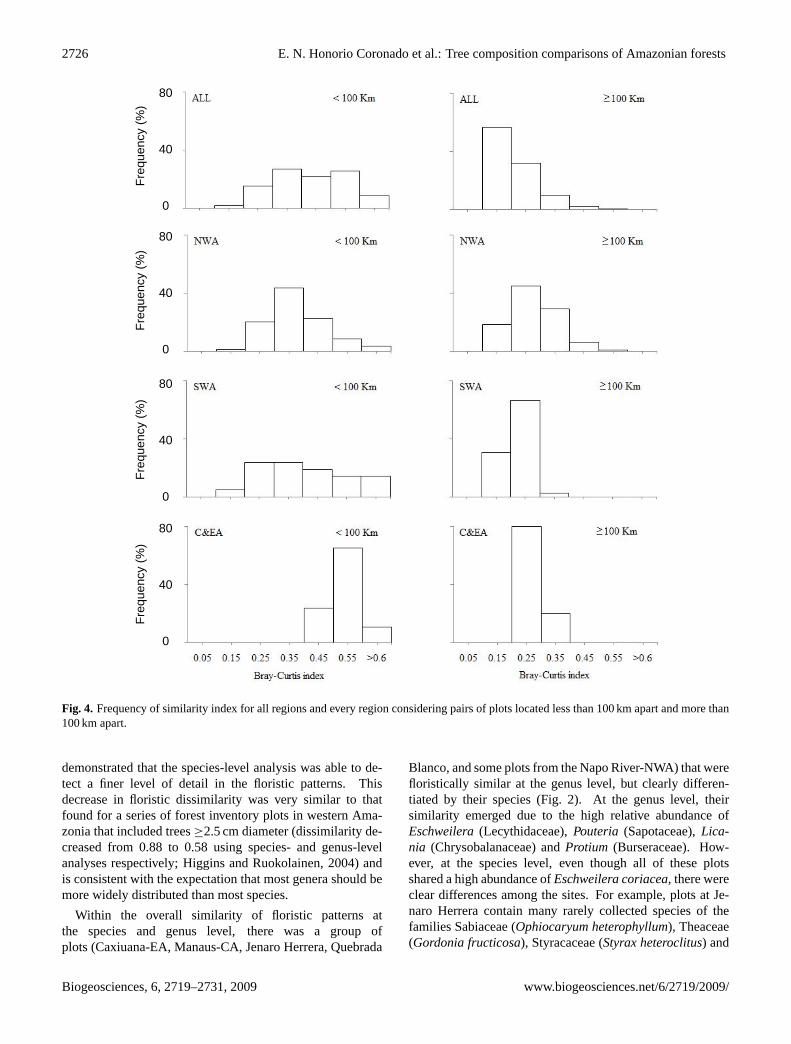
ences when only plots less than 100 km apart were consid-ered separately (Fig. 4). At this scale, all plots within C&EAhave relatively high similarity values. In contrast, in NWAand SWA some pairs of plots were floristically very differ-ent (<10% of similarity) even at such small scales (e.g. Su-cusari (plot 23) and Rio Orosa (plot 82) in Loreto and plots ofCuzco Amazonico (plots 17 and 19) and Tambopata (plot 28)in Madre de Dios).
Floristic similarity between plot pairs declined withincreasing distance at continental and regional scales asa natural-log function of distance. Distance explaineda lower proportion of the variation in floristic simi-larity in NWA than in other regions (r2: ALL=0.662;NWA=0.274; SWA=0.577; C&EA=0.889). Never-theless, neither the slopes nor the intercepts of thelinear regressions were significantly different betweenany region or with the continental-scale pattern (slope±95% CI: ALL=−0.053±0.002; NWA=−0.042±0.007;SWA=−0.046±0.009; C&EA=−0.051±0.004; intercepts±95% CI: ALL=0.834±0.026; NWA=0.704±0.081;SWA=0.759±0.102; C&EA=0.844±0.041).
3.4 Role of environmental factors and geographical dis-tance in explaining floristic dissimilarity at regionaland continental scales
The partial Mantel test showed that geographical distance,soil fertility and climate all explained significant parts offloristic dissimilarity both at continental and regional scales.Using the soil classes as a measure of soil fertility at a conti-nental scale, geographical distance (41.1%) explained moreof the floristic dissimilarity than soils (22.9%) and climate(5.8%). A similar pattern was observed in SWA, although thecontribution of climate was not significant (0.5%,p > 0.05).In contrast, in NWA, the most important factor was soils(11.3%) followed by geographical distance (7.1%) and cli-mate (6.7%). When plot-level soil data were used, this con-trast between the relative importance of soils and distance inNWA and at a continental scale remained. However, the pat-terns for SWA were less robust, with a switch from a higherrelative importance of distance to a higher value for soil fer-tility (10.3%). When only Ca and Mg were considered, thepercentage of the variation explained by each factor was usu-ally higher than when all cations or soil data were includedat both scales (Table 1).
4 Discussion
4.1 Do genus- and species-level data provide similarpatterns of floristic composition?
Overall, genus- and species-level information produced sim-ilar floristic patterns (Fig. 2). However, the decrease in aver-age floristic dissimilarity (0.87 to 0.63), caused by a reduc-tion in taxonomic resolution from species to genus, clearly
Biogeosciences, 6, 2719–2731, 2009 www.biogeosciences.net/6/2719/2009/
E. N. Honorio Coronado et al.: Tree composition comparisons of Amazonian forests 2725Figure 3.
Re
l.A
bun
.(%
)R
el.
Ab
un
.(%
)R
el.
Ab
un
.(%
)R
el.
Ab
un
.(%
)R
el.
Ab
un
.(%
)R
el.
Ab
un
.(%
)R
el.
Ab
un
.(%
)
Axis 1 Axis 1Axis 1
Family Genus Species
Fig. 3. Distribution of the seven most abundant families, genera and species along the main axis of the DCA using species-level data. Specieswith the highest value of relative abundance within the genus are in black (left) and with the highest tau value are in grey (right). Minimumand maximum values of the vertical axes of the graphs vary as follows, starting from the top: Families (1) 3–23.7; (2) 0–23.5; (3) 0.4–19.0;(4) 0.4–16.8; (5) 1.0–21.6; (6) 0–30.8; (7) 0–17; Genera (1) 0.2–7.7; (2) 0–19.2; (3) 0–10.8; (4) 0.2–10.5; (5) 0–17.4; (6) 0–23.4; (7) 0–16.3;Species (1A) 0–0.9; (1B) 0-0.5; (2A) 0-10.5; (2B) 0-1.4; (3A) 0-6.4; (3B) 0-1; (4A) 0-4.8; (4B) 0–1.7; (5) 0–12.7; (6) 0–23.4; (7A) 0–8.1;(7B) 0–2.4.
www.biogeosciences.net/6/2719/2009/ Biogeosciences, 6, 2719–2731, 2009
2726 E. N. Honorio Coronado et al.: Tree composition comparisons of Amazonian forestsFigure 4.
Fre
quency
(%)
80
40
0
Fre
quency
(%)
80
40
0
Fre
quency
(%)
80
40
0
Fre
quency
(%)
80
40
0
Fig. 4. Frequency of similarity index for all regions and every region considering pairs of plots located less than 100 km apart and more than100 km apart.
demonstrated that the species-level analysis was able to de-tect a finer level of detail in the floristic patterns. Thisdecrease in floristic dissimilarity was very similar to thatfound for a series of forest inventory plots in western Ama-zonia that included trees≥2.5 cm diameter (dissimilarity de-creased from 0.88 to 0.58 using species- and genus-levelanalyses respectively; Higgins and Ruokolainen, 2004) andis consistent with the expectation that most genera should bemore widely distributed than most species.
Within the overall similarity of floristic patterns atthe species and genus level, there was a group ofplots (Caxiuana-EA, Manaus-CA, Jenaro Herrera, Quebrada
Blanco, and some plots from the Napo River-NWA) that werefloristically similar at the genus level, but clearly differen-tiated by their species (Fig. 2). At the genus level, theirsimilarity emerged due to the high relative abundance ofEschweilera(Lecythidaceae),Pouteria (Sapotaceae),Lica-nia (Chrysobalanaceae) andProtium (Burseraceae). How-ever, at the species level, even though all of these plotsshared a high abundance ofEschweilera coriacea, there wereclear differences among the sites. For example, plots at Je-naro Herrera contain many rarely collected species of thefamilies Sabiaceae (Ophiocaryum heterophyllum), Theaceae(Gordonia fructicosa), Styracaceae (Styrax heteroclitus) and
Biogeosciences, 6, 2719–2731, 2009 www.biogeosciences.net/6/2719/2009/

E. N. Honorio Coronado et al.: Tree composition comparisons of Amazonian forests 2727
Anisophyllaceae (Anisophyllea guianensis; Spichiger et al.,1989, 1990). In the 55 plots assembled, these species wereonly present in up to four plots from the Napo River, Que-brada Blanco, Yanamono, and Sucusari in Peru and Huan-chaca Dos in Bolivia. In contrast, plots at Manaus were char-acterized by the high species richness of the generaEschweil-era andPouteria (de Oliveira and Mori, 2001): at least tennew species of the family Sapotaceae have been recently de-scribed from the original collections in Manaus (Pennington,2006).
These different floristic relationships could be an artefactof varying levels of taxonomic resolution. For example, if aspecies that grows in both sites, but is correctly identified inone plot (included in the analysis) but misidentified or identi-fied to an unknown species in another plot (excluded from theanalysis), this will tend to decrease the species-level floristicsimilarity between plots. However, both the sites at JenaroHerrera and Manaus have a long history of botanical workand many of the same taxonomists have been involved in theidentification process. In general, even though these errorsmay have occurred, plots established by different researchteams do sometimes group together in the ordination becauseof the presence and high abundance of specific species (e.g.the cluster containing Jatun Sacha – D. Neill; Orosa, Bue-navista – N. Pitman; Yanamono – R. Vasquez; Fig. 2b): dif-ferent research teams working in high diversity forests canreport very similar floristic results. Alternatively, the differ-ent patterns at the species and genus level may reflect funda-mental differences in the underlying mechanisms that havedetermined the patterns. We suspect that the genus-level sim-ilarity may be due to the similar low fertility of the two sites,while the species-level differences may reflect a stronger rolefor dispersal limitation on the distribution of more recentlyevolved species.
4.2 Is regional- and continental-scale variation in floris-tic composition similar in magnitude?
In this study, both the average floristic similarity and its de-cay with distance were not significantly different among re-gions or between regional and continental scales. The decaymodel using individuals that occur in two or more plots inthis analysis decreased significantly with distance, and thedistance decay was similar to that demonstrated by Con-dit et al. (2002) using all individuals of trees from Yasuni(Ecuador) and Manu (Peru), by Duque et al. (2009) usingall individuals of trees from the Colombian Amazonia andby Tuomisto et al. (2003a) using specific taxa (Pteridophytesand Melastomataceae) in western Amazonia. Our results areconsistent with a significant role for dispersal limitation, akey process that determines species turnover in space underneutral models (Hubbell, 2001; Condit et al., 2002; Duque etal., 2009).
However, the comparisons here also emphasise that verydissimilar forests can also occur nearby, and that floristically
Table 1. Relative importance of geographical distance, soil fertilityand climate in explaining variation in floristic dissimilarity at conti-nental and regional scales. Values from top to bottom represent theMantel coefficient (r), variation explained by a factor controlled bythe other two factors (%) and p-value.
Distance Soils Climate
ContinentalGeneral soil classificationN=30 plots 0.641 0.478 0.241
41.1% 22.9% 5.8%(0.001) (0.001) (0.001)
Cations and sum of basesN=18 plotsa 0.554 0.181 0.266
30.6% 3.3% 7.1%(0.001) (0.060) (0.002)
Mg and CaN=18 plotsa 0.581 0.360 0.261
33.7% 12.9% 6.8%(0.001) (0.001) (0.002)
Available soil dataN=18 plotsa 0.543 0.247 0.311
29.5% 6.1% 9.7%(0.001) (0.016) (0.001)
Regional – NWAGeneral soil classificationN=30 plots 0.259 0.336 0.266
6.7% 11.3% 7.1%(0.001) (0.001) (0.001)
Cations and sum of basesN=14 plotsb 0.240 0.389 0.068
5.7% 15.1% 0.5%(0.026) (0.004) (0.263)
Mg and CaN=14 plotsb 0.259 0.440 0.065
6.7% 19.4% 0.4%(0.020) (0.001) (0.288)
Available soil dataN=14 plotsb 0.163 0.433 −0.052
2.7% 18.7% 0.3%(0.080) (0.001) (0.633)
Regional – SWAGeneral soil classificationN=13 plots 0.569 0.337 −0.074
32.4% 11.4% 0.5%(0.001) (0.002) (0.769)
Cations and sum of basesN=10 plotsa 0.056 0.223 0.165
0.3% 5.0% 2.7%(0.357) (0.077) (0.139)
Mg and CaN=10 plotsa 0.201 0.371 0.273
4.1% 13.7% 7.5%(0.104) (0.017) (0.045)
Available soil dataN=10 plotsa 0.166 0.321 0.273
2.8% 10.3% 7.5%(0.149) (0.028) (0.041)
General soil classification following Malhi et al. (2004),a Quesadaet al. (2009b),b Pitman et al. (2008)
www.biogeosciences.net/6/2719/2009/ Biogeosciences, 6, 2719–2731, 2009

2728 E. N. Honorio Coronado et al.: Tree composition comparisons of Amazonian forests
similar pairs of plots can be found much further away. Inthese cases, floristic similarity cannot be predicted by thedistance decay model. For example, a wide range of floris-tic similarity was found for plots within 100 km in NWA re-sembling the continental-scale patterns (Fig. 4). Such highbeta diversity of the north-western Amazonia region has beennoted previously (Tuomisto et al., 2003a; Ruokolainen et al.,2007). Conversely, our results also supported the observa-tion that within Amazonia, some species remained dominantat large scales and therefore distant forests can be floristi-cally rather similar. Pitman et al. (2001) showed this pat-tern with Iriartea deltoidea, the most common tree speciesin both Yasuni in NWA (Ecuador) and Manu in SWA (Peru;45–49 individuals/ha) and similar results were obtained byMacıa and Svenning (2005) for a series of 0.1 ha plots in Ma-didi in Bolivia and Yasuni in Ecuador. Although the identityof abundant species was often different in our set of forestplots, this pattern was very similar to our findings in terrafirme forests at continental and regional scales. For example,at a continental scale, species such asEschweilera coriacea(Lecythidaceae) was one of the most abundant species in Je-naro Herrera and Manaus/Caxiuana located 1550–2500 kmapart, andIriartea deltoidea(Arecaceae) dominates forestsin Jatun Sacha and Tambopata/Cusco Amazonico, 1600 kmapart. At a regional scale, regardless of the geographi-cal distance within north-western Amazonia, distinct groupsof species dominated nutrient-rich soils such as those ofYanamono, Buenavista, Rio Orosa and Jatun Sacha (Otobaparvifolia, O. glycycarpa, Iryanthera juruensis, I. paraen-sis), which were located 70–720 km apart and the nutrient-poor soils of Jenaro Herrera and Sucusari (Eschweilera co-riacea, Micropholis guyanensis, Minquartia guianensisandOsteophloeum platyspermum), which were located 200 kmapart.
4.3 Do environmental factors and geographical distancehave a similar role in explaining floristic dissimilar-ity at regional and continental scales in Amazonianforests?
The geographical distance and the environmental factors,such as soil fertility and dry season length, explained part ofthe floristic dissimilarity at continental and regional scales.While geographical distance appears to be more importantat a continental scale, soil fertility was more important at aregional scale within western Amazonia (Table 1).
Our results are consistent with evidence that adaptationto different edaphic conditions plays a key role in deter-mining spatial variation in floristic composition (Gentry,1988; Tuomisto et al., 1995). In this study, we showedthat the abundance of groups of species is related to thegradients in soil fertility at both regional and continentalscales. Species of Lecythidaceae and Sapotaceae were char-acteristically found on poorer soils and species of Arecaceaeand Myristicaceae were more commonly found on richer
soils. Using pteridophytes and the family Melastomataceae,Tuomisto et al. (2003a) demonstrated that environmental fac-tors, especially soil type, were also important for species dis-tribution and abundance patterns within terra firme forestsin western Amazonia. Similar results were shown using thesame taxa in a one-hectare plot in Ecuador (Poulsen et al.,2006), a 43-km long transect in northern Peru (Tuomisto etal., 2003b), palms in north-western Amazonia (Vormisto etal., 2004; Normand et al., 2006), species of trees with diam-eter≥10 cm in specific areas in Colombia (Duivenvoorden,1995), a network of 0.1 ha plots in south-western Amazonia(Phillips et al., 2003) and at a broader scale, using genera oftrees from the whole of Amazonia (ter Steege et al., 2006).
Cation concentrations, and particularly Mg++ and Ca++,may play a key role in the process of determining domi-nant species. For plants, magnesium plays a critical rolein many physiological processes such as seed germinationand the production of chlorophyll and fruits while calcium isused to regulate physiological processes that influence bothgrowth and responses to environmental stresses (Mc Laugh-lin and Wimmer, 1999). Concentrations of soil cations arealso associated with various aspects of forest structure andfunction: cations can affect seedling growth rates of tropi-cal trees (e.g. Denslow et al., 1987) and are associated withfloristic patterns and habitat preferences in Asian tropicalforests (e.g. Baillie et al., 1987; Paoli et al., 2006). However,where concentrations of soil cations are low, the concentra-tions of aluminium may also be important: low concentra-tions of Mg and Ca are associated with very high aluminiumcontents in Amazonian soils (Quesada et al., 2009a). Thismight be particularly important for groups of trees, such assome genera of Melastomataceae, which are aluminium ac-cumulators (Jansens et al., 2002). For example, Tuomisto etal. (2003a) and Ruokolainen et al. (2007) using full inven-tories of Melastomataceae found that Ca and Mg explainedpart of the floristic patterns in terra firme forests in Amazo-nia while aluminium concentrations correlated with speciesdiversity and richness (Tuomisto and Ruokolainen, 2005).Further studies of soil properties, such as phosphorus frac-tionation, are required in order to understand more fully therole of soils in determining floristic patterns.
A large percentage of the floristic variation that we foundremained unexplained by the combination of factors exam-ined in this paper (ALL: 30–60%; NWA: 75–80%; SWA:55–95%). Therefore it is likely that there were additional,as yet unmeasured factors that may affect the floristic pat-terns. These may include the effects of historical climateand geological changes on species distribution and diversi-fication. For example, de Oliveira and Nelson (2001), us-ing the abundance of genera in different sites in the Brazil-ian Amazon, showed that factors such as past disturbancehistory may be important in determining floristic dissimi-larities. Pitman et al. (2008) discussed a range of possiblehistorical explanations for the disjunction in species com-position that occurs at the Peruvian and Ecuadorian border.
Biogeosciences, 6, 2719–2731, 2009 www.biogeosciences.net/6/2719/2009/

E. N. Honorio Coronado et al.: Tree composition comparisons of Amazonian forests 2729
Additional work in population genetics and community phy-logenetics may help differentiate the role of historical andecological processes in determining patterns of compositionand diversity. For example, population genetics could ex-amine whether rare species are more dispersal limited com-pared to dominant tropical tree species. In addition, by usingspecies-level phylogenies, it is now possible to examine therelative contribution that habitat specialisation and dispersalevents have played in the plant community evolutionary pro-cess (e.g. Fine et al., 2005).
4.4 Implications for biodiversity conservation
The finding that soil fertility is a good predictor of floristicpatterns in Amazonia means that detailed soil maps wouldbe required to predict the floristic composition of unsam-pled forests, and to direct conservation policy. For exam-ple, based on ecological inventories of a particular forest typelocated closed to Iquitos, the Allpahuayo-Mishana area wasprotected to conserve the unusual flora and fauna related tothe white-sand soils (Salo and Pyhala, 2007). Effective con-servation strategies would need to include similar processesto ensure protected areas include other soil types such asthose occurring in Jatun Sacha and Orosa (nutrient-rich soils)or in Jenaro Herrera and Sucusari (nutrient-poor soils).
Finally, this study also demonstrates the need to analyzefloristic data to the species level to best define floristic pat-terns and to achieve a better understanding of the importanceof environmental factors for floristic variation within Ama-zonia. Areas that are currently poorly represented in regionalinventories, such as terra firme forests on the rare Holoceneformations in north-western Amazonia or the region locatedbetween Manaus and Caxiuana in Brazil, should be includedin such efforts.
Acknowledgements.This manuscript was based on the MScthesis of EH supported by the Programme Alban, the EuropeanUnion Programme of High Level Scholarships for Latin America,scholarship No. E05M050715PE and the Royal Botanic GardenEdinburgh. Most of the data (except the Pitman data) were suppliedby the RAINFOR project database developed by J. Peacock andG. Gonzalez-Lopez. RAINFOR is supported by the Gordon andBetty Moore Foundation. In addition, we gratefully acknowledgethe many funding agencies that financed the field data collection.Recent plots at Jenaro Herrera and Sucusari were funded by NaturalGeographic Society and Natural Environment Research Councilgrants to OP and plots at the Napo River by National ScienceFoundation grant to NP. We thank to the Peruvian Ministry ofNatural Resources (INRENA) for permission to conduct fieldworkin Peru.
Edited by: J. Lloyd
References
Baillie, I., Ashton, P., Court, M., Anderson, J., Fitzpatrick, E.,and Tinsley, J.: Site characteristics and the distribution of tree
species in mixed dipterocarp forest on tertiary sediments in cen-tral Sarawak, Malaysia, J. Trop. Ecol., 3, 201–220, 1987.
Condit, R., Pitman, N., Leigh Jr., E., Chave, J., Terborgh, J., Foster,R., Nunez, P., Aguilar, S., Valencia, R., Villa, G., Muller-Landau,H., Losos, E., and Hubbell, S.: Beta-Diversity in tropical foresttrees, Science, 295, 666–669, 2002.
Davila, N. and Rıos, M.: Composicion florıstica, estructura y di-versidad de un bosque de tierra firme de la Estacion BiologicaQuebrada Blanco (Rıo Quebrada Blanco), Loreto, Peru, B.Sc.Thesis, Universidad Nacional de la Amazonıa Peruana, Peru, 70pp., 2006.
de Oliveira, A. and Nelson, B.: Floristic relationships of terra firmeforests in the Brazilian Amazon, Forest Ecol. Manag., 146, 169–179, 2001.
Denslow, J., Vitousek, P., and Schultz, J.: Bioassays of nutrientlimitation in a tropical rain forest soil, Oecologia, 74, 370–376,1987.
Duivenvoorden, J.: Tree species composition and rain forest-environment relationships in the middle Caqueta area, Colombia,NW Amazonia, Vegetatio, 120, 91–113, 1995.
Duque, A., Phillips, J., von Hildebrand, P., Posada, C., Prieto, A.,Rudas, A., Suescun, M., and Stevenson, P.: Distance decay oftree species similarity in protected areas on Terra Firme forestsin Colombian Amazonia, Biotropica, 41, 599–607, 2009.
Fine, P., Daly, D., Villa, G., Mesons, I., and Cameron, K.: Thecontribution of edaphic heterogeneity to the evolution and diver-sity of Burseraceae trees in the Western Amazon, Evolution, 59,1464–1478, 2005.
Freitas, L.: Caracterizacion florıstica y structural de cuatro comu-nidades boscosas de terraza baja en la zona de Jenaro Herrera,Amazonıa Peruana, Documento Tecnico No. 26, Instituto de In-vestigaciones de la Amazonıa Peruana, Peru, 77 pp., 1996.
Gentry, A.: Changes in plant community diversity and floristic com-position on environmental and geographical gradients, Ann. MOBot. Gard., 75, 1–34, 1988.
Hammer, O., Harper, D. A. T., and Ryan, P. D.: PAST: Palaeonto-logical Statistics software package for education and data analy-sis, Palaeontol. Electron., 4, 1–9, 2001.
Higgins, M. and Ruokolainen, K.: Rapid tropical forest inventory:A comparison of techniques based on inventory data from West-ern Amazonia, Conservation Biology, 18, 799–811, 2004.
Hubbell, S.: The Unified Neutral Theory of Biodiversity and Bio-geography, Monographs in population biology, 32, PrincetonUniversity Press, USA, 448 p., 2001.
Huston, M.: Soil nutrients and tree species richness in Costa Ricanforests, J. Biogeogr., 7, 147–157, 1980.
Jansens, S., Broadley, M., Robbrecht, E., and Smets, E.: Alu-minium hyperaccumulation in Angiosperms: A review of itsphylogenetic significance, The Botanical Review, 68, 235–269,2002.
Jorgensen, P. and Leon-Yanez, S.: Catalogue of the Vascular Plantsof Ecuador, Monogr. Syst. Bot. MO Bot. Gard., 75, 1–1181,1999.
Macıa, M. and Svenning, J.-C.: Oligarchic dominance in west-ern Amazonian plant communities, J. Trop. Ecol., 21, 613–626,2005.
Malhi, Y., Baker, T. R., Phillips, O., Almeida, S., Alvarez, E., Ar-royo, L., Chave, J., Czimczik, C. I., Di Fiore, A., Higuchi, N.,Killeen, T., Laurance, S., Laurance, W., Lewis, S., Montoya,
www.biogeosciences.net/6/2719/2009/ Biogeosciences, 6, 2719–2731, 2009

2730 E. N. Honorio Coronado et al.: Tree composition comparisons of Amazonian forests
L., Monteagudo, A., Neill, D., Vargas, P., Patino, S., Pitman,N., Quesada, C., Salomao, R., Silva, J., Lezama, A., Vasquez,R., Terborgh, J., Vinceti, B., and Lloyd, J.: The above-groundcoarse wood productivity of 104 Neotropical forest plots, GlobalChange Biol., 10, 563–591, 2004.
Mc Laughlin, S. and Wimmer, R.: Tansley Review No 104, Cal-cium physiology and terrestrial ecosystem processes, New Phy-tol., 142, 373–417, 1999.
Montufar, R. and Pintaud, J.-C.: Variation in species composition,abundance and microhabitat preferences among western Ama-zonian terra firme palm communities, Bot. J. Linn. Soc., 151,127–140, 2006
Normand, S., Vormisto, J., Svenning, J.-C., Grandes, C., and Bal-slev, H.: Geographical and environmental controls of palm betadiversity in paleo-riverine terrace forests in Amazonian Peru,Plant Ecol., 186, 161–176, 2006.
Paoli, G., Curran, L., and Zak, D.: Soil nutrients and beta diversityin the Bornean Dipterocarpaceae: evidence for niche partitioningby tropical rain forest trees, J. Ecol., 94, 157–170, 2006.
Peacock, J., Baker, T. R., Lewis, S. L., Lopez-Gonzalez, G., andPhillips, O. L.: The RAINFOR database: monitoring forestbiomass and dynamics, J. Veg. Sci., 18, 535–542, 2007.
Pennington, T. D.: Flora da Reserva Ducke, Amazonas, Brasil:Sapotaceae, Rodriguesia, 57, 251–366, 2006.
Phillips, O. and Miller, J.: Global patterns of forest diversity: thedataset of Alwyn H. Gentry, Monographs in Systematic Botany,89, Missouri Botanical Garden, USA, 319 pp., 2002.
Phillips, O., Nunez, P., Monteagudo, A., Pena, A., Chuspe, M.,Galiano, W., Yli-Halla, M., and Rose, S.: Habitat associationamong Amazonian tree species: a landscape-scale approach, J.Ecol., 91, 757–775, 2003.
Pitman, N., Mogollon, H., Davila, N., Rıos, M., Garcıa-Villacorta, R., Guevara, J., Baker, T., Monteagudo, A., Phillips,O., Vasquez-Martınez, R., Ahuite, M., Aulestia, M., Cardenas,D., Ceron, C., Loizeau, P.-A., Neill, D., Nunez, P., Palacios,W., Spichiger, R., and Valderrama, E.: Tree community changeacross 700 km of lowland Amazonian forest from the Andeanfoothills to Brazil, Biotropica, 40, 525–535, 2008.
Pitman, N., Terborgh, J., Silman, M., Nunez, P., Neill, D., Ceron,C., Palacios, W., and Aulestia, M.: Dominance and distributionof tree species in upper Amazonian terra firme forests, Ecology,82, 2101–2117, 2001.
Poulsen, A., Tuomisto, H., and Balslev, H.: Edaphic and floristicvariation within a 1-ha plot of lowland Amazonian rain forest,Biotropica, 38, 468–478, 2006.
Prance, G., Beentje, H., Dransfield, J., and Johns, R.: The tropicalflora remains undercollected, Ann. MO Bot. Gard., 87, 67–71,2000.
Quesada, C. A., Lloyd, J., Anderson, L. O., Fyllas, N. M., Schwarz,M., and Czimczik, C. I.: Soils of amazonia with particular refer-ence to the rainfor sites, Biogeosciences Discuss., 6, 3851–3921,2009a,http://www.biogeosciences-discuss.net/6/3851/2009/.
Quesada, C. A., Lloyd, J., Schwarz, M., Patino, S., Baker, T. R., Cz-imczik, C., Fyllas, N. M., Martinelli, L., Nardoto, G. B., Schmer-ler, J., Santos, A. J. B., Hodnett, M. G., Herrera, R., Luizao, F.J., Arneth, A., Lloyd, G., Dezzeo, N., Hilke, I., Kuhlmann, I.,Raessler, M., Brand, W. A., Geilmann, H., Moraes Filho, J. O.,Carvalho, F. P., Araujo Filho, R. N., Chaves, J. E., Cruz Junior,
O. F., Pimentel, T. P., and Paiva, R.: Chemical and physical prop-erties of Amazon forest soils in relation to their genesis, Biogeo-sciences Discuss., 6, 3923–3992, 2009b,http://www.biogeosciences-discuss.net/6/3923/2009/.
Ratter, J., Bridgewater, S., and Ribeiro, J.: Analysis of the floris-tic composition of the Brazilian cerrado vegetation III: Compar-ison of the woody vegetation of 376 areas, Edinburgh Journal ofBotany, 60, 57–109, 2003.
Ribero, J., Hopkins, M., Vicentini, A., Sothers, C., Costa, M., Brito,J., Souza, M., Martins, L., Lohmann, L., Assuncao, P., Pereira,E., Silva, C., Mesquita, M., and Procopio, L.: Flora da ReservaDucke: Guia de identificacao das plantas vasculares de uma flo-resta de terra-firme na Amazonia Central, INPA, Manaus, 800pp., 1999.
Ruokolainen, K., Tuomisto, H., Macia, M., Higgins, M., and Yli-Halla, M.: Are floristic and edaphic patterns in Amazonian rainforests congruent for trees, pteridophytes and Melastomataceae?,J. Trop. Ecol., 23, 13–25, 2007.
Salo, M. and Pyhala, A.: Exploring the gap between conserva-tion science and protected area establishment in the Allpahuayo-Mishana National Reserve (Peruvian Amazonia), Environ. Con-serv., 34, 23–32, 2007.
Sombroek, W.: Amazon landforms and soils in relation to biologi-cal diversity, Acta Amazonica, 30, 81–100, 2000.
Sombroek, W.: Spatial and temporal patterns of Amazon rainfall –Consequences for the planning of agricultural occupation and theprotection of primary forests, Ambio, 30, 388–396, 2001.
Spichiger, R., Meroz, J., Loizeau, P.-A., and Stutz de Ortega, L.:Contribucion a la Flora de la Amazonıa Peruana: Losarbolesdel Arboretum Jenaro Herrera, Volumen I, Moraceae a Legumi-nosae, Boissiera, 43, 1–359, 1989.
Spichiger, R., Meroz, J., Loizeau, P.-A., and Stutz de Ortega, L.:Contribucion a la Flora de la Amazonıa Peruana: Losarbolesdel Arboretum Jenaro Herrera, Volumen II, Linaceae a Palmae,Boissiera, 44, 1–565, 1990.
Spichiger, R., Loizeau, P.-A., Latour, C., and Barriera, G.: Treespecies richness of a south-western Amazonian forest (JenaroHerrera, Peru, 73◦40′ W/4◦54′ S), Candollea, 51, 559–577,1996.
ter Steege, H., Pitman, N., Phillips, O. L., Chave, J., Sabatier, D.,Duque, A., Molino, J.-F., Prevost, M.-F., Spichiger, R., Castel-lanos, H., von Hildebrand, P., and Vasquez, R.: Continental scalepatterns of canopy tree composition and function across Amazo-nia, Nature, 443, 444–447, 2006.
ter Steege, H., Sabatier, D., Casterllanos, H., Van Andel, T., Duiv-envoorden, J., De Oliveira, A., Ek, R., Lilwak, R., Maas, P., andMori, S.: An analysis of the floristic composition and diversity ofAmazonian forests including those of the Guiana Shield, J. Trop.Ecol., 16, 801–828, 2000.
Terborgh, J. and Andresen, E.: The composition of Amazonianforests: patterns at local and regional scales, J. Trop. Ecol., 14,645–664, 1998.
Tuomisto, H., Ruokolainen, K., and Yli-Halla, M.: Dispersal, en-vironment, and floristic variation of western Amazonian forets,Science, 299, 241–244, 2003a.
Tuomisto, H., Ruokolainen, K., Aguilar, M., and Sarmiento, A.:Floristic patterns along a 43-km long transect in an Amazonianrain forest, J. Ecol., 91, 743–756, 2003b.
Tuomisto, H. and Ruokolainen, K.: Environmental heterogeneity
Biogeosciences, 6, 2719–2731, 2009 www.biogeosciences.net/6/2719/2009/

E. N. Honorio Coronado et al.: Tree composition comparisons of Amazonian forests 2731
and the diversity of pteridophytes and Melastomataceae in west-ern Amazonia, Biol. Skr., 55, 37–56, 2005.
Tuomisto, H., Ruokolainen, K., Kalliola, R., Linna, A., Danjoy, W.,and Rodriguez, Z.: Dissecting Amazonian biodiversity, Science,269, 63–66, 1995.
Valderrama, E.: Estudio florıstico de losarboles en una hectarea debosque colinoso en la Estacion Experimental del Instituto Tec-nologico de Nauta, Loreto, Peru, B.Sc. Thesis, Universidad Na-cional de la Amazonia Peruana, Peru, 198 pp., 2007.
Vasquez, R.: Florula de las Reservas Biologicas de Iquitos, Peru,Allpahuayo-Mishana, Explornapo Camp, Explorama Lodge,Monogr. Syst. Bot. MO Bot. Gard., 63, 1–1046, 1997.
Vormisto, J., Svenning, J.-C., Hall, P., and Balslev, H.: Diversityand dominance in palm (Arecaceae) communities in terra firmeforests in the western Amazon basin, J. Ecol., 92, 577–588, 2004.
Wittmann, F., Schongart, J., Montero, J., Motzer, T., Junk, W.,Piedade, M., Queiroz, H., and Worbes, M.: Tree species com-position and diversity gradients in white-water forests across theAmazon Basin, J. Biogeogr., 33, 1334–1347, 2006.
www.biogeosciences.net/6/2719/2009/ Biogeosciences, 6, 2719–2731, 2009