Multi-physics Coupling Analysis and Bench Experiment ...
33
Multi-physics Coupling Analysis and Bench Experiment Research of Brake Xuwu Su Hubei University of Technology Yi Cheng ( [email protected] ) Hubei Hailong Xia zhongerchezhou Original Article Keywords: Peripheral disc brake ,thermal-structure coupling , thermal-ァuid-structure coupling, bench test Posted Date: May 4th, 2021 DOI: https://doi.org/10.21203/rs.3.rs-433843/v1 License: This work is licensed under a Creative Commons Attribution 4.0 International License. Read Full License
Transcript of Multi-physics Coupling Analysis and Bench Experiment ...

Multi-physics Coupling Analysis and BenchExperiment Research of BrakeXuwu Su
Hubei University of TechnologyYi Cheng ( [email protected] )
HubeiHailong Xia
zhongerchezhou
Original Article
Keywords: Peripheral disc brake ,thermal-structure coupling , thermal-�uid-structure coupling, bench test
Posted Date: May 4th, 2021
DOI: https://doi.org/10.21203/rs.3.rs-433843/v1
License: This work is licensed under a Creative Commons Attribution 4.0 International License. Read Full License

1
Multi-physics coupling analysis and bench experiment research of
brake
Xuwu Su, Yi Cheng* and Hailong Xia
Abstract. In order to explore the comprehensive performance of a new type of brake-circular disc brake, a multi-
physics coupling analysis was established using ANSYS Workbench software to study the heat generation
mechanism and air-cooled heat dissipation effect of the brake under different working conditions. Under the
condition of a single braking condition, the maximum temperature of the peripheral disc brake is 98.1℃; under the
condition of continuous braking, the maximum temperature of the brake is 170.22℃, and the highest temperature
occurs on the outer surface. A thermo-fluid-solid coupling analysis of the peripheral disc brake is established.
Compared with the heat generation of a single braking condition, the maximum temperature of the brake is reduced
by 14.77℃, which shows that the effect of forced air cooling is not obvious. Use the test bench to compare the finite
element analysis results. It can be seen from the bench experiment that as the cyclic braking progresses, the maximum
temperature of each braking cycle basically increases in a gradient manner, and the experimental and simulation
results are basically consistent. The maximum error between the experiment and the finite element simulation is
8.29℃ , Verified the reliability of finite element analysis.
Keywords: Peripheral disc brake ;thermal-structure coupling ; thermal-fluid-structure coupling; bench test
1. Introduction
With the development of the world economy, the logistics industry is playing an increasingly important role. In order
to pursue better performance under high efficiency, the design of logistics vehicles has gradually begun to develop
in the direction of increasing load and more safety. As one of the main brake system components, the comprehensive
performance requirements of brakes are also getting higher and higher.
In the braking process, the friction between the brake pads and the brake drum produces contact pressure.
According to the conditions, the thermal flow rate and thermal boundary conditions can be combined to obtain the
transient analysis temperature field of the brake [1-2]. Mi Zhaoyang et al. [3] used the finite element method to
analyze the temperature field and stress field of the disc brake, and found that when the speed of mechanical energy
being converted into heat energy is less than convection heat dissipation, the temperature of the brake began to
decrease gradually. Wang Xiaoying et al. [4] combined the data comparison of bench experiments and finite element
analysis to dynamically observe the stress, strain, and temperature of specific locations in the form of marked points,
so as to understand the failure law of brake drums.Bi Shiying et al. [5] used ANSYS Workbench to establish the
thermal-mechanical coupling analysis model of the brake, and conducted 15 analyses of the thermal-mechanical
coupling through the brake friction heat generation simulation simulation experiment. It is concluded that the
temperature increase of the brake drum, brake shoe and friction lining is obvious, and the critical temperature of
thermal decay is determined by monitoring.Sun Jiyu et al. [6] conducted thermal-mechanical coupling analysis of
TD485 single drive axle drum brakes under different working conditions, obtained the temperature and stress
distribution cloud diagram of the brake drum, and predicted the possible failure modes of the brake drum.
Nandhakumar S. et al. [7] applied squeeze cast aluminum metal matrix composites to brake drums, and compared
the temperature rise effect, heat penetration time and cooling conditions of cast iron materials through thermal
analysis, which proved the feasibility of this material . KB Lam et al. [8] studied the frictional heat generation,
transient temperature field, component stress and deformation, and contact pressure distribution during brake
operation, and used ABAQUS software to solve the thermoelasticity caused by frictional heat generation. Contact
problems. A M Puncioiu et al. [9] analyzed the braking principle and conducted transient thermal analysis through

2
ANSYS to study related factors such as thermoelastic pressure, friction coefficient, and thermal load that affect
braking performance.
In order to study the comprehensive performance of the new type of peripheral disc brake, through the multi-physics
simulation analysis of different working conditions of the brake, the temperature distribution and stress concentration
of the Peripheral brake disc are mainly observed, and the possible failure modes of the brake are predicted and
analyzed. The air-cooling effect of the peripheral brake discs, explore its feasibility, find effective heat dissipation
methods, and provide a reference for avoiding the failure of the peripheral disc brake due to overheating and
increasing the heat dissipation capacity of the peripheral disc brake. In addition, in order to verify the accuracy of
the finite element modeling method, considering the limitations of various test conditions, within the allowable range
of experimental errors, continuous braking experiments were carried out on the peripheral disc brakes, and the
temperature changes at different measurement points were compared. The results of finite element analysis verify
the reliability of the model, and the design method of finite element analysis and bench experiment is used to evaluate
the brake model, shorten the development cycle and reduce the development cost, so as to provide ideas for the
subsequent optimization design of the disc brake.
2. Brake boundary conditions and theoretical basis
2.1 Boundary conditions
1) Convection heat transfer coefficient
In the calculation of the three heat transfer methods, the temperature change caused by thermal radiation is very
small, so it is ignored here. The temperature change caused by heat convection and heat conduction accounts for
95%. The expression of heat convection is:
h(t) = 5.67826 × [0.92 + 𝛿𝑣 × exp(−𝑣/359)] (1)
In the formula: 𝑣 is the instantaneous vehicle speed (km/h) when the vehicle is braking; 𝛿 is the empirical
coefficient related to heat dissipation, which is 0.3 in this topic.
2) Heat flux
There are two main methods for calculating heat flux density: energy conversion algorithm and friction power
method. This article uses energy conversion algorithm to analyze the change of heat from the perspective of energy
conversion. Under ideal conditions, the heat generated during braking is:
𝑄(t) = 12 𝑀(2− 𝑣𝑡2) (2)
Where: 𝑀 is the full-load weight of the truck, kg; 𝑣0 is the initial braking speed(m/s); 𝑣𝑡 is the instantaneous speed
at the moment of braking t( m/s).
In the actual braking process, there is a ratio between the heat absorbed by the brake and the total heat, and it is
assumed that the heat is evenly distributed by the friction pair, and the braking process is uniform deceleration.
Therefore, the heat flux of the brake:
𝑞(t) = 𝑑𝑄𝐴𝑛𝑑𝑡 = 𝑑[12𝜂𝑀(𝑣02−𝑣𝑡2)]𝐴𝑛𝑑𝑡 = − 𝜂𝑀𝑣𝑡𝑎𝑛𝐴 (3)
Where: 𝜂 is the ratio of the total energy absorbed by the brake to the total heat, about 80%-90%; n is the total number
of friction pairs of the brake, taking 4; a is the braking deceleration,(m/s2 ); A is the contact area between the brake
drum and the brake pad, m2.
2.2 Frictional heat generation theory
Due to the contact between the friction plate and the brake, the brake plate cannot rotate with the surrounding brake
disc, and the friction force does work to realize the conversion of kinetic energy and heat energy. The unit heat flow
on the contact surface can be expressed as: 𝑞𝑖𝑗 = 𝜇𝑣𝑝𝑖𝑗 (4)
3
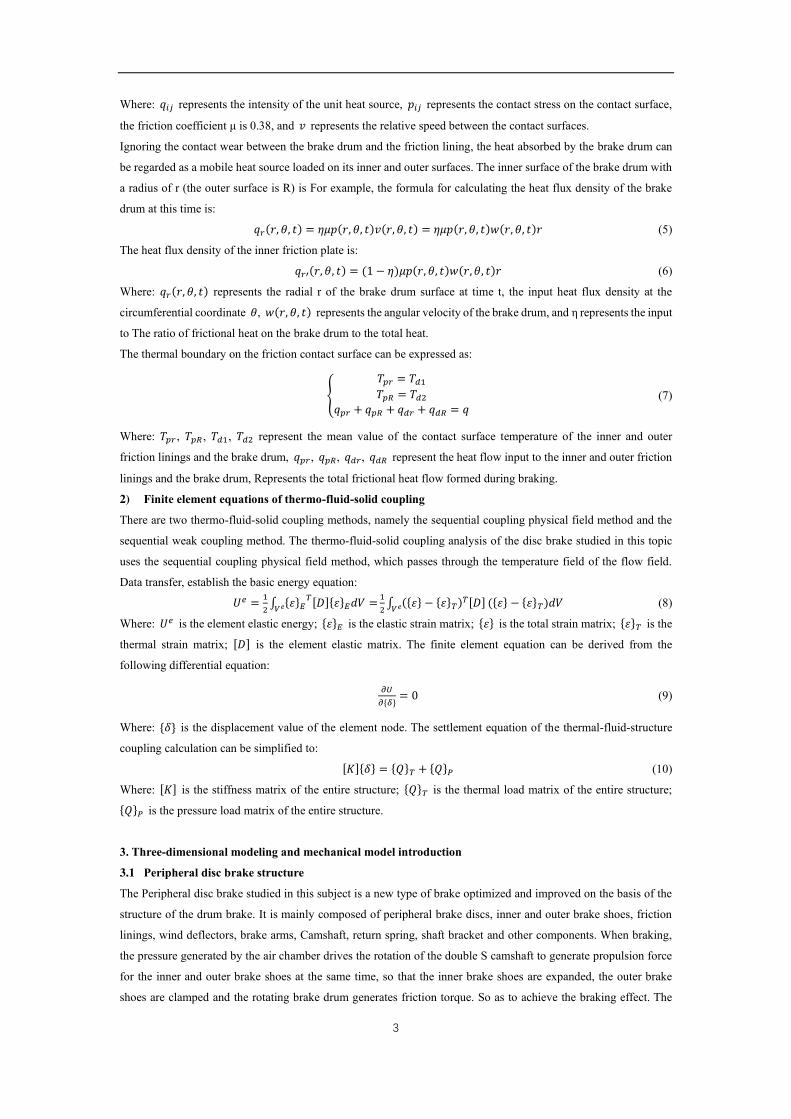
Where: 𝑞𝑖𝑗 represents the intensity of the unit heat source, 𝑝𝑖𝑗 represents the contact stress on the contact surface,
the friction coefficient μ is 0.38, and 𝑣 represents the relative speed between the contact surfaces.
Ignoring the contact wear between the brake drum and the friction lining, the heat absorbed by the brake drum can
be regarded as a mobile heat source loaded on its inner and outer surfaces. The inner surface of the brake drum with
a radius of r (the outer surface is R) is For example, the formula for calculating the heat flux density of the brake
drum at this time is:
𝑞𝑟(𝑟, 𝜃, 𝑡) = 𝜂𝜇𝑝(𝑟, 𝜃, 𝑡)𝑣(𝑟, 𝜃, 𝑡) = 𝜂𝜇𝑝(𝑟, 𝜃, 𝑡)𝑤(𝑟, 𝜃, 𝑡)𝑟 (5)
The heat flux density of the inner friction plate is:
𝑞𝑟′(𝑟, 𝜃, 𝑡) = (1 − 𝜂)𝜇𝑝(𝑟, 𝜃, 𝑡)𝑤(𝑟, 𝜃, 𝑡)𝑟 (6)
Where: 𝑞𝑟(𝑟, 𝜃, 𝑡) represents the radial r of the brake drum surface at time t, the input heat flux density at the
circumferential coordinate 𝜃, 𝑤(𝑟, 𝜃, 𝑡) represents the angular velocity of the brake drum, and η represents the input
to The ratio of frictional heat on the brake drum to the total heat. The thermal boundary on the friction contact surface can be expressed as:
{ 𝑇𝑝𝑟 = 𝑇𝑑1𝑇𝑝𝑅 = 𝑇𝑑2𝑞𝑝𝑟 + 𝑞𝑝𝑅 + 𝑞𝑑𝑟 + 𝑞𝑑𝑅 = 𝑞 (7)
Where: 𝑇𝑝𝑟 , 𝑇𝑝𝑅 , 𝑇𝑑1 , 𝑇𝑑2 represent the mean value of the contact surface temperature of the inner and outer
friction linings and the brake drum, 𝑞𝑝𝑟, 𝑞𝑝𝑅, 𝑞𝑑𝑟, 𝑞𝑑𝑅 represent the heat flow input to the inner and outer friction
linings and the brake drum, Represents the total frictional heat flow formed during braking.
2) Finite element equations of thermo-fluid-solid coupling
There are two thermo-fluid-solid coupling methods, namely the sequential coupling physical field method and the
sequential weak coupling method. The thermo-fluid-solid coupling analysis of the disc brake studied in this topic
uses the sequential coupling physical field method, which passes through the temperature field of the flow field.
Data transfer, establish the basic energy equation:
𝑈𝑒 = 12 ∫ {𝜀}𝐸𝑇[𝐷]{𝜀}𝐸𝑑𝑉 =𝑉𝑒 12 ∫ ({𝜀} − {𝜀}𝑇)𝑇[𝐷]𝑉𝑒 ({𝜀} − {𝜀}𝑇)𝑑𝑉 (8)
Where: 𝑈𝑒 is the element elastic energy; {𝜀}𝐸 is the elastic strain matrix; {𝜀} is the total strain matrix; {𝜀}𝑇 is the
thermal strain matrix; [𝐷] is the element elastic matrix. The finite element equation can be derived from the
following differential equation:
𝜕𝑈𝜕{𝛿} = 0 (9)
Where: {𝛿} is the displacement value of the element node. The settlement equation of the thermal-fluid-structure
coupling calculation can be simplified to:
[𝐾]{𝛿} = {𝑄}𝑇 + {𝑄}𝑃 (10)
Where: [𝐾] is the stiffness matrix of the entire structure; {𝑄}𝑇 is the thermal load matrix of the entire structure; {𝑄}𝑃 is the pressure load matrix of the entire structure.
3. Three-dimensional modeling and mechanical model introduction
3.1 Peripheral disc brake structure
The Peripheral disc brake studied in this subject is a new type of brake optimized and improved on the basis of the
structure of the drum brake. It is mainly composed of peripheral brake discs, inner and outer brake shoes, friction
linings, wind deflectors, brake arms, Camshaft, return spring, shaft bracket and other components. When braking,
the pressure generated by the air chamber drives the rotation of the double S camshaft to generate propulsion force
for the inner and outer brake shoes at the same time, so that the inner brake shoes are expanded, the outer brake
shoes are clamped and the rotating brake drum generates friction torque. So as to achieve the braking effect. The

4
Peripheral disc brake adopts the form of double-sided braking, which greatly increases the friction contact area;
combined with the advantages of the disc brake, the force of each component is evenly distributed to increase the
braking torque, so as to achieve a better braking effect; The heat dissipation holes of the drum increase the heat
dissipation area. In addition, the design of the wind deflector can not only block most of the dust, but also can use
forced convection to improve the heat dissipation capacity of the brake.
1- Wind shield 2- Brake arm 3-inner brake pad 4-outer brake pad 5-brake outer shoe 6- Double S camshaft 7-
return spring 8-shoe shaft bracket 9- Weekly brake disc 10- Brake inner shoe
Figure 1 Peripheral disc brake structure
3.2 Main structural parameters of brake
The main structural parameters of the disc brake studied in this subject are shown in Table 1.
Algorithm 1 Parameters of the main components of the brake
Name of main parts Parameter value
Inner diameter of brake disc/( mm) 146.75
Outer diameter of brake disc/( mm) 193.00
Inner brake shoe thickness/( mm) 9.75
Width of inner and outer brake pads/( mm) 160.00
Outer brake pad wrap angle/(℃) 118.00
Average thickness of outer brake pads/( mm) 12.00
Inner brake pad wrap angle/(℃) 114.00
Average thickness of inner brake pads/( mm) 10.00
3.3 Simplified model of main components
Reasonable simplification of the brake structure model without affecting the analysis results can not only improve
the mesh quality but also speed up the solution. Therefore, in the selection of the main structure of the brake, the
model of the brake drum, brake shoe, and friction lining is established without considering the wind deflector, linkage
mechanism, etc. Ignore processing details that have nothing to do with the main structure, such as some chamfers,
bolt holes, ribs, etc., ignore small holes, blanks, notches, etc. on the non-contact surface, and segment the complex
curved surface of the model. The simplified assembly model is shown in Figure 2.

5
Figure 2 Simplified assembly
3.4 Introduction of brake mechanics model
In normal work, the air pressure is 0.8MPa, the thrust of the air chamber is 11000N, and the braking force is
calculated by the lever principle as shown in the Table 2 [10]:
Algorithm 2 The force of each brake shoe
parameter
The force of the
brake inner shoe at
the upper end
circumference𝑃3/(N)
The force of the
brake inner shoe
around the lower
end𝑃3´/(N)
The force of the
outer brake shoe on
the upper end
circumference𝑃4/(N)
The force of
braking outer shoe
around lower
end𝑃4´/(N)
value 69850.00 69850.00 28996.82 37258.87
Through equivalent conversion, the shoe end force is equivalent to the middle section of the brake pad, and the
braking torque of the Peripheral brake disc is calculated:𝑀𝑏𝑑=15041.2N·m。
4. Finite element thermal-structure coupling analysis
During braking, a large amount of heat is generated by the rotational friction between the brake pads and the
Peripheral brake disc. The various parts of the brake generate thermal stress under the action of heat, which leads to
thermal deformation. The influence of temperature and structure must be considered, so the Peripheral disc brake
The braking process is a thermal-structural coupling problem. The brake disc material is vermicular graphite cast
iron (RuT300), the brake shoe material is ductile iron (QT600), and the friction lining is a composite material.
4.1 Add contact pairs and APDL commands
According to the selection principle of the contact surface and the target surface, four pairs of friction pairs in contact
between the inner and outer brake pads and the peripheral brake disc are established, and the contact type of the
brake shoe and the friction pad is defined as "binding", and the brake shoes add fixed constraints. Verify that the
contact stiffness of the model is 0.3, and add the temperature degree of freedom, add "keyopt, cid, 1, 1" to the Contact
to modify the unit keyword, and establish a contact command. Use Mechanical to export the time-varying convective
heat transfer coefficient formula file, and then read it through APDL.
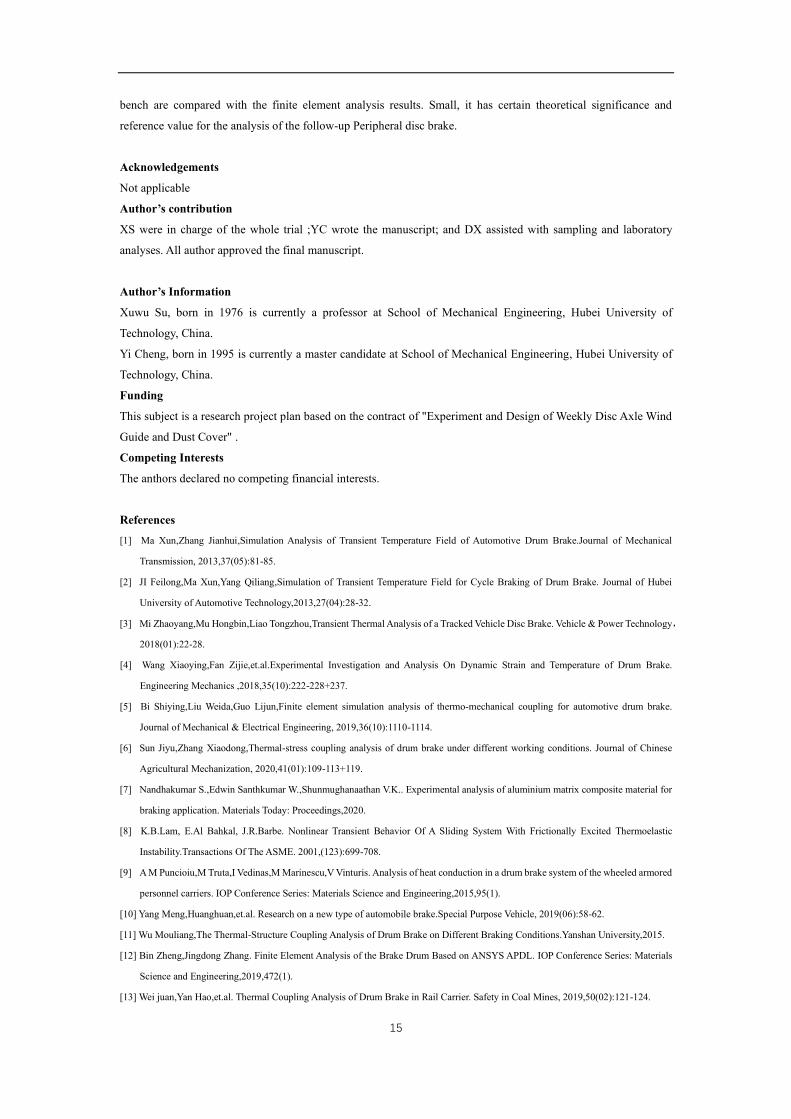
4.2 Set boundary conditions and add constraints
Define boundary conditions and loads, set the rotational angular velocity of the center of the circumferential brake
disc under different working conditions, and constrain the freedom of the other 5 directions so that it can only rotate
around its axis. The radial and axial displacements of the inner and outer brake shoe pin holes contacting the annular
surface are constrained, and cylindrical constraints are imposed on the pin holes so that they only have the freedom
to rotate around the pin hole axis. Since there is a certain angle between the braking force and the vertical direction,
the acceleration force of the inner and outer brake shoes is added by the method of vector decomposition. The
boundary conditions and constraints are shown in Figure 3.

6
Figure 3 Brake thermal analysis boundary conditions
4.3 Meshing
Due to the irregularity of the brake inner and outer shoe structure, the more complex components must be segmented
multiple times before the grid is divided. The overall grid is divided by solid226 three-dimensional twenty-node
hexahedral elements capable of thermal-structural coupling analysis. To define the element size, part of the
components adopts the method of multi-region grid division, and the divided grid is shown in Figure 4.
Fig 4 Meshing
4.4 Analysis of Thermal-Structural Coupling Simulation Results
1)Analysis of working conditions of single braking
In order to simulate the temperature change of the brake under the condition of a single braking, it is assumed that
the car is decelerating at an initial speed of 60km/h, and the speed is zero after 2.8s. The temperature distribution
and changes of the brake drum at the end of 2.8s are obtained by simulation as shown in Figures 5 and 6.

7
Figure 5 The temperature distribution cloud
diagram of a single braking of a brake
Figure 6 Maximum temperature change curve for a
single braking
It can be seen from the figure that at the end of 2.8 seconds, the highest temperature was 98.1°C, which occurred on
the outer circumferential surface of the Peripheral brake disc. Because of the double-sided braking, the temperature
difference between the inner and outer surfaces of the peripheral brake disc was about 30 degrees Celsius. The
temperature distribution on the outer surface of the Peripheral brake disc is basically uniform, and the temperature
in some areas is faulted due to vibration and friction, resulting in a large temperature difference. The temperature of
the inner surface of the Peripheral brake disc is discontinuous, and there are many high temperature blocks. The high
temperature area is concentrated in the center of the outer surface of the brake, and the temperature gradient gradually
decreases from the high temperature to the two sides. This is because the force on the outer shoes is relatively large. ,
Brake pads and brake drums generate greater thermal stress in a short time, and then the temperature is transferred
to both sides, long-term thermal stress phenomenon will cause stress concentration and cause circumferential and
axial fractures.
2) Temperature comparison at different initial braking speeds
In order to better study the temperature rise of peripheral disc brakes, set the initial braking speeds of 65km/h,
75km/h, and 85km/h respectively, and conduct a simulation analysis of a single braking condition, according to the
calculation formula of angular velocity , The tire radius is 0.52m, and the angular velocities corresponding to the
brake rotation at different initial speeds can be calculated as: 33.29rad/s, 38.4 rad/s, 43.8228 rad/s, and create a load
step for a single brake in Workbench. Calculate the temperature distribution cloud diagram of the brake, and the
results are shown in Figure 7 and Figure 8.
Figure 7 Initial speed is 75km/h Figure 8 Initial speed is 85km/h
When the initial speed of the brake is 65km/h, the temperature of the brake drum reaches the highest at 2.43s during
8
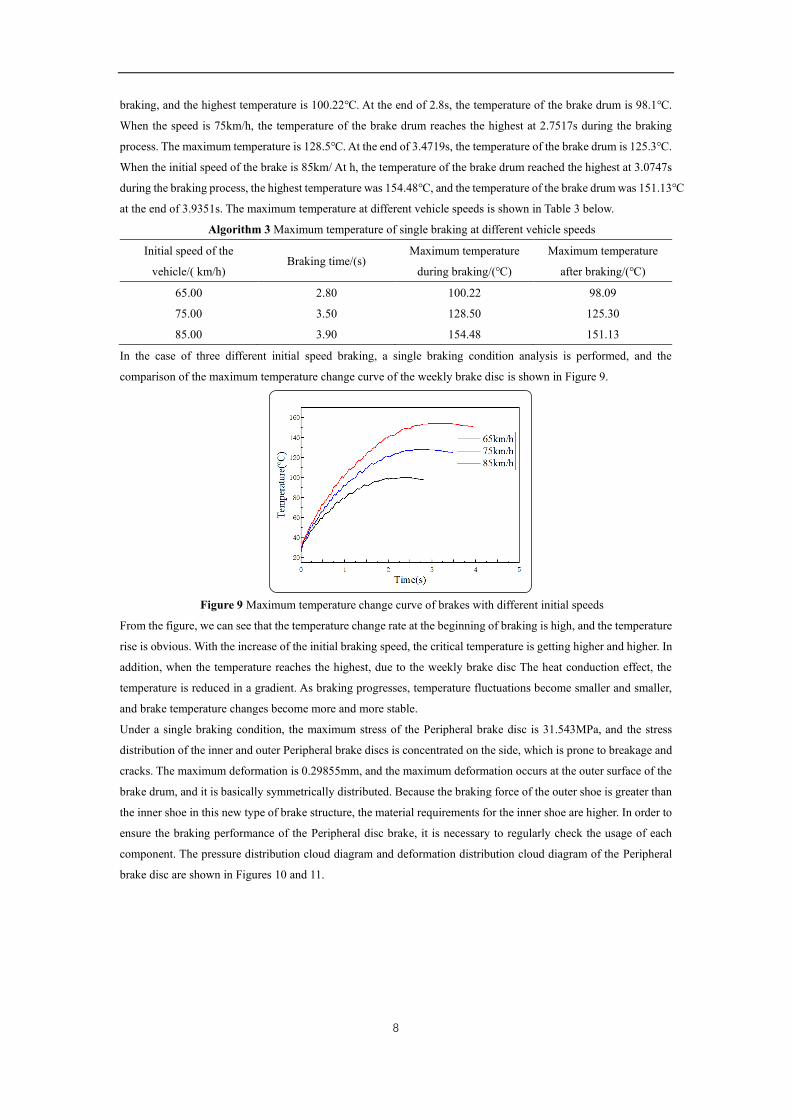
braking, and the highest temperature is 100.22℃. At the end of 2.8s, the temperature of the brake drum is 98.1℃.
When the speed is 75km/h, the temperature of the brake drum reaches the highest at 2.7517s during the braking
process. The maximum temperature is 128.5℃. At the end of 3.4719s, the temperature of the brake drum is 125.3℃.
When the initial speed of the brake is 85km/ At h, the temperature of the brake drum reached the highest at 3.0747s
during the braking process, the highest temperature was 154.48℃, and the temperature of the brake drum was 151.13℃
at the end of 3.9351s. The maximum temperature at different vehicle speeds is shown in Table 3 below.
Algorithm 3 Maximum temperature of single braking at different vehicle speeds
Initial speed of the
vehicle/( km/h) Braking time/(s)
Maximum temperature
during braking/(℃)
Maximum temperature
after braking/(℃)
65.00 2.80 100.22 98.09
75.00 3.50 128.50 125.30
85.00 3.90 154.48 151.13
In the case of three different initial speed braking, a single braking condition analysis is performed, and the
comparison of the maximum temperature change curve of the weekly brake disc is shown in Figure 9.
Figure 9 Maximum temperature change curve of brakes with different initial speeds
From the figure, we can see that the temperature change rate at the beginning of braking is high, and the temperature
rise is obvious. With the increase of the initial braking speed, the critical temperature is getting higher and higher. In
addition, when the temperature reaches the highest, due to the weekly brake disc The heat conduction effect, the
temperature is reduced in a gradient. As braking progresses, temperature fluctuations become smaller and smaller,
and brake temperature changes become more and more stable.
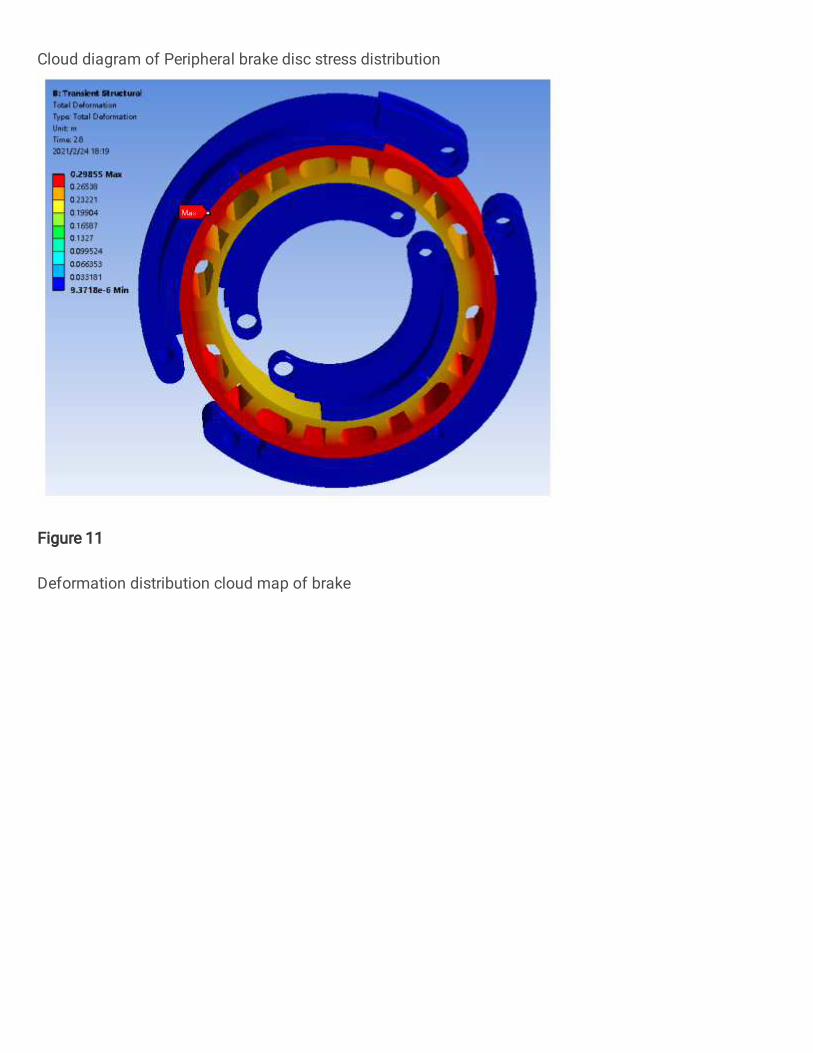
Under a single braking condition, the maximum stress of the Peripheral brake disc is 31.543MPa, and the stress
distribution of the inner and outer Peripheral brake discs is concentrated on the side, which is prone to breakage and
cracks. The maximum deformation is 0.29855mm, and the maximum deformation occurs at the outer surface of the
brake drum, and it is basically symmetrically distributed. Because the braking force of the outer shoe is greater than
the inner shoe in this new type of brake structure, the material requirements for the inner shoe are higher. In order to
ensure the braking performance of the Peripheral disc brake, it is necessary to regularly check the usage of each
component. The pressure distribution cloud diagram and deformation distribution cloud diagram of the Peripheral
brake disc are shown in Figures 10 and 11.

9
Figure 10 Cloud diagram of Peripheral brake disc
stress distribution
Figure 11 Deformation distribution cloud map
of brake
3) Continuous braking condition analysis
In order to simulate the temperature change of the brakes under continuous braking conditions, it is assumed that the
initial speed of the car is 70km/h. After braking, it decelerates to 30 km/h, then accelerates to 60 km/h, and finally
decelerates to zero. At the end of the simulation, the brake temperature distribution cloud chart is shown in Figure
12. Then select the inner and outer peripheral surface and side reference objects of the weekly brake disc to compare
the temperature changes. Figure 13 shows the temperature change curves at different positions under continuous
braking conditions.
Figure 12 Contour map of brake temperature
distribution under continuous braking conditions
Figure 13 Maximum temperature at different
positions under continuous braking conditions
The temperature distribution cloud chart shows that under continuous braking conditions, the highest temperature is
170.22°C, which occurs on the outer surface of the brake drum near the outer brake shoe force. In continuous braking
conditions, the maximum temperature of the inner peripheral surface of the peripheral brake disc is 135.08°C, the
temperature difference between the inner and outer surfaces of the peripheral brake disc is about 30°C, and the
maximum temperature of the side surface of the peripheral brake disc is 83.289°C.
5. Thermal-fluid-solid coupling simulation and result analysis
The heat dissipation problem of the brake is a multi-physical coupling problem of temperature field, structure field,
and flow field. In order to explore the heat dissipation effect of the brake under the action of forced air cooling, the
transient state is used on the basis of the single braking condition. Thermal analysis and fluid mechanics analysis
modules establish a two-way coupling analysis process. Through the thermal-fluid-solid coupling analysis, the
change of the temperature field of the brake under the air-cooled condition is studied.

10
5.1 Condition setting
The heat generated during braking is mainly generated by the friction between the inner and outer surfaces of the
brake drum and the brake pads. Therefore, in the transient thermal analysis module, thermal boundary conditions
are added to the inner and outer surfaces of the Peripheral brake disc to achieve a single braking condition. As an
example, according to the calculation formula of heat flux density, the formula for the change of heat flux density
with time is:
343563.2×(2.83-time) (11)
The model is processed, and some faces are merged through the merge method to reduce the complexity of the model.
Define the brake surface as the coupling surface. Since the position of each component is constantly changing with
the rotation of the Peripheral brake disc during braking, in order to simplify the calculation, the air inlet is set to
rotate based on the relative relationship of the rotation, and the two sides of the flange surface of the brake are
respectively Establish the air inlet, define the cylindrical side of the external flow field as the air outlet, and name
the outer surface of the brake geometry as the coupling surface in the fluid. Set the radius of the air inlet to 20mm.
When adding a flow field, a flow field area with a radius of 330mm is established, and the cylindrical geometry
containing the brake is used to generate the fluid area through Boolean operation. The obtained air inlet and flow
field model are shown in Figure 14.
Figure 14 Air inlet setting
Check the quality of the mesh, in Model, open the energy equation, select the turbulence model of SST k-omega,
and ignore the influence of radiation on the model. Define the material of each component, select air as the fluid
material, and keep the default parameters unchanged. The gas velocity at the air inlet is defined as 5m/s, the
turbulence intensity is 5%, and the turbulence viscosity ratio is 10. Set the wall surface and pressure outlet. Select
the solution method as SIMPLE, set the iteration step to 280 in Run Calculation, and the time step to 0.01.
5.2 Analysis of thermo-fluid-solid coupling results
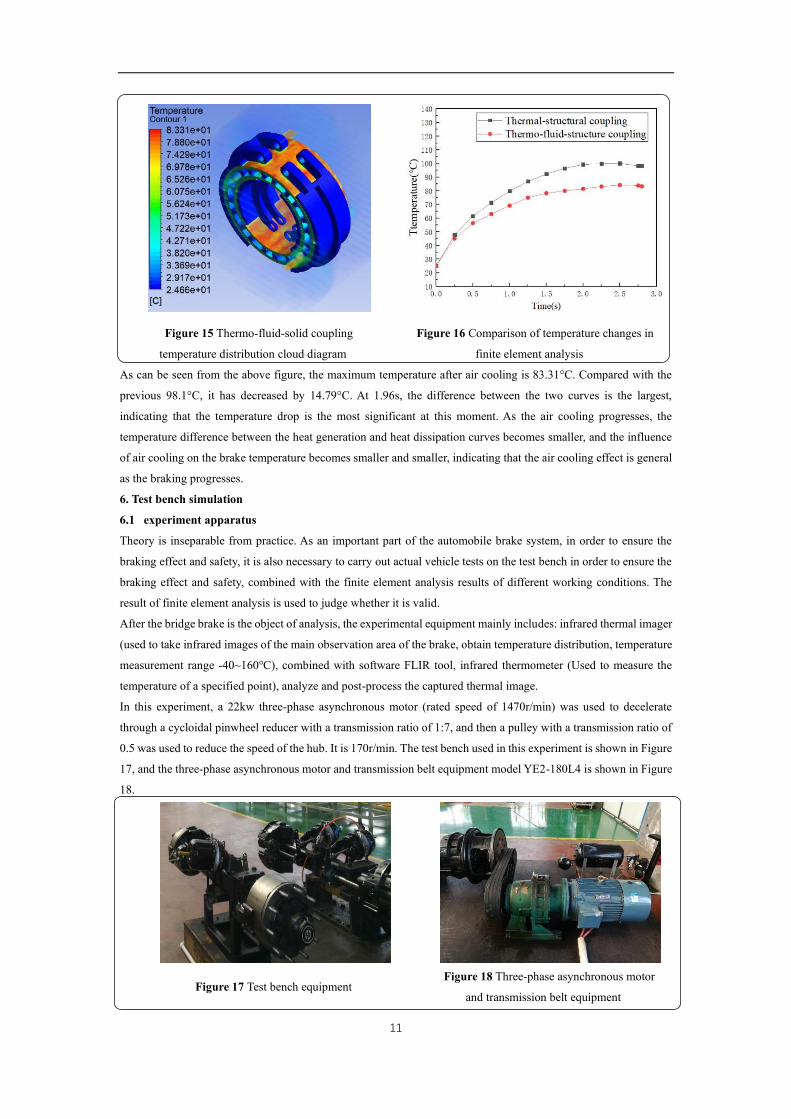
Under the action of air cooling, the brake temperature distribution cloud diagram after 2.8s of braking is shown in
Figure 15. The air cooling and heat generation temperature change curves of the brake drum are compared, and the
obtained curve is shown in Figure 16.
11
Figure 15 Thermo-fluid-solid coupling
temperature distribution cloud diagram
Figure 16 Comparison of temperature changes in
finite element analysis
As can be seen from the above figure, the maximum temperature after air cooling is 83.31°C. Compared with the
previous 98.1°C, it has decreased by 14.79°C. At 1.96s, the difference between the two curves is the largest,
indicating that the temperature drop is the most significant at this moment. As the air cooling progresses, the
temperature difference between the heat generation and heat dissipation curves becomes smaller, and the influence
of air cooling on the brake temperature becomes smaller and smaller, indicating that the air cooling effect is general
as the braking progresses.
6. Test bench simulation
6.1 experiment apparatus
Theory is inseparable from practice. As an important part of the automobile brake system, in order to ensure the
braking effect and safety, it is also necessary to carry out actual vehicle tests on the test bench in order to ensure the
braking effect and safety, combined with the finite element analysis results of different working conditions. The
result of finite element analysis is used to judge whether it is valid.
After the bridge brake is the object of analysis, the experimental equipment mainly includes: infrared thermal imager
(used to take infrared images of the main observation area of the brake, obtain temperature distribution, temperature
measurement range -40~160℃), combined with software FLIR tool, infrared thermometer (Used to measure the
temperature of a specified point), analyze and post-process the captured thermal image.
In this experiment, a 22kw three-phase asynchronous motor (rated speed of 1470r/min) was used to decelerate
through a cycloidal pinwheel reducer with a transmission ratio of 1:7, and then a pulley with a transmission ratio of
0.5 was used to reduce the speed of the hub. It is 170r/min. The test bench used in this experiment is shown in Figure
17, and the three-phase asynchronous motor and transmission belt equipment model YE2-180L4 is shown in Figure
18.
Figure 17 Test bench equipment Figure 18 Three-phase asynchronous motor
and transmission belt equipment

12
In order to ensure the braking effect, meet the experimental conditions, and avoid belt slippage, adjust the air
chamber pressure to the lowest working air pressure of 0.1MPa, so that the brake can perform multiple braking tests,
take infrared thermal imaging images regularly, record temperature changes, and finally until the week The moving
disc stops rotating due to thermal stress.
6.2 experiment process
This experiment was carried out in Hubei Shiyan Zhonger Axle Co., Ltd. According to the experimental requirements
for brakes in the national standard GB/12767_1999, the process of establishing the experimental program is shown
in Figure 19.
Figure 19 Experimental program process
During the test, the air valve was adjusted and the braking force was added through the cylinder. Before the start of
the braking experiment, the speed of the hub was stabilized, and then the brake was braked at a certain deceleration.
The braking time was two seconds, and the brake was cycled until the brake disc The speed is zero, and the initial
speed of the brake drum is measured to be 3n/s. The temperature changes of the brake drum and brake pads after
braking are analyzed. The curve of speed versus time is shown in Figure 20.
Figure 20 The curve of the speed of the wheel hub and the time of the test bench
6.4 Experimental simulation comparison
The heat generation analysis of the brake is carried out on a simple test bench. Considering that the brake will “lock”
due to the thermal fatigue cycle of the brake disc during multiple braking, the brake effect and temperature change
under complex working conditions are explored and collected. For the heat generation data of effective braking, this

13
topic selects the braking situation of 5 consecutive braking. The braking time is two seconds, and the brake is cycled
until the rotation speed of the hub is zero. The initial rotation speed of the hub is measured to be 3n/s, and the
temperature change of the weekly brake disc after braking is analyzed. During the experiment, the edge of the
peripheral surface of the weekly brake disc (the node number is 72483) is selected as the research object, and the
selected position is shown in the figure. The initial temperature is 44℃, ignoring the experimental error caused by
the heat conduction of the brake disc during the shooting and measuring process. The selected location is shown in
Figure 21.
Figure 21 Selected position of the brake mark
The temperature changes recorded during the initial temperature and five braking temperature changes are as follows:
Figure 22 Ambient temperature 45.0℃ Figure 23 The first braking temperature of the
weekly brake disc is 61.0℃
Figure 24 The second braking temperature of the
weekly brake disc is 77.8℃
Figure 25 The third braking temperature of the
weekly brake disc is 86.0℃
Figure 26 The fourth braking temperature of the
weekly brake disc is 97.4℃
Figure 27 The fifth braking temperature of weekly
brake disc is 110.5℃
Data collection is performed on the infrared imaging map of each brake shooting, and the simulation and test data
are compared through finite element analysis. In the finite element analysis, the temperature distribution of the
selected unit at the end of the five braking times is shown in the figure. The maximum temperature change curve at
14
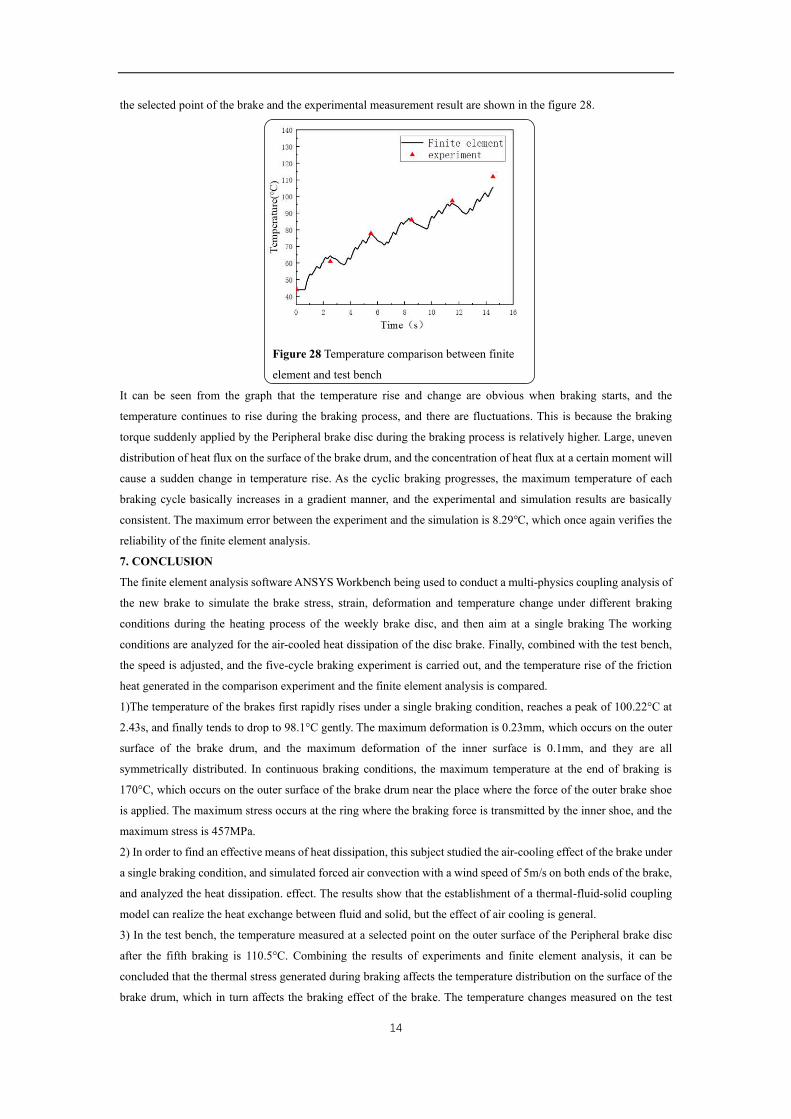
the selected point of the brake and the experimental measurement result are shown in the figure 28.
Figure 28 Temperature comparison between finite
element and test bench
It can be seen from the graph that the temperature rise and change are obvious when braking starts, and the
temperature continues to rise during the braking process, and there are fluctuations. This is because the braking
torque suddenly applied by the Peripheral brake disc during the braking process is relatively higher. Large, uneven
distribution of heat flux on the surface of the brake drum, and the concentration of heat flux at a certain moment will
cause a sudden change in temperature rise. As the cyclic braking progresses, the maximum temperature of each
braking cycle basically increases in a gradient manner, and the experimental and simulation results are basically
consistent. The maximum error between the experiment and the simulation is 8.29℃, which once again verifies the
reliability of the finite element analysis.
7. CONCLUSION
The finite element analysis software ANSYS Workbench being used to conduct a multi-physics coupling analysis of
the new brake to simulate the brake stress, strain, deformation and temperature change under different braking
conditions during the heating process of the weekly brake disc, and then aim at a single braking The working
conditions are analyzed for the air-cooled heat dissipation of the disc brake. Finally, combined with the test bench,
the speed is adjusted, and the five-cycle braking experiment is carried out, and the temperature rise of the friction
heat generated in the comparison experiment and the finite element analysis is compared.
1)The temperature of the brakes first rapidly rises under a single braking condition, reaches a peak of 100.22°C at
2.43s, and finally tends to drop to 98.1°C gently. The maximum deformation is 0.23mm, which occurs on the outer
surface of the brake drum, and the maximum deformation of the inner surface is 0.1mm, and they are all
symmetrically distributed. In continuous braking conditions, the maximum temperature at the end of braking is
170°C, which occurs on the outer surface of the brake drum near the place where the force of the outer brake shoe
is applied. The maximum stress occurs at the ring where the braking force is transmitted by the inner shoe, and the
maximum stress is 457MPa.
2) In order to find an effective means of heat dissipation, this subject studied the air-cooling effect of the brake under
a single braking condition, and simulated forced air convection with a wind speed of 5m/s on both ends of the brake,
and analyzed the heat dissipation. effect. The results show that the establishment of a thermal-fluid-solid coupling
model can realize the heat exchange between fluid and solid, but the effect of air cooling is general.
3) In the test bench, the temperature measured at a selected point on the outer surface of the Peripheral brake disc
after the fifth braking is 110.5°C. Combining the results of experiments and finite element analysis, it can be
concluded that the thermal stress generated during braking affects the temperature distribution on the surface of the
brake drum, which in turn affects the braking effect of the brake. The temperature changes measured on the test
15
bench are compared with the finite element analysis results. Small, it has certain theoretical significance and
reference value for the analysis of the follow-up Peripheral disc brake.
Acknowledgements
Not applicable
Author’s contribution
XS were in charge of the whole trial ;YC wrote the manuscript; and DX assisted with sampling and laboratory
analyses. All author approved the final manuscript.
Author’s Information
Xuwu Su, born in 1976 is currently a professor at School of Mechanical Engineering, Hubei University of
Technology, China.
Yi Cheng, born in 1995 is currently a master candidate at School of Mechanical Engineering, Hubei University of
Technology, China.
Funding
This subject is a research project plan based on the contract of "Experiment and Design of Weekly Disc Axle Wind
Guide and Dust Cover" .
Competing Interests
The anthors declared no competing financial interests.
References
[1] Ma Xun,Zhang Jianhui,Simulation Analysis of Transient Temperature Field of Automotive Drum Brake.Journal of Mechanical
Transmission, 2013,37(05):81-85.
[2] JI Feilong,Ma Xun,Yang Qiliang,Simulation of Transient Temperature Field for Cycle Braking of Drum Brake. Journal of Hubei
University of Automotive Technology,2013,27(04):28-32.
[3] Mi Zhaoyang,Mu Hongbin,Liao Tongzhou,Transient Thermal Analysis of a Tracked Vehicle Disc Brake. Vehicle & Power Technology,
2018(01):22-28.
[4] Wang Xiaoying,Fan Zijie,et.al.Experimental Investigation and Analysis On Dynamic Strain and Temperature of Drum Brake.
Engineering Mechanics ,2018,35(10):222-228+237.
[5] Bi Shiying,Liu Weida,Guo Lijun,Finite element simulation analysis of thermo-mechanical coupling for automotive drum brake.
Journal of Mechanical & Electrical Engineering, 2019,36(10):1110-1114.
[6] Sun Jiyu,Zhang Xiaodong,Thermal-stress coupling analysis of drum brake under different working conditions. Journal of Chinese
Agricultural Mechanization, 2020,41(01):109-113+119.
[7] Nandhakumar S.,Edwin Santhkumar W.,Shunmughanaathan V.K.. Experimental analysis of aluminium matrix composite material for
braking application. Materials Today: Proceedings,2020.
[8] K.B.Lam, E.Al Bahkal, J.R.Barbe. Nonlinear Transient Behavior Of A Sliding System With Frictionally Excited Thermoelastic
Instability.Transactions Of The ASME. 2001,(123):699-708.
[9] A M Puncioiu,M Truta,I Vedinas,M Marinescu,V Vinturis. Analysis of heat conduction in a drum brake system of the wheeled armored
personnel carriers. IOP Conference Series: Materials Science and Engineering,2015,95(1).
[10] Yang Meng,Huanghuan,et.al. Research on a new type of automobile brake.Special Purpose Vehicle, 2019(06):58-62.
[11] Wu Mouliang,The Thermal-Structure Coupling Analysis of Drum Brake on Different Braking Conditions.Yanshan University,2015.
[12] Bin Zheng,Jingdong Zhang. Finite Element Analysis of the Brake Drum Based on ANSYS APDL. IOP Conference Series: Materials
Science and Engineering,2019,472(1).
[13] Wei juan,Yan Hao,et.al. Thermal Coupling Analysis of Drum Brake in Rail Carrier. Safety in Coal Mines, 2019,50(02):121-124.

16
[14] Osenin Yu. I.,Krivosheya Yu. V.,Chesnokov A. V.,Antoshkin V. K.. Influence of the Mutual Overlapping Coefficient on the Process of
a Disc Brake Squealing during Braking. Journal of Friction and Wear,2021,42(1).
[15] Hwang Kyu Yun,Kwon Byung Il. System‐level optimal design process of inverter‐fed BLAC motor used for 12–48 V integrated electric
brake system. IET Electric Power Applications,2021,14(14).
[16] Zhanling Ji,Yunhua Li,Rui Xi,Juntao Jia. Elastic-plastic analysis for wet multidisc brake during repeated braking. Proceedings of the
Institution of Mechanical Engineers,2016,230(17).
[17] Zhu Li Liu,Min Min Zhao,Meng Li Li. Thermal Structure Coupling Research and Thermal Fatigue Life Prediction of the Large Mining
Machinery Brake. Advanced Materials Research,2014,3187.
[18] Fu Cai Hu,Hu Lin Li,Bei Si Xie. Analysis of the Thermal-Structure Coupling of the Band Brake. Applied Mechanics and
Materials,2012,1498.
[19] Xun Yang,Ji Xin Wang,J.C. Fan. Simulation Study of Temperature Field and Stress Field of Disc Brake Based on Direct Coupling
Method. Materials Science Forum,2009,858.
[20] Wang Ziyun,Zhang Jianrun. Thermomechanical Coupling Simulation and Analysis of Wet Multi-Disc Brakes During Emergency
Braking. Journal of Physics: Conference Series,2021,1875(1).
[21] Li Changyuan,Zhang Jianrun. Research on Structure Design of The Dual Steel Disc in Brake Based on Rigid-Flexible Coupling
Simulation Analysis. Journal of Physics: Conference Series,2021,1875(1).

Figures
Figure 1
Peripheral disc brake structure 1- Wind shield 2- Brake arm 3-inner brake pad 4-outer brake pad 5-brakeouter shoe 6- Double S camshaft 7- return spring 8-shoe shaft bracket 9- Weekly brake disc 10- Brakeinner shoe
Figure 2
Simpli�ed assembly
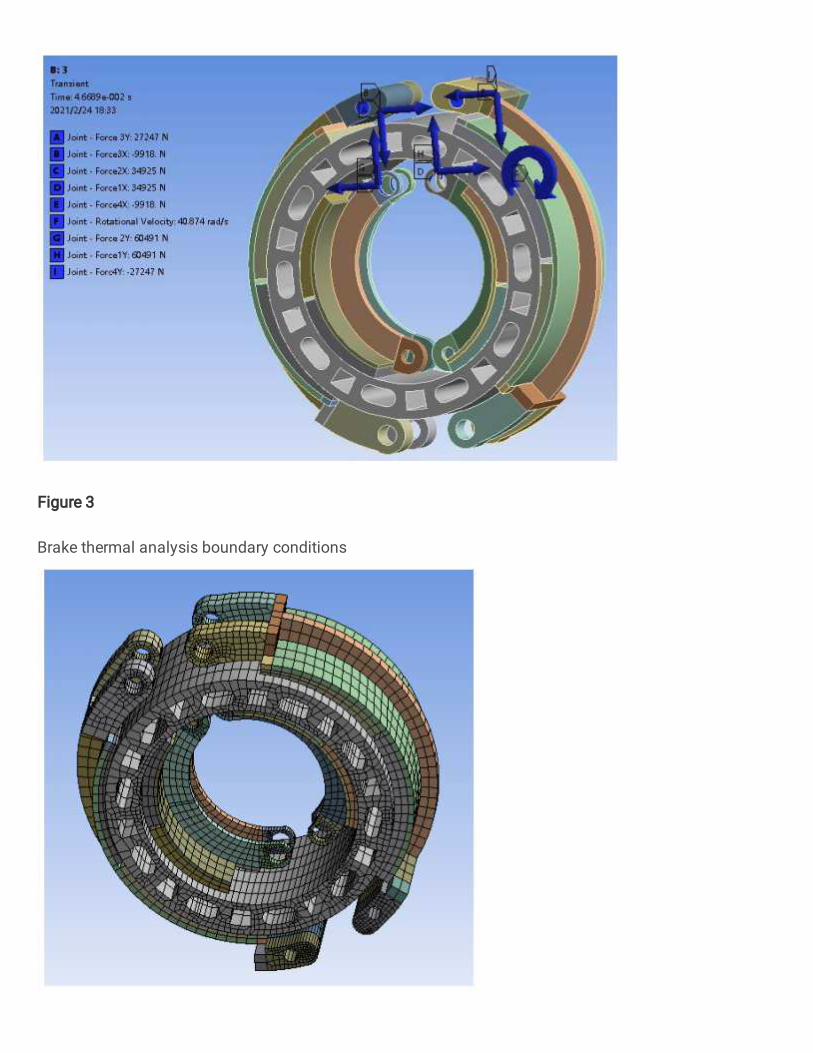
Figure 3
Brake thermal analysis boundary conditions

Figure 4
Meshing
Figure 5
The temperature distribution cloud diagram of a single braking of a brake

Figure 6
Maximum temperature change curve for a single braking

Figure 7
Initial speed is 75km/h
Figure 8
Initial speed is 85km/h

Figure 9
Maximum temperature change curve of brakes with different initial speeds
Figure 10
Cloud diagram of Peripheral brake disc stress distribution
Figure 11
Deformation distribution cloud map of brake

Figure 12
Contour map of brake temperature distribution under continuous braking conditions
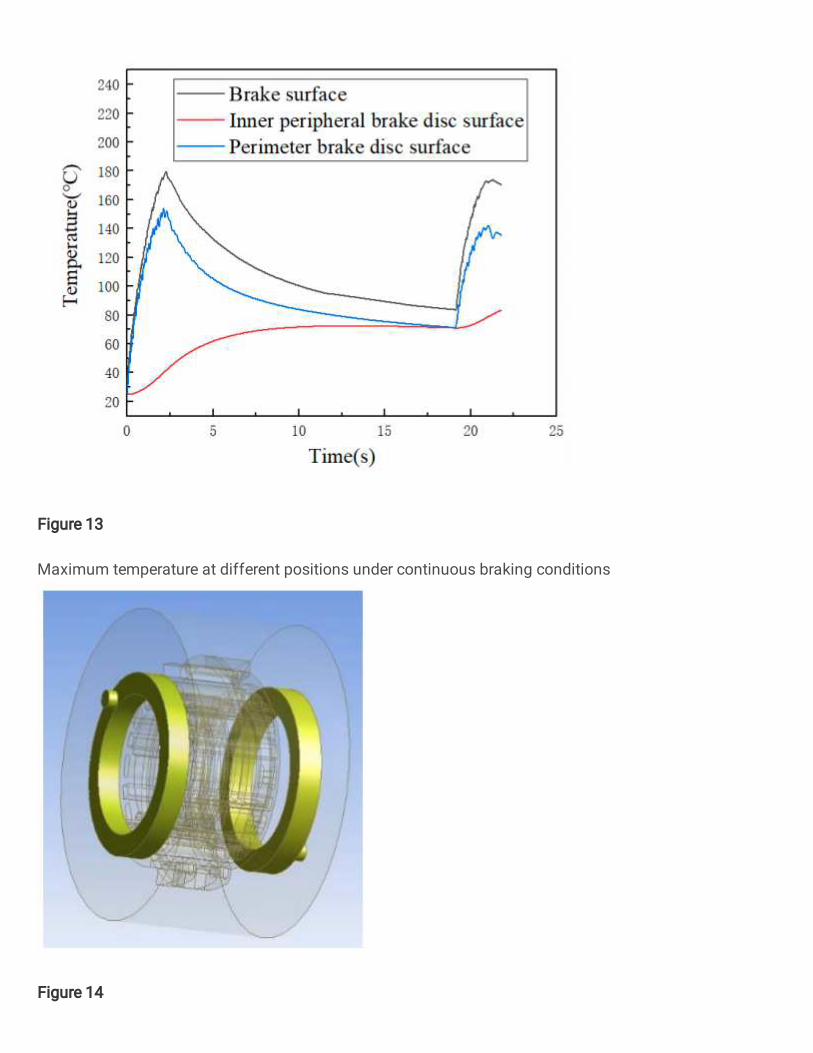
Figure 13
Maximum temperature at different positions under continuous braking conditions
Figure 14

Air inlet setting
Figure 15
Thermo-�uid-solid coupling temperature distribution cloud diagram

Figure 16
Comparison of temperature changes in �nite element analysis
Figure 17
Test bench equipment

Figure 18
Three-phase asynchronous motor and transmission belt equipment
Figure 19

Experimental program process
Figure 20
The curve of the speed of the wheel hub and the time of the test bench
Figure 21
Selected position of the brake mark

Figure 22
Ambient temperature 45.0
Figure 23
The �rst braking temperature of the weekly brake disc is 61.0
Figure 24

The second braking temperature of the weekly brake disc is 77.8
Figure 25
The third braking temperature of the weekly brake disc is 86.0
Figure 26
The fourth braking temperature of the weekly brake disc is 97.4
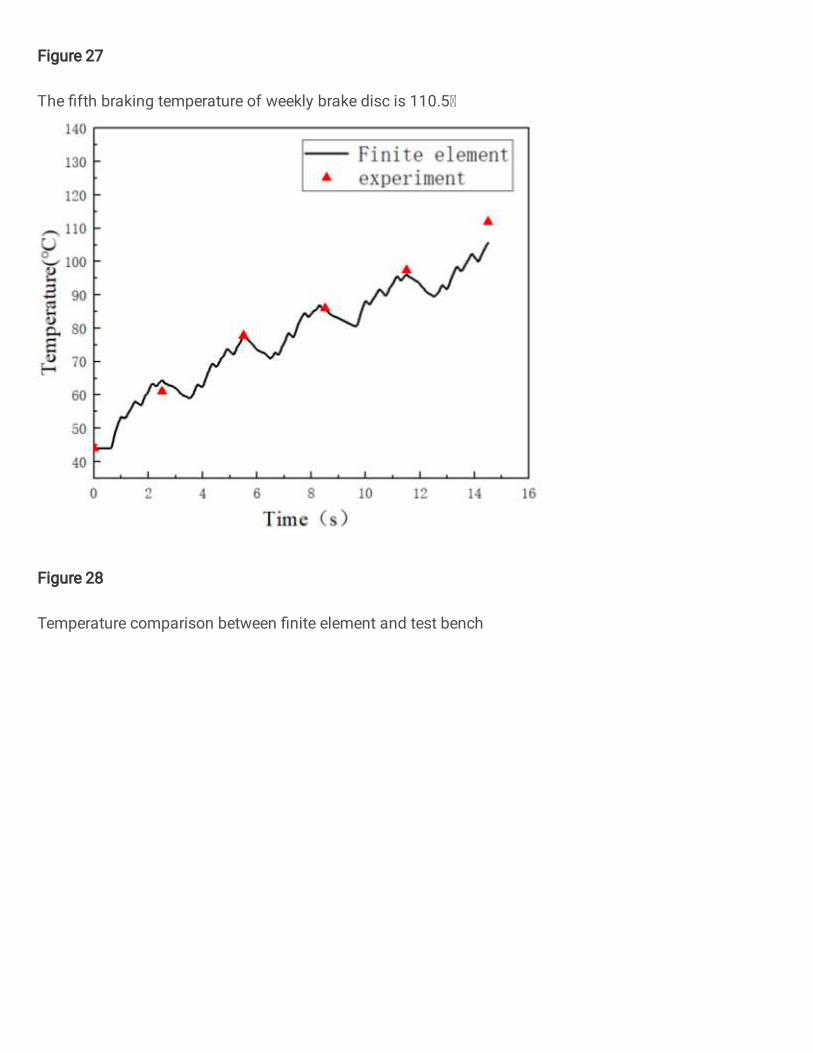
Figure 27
The �fth braking temperature of weekly brake disc is 110.5
Figure 28
Temperature comparison between �nite element and test bench