Multi-objective decision modeling using Interpretive ... · Abstract No: 025-0605 Multi-objective...
21
Abstract No: 025-0605 Multi-objective decision modeling using Interpretive Structural Modeling(ISM) for Green Supply Chains Author: Dr. Jitendra Madaan, † Department of Mechanical and Industrial Engineering, Indian Institute of Technology, Roorkee, India [email protected], 91-1332-285726 Sachin Mangla, Department of Mechanical Engineering, Ganpati institute of technology & management, Bilaspur, India [email protected] Prof. M. P Gupta Department of Management Studies Indian Institute of Technology, Delhi, India [email protected] , 91-11-26591173 POMS 23rd Annual Conference Chicago, Illinois, U.S.A. April 20 to April 23, 2012 Abstract
Transcript of Multi-objective decision modeling using Interpretive ... · Abstract No: 025-0605 Multi-objective...

Abstract No: 025-0605
Multi-objective decision modeling using Interpretive Structural Modeling(ISM) for Green Supply
Chains
Author:
Dr. Jitendra Madaan, †Department of Mechanical and Industrial Engineering,
Indian Institute of Technology, Roorkee, India
[email protected], 91-1332-285726
Sachin Mangla,
Department of Mechanical Engineering,
Ganpati institute of technology & management, Bilaspur, India
Prof. M. P Gupta
Department of Management Studies
Indian Institute of Technology, Delhi, India
[email protected] , 91-11-26591173
POMS 23rd Annual Conference
Chicago, Illinois, U.S.A.
April 20 to April 23, 2012
Abstract

Determining key variables, which an organization can opt to initiate green supply chain
activities with a motive to improve overall performance is a challenge. Therefore this paper
provides a multi-objective decision model using interpretive structural modeling(ISM) based
approach to enrich and initiate the green supply chain activities in an organization. Variables
such as supplier commitment, cost, regulations etc. have been identified and categorized under
enablers and capacity utilization, customer satisfaction, energy consumption etc. under results.
These enablers help to boost the GSC (Green Supply Chain) variables, while results variables
represent outcomes. Finally, paper interprets GSC variables in terms of their driving and
dependence powers that have been carried out.
Keywords: Green supply chain (GSC) ,Interpretive Structural Modeling (ISM),reverse logistics,
sustainable development
1. Green supply chain (GSC)
Some of the earliest work that can be tied to the today’s greening of the supply chain towards
sustainable development, occurring even before the formation of the U.S. Environmental
Protection Agency, can be traced to (Ayres, 1978). This work presented some of the earliest
issues related to reconciling industrial metabolism and material balancing as well as the roles of
production and consumption in the supply chain. Although their work focused on a linear
relationship from an extraction to disposal, some loops were incorporated into the evaluation and
there were concerns about the possibility of integrating ‘residuals’ back into the system.
Interestingly, not only were solid and water pollution waste included in the discussion, but
warnings of global climate change due to carbon and other greenhouse gas emissions was also
prevalent in the argumentation on evaluating the roles of inter-organizational relationships.

Further refinement of the industrial metabolism and material flow balance ideas occurred
throughout the 1970s (Ayres, 1978). Discussion on how to utilize the mass balance for
organizational and governmental decision making was also introduced in the early 1970s through
‘‘a process-chain evaluation model estimates the cumulative costs (direct and hidden) of various
processes or steps that form ‘chains’ leading from a set of raw material inputs to a marketable
output, such as semi- finished or consumer products’’. (Stern et al.,1973). This work
incorporated inventories of pollutants and their impacts in the decision modeling software, not
unlike most of the today’s life cycle analytical tools.
Many researchers have defined a green supply chain in various manners using different terms.
Some studies defined it as a closed loop supply chain (van Hoek, 1999; Beamon, 2005; Steven,
2004; Inderfurth, 2004; Spengler et al., 2004; Zhu and Sarkis, 2006). It has been described as a
sustainable supply chain by Linton et al. (2007) and Beamon (2005). Some have called it as an
environmental supply chain (Hall, 2000; Beamon, 2005), ethical supplychain (Roberts, 2003;
Beamon, 2005), and integrated supply chain (Vachon and Klassen, 2008, Wadhwa et al., 2009b)
.The growth in this green supply chain literature extends back to the early 1990s with the advent
of corporate environmental management, environmentally conscious manufacturing strategy, and
i.e. “environment”. Green supply chain management is thus defined as the totality of green
purchasing, green manufacturing and material management, green distribution and marketing,
and finally reverse logistics (Hervani et al., 2005; Linton et al., 2007; Zhu and Sarkis, 2006).
This is in line with the explanation given by Vachon and Klassen (2008) that suppliers,
manufacturers and customers should work together towards the reduction of environmental
impact from production processes and products. The schematic of the material flow and the
echelons involved in a green supply chain is presented in Fig. 1. Reverse logistics is highlighted
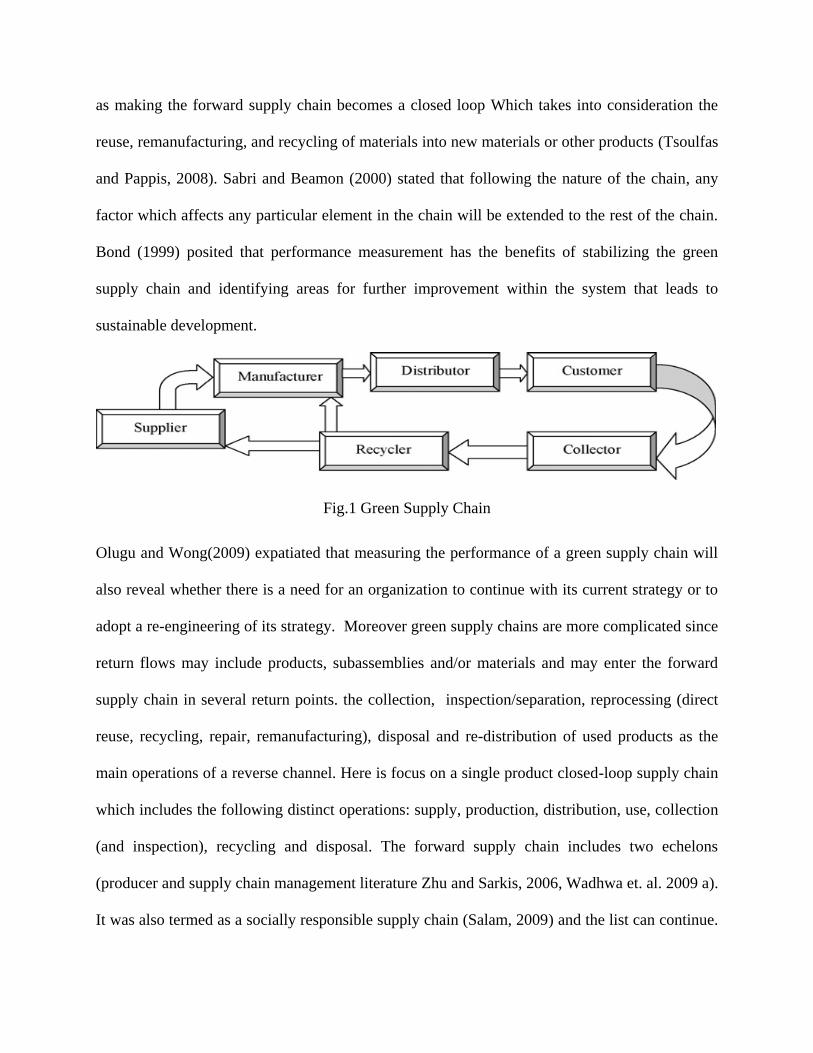
as making the forward supply chain becomes a closed loop Which takes into consideration the
reuse, remanufacturing, and recycling of materials into new materials or other products (Tsoulfas
and Pappis, 2008). Sabri and Beamon (2000) stated that following the nature of the chain, any
factor which affects any particular element in the chain will be extended to the rest of the chain.
Bond (1999) posited that performance measurement has the benefits of stabilizing the green
supply chain and identifying areas for further improvement within the system that leads to
sustainable development.
Fig.1 Green Supply Chain
Olugu and Wong(2009) expatiated that measuring the performance of a green supply chain will
also reveal whether there is a need for an organization to continue with its current strategy or to
adopt a re-engineering of its strategy. Moreover green supply chains are more complicated since
return flows may include products, subassemblies and/or materials and may enter the forward
supply chain in several return points. the collection, inspection/separation, reprocessing (direct
reuse, recycling, repair, remanufacturing), disposal and re-distribution of used products as the
main operations of a reverse channel. Here is focus on a single product closed-loop supply chain
which includes the following distinct operations: supply, production, distribution, use, collection
(and inspection), recycling and disposal. The forward supply chain includes two echelons
(producer and supply chain management literature Zhu and Sarkis, 2006, Wadhwa et. al. 2009 a).
It was also termed as a socially responsible supply chain (Salam, 2009) and the list can continue.
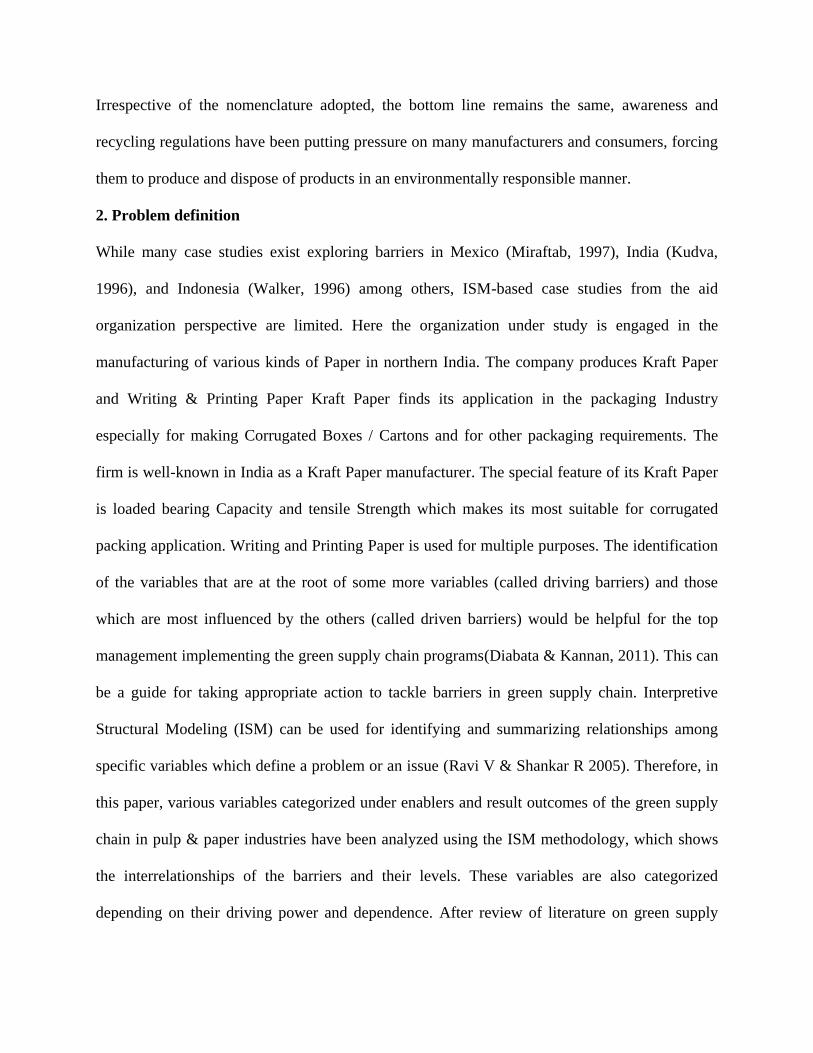
Irrespective of the nomenclature adopted, the bottom line remains the same, awareness and
recycling regulations have been putting pressure on many manufacturers and consumers, forcing
them to produce and dispose of products in an environmentally responsible manner.
2. Problem definition
While many case studies exist exploring barriers in Mexico (Miraftab, 1997), India (Kudva,
1996), and Indonesia (Walker, 1996) among others, ISM-based case studies from the aid
organization perspective are limited. Here the organization under study is engaged in the
manufacturing of various kinds of Paper in northern India. The company produces Kraft Paper
and Writing & Printing Paper Kraft Paper finds its application in the packaging Industry
especially for making Corrugated Boxes / Cartons and for other packaging requirements. The
firm is well-known in India as a Kraft Paper manufacturer. The special feature of its Kraft Paper
is loaded bearing Capacity and tensile Strength which makes its most suitable for corrugated
packing application. Writing and Printing Paper is used for multiple purposes. The identification
of the variables that are at the root of some more variables (called driving barriers) and those
which are most influenced by the others (called driven barriers) would be helpful for the top
management implementing the green supply chain programs(Diabata & Kannan, 2011). This can
be a guide for taking appropriate action to tackle barriers in green supply chain. Interpretive
Structural Modeling (ISM) can be used for identifying and summarizing relationships among
specific variables which define a problem or an issue (Ravi V & Shankar R 2005). Therefore, in
this paper, various variables categorized under enablers and result outcomes of the green supply
chain in pulp & paper industries have been analyzed using the ISM methodology, which shows
the interrelationships of the barriers and their levels. These variables are also categorized
depending on their driving power and dependence. After review of literature on green supply
chain and the opinion of experts, both from paper mill industries and the academia, 14 important
variables of green supply chain have been identified. The literature review, together with the
experts’ opinion, was used in developing the relationship matrix, which is later used in the
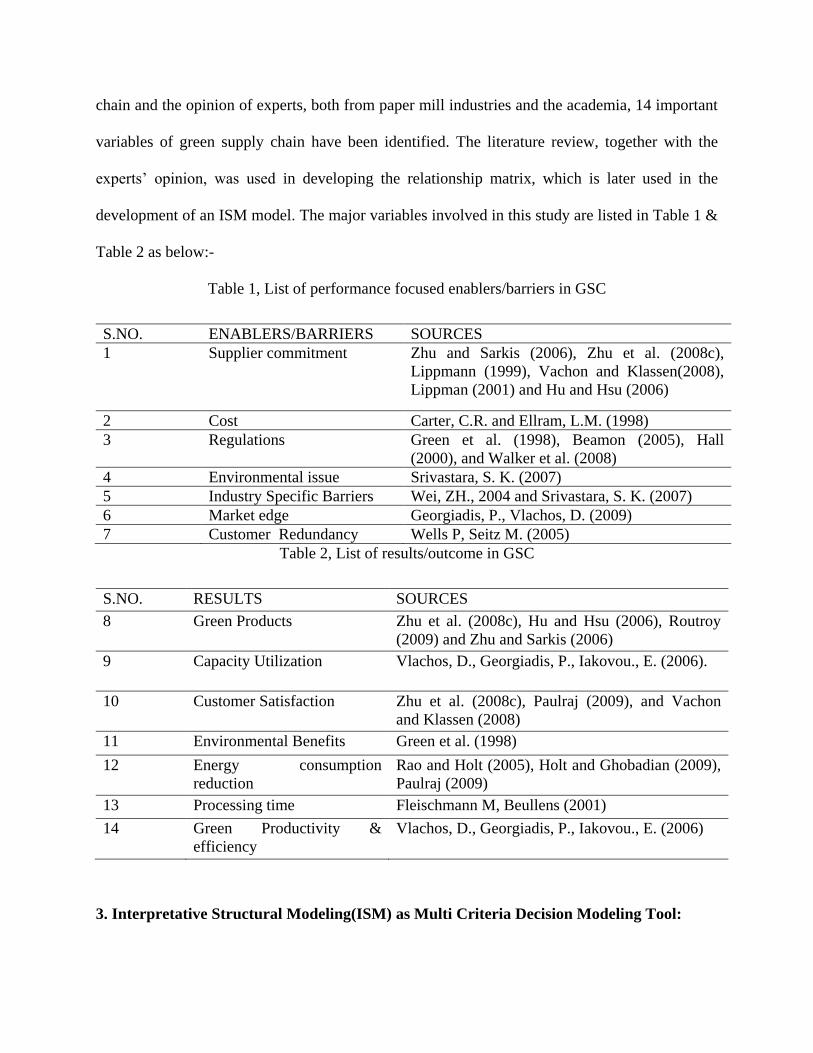
development of an ISM model. The major variables involved in this study are listed in Table 1 &
Table 2 as below:-
Table 1, List of performance focused enablers/barriers in GSC
S.NO. ENABLERS/BARRIERS SOURCES
1 Supplier commitment Zhu and Sarkis (2006), Zhu et al. (2008c),
Lippmann (1999), Vachon and Klassen(2008),
Lippman (2001) and Hu and Hsu (2006)
2 Cost Carter, C.R. and Ellram, L.M. (1998)
3 Regulations Green et al. (1998), Beamon (2005), Hall
(2000), and Walker et al. (2008)
4 Environmental issue Srivastara, S. K. (2007)
5 Industry Specific Barriers Wei, ZH., 2004 and Srivastara, S. K. (2007)
6 Market edge Georgiadis, P., Vlachos, D. (2009)
7 Customer Redundancy Wells P, Seitz M. (2005)
Table 2, List of results/outcome in GSC
S.NO. RESULTS SOURCES
8 Green Products Zhu et al. (2008c), Hu and Hsu (2006), Routroy
(2009) and Zhu and Sarkis (2006)
9 Capacity Utilization Vlachos, D., Georgiadis, P., Iakovou., E. (2006).
10 Customer Satisfaction Zhu et al. (2008c), Paulraj (2009), and Vachon
and Klassen (2008)
11 Environmental Benefits Green et al. (1998)
12 Energy consumption
reduction
Rao and Holt (2005), Holt and Ghobadian (2009),
Paulraj (2009)
13 Processing time Fleischmann M, Beullens (2001)
14 Green Productivity &
efficiency
Vlachos, D., Georgiadis, P., Iakovou., E. (2006)
3. Interpretative Structural Modeling(ISM) as Multi Criteria Decision Modeling Tool:
Interpretive structural modeling (ISM) is an interactive learning process in which a set of
different and directly related elements is structured into a comprehensive systemic model
Warfield (1974) & Sage (1977). ISM can be used extensively in identifying and analyzing
interactions among the barriers (or elements) of a system. Malone (1975) first demonstrated the
use of ISM in analyzing the barriers for investment for an urban city. Mandal and Deshmukh
(1994) used ISM models to identify vendor selection criteria. Singh and Kant (2008) used ISM
model to study the barriers in knowledge management in certain manufacturing industries. Ravi
and Shankar (2005) applied ISM to analyze the barriers in the reverse logistics supply chain in
India. Wang et al. (2008) used ISM in analyzing barriers to energy saving in China. Kannan and
Haq, (2007) presented an integrated supplier selection and multi-echelon distribution inventory
model in a built-to-order supply chain environment using fuzzy AHP and genetic algorithm.
Kannan and Haq, (2007) proposed a structured model for evaluating vendor selection using AHP
and fuzzy AHP, proposed a structured model for evaluating vendor selection using AHP and
fuzzy AHP. The model so formed portrays the structure of a complex issue or problem, a system
or a field of study, in a carefully designed pattern implying graphics as well as words.
Interpretive structural modeling (ISM) helps in identifying the inter-relationships among
variables. It is a suitable modeling technique for analyzing the influence of one variable on other
variables. It provides systemic approach for improving supply chain agility. ISM is primarily
intended as a group learning process. The method is interpretive as the judgment of the group
decides whether and how the variables are related. It is structural as on the In this work,
interpretive structural modeling (ISM) has been applied to develop a framework for a case
supply chain to achieve the following broad objectives:
1. to derive interrelationships among the variables affecting green supply chain

2. to classify the these variables according to their driving and dependence power
On basis of relationship, an overall structure is extracted from the complex set of variables. It is a
modeling technique as the specific relationships and overall structure is portrayed in a digraph
model. ISM starts with an identification of variables, which are relevant to the problem or issue
and then extends with a group problem-solving technique ISM methodology helps to impose
order and direction on the complexity of relationships among elements of a system
3.1 ISM methodology and model development
The various steps involved in the ISM methodology are given below (Kannan and Haq, 2007 and
Kannan et al., 2009). The flow chart for the ISM methodology is shown in Fig. 2. Step 1: The
variables affecting the green supply chain for the firm under study are listed. Step 2: For each
pair of variables identified in Step 1, a contextual relationship is established. Step 3: A Structural
Self-Interaction Matrix (SSIM) is developed, which indicates pair wise relationships among
variables of the system under consideration. Step 4: A reachability matrix is developed from the
SSIM and the matrix is checked for transitivity. The transitivity rule states that if a variable ‘A’
is related to ‘B’ and ‘B’ is related to ‘C’, then ‘A’ is necessarily related to ‘C’. Step 5: The
reachability matrix obtained in Step 4 is partitioned into different levels.Step 7: The resulting
digraph is converted into an ISM by replacing the variable nodes with statements.
Step 8: The ISM model developed in Step 7 is reviewed to check for conceptual inconsistencies,
and necessary modifications are made. We now apply the ISM methodology to the firm under
study. Each of the following subsections corresponds to one step of the ISM methodology.

Fig.2 Flow for ISM Methodology
3.2 Development of Structural Self-Interaction Matrix (SSIM)
Based on contextual relationship among identified variables, a Structural Self-Interaction Matrix
(SSIM) was developed (Table 3). This matrix indicates the pair wise relationships among the
variables affecting the green supply chain initiatives for the firm under consideration. The
symbols used to denote the direction of the relationship between the variables is given below. Let
us assume that the variables (barriers and results) under study are i and j, then the symbol ‘V’
denotes that variables i will help to achieve variables j, the symbol ‘A’ means that variables j will
be help to achieve variables i. The symbol ‘X’ means that variable i and j will help each other to
be achieved and the symbol ‘O’ means the variables are unrelated.
V – Variables i will help to achieve Variables j; A – Variables j will help to achieve Variables i;
X – Variables i and j will help to achieve each other; and O – Variables i and j are unrelated.

The following statements illustrates the use of symbols V, A, X and O in the SSIM matrix.
Environmental benefits variable will be achieved by energy consumption reduction
variable (A);
Environmental issue variable will help to achieve environmental benefits variable (V).
Table 3: Structural Self-Interaction Matrix (SSIM)
S.N. Variables 14 13 12 11 10 9 8 7 6 5 4 3 2 1
1 Supplier commitment V O V V V O V O O O A A A
2 Cost V V V O O V V V V V A O
3 Regulations V V V A O V V O O O A
4 Environmental issue V V V V V V V V V V
5 Customer Satisfaction V O V O A O O O O
6 Industry Specific Barriers V V O O O O O O
7 Capacity Utilization V O V A A O A
8 Green Products V O V A V V
9 Processing time V O V O V
10 Environmental Benefit V O V A
11 Energy Consumption Reduction V O O
12 Market edge V O
13 Customer Redundancy V
14 Productivity & Efficiency
Table 4, initial reachability matrix for the variables
S.N Variables 1 2 3 4 5 6 7 8 9 10 11 12 13 14
1 Supplier commitment 1 0 0 0 0 0 0 1 0 1 1 1 0 1
2 Cost 1 1 0 0 1 1 1 1 1 0 0 1 1 1
3 Regulations 1 0 1 0 0 0 0 1 1 0 0 1 1 1
4 Environmental issue 1 1 1 1 1 1 1 1 1 1 1 1 1 1
5 Customer Satisfaction 0 0 0 0 1 0 0 0 0 0 0 1 0 1
6 Industry Specific Barriers 0 0 0 0 0 1 0 0 0 0 0 0 1 1
7 Capacity Utilization 0 0 0 0 0 0 1 0 0 0 0 1 0 1
8 Green Products 0 0 0 0 0 0 1 1 1 1 0 1 0 1
9 Processing time 0 0 0 0 0 0 0 0 1 1 0 1 0 1
10 Environmental Benefits 0 0 0 0 1 0 1 0 0 1 0 1 0 1
11 Energy Consumption Reduction 0 0 1 0 0 0 1 1 0 1 1 0 0 1
12 Market edge 0 0 0 0 0 0 0 0 0 0 0 1 0 1
13 Customer Redundancy 0 0 0 0 0 0 0 0 0 0 0 0 1 1
14 Productivity & Efficiency 0 0 0 0 0 0 0 0 0 0 0 0 0 1
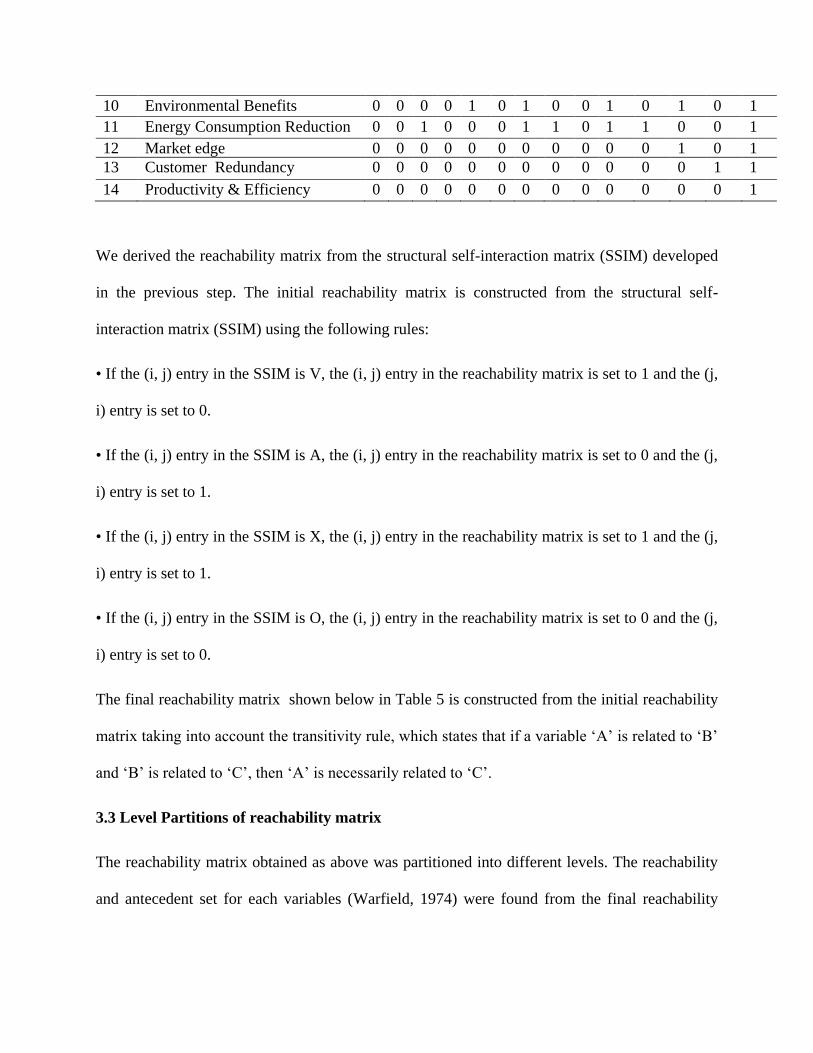
We derived the reachability matrix from the structural self-interaction matrix (SSIM) developed
in the previous step. The initial reachability matrix is constructed from the structural self-
interaction matrix (SSIM) using the following rules:
• If the (i, j) entry in the SSIM is V, the (i, j) entry in the reachability matrix is set to 1 and the (j,
i) entry is set to 0.
• If the (i, j) entry in the SSIM is A, the (i, j) entry in the reachability matrix is set to 0 and the (j,
i) entry is set to 1.
• If the (i, j) entry in the SSIM is X, the (i, j) entry in the reachability matrix is set to 1 and the (j,
i) entry is set to 1.
• If the (i, j) entry in the SSIM is O, the (i, j) entry in the reachability matrix is set to 0 and the (j,
i) entry is set to 0.
The final reachability matrix shown below in Table 5 is constructed from the initial reachability
matrix taking into account the transitivity rule, which states that if a variable ‘A’ is related to ‘B’
and ‘B’ is related to ‘C’, then ‘A’ is necessarily related to ‘C’.
3.3 Level Partitions of reachability matrix
The reachability matrix obtained as above was partitioned into different levels. The reachability
and antecedent set for each variables (Warfield, 1974) were found from the final reachability

matrix as shown in, Table 6. The reachability set for an individual variables consists of itself and
the other variables which it may help to achieve.
The antecedent set consists of the variables themselves and the other variables which may help in
achieving it. The intersection of both these sets was also derived for all variables. The variables
for which the reachability and the intersection sets are same is assigned as the top level variables
Table 5, final reachability matrix for the variables
S.N Variables 1 2 3 4 5 6 7 8 9 10 11 12 13 14 Driving
power
1 Supplier commitment 1 0 0 0 0 0 0 1 0 1 1 1 0 1 6
2 Cost 1 1 0 0 1 1 1 1 1 0 0 1 1 1 10
3 Regulations 1 0 1 0 0 0 0 1 1 0 0 1 1 1 7
4 Environmental issue 1 1 1 1 1 1 1 1 1 1 1 1 1 1 14
5 Customer Satisfaction 0 0 0 0 1 0 0 0 0 0 0 1 0 1 3
6 Industry Specific Barriers 0 0 0 0 0 1 0 0 0 0 0 0 1 1 3
7 Capacity Utilization 0 0 0 0 0 0 1 0 0 0 0 1 0 1 3
8 Green Products 0 0 0 0 0 0 1 1 1 1 0 1 0 1 6
9 Processing time 0 0 0 0 0 0 0 0 1 1 0 1 0 1 4
10 Environmental Benefits 0 0 0 0 1 0 1 0 0 1 0 1 0 1 5
11 Energy Cons. & Red. 0 0 1 0 0 0 1 1 0 1 1 0 0 1 6
12 Market edge 0 0 0 0 0 0 0 0 0 0 0 1 0 1 2
13 Customer Redundancy 0 0 0 0 0 0 0 0 0 0 0 0 1 1 2
14 Productivity & Efficiency 0 0 0 0 0 0 0 0 0 0 0 0 0 1 1
Net Dependence power 4 2 3 1 4 3 6 6 5 6 3 10 5 14
Table 6 Level partition of variables – Iteration 1
Variables Reachability Set Antecedent Set
Intersection set
Level
1 1,8,10,11,12,14 1,2,3,4 1
2 1,2,5,6,7,8,9,12,13,14 2,4 2
3 1,3,8,9,12,13,14 3,4,11 3
4 1,2,3,4,5,6,7,8,9,10,11,12,13,14 4 4
5 5,12,14 2,4,5,10 5
6 6,13,14 2,4,6 6
7 7,12,14 2,4,7,8,10,11 7
8 7,8,9,10,12,14 1,2,3,4,8,11 8

9 9,10,12,14 2,3,4,8,9 9
10 5,7,10,12,14 1,4,8,9,10,11 10
11 3,7,8,10,11,14 1,4,11 11
12 12,14 1,2,3,4,5,7,8,9,10,12 12
13 13,14 2,3,4,6,13 13
14 14 1,2,3,4,5,6,7,8,9,10,
11,12,13,14
14 Level 1
The ISM hierarchy as it would not help achieve any other variable above their own level. After
the identification of the top level element, it is discarded from the list of remaining variables.
From table 6, it is seen that the Green Productivity (variable 14) is found at level 1st. thus, it
would be positioned at top of ISM hierarchy. This iteration is repeated till the levels of each
variable are found out. The identified levels aids in building the digraph and final model of IS
Table 6 shows 1st iteration in partition of variables. For 1
st iteration, Productivity & efficiency
variable is found to have same reachability and the intersection sets, and so qualifies to hold
level 1. It is then discarded from the list of remaining variables and again intersection set was
computed for remaining variables.
3.4 Formation of ISM model
With the help of the level partition shown in Tables 4 and 5, a model of the various variables
important to implementing green supply chain management for the firm under study was
developed, and is shown in Fig. 3.

Fig.3 ISM model for the variables associated with Green Supply Chain
3.5 MICMAC analysis
In MICMAC analysis, the dependence power and variables power of the variables are analyzed.
On the basis of the above study, the variables were classified into four sectors. The four sectors
are autonomous, dependent, linkage, and variables/independent. In the final reachability matrix,
shown in table 5, the driving power and dependence of each of the variables are calculated. The
variables involved in initiating the green supply chain pose considerable challenges for the
environment. Due to the complexity of GSC practices, customer and cost pressures and
regulation uncertainty, implementing GSC is considered as a thankless task that increases overall
product cost. Decision makers must be aware of the relative importance of the various variables
and the techniques for implementing them. Highlighting the 14 types of variables, an ISM model
was developed and the interactions between these variables were analyzed for the firm under
study using the ISM model and MICMAC analysis. The managerial implication and concluding
remarks emerging from this study are as follows: The variables that have weak variables power
and weak dependence will fall in SECTOR 1 and are called autonomous elements. Variables that
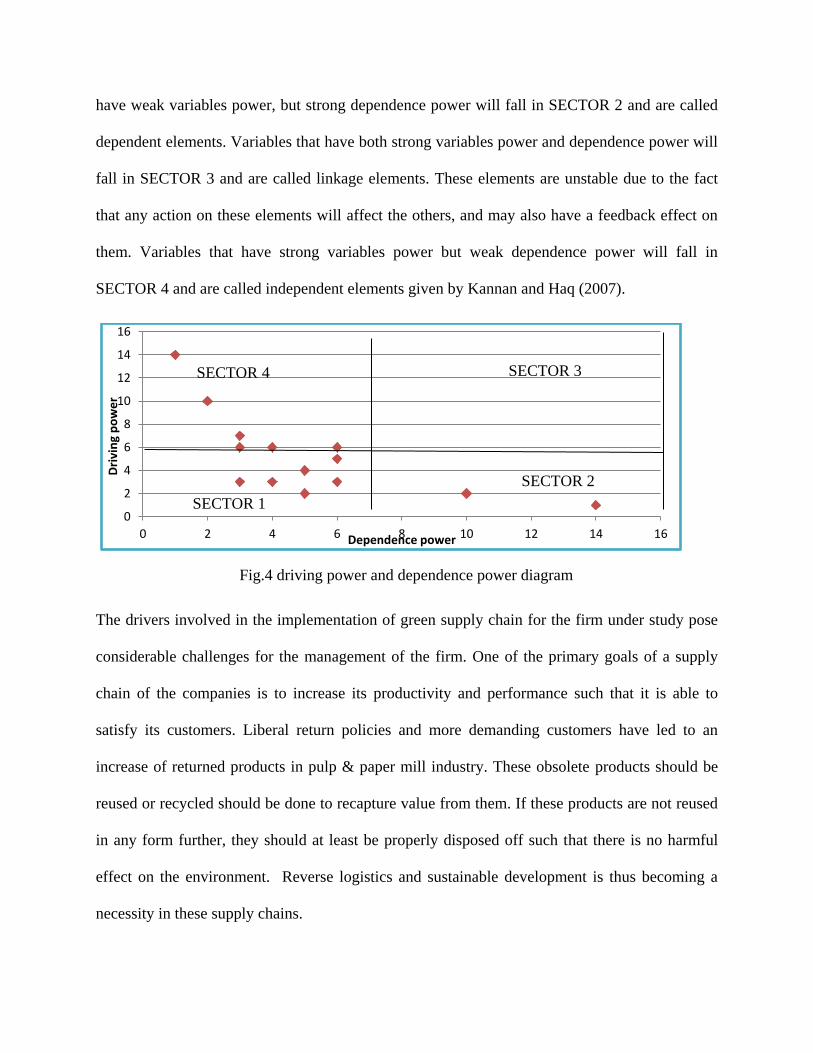
have weak variables power, but strong dependence power will fall in SECTOR 2 and are called
dependent elements. Variables that have both strong variables power and dependence power will
fall in SECTOR 3 and are called linkage elements. These elements are unstable due to the fact
that any action on these elements will affect the others, and may also have a feedback effect on
them. Variables that have strong variables power but weak dependence power will fall in
SECTOR 4 and are called independent elements given by Kannan and Haq (2007).
Fig.4 driving power and dependence power diagram
The drivers involved in the implementation of green supply chain for the firm under study pose
considerable challenges for the management of the firm. One of the primary goals of a supply
chain of the companies is to increase its productivity and performance such that it is able to
satisfy its customers. Liberal return policies and more demanding customers have led to an
increase of returned products in pulp & paper mill industry. These obsolete products should be
reused or recycled should be done to recapture value from them. If these products are not reused
in any form further, they should at least be properly disposed off such that there is no harmful
effect on the environment. Reverse logistics and sustainable development is thus becoming a
necessity in these supply chains.
0
2
4
6
8
10
12
14
16
0 2 4 6 8 10 12 14 16
Dri
vin
g p
ow
er
Dependence power
SECTOR 3
SECTOR 2
SECTOR 4
SECTOR 1
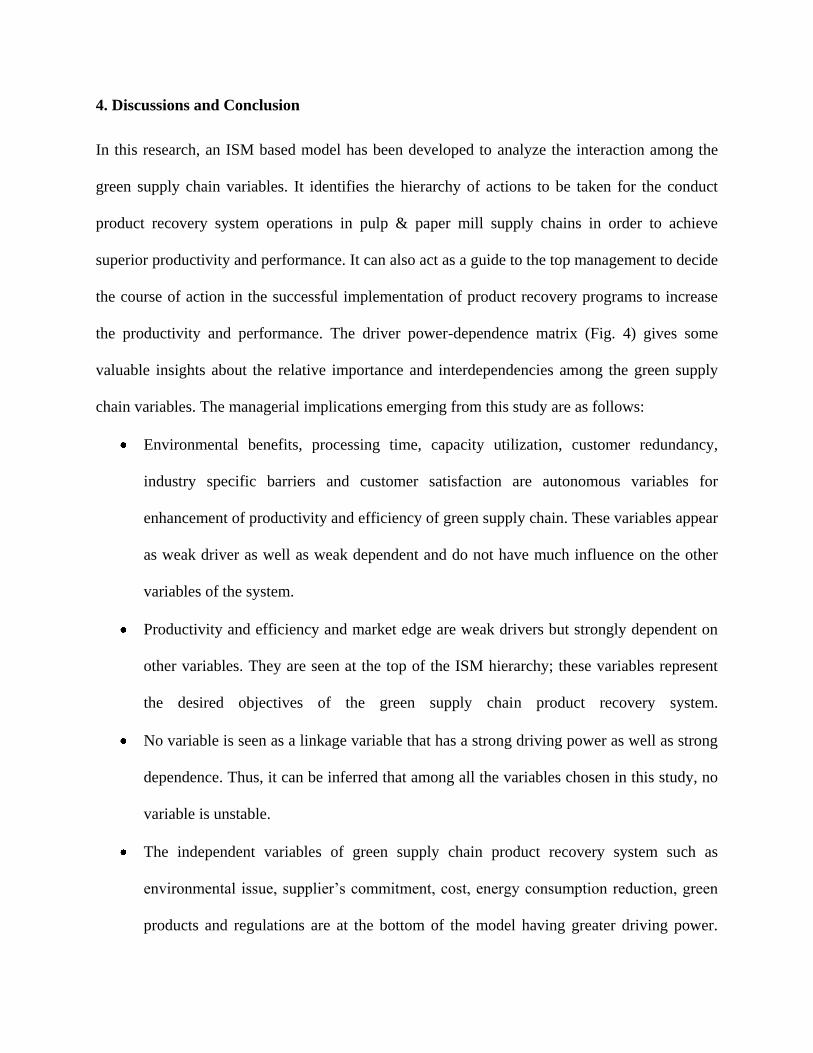
4. Discussions and Conclusion
In this research, an ISM based model has been developed to analyze the interaction among the
green supply chain variables. It identifies the hierarchy of actions to be taken for the conduct
product recovery system operations in pulp & paper mill supply chains in order to achieve
superior productivity and performance. It can also act as a guide to the top management to decide
the course of action in the successful implementation of product recovery programs to increase
the productivity and performance. The driver power-dependence matrix (Fig. 4) gives some
valuable insights about the relative importance and interdependencies among the green supply
chain variables. The managerial implications emerging from this study are as follows:
Environmental benefits, processing time, capacity utilization, customer redundancy,
industry specific barriers and customer satisfaction are autonomous variables for
enhancement of productivity and efficiency of green supply chain. These variables appear
as weak driver as well as weak dependent and do not have much influence on the other
variables of the system.
Productivity and efficiency and market edge are weak drivers but strongly dependent on
other variables. They are seen at the top of the ISM hierarchy; these variables represent
the desired objectives of the green supply chain product recovery system.
No variable is seen as a linkage variable that has a strong driving power as well as strong
dependence. Thus, it can be inferred that among all the variables chosen in this study, no
variable is unstable.
The independent variables of green supply chain product recovery system such as
environmental issue, supplier’s commitment, cost, energy consumption reduction, green
products and regulations are at the bottom of the model having greater driving power.
Thus there is a strong need to address these variables help to achieve desired result
variables, which appear at the top of the ISM hierarchy. Therefore, it can be inferred that
there must be strategies to enhance the deployment of independent variables so that the
desired level of productivity and efficiency can be achieved.
References
Sage, A. P. 1977. Interpretive Structural Modeling: Methodology for Large-Scale Systems.
McGraw-Hill, New York NY: 91–164.
Mandal, A., Deshmukh, S. G. 1994. Vendor selection using interpretive structural modeling
(ISM). Int. J. Oper. Prod. Manag. 14 (6): 52–59.
Ayres, R. U. 1978. Resources, Environment, and Economics: Applications of the Materials and
Energy Balance Principle. John Wiley and Sons, New York, NY.
Beamon, B. M. 2005. Environmental and sustainability ethics in supply chain management.
Science and Engineering Ethics 11: 221–34.
Bond, T. C. 1999. The role of performance measurement in continuous improvement.
International Journal of Operations and Production Management 19(12):1318–34.
Carter, C. R., Ellram, L. M. 1998. Reverse logistics: A reviewof the literature and framework for
future investigation. Journal of Business Logistics 19(1):85–102.
Diabat, A., Kannan G. 2011, An analysis of the drivers affecting the implementation of green
supply chain Management, Resources, Conservation and Recycling, 55:659–667
Vlachos, D., Georgiadis, P., Iakovou, E. 2006. A system dynamics model for dynamic capacity
planning of remanufacturing in closed-loop supply chains Industrial Management Division.
Department of Mechanical Engineering, Aristotle University of Thessaloniki, Greece.

Fleischmann, M., Beullens, P., Bloemhof-Ruwaard, J. M., vanWassenhove, L. N. 2001. The
impact of product recovery on logistics network design. Production and Operations Manag.
10(2):156–73.
Hall, J. 2000. Environmental supply chain dynamics. Journal of Cleaner Production 8(6):455–71.
Hervani, A. A., Helms, M. M., Sarkis, J. 2005. Performance measurement for green supply chain
management. Benchmarking: An International Journal 12(4):330–53.
Inderfurth, K. 2004. Product recovery behavior in a closed loop supply chain. In: Dyckhoff H,
Lackes R, Reese J, editors. Supply chain manag. and reverse logistics. Berlin: Springer-Verlag;
Kannan, G., Haq, N. A. 2007. Analysis of interactions of criteria and sub-criteria for the
selection of supplier in the built-in-order supply chain environment. International Journal of
Production Research 45:1–22
Kannan, G., Pokharel, S., Sasikumar, P. 2009. A hybrid approach using ISM and fuzzy TOPSIS
for the selection of reverse logistics provider. Resources, Conservation and Recycling 54:28–36.
Kudva, N. 1996. Uneasy partnership, GovernmentdNGO relations in India. Berkeley, CA:
Institute of Urban and Regional Development. Working paper 673.
Lippmann, S. 1999. Supply chain environmental management: elements of success. Corporate
Environmental Strategy 6(2):175–82.
Linton, J. D., Klassen, R., Jayaraman, V. 2007. Sustainable supply chains: an introduction.
Journal of Operations Management 25(1):1075–82.
Malone, D. 1975. An introduction to the application of interpretive structural modeling.
Proceedings of the Institute of Electrical and Electronics Engineers 63: 397-404.
Miraftab, F. 1997. Flirting with the enemy: challenges faced by NGOs in development and
empowerment. Habitat International 21(4): 361-375.
Green, K., Morton, B., New, S., 1998. Green purchasing and supply policies: do they improve
companies’ environmental performance?. Supply Chain Management: An International Journal
3(2): 89 – 95
Olugu, E. U., Wong, K. Y. 2009. Supply chain performance evaluation: trends and challenges.
American Journal of Engineering and Applied Sciences 2(1):202–11.
Georgiadis, P., Vlachos, D. 2009. The effect of environmental parameters on product recovery.
Department of Mechanical Engineering, Aristoteles University of Thessaloniki, Greece.
Paulraj, A. 2009. Environmental motivations: a classification scheme and its impact on
environmental strategies and practices. Business Strategy and the Environment 18(7):453–68.
Rao, P., Holt, D. 2005. Do green supply chains lead to competitiveness and economic
performance? International Journal of Operations & Production Management 25(9):898–916.
Ravi. V., Shankar, R. 2005. Analysis of interactions among the barriers of reverse logistics
International Journal of Technological Forecasting & Social change 72(8):1011–29.
Routroy, S. 2009. Antecedents and drivers for green supply chain management implementation
in manufacturing environment. ICFAI Journal of Supply Chain Management 6(1):20–35
Roberts, S. 2003. Supply chain specific? Understanding the patchy success of ethical sourcing
initiatives. Journal of Business Ethics 44:159–70.
Sabri, E. H., Beamon, M. 2000. A multi-objective approach to simultaneous strategic and
operational planning in supply chain design. Omega: An International Journal of Management
Science 28:581–98.
Salam, M. A. 2009. Corporate social responsibility in purchasing and supply chain. Journal of
Business Ethics 85(2):355–70.

Steven, M. 2004. Network in reversed logistics. In: Dyckhoff H, Lackes R, Reese J, editors.
Supply chain management and reverse logistics. Berlin: Springer-Verlag.
Stern, M.O., Ayres, R.U., Saxton, J.C. 1973. Tax strategies for industrial pollution abatement.
IEEE Transactions on Systems Man and Cybernetics 3(6): 588–603.
Spengler, T., Stolting, W., Ploog, M. 2004. Recovery planning in closed loop supply chain: an
activity analysis based approach. In: Dyckhoff H, Lackes R, Reese J, editors. Supply chain
management and reverse logistics. Berlin: Springer-Verlag.
Tsoulfas, G. T., Pappis, C. P. 2008. A model for supply chains environmental performance
analysis and decision making. Journal of Cleaner Production 16(15):1647–57.
Vachon, S., Klassen, R. D. 2008. Environmental management and manufacturing performance:
the role of collaboration in the supply chain. International Journal of Production Economics
111:299–315.
Van Hoek, R. I. 1999. From reversed logistics to green supply chains. Supply Chain
Management: An International Journal 4(3):129–34.
Walker, M. 1996. NGO participation in a corporatist state: The example of Indonesia. Berkeley
CA: Institute of Urban and Regional Development. Working paper 678.
Walker, H., Di Sisto, L., McBain, D. 2008. Drivers and barriers to environmental supply chain
management practices: lessons from the public and private sectors. Journal of Purchasing and
Supply Management 14(1):69–85.
Wei, Z. H. 2004. Economic development and energy issues in China. Working paper prepared
for the First KEIO-UNU-JFIR Panel Meeting, The 21st Century Center of Excellence Program,
Economic Development and Human Security, February 13–14, Tokyo.
Warfield, J. W. 1974. Developing interconnected matrices in structural modeling. IEEE
Transaction Systems Man and Cybernetics 4(1):51–81.
Wadhwa, S Bibhushan, Madaan J. and Chawla A. 2009. An object-oriented framework for
modelling control policies in a supply chain, Int. Jrnl. of Value Chain Mgmt. 3(1): 36 – 63.
Wadhwa, S., Madaan and FTS Chan, 2009. Flexible Decision Modelling of Reverse Logistics
System: A Value Adding MCDM Approach for Alternative Selection, Int. Jrnl. of Robotics and
Computer-Integrated Manufacturing, 25: 460–469.
Wells, P., Seitz, M. 2005. Business models and closed-loop supply chains: a typology. Supply
Chain Management: An International Journal 10(4):249–51.
Zhu, Q., Sarkis, J. 2006. An inter-sectoral comparison of green supply chain management in
China: drivers and practices. Journal of Cleaner Production 14(5):472–86.
Zhu, Q., Sarkis, J., Lai, K. 2008c. Confirmation of a measurement model for green supply chain
management practices implementation. International Journal of Prod. Economics 111(2):261–73.