Multi-institutional Study of Self-Efficacy within Flipped ...
46
Portland State University Portland State University PDXScholar PDXScholar Chemistry Faculty Publications and Presentations Chemistry 3-30-2021 Multi-institutional Study of Self-Efficacy within Multi-institutional Study of Self-Efficacy within Flipped Chemistry Courses Flipped Chemistry Courses Nicole Naibert Portland State University Kerry D. Duck University of Delaware Michael M. Phillips University of Northern Colorado Jack Barbera Portland State University, [email protected] Follow this and additional works at: https://pdxscholar.library.pdx.edu/chem_fac Part of the Chemistry Commons Let us know how access to this document benefits you. Citation Details Citation Details Naibert, N., Duck, K. D., Phillips, M. M., & Barbera, J. (2021). Multi-institutional Study of Self-Efficacy within Flipped Chemistry Courses (Post-print version). Journal of Chemical Education. This Post-Print is brought to you for free and open access. It has been accepted for inclusion in Chemistry Faculty Publications and Presentations by an authorized administrator of PDXScholar. Please contact us if we can make this document more accessible: [email protected].
Transcript of Multi-institutional Study of Self-Efficacy within Flipped ...

Portland State University Portland State University
PDXScholar PDXScholar
Chemistry Faculty Publications and Presentations Chemistry
3-30-2021
Multi-institutional Study of Self-Efficacy within Multi-institutional Study of Self-Efficacy within
Flipped Chemistry Courses Flipped Chemistry Courses
Nicole Naibert Portland State University
Kerry D. Duck University of Delaware
Michael M. Phillips University of Northern Colorado
Jack Barbera Portland State University, [email protected]
Follow this and additional works at: https://pdxscholar.library.pdx.edu/chem_fac
Part of the Chemistry Commons
Let us know how access to this document benefits you.
Citation Details Citation Details Naibert, N., Duck, K. D., Phillips, M. M., & Barbera, J. (2021). Multi-institutional Study of Self-Efficacy within Flipped Chemistry Courses (Post-print version). Journal of Chemical Education.
This Post-Print is brought to you for free and open access. It has been accepted for inclusion in Chemistry Faculty Publications and Presentations by an authorized administrator of PDXScholar. Please contact us if we can make this document more accessible: [email protected].

1
Multi-institutional Study of Self-Efficacy within Flipped Chemistry Courses Nicole Naiberta, Kerry D. Duck, Michael M. Phillipsc, and Jack Barbera a* aDepartment of Chemistry, Portland State University, Portland, Oregon, 97207-0751, United States
bSchool of Education, University of Delaware, Newark, Delaware, 19716, United States cSchool of Psychological Science, University of Northern Colorado, Greeley, Colorado 80639-6900, United States DOI: 10.1021/acs.jchemed.0c01361 Abstract Active learning environments have been shown to be beneficial for student learning, however, including such activities can be limited by the class time available. One method that can provide more opportunities for active learning during face-to-face class time is the flipped learning approach. However, studies on the impacts of flipped learning environments on student motivation are limited. Therefore, in this multi-institutional study, general chemistry students enrolled in flipped courses at three institutions responded to measures of self-efficacy and self-regulatory strategies. The results from these measures were used to evaluate how students’ academic self-efficacy (ASE) and chemistry self-efficacy (CSE) changed over the term at each institution, as well as to compare students’ CSE between the institutions. Evidence was found for scalar measurement invariance across all measures, such that latent means could be used to compare results over time and between the institutions. Overall, students at each institution showed a decrease in ASE over the term, although their CSE increased. Comparisons between the institutions showed that students at the Southeastern institution had a higher post CSE than students at the Western and Northwestern institutions. One salient difference between the institutions was the structure of the face-to-face class time, which suggests that there may be a relation between students’ post CSE scores and the structure of the course. However, other variables, such as the demographic profiles of the institutions, may have also played a role in the observed differences. Graphical Abstract
Post Self-Efficacy
Pre Self-Efficacy
Pre TMT
Pre CON 1

2
Introduction Over the past few decades, many have advocated for the adoption of more student-
centered, active-learning pedagogical approaches in college science classrooms.1,2 The goal of moving from a more instructor-centered, lecture-based, approach is to more fully engage students in the learning and inquiry process, which may better instill higher-order learning (e.g., analysis, synthesis, and evaluation of content) and increase student-instructor and student-student interactions. Research has supported a shift from teaching approaches that focus solely on memorization to those that also incorporate greater levels of problem solving, which can lead to more developed mental models for greater meaningful learning.1,3,4 With an active learning approach, the instructor becomes a facilitator during the learning process compared to the “sage on the stage,”5, 6 with potential to push students to become more self-directed and take greater ownership over their learning.
A wide variety of teaching methods have been grouped under the umbrella of “active
learning” techniques, e.g., using clicker questions, peer-led team-learning (PLTL), process-oriented guided inquiry learning (POGIL), problem- and project-based learning (PBL), think-pair-share, instructor-led class discussions, and group discussions.1, 4 All of these contrast with a more instructor-centered approach, however they can vary based on the level of student activity and engagement generated during the learning process. The use of an active learning approach does not necessarily mean greater student engagement and motivation unless a synergy is created between the two.7 Thus, exploring instructional models that provide opportunities for active learning techniques is crucial to understanding the nuanced aspects between the use of active learning techniques and student motivation. One instructional model that has allowed for greater opportunities to employ active learning techniques in the classroom has been flipped learning. Flipped Learning Model and Chemistry
The flipped learning approach moves the delivery of direct instruction from the classroom space, making room for more student-centered activities. The earliest reports of this type of inverted classroom structure date back to 2000, with a rapid and steady rise in the education research literature beginning in 2011 (see Fig. 1 in Casselman et al.8). Early reports within the higher education chemistry education literature focused on suggestions for developing and implementing the technique,9 impacts compared to traditional instruction,10 and student attitudes.11
Many studies on flipped learning within chemistry education have utilized course-based
measures (e.g., course evaluations, exams, grades) to report on students’ perceptions of being in a flipped course and its impact on performance-based outcomes. Fewer studies have focused on measuring outcomes related to other constructs, with some exceptions. A 2016 study12 investigated student attitudes in a flipped organic chemistry course using the revised version of the Attitude toward the Subject of Chemistry Inventory (ASCIv2). In 2017, the Student Assessment of Learning Gains (SALG) was used to investigate student perceptions and attitudes in organic13 and general14 chemistry courses. A 2018 study15 investigated students’ engagement within a flipped physical chemistry course using the Behavioral Engagement Related to Instruction (BERI) protocol. With specific regard to investigating motivation, the chemistry version of the Academic Motivation Scale (AMS-Chemistry) was utilized to explore differences in motivation between a traditional lecture course and a flipped course that included PLTL.16 As

3
the AMS-Chemistry is based on Self-Determination Theory (SDT),17 results indicated that although students’ intrinsic and extrinsic motivation were similar between the two courses at the end of the term, students’ scored lower on amotivation (i.e., lack of motivation) in the flipped-PLTL course compared to the lecture-based course. In an additional study,18 the chemistry version of the Science Motivation Questionnaire (SMQ-II) was administered within flipped general chemistry courses to compare motivation and final course grades. Results indicated no discernable pattern between first-term grades and motivation, with a pattern arising at the end of the second-term. The SMQ-II is based upon Social-Cognitive Theory (SCT),19, 20 however, the subscales draw upon multiple theoretical frameworks of motivation while also seeking an overall motivational composite score, which has resulted in complications for measurement and scale adaptability.21, 22 Given this limited number of motivation-based studies of flipped learning environments, there is still a need for the use of sound motivational theories and frameworks in investigating their impacts. Social-Cognitive Framework for Motivation
From a social-cognitive perspective, learning is viewed as being dynamic and dialectical in nature between learner’s beliefs, behavior, and the environment in which the learning takes place.19, 20, 23 As part of this dynamic aspect, psycho-social factors like motivation play an important role for student success in college learning environments.24 Evidence has supported the notion that academic motivational factors have a significant impact on learning outcomes (e.g., see Anderman and Dawson25 for a summary). When drawing on a social-cognitive perspective, two constructs that provide insight to understanding students’ goal directed actions and the reciprocal interactions within their learning environment have been self-efficacy and self-regulation.26
Self-Efficacy. Self-efficacy within the academic realm is the perceptual acuity one has
regarding their capabilities to learn or carry out certain tasks to attain an academic outcome.19 Even though academic self-efficacy is not the same as ability, it has been shown to predict academic success and performance across different age levels and content areas.24, 26, 27 One source of self-efficacy is connected to direct engagement and task completion.19 The perception of success (or failure) upon completing a task can have a direct impact on increasing or decreasing one’s self-efficacy.19
Many times, in academic situations, self-efficacy is measured toward the beginning of a
course and used to predict academic performance at the end,28 while mid- or end of semester assessments might provide a different perspective on the association between academic self-efficacy and performance (e.g., Galyon et al.29). At these later time points, students have completed a number of assignments and assessments across their course load and thus have more feedback to inform their self-efficacy beliefs in that context. Studies in chemistry have employed self-efficacy measures to compare different groups of students or learning environments,30, 31 other studies have measured self-efficacy for use as a predictor variable of academic outcomes32 or as one of several variables in a larger educational model.33-35 For studies that explored changes, many found that self-efficacy generally increased over the term,36-39 although, some have noted that this increase was dependent on the demographic group.37

4
Variation in results could be based on whether self-efficacy is assessed on one’s perception of performing a certain task, a specific subject area, particular topics or concepts within a subject area, performance in a specific class, or compared to all of their courses within a current semester. When the lens used to study self-efficacy is focused at a more specific level (e.g., at the subject, content, or task level), the predictive ability becomes greater for performance,40 future success, and re-engagement.41 For example, where Galyon and colleagues29 found academic self-efficacy went down over a semester, Lawson and colleagues42 found science self-efficacy to go up over a semester. This variation could be based on the level of specificity for how self-efficacy was measured, which might contribute to the magnitude of the self-efficacy and performance association. Within chemistry, self-efficacy has commonly been measured using a variation of either the Chemistry Attitude and Experience Questionnaire (CAEQ)30, 37, 39 or the College Chemistry Self-Efficacy Scale (CCSS).32, 36, 38 These measures primarily include items based around specific chemistry tasks, the course itself, or application of chemistry concepts to real-life situations and can be considered measures of chemistry self-efficacy (CSE). Although some studies have measured self-efficacy at a more general level,33 none have included measures of CSE and academic self-efficacy (ASE) simultaneously.
Richardson and colleagues26 conducted a meta-analysis investigating the association
between ASE and university success by means of grade point average (GPA). They found 9% of GPA variance could be explained by ASE. However, effect sizes varied widely between studies, indicating that there could potentially be factors that mediate or moderate this relation. For example, deep processing strategies used by students43 and effort regulation44 have been shown to mediate the relation between self-efficacy and academic performance. Whereas, Tabak and colleagues45 found time on task to be a moderating factor. With the potential for mediating and moderating effects, aspects of self-regulation for how students focus their time, effort and learning strategies have the potential to highlight aspects of this relation.
Villafañe, Garcia, and Lewis37 noted the importance of examining gender and
race/ethnicity when investigating chemistry self-efficacy over time. In chemistry, gender differences have been identified at different time points (e.g., beginning and end of semester) and for different qualitative factors. For example, Dalgety and Coll46 found that males had higher self-efficacy at the beginning of a semester and qualitatively worried more about specific aspects of chemistry content connected to their self-efficacy, while women were found to have lower self-efficacy overall from a qualitative analysis. Sunny and colleagues47 also found men to have higher chemistry self-efficacy at the end of a semester utilizing a task specific measure for chemistry adapted from the motivated strategies for learning questionnaire (MSLQ). An analysis of narrative cases in STEM48 found men’s self-efficacy beliefs to be tied more to mastery experiences, while women’s relational experiences in the learning environment (e.g., social persuasion and vicarious learning) were the greater influence. In connection to the classroom structure, Boz and colleagues49 concluded that perceptions of a chemistry learning environment mediated the relation between gender and self-efficacy at the end of a semester, after finding that when females perceived a more positive learning environment it mediated higher levels of self-efficacy beliefs. Given these prior findings, it is important to continue to examine the development of self-efficacy beliefs in addition to accounting for potential gender and race/ethnicity differences while doing so.

5
Self-Regulation. Self-regulated learning refers to the ability of an individual to self-generate thoughts, feelings, and behaviors and organize them to direct their abilities toward a goal before, during, and after a learning task.50-52 As part of this process, students must use effective learning strategies to organize and manage their thoughts, behaviors, and time wisely. Individuals that tend to report using more strategic self-regulation tend to perform better than less self-regulated students.53 Even though self-regulatory skills can be taught,52, 54 some have noted that students need the skill and will to use self-regulatory strategies (e.g., Snow55) and thus is something that can be controlled when assessing learning outcomes.
One component to a number of self-regulation models includes the monitoring and
management of one’s learning. For monitoring, these might be potential distractions or barriers while trying to learn new material, e.g., not being able to concentrate on new material because the textbook is perceived to be boring.56, 57 Whereas, management connects to how a student plans and sustains their efforts toward the task.58 Those that use self-regulatory strategies tend to be viewed as taking a more active stance toward their learning.59 As a flipped learning environment requires students to use more self-regulated learning strategies both in and outside of the classroom, they need to take ownership over and become more involved in the learning process. For example, students must adequately manage their time and focus on the video content assigned before coming to class. Thus, it is important to assess and control for how students utilize different strategies and resources to learn, manage their effort and organize their time, and monitor and evaluate their learning outcomes.52, 59
There is wide variability in students’ perceptions of self-efficacy and their use of self-
regulatory strategies in learning situations.28 A consistent finding has been that domain-specific measures of motivation have shown a greater relation to academic achievement compared to global measures.60 Additionally, when considering a complex psychological phenomenon like motivation, taking the multi-dimensional and multi-faceted nature of the construct into account is crucial. As Anderman and Dawson25 note, there is no “one size fits all” when using the term motivation. It has been maintained that a one-item measure assessing students’ perceptions of enjoyment do not tend to assess student motivation based on its complexity.61 Thus, when examining academic motivation, it is important to identify and measure different aspects that are important for the learning context being studied. Measurement To gather data about students’ self-regulation and self-efficacy within a learning environment, self-report survey measures are typically administered. To produce meaningful inferences, the measures must be aligned with the constructs of interest and be shown to produce valid and reliable results with the target population.62, 63 When using extant measures supported by prior psychometric studies, the primary evidence for data validity is the underlying structure. Structural validity provides evidence that the data derived from each indicator variable within a measure are properly associated with the a priori model for the latent construct being measured.64 If structural validity of the data from the population under investigation is supported, then evidence is provided that the data maps onto the latent construct. However, if the structural validity of the data is not supported, investigations of the Response Process and/or Content Validity may need to be conducted.21, 22 Furthermore, if the measured data will be used to compare groups on the latent construct, evidence of Consequential Validity needs to be

6
established. For self-reported quantitative data, this level of validity can be supported through measurement invariance to determine if group-bias is present in the data structure.65 Finally, when measures are only administered once per time point, an estimate of the single-administration reliability is warranted.66 Purpose of this study
This study employed a social-cognitive perspective to investigate chemistry students’ self-efficacy and self-regulation strategies within flipped learning environments. To broaden the generalizability, data collection spanned courses from a range of institutions and used a coordinated set of assessment instruments. In conducting this work, the following research questions were addressed: 1) What evidence supports the validity and reliability of the data generated from the coordinated assessments at our sites?, 2) How do students’ self-efficacy and self-regulation change within each flipped learning environment?, and 3) How do these constructs compare across sites? To answer these questions, we examined students’ self-efficacy and self-regulation at three institutions. Prior to conducting comparative analyses, data from each assessment instrument were explored for evidence of validity and reliability. Data validity was further supported by cross-validation and measurement invariance studies, following which, structural means modeling was utilized to compare outcomes within and across institutions. Methods Population
Three institutions from the United States were involved in this study. All three were public research universities but varied in their acceptance rate and demographic profile (Table 1). These data collection sites were selected based on the corresponding author’s knowledge of who the flipped learning instructors were and that none were new to course flipping. As such, each instructor had a minimum of two years of experience in flipping their course and was the primary or only person involved in developing the course materials (Table 2). The general structure of each course followed the two basic tenets of flipping: 1) foundational information was delivered to students through pre-class materials (PCMs), and 2) the face-to-face (F2F) environment was utilized for the application or expansion of the information through active learning.67 Table 1. Institution details.
Institutions by Region
Southeastern Western Northwestern
Size (Approx.) 55,000 35,000 30,000
Type Four-year, Public, Doctoral – Very High Research Activity
Four-year, Public, Doctoral – Very High Research Activity
Four-year, Public, Doctoral – Very High Research Activity
Acceptance 50% 30% 78%

7
Demographicsa Asian – 4% Black – 13% Latino/a – 60% White – 13% Other – 7%
Asian – 27% Black – 4% Latino/a – 12% White – 39% Other – 18%
Asian – 7% Black – 1% Latino/a – 9% White – 61% Other – 22%
a’Other’ category includes designations of International, Pacific Islander, 2+ ethnicities, and/or other designations inconsistently reported across institutions.
At the Southeastern and Northwestern institutions, data were collected from multiple course sections across multiple years, with each taught by the same instructor or team of instructors (Table 2). At the Northwestern institution, a lead instructor was responsible for the development of the materials and structure employed in flipping the course, this instructor co-taught with the other instructors involved each year. A prior observational study with these courses did not reveal any substantial differences in the structure of the in-class settings across sections.68 All data collected within this study was approved by the Institutional Review Board (IRB) at Portland State University and appropriate consent was acquired from students as required by the IRB. Table 2. Course details. Southeastern Western Northwestern
Course Type General I General II General I
Enrollment 793 281 974
Sections 4a 1 6a
Instructors 1 1 3b
Schedule 75 min, 3 times per week, morning
80 min, 2 times per week, evening
80 min, 2 times per week, morning
aData collection spanned multiple years. bOne instructor was the primary developer of the flipped learning materials used in each course and co-taught the sections with the other instructors each year. Instruments Chemistry Self-Efficacy (CSE). This measure was developed to be specific to students’ understanding and comfort level with different chemistry concepts.36 The measure includes 6 items that address how well students understand different areas of chemistry (e.g., properties of elements, interpreting chemical equations, explaining chemical laws and theories). The items were measured on a five-point rating scale anchored by very poorly, poorly, average, well, very well. Academic Self-Efficacy (ASE). Out of the 15 subscales from the Motivated Strategies for Learning Questionnaire (MSLQ),69 we utilized the Self-Efficacy for Learning and Performance subscale, which includes 8 items related to students’ expectancies related to their learning and understanding. For this study, the subscale was adapted to measure a more general aspect of academic self-efficacy by changing the phrasing from “in this class” to “in my courses” as the referent. In addition, the scale was changed from a seven-point scale (not at all true of me to very

8
true of me) to a five-point Likert scale (strongly disagree to strongly agree) to align with the other measures used in the study. Learning and Study Strategies Inventory (LASSI) Subscales. LASSI is an 80-item measure with 10 subscales to assess success of course or program changes regarding academic skill, will, and self-regulation.70 For purposes of this study, we used two of the self-regulation strategy scales to assess students’ concentration (CON) and time management (TMT). Each subscale included 8 items on a five-point Likert scale (strongly disagree to strongly agree). The CON subscale centers on monitoring distractions, being able to focus one’s attention, and refocusing attention after losing it during studying and in class. Whereas, the TMT subscale assesses how well students organize their schedules, procrastination, and cramming behaviors. Data Collection In each course, two surveys were deployed. The first took place within the first two weeks of a term (pre) and the second during the last few weeks (post), neither of which overlapped with an exam. At both time points, the survey contained the same items from the four noted instruments and was open for one week. Due to the use of two different response scales, all Likert-scale instruments were presented first.71 Following these items and on a stand-alone page, students were presented with a note indicating a change in the response options before being presented the last set of items on the subsequent page. Demographic information was collected at the end of a survey, following all instrument items. The instructor of each course was provided a brief script to make an initial in-class announcement regarding the survey. A note similar to the script was posted on the classroom management platform of each course. Students who were interested in participating clicked on a link to the Qualtrics survey that was part of the announcement note. Some instructors offered a nominal amount of extra-credit points for accessing the survey. Data Analysis For each pre and post survey, data were examined for exclusionary criteria. Cases were removed for records that started a session, but did not fill out any information. Duplicate cases were also removed that had less information, or were second attempts if both cases were complete. All analyses were completed using the lavaan package (version 0.6-5) in R (version 3.6.2) with a means and variance adjusted weighted least squares (WLSMV) estimator to account for the ordinal scale of the items. Descriptive statistics for the aggregated data as well as by institution are included in Tables S7 and S8 in the Supporting Information. Listwise deletion was used for incomplete responses for each scale, thus the sample size for each scale may vary slightly. A focus of the analyses was to consider differences in the measures of interest based upon gender and underrepresented minority (URM) status. For these analyses, male was used as the reference category for the by gender comparisons, and non-URM (which consisted of individuals who identified as either non-Latino/a White or Asian) was used as the reference category for the by URM comparisons. All demographics were self-reported by the students who responded to the survey. Validity and Reliability Structural validity of the individual scales was investigated using Confirmatory Factor Analysis (CFA). Reliability was calculated using omega. Scalar invariance was established for

9
the four measures for longitudinal invariance, invariance between institutions, and invariance between gender and URM status. Details about the procedures and methods used for these analyses are included in the Supporting Information (Tables S1-S6, S9-S12). Structured Means Modeling Establishing scalar invariance provides support for the use of latent factor means when comparing groups.65 To do so, structured means modeling (SMM) was used. SMM includes the mean structure into the measurement model such that a relative difference between the latent means can be determined.71 Two types of analyses were completed using SMM: 1) the change in pre to post latent means for each factor and 2) the difference between post latent factor means while controlling for pre factors. These analyses were completed for institutional comparisons, as well as demographic comparisons (i.e., by gender and URM status).
The difference in latent means from the pre assessment to the post assessment of each factor for each institution was calculated. As SMM produces a relative mean difference, the pre factor mean for each comparison was set to zero, which allowed the value obtained for the post factor to represent the difference between pre and post factor means, or the latent mean difference, for that institution. This analysis was completed for all four measures and all institutions separately. The matched data from the Western institution included incomplete use of the entire response scale for certain items, however, for pre-post longitudinal models, the thresholds for these missing response categories could easily be removed for the appropriate factor in lavaan. Thus, the results for the pre to post comparisons account for those missing response categories where appropriate. The pre to post latent mean differences were also completed with the aggregated data set to compare differences based on gender and URM status. In these analyses, the male and non-URM groups were set as the reference, with female and URM groups as the comparison group, respectively.
To compare post latent means between institutions for the CSE and ASE factors, each institution’s latent mean on the respective self-efficacy pre assessment and the pre assessments of TMT and CON were controlled for. This was completed by incorporating these pre factors as covariates into the model of the post factor.72 Since the factors are theoretically related,73 the pre factors were correlated (Figure 1). All pairwise comparisons were made between the three institutions. Since this analysis relies on mean differences, all latent means were in comparison to a reference institution. Thus, the results from this analysis represent the difference in the latent means between the institutions and not absolute scale values. In addition, the post latent mean comparisons control for pre latent means included in the model. This analysis also used the matched data sets, in which some items for the CSE scale did not include complete use of the response scale for the Western institution. Since the thresholds between response categories cannot easily be removed from only one institution, a ‘dummy’ response pattern was added to the institution to account for the missing categories. A detailed description of this method is provided in the Supporting Information. Post latent mean comparisons were also conducted for the same demographic groups assessed in the pre-post comparisons.
10
Figure 1. The path model with mean structure for self-efficacy (ASE or CSE) post latent mean differences with pre self-efficacy (ASE or CSE), TMT, and CON controlled for. For clarity, items are not shown.
The effect size for all latent mean differences were calculated as the absolute difference in factor means divided by the square root of the pooled variance of the factors.71 Although this effect size calculation is similar to Cohen’s d, where effect sizes are small (~0.2), medium (~0.5), and large (~0.8),74 the magnitude guidelines for latent variables are generally accepted to differ slightly from those used for measured variables. Since latent means are free from measurement error, the magnitude of the effect size for latent mean differences should be larger than those for measured variables.71 Results Responses
The cleaned datasets by administration time and institution are detailed in Table 3. The response rates are based on the week-1 enrollments and therefore may not accurately reflect the percentage of participants from the actual enrollments at the time of administration. To determine if the students who ended up in the matched dataset differed significantly from those who did not, group means comparisons (i.e., t-tests) of the pre-scores for each scale at each institution were conducted. These analyses detected no significant differences between groups for any scale at any institution, indicating that the subset of students that made up each matched dataset did not represent a unique subset of the course population.
Table 3. Institution sample sizes and response rates by survey administration time.
Institution Southeastern Western Northwestern
Pre, n (%)a 554 (70) 212 (75) 797 (82)
Post, n (%) a 293 (37) 217 (77) 710 (73)
Matched, n (%)a 266 (34) 170 (60) 563 (58) aPercent response based on the week-1 enrollments noted in Table 2. Evidence of Validity and Reliability
The initial and final data-model fits, along with details of the modifications undertaken to produce the final models, are provided in the Supporting Information. For each scale, the final CFA model was fit individually for each institution to cross-validate the structure with respect to each institution. Overall, there was acceptable data-model fit and evidence of good reliability (omega values above 0.80) for each final model with respect to each institution (Table S6).
Post Self-Efficacy
Pre Self-Efficacy
Pre TMT
Pre CON 1

11
To support the use of latent means (via SMM) for comparing measurement results by
group, scalar invariance was evaluated. First, as each measure was administered at two time points (i.e., pre and post), and the change from pre to post was determined, the longitudinal scalar invariance was evaluated (Table S9). Next, as the results from each measure were compared across institutions, scalar invariance by institution was evaluated (Table S10). Finally, as the results from each measure were compared by gender and by URM-status, scalar invariance by gender and by URM-status were also evaluated (Tables S11 and S12 respectively). As in evaluating the CFA data-model fits, the scalar models under all by group comparisons showed acceptable data-model fit based on the findings and recommendations of McNeish and colleagues.75 Therefore, we believe that the scalar invariance for each of the by group comparisons is supported and structured means modeling could be used to compare latent means by each of the groupings. Pre to Post Differences Within Each Institution The pre to post latent mean differences for both self-efficacy factors at the three institutions are presented in Table 4. Pre to post latent mean differences for the TMT and CON factors for each institution are included Table S13 in the Supporting Information. Each analysis was completed separately such that only one scale and one institution was modeled at a time, with the latent mean of the pre factor as the reference. This allowed for the difference in the pre to post latent factor means for each scale to be determined at the institution level. For reference purposes, the observed average pre score for each institution is also included in Table 4, however, as the latent mean differences represent a relative difference, these values cannot be used to determine the observed average post scale scores. For example, as shown in Table 4, the Southeastern institution had an observed pre score of 2.88 on the CSE scale and a latent mean difference of 1.49, which was a large effect (1.17). However, this data does not imply that the observed post score for this institution was 4.37 (i.e., 2.88 + 1.49). Table 4. Pre to post latent mean differences for each institution. Bolded values indicate the difference was
statistically significant (p < 0.05).
Scale Institution Responses, n Observed
Pre Scorea Pre to Post Latent Mean
Difference (Effect Size)
Chemistry
Self-efficacy (CSE)
Southeastern 265 2.88 1.49 (1.17)
Western 168 3.53 0.14 (0.14)
Northwestern 551 3.34 0.31 (0.28)
Academic
Self-efficacy (ASE)
Southeastern 263 4.18 -0.23 (0.19)
Western 169 3.75 -0.32 (0.26)
Northwestern 554 3.77 -0.71 (0.62) aObserved pre scale scores were calculated as an unweighted average of the items included in the final version of each scale.
Overall, the difference in pre to post latent means for the CSE factor showed a positive change for all institutions (Table 4). These differences were significant for the Southeastern and

12
Northwestern institutions, with a large and small effect size, respectively. Although the Western institution also saw a small positive change, it was not significant. These results were in contrast to students’ ASE scores overtime, which decreased significantly at all three institutions, although this change was only a small effect size at the Southeastern and Western institutions. Pre to post differences for TMT and CON were also examined and nonsignificant changes for most institutions were found (see Table S13 in Supporting Information). The exceptions to this were the Western institution, which showed a significant decrease in TMT from pre to post, and the Northwestern institution with an increase in CON. However, these differences only represented small effects. Post Differences Between Institutions
The model used for pairwise comparisons of the post latent means of ASE and CSE between institutions included the respective pre factor (i.e., ASE or CSE), TMT, and CON as covariates, such that they were controlled for when comparing the post factors (see Figure 1). As SMM only allows for relative differences to be determined, one of the institutions was used as the reference for each pairwise comparison and the latent mean differences represent the difference between the two institutions. For example, as shown in Figure 2, when compared to the Southeastern institution, the pre CSE latent mean for the Western institution was 0.92 higher and this difference was found to be a medium to large effect size (0.82). When pre CSE, TMT, and CON factors were taken into account as covariates, the post CSE latent mean difference for the Western institution was 1.01 lower when compared to the Southeastern institution, with a medium to large effect size (0.89). Latent mean differences for all pairwise comparisons of post CSE and ASE between institutions are presented in Figures 2 and 3, respectively.
Figure 2. Pairwise post chemistry self-efficacy (CSE) latent mean differences between institutions with pre CSE, TMT, and CON factors as covariates. Each comparison is between two institutions while accounting for the pre latent means. The listed reference institution was used as the reference group for the designated pairwise analysis. Bolded values indicate the difference was statistically significant (p < 0.05). aThis data set included one dummy response pattern to account for missing response categories. See Supporting Information for details.
When comparing post CSE latent means (Figure 2) between the Southeastern and the Western and Northwestern institutions, the Southeastern institution was found to have a higher post CSE latent mean than both of the other institutions, each with a large effect size. These differences accounted for the higher pre CSE latent means of the Western and Northwestern institutions when compared to the Southeastern institution. Although a pre CSE latent mean
Latent Means Comparisons and Effect Sizes
Pre differences controlled
for
pre CSE
pre TMT
pre CON
post CSE
Southeastern(n = 259)
Western(n = 152a)
0.92 (0.82)
0.00 (ref)
-0.13 (0.12)
-0.38 (0.48)
-1.01 (0.89)
0.00 (ref)
0.00 (ref)
0.00 (ref)
Pre differences controlled
for
pre CSE
pre TMT
pre CON
post CSE
Southeastern(n = 259)
Northwestern(n = 536)
0.65 (0.58)
0.00 (ref)
-0.11 (0.11)
-0.27 (0.36)
-1.41 (1.02)
0.00 (ref)
0.00 (ref)
0.00 (ref)
Pre differences controlled
for
pre CSE
pre TMT
pre CON
post CSE
Western(n = 152a)
-0.34 (0.25)
0.00 (ref)
0.02 (0.02)
0.12 (0.16)
-0.04 (0.05)
0.00 (ref)
0.00 (ref)
0.00 (ref)
Northwestern(n = 536)

13
difference was also found between the Western and Northwestern institutions, the post CSE latent mean difference was small and not significant.
Figure 3. Pairwise post academic self-efficacy (ASE) latent mean differences between institutions with pre ASE, TMT, and CON factors as covariates. Each comparison is between two institutions while accounting for the pre latent means. The listed reference institution was used as the reference group for the designated pairwise analysis. Bolded values indicate the difference was statistically significant (p < 0.05). Post ASE latent mean differences (Figure 3) indicated that students at the Southeastern institution had the highest post ASE, with students at the Northwestern institution having the lowest post ASE. Pre ASE at the Southeastern institution was also higher than the other two institutions, with no difference between the pre ASE latent means of the Western and Northwestern institutions. Discussion Pre to Post Differences Within Each Institution
The increases in CSE latent means from pre to post for all institutions suggest that students perceived their chemistry ability to be higher at the end of the term than at the beginning. As the items used for the CSE scale are based on specific tasks students are expected to accomplish in general chemistry (i.e., “How well can you interpret chemical equations?”), it makes sense that students would generally have a higher CSE at the end of the term. Increases in students’ chemistry self-efficacy throughout the term has also been found in previous studies of non-flipped general chemistry courses.36-39 Although positive changes in CSE were seen, ASE latent mean differences were found to be significantly lower from pre to post for all institutions. The effect size of this difference for the Southeastern and Western institutions represented a small effect, while the difference for the Northwestern institution represented a medium effect. A decrease in ASE over the term has been reported in other studies (e.g., Young et al.76). In contrast to the CSE items, the items included on the ASE were targeted toward general statements about the courses a student was taking, not just their chemistry course (i.e., “I expect to do well in my courses.”). Self-efficacy scales that are more specific (i.e., task-based statements) have been shown to be a better predictor of academic performance than more general self-efficacy scales.40 Thus, the difference in specificity between the CSE and ASE items could have contributed to how chemistry and academic self-efficacy trended in different directions throughout the term.
Latent Means Comparisons and Effect Sizes
Pre differences controlled
for
pre ASE
pre TMT
pre CON
post ASE
Southeastern(n = 257)
Western(n = 152)
-0.65 (0.64)
0.00 (ref)
-0.13 (0.09)
-0.39 (0.47)
-0.49 (0.31)
0.00 (ref)
0.00 (ref)
0.00 (ref)
Pre differences controlled
for
pre ASE
pre TMT
pre CON
post ASE
Southeastern(n = 257)
Northwestern(n = 539)
-0.58 (0.54)
0.00 (ref)
-0.09 (0.12)
-0.27 (0.34)
-1.04 (1.82)
0.00 (ref)
0.00 (ref)
0.00 (ref)
Pre differences controlled
for
pre ASE
pre TMT
pre CON
post ASE
Western(n = 152)
0.08 (0.07)
0.00 (ref)
0.04 (0.04)
0.11 (0.16)
-0.78 (0.56)
0.00 (ref)
0.00 (ref)
0.00 (ref)
Northwestern(n = 539)

14
Post Differences Between Institutions Differences in post CSE latent means were seen between the Southeastern institution and
both the Western and Northwestern institutions. The pre latent mean comparisons between the Southeastern institution and the other two institutions also showed significant differences, with the Southeastern institution having a lower latent mean for pre CSE and a higher latent mean for pre CON. Thus, although students at the Southeastern institution initially had lower CSE than students at both the Western and Northwestern institutions, Southeastern institution students had the highest reported CSE at the end of the term. The pairwise comparison between the Western and Northwestern institutions also showed a significant difference between pre CSE latent means, with the Western institution having a higher pre CSE; however, the post CSE latent means showed no significant difference between the two institutions. Although there were some initial differences between the pre CSE and CON latent means between all the institutions, the pre factors were included as covariates in the model and the latent mean differences for post CSE account for any differences the students may have had in their incoming time management, concentration, or chemistry self-efficacy. However, even though these pre factors were accounted for in the model, other possible confounds could have influenced the results, such as differences in the class structure and differences in demographics.
As this study was completed across multiple institutions, there may have been course
differences that contributed to the measured post CSE differences between institutions. In flipped courses there are two main aspects that are usually incorporated: information is provided to students through pre-class materials (PCMs), which is then reinforced through active learning during the face-to-face (F2F) time. The differences and similarities of these two aspects for the courses at these institutions were detailed in a prior study,68 here we address the most salient features. The PCMs for all institutions were in the form of online videos, however, there were slight details that differed, such as instructor-curated versus instructor-created, video length, etc. Results indicated that a higher percentage of students at the Western and Northwestern institutions reported watching all of the videos compared to students at the Southeastern institution, where most students reported watching only some of the videos. The Northwestern institution also had a significantly higher percentage of students report that they utilized the PCMs before the F2F time compared to the other institutions. In addition, the structure of the F2F environments differed between institutions, with the Southeastern institution including more student and instructor questioning (~80% of time-blocks) than the Western and Northwestern institutions (~20% of time-blocks each), which incorporated more groupwork into their F2F time (Figure S1 in the Supporting Information). While these course-level differences in PCMs and F2F time cannot be said to be the cause, it is possible that these variations in how the classes were structured influenced students’ CSE. Although one study30 has found that including POGIL discussion sections in general and organic chemistry did not have a significant effect on students’ CSE over traditional discussion sections, different course structures have been found to influence students’ performance, as well as the time they spent preparing for class, with moderate-structured courses having a larger impact on these variables.77 Others have found,78 in a more controlled study with case-based learning, that a gradual shift to more autonomous active learning environments over a semester benefit students’ motivation and learning compared to an abrupt shift. Also, group work as a constructivist practice needs scaffolding79 as these practices can support or undermine student motivation.73 Therefore, the potential impact of the flipped course structure cannot be ruled out when considering the differences in post-term CSE values.

15
Demographic differences could have also contributed to the differences seen in post CSE.
However, due to the small group-level sample sizes at some of the institutions (Table S14), differences based on minority status and gender could only be evaluated using the aggregated data set. In doing so, it was found that both male and female students increased in CSE from pre to post (Table S15) and that there was no significant difference in post CSE factors based on gender (Table S16). However, results indicated that although both non-URM and URM groups increase in CSE from pre to post (Table S17), URM students reported significantly higher post CSE than non-URM students (Table S16). While other studies have also found differences in CSE by demographic group,37 it should be noted that the differences seen in this study could be influenced by the demographic profiles of the institutions themselves. The Southeastern institution had a larger percentage of URM students than the Western and Northwestern institutions, which had equal percentages of URM and non-URM and a larger percentage of non-URM students, respectively. Therefore, as the Southeastern institution was found to have a higher post CSE latent mean than the Western and Northwestern institutions and the URM group was also found to have a higher post CSE latent mean than the non-URM group, these results could be conflated. Since the sample sizes for the different groups were not large enough to complete SMM analyses on institutional subsets (Table S14), it is unknown whether the differences were due to course-level differences or the different demographic profiles of the institutions.
Latent mean differences of post ASE between institutions were also significant, with
small to medium effect sizes. The Southeastern institution was found to have the highest post ASE latent mean, with the Northwestern institution having the lowest. However, as mentioned earlier, the items used to assess ASE were more general than the CSE items and related to all the classes the students were taking. Thus, it is unknown whether the differences between the chemistry courses, which may have only been one of many courses a student was taking, influenced these results. When the aggregated data set was analyzed for demographic differences, both non-URM and URM students were found to decrease on ASE from pre to post (Table S17), with URM students having a higher post ASE latent mean than non-URM students (Table S18). Thus, it is unknown whether the differences in post ASE could be a result of course differences, institutional differences, or demographic differences across the institutions. Conclusions, Limitations and Implications This project investigated the self-efficacy of students enrolled in general chemistry courses structured within flipped learning environments. The conclusions from this multi-institutional investigation are framed by our research questions. What evidence supports the validity and reliability of the data generated from the coordinated assessments at our sites?
Measures of self-efficacy and self-regulation were administered and their data evaluated for structural validity and single-administration reliability via Confirmatory Factor Analysis (CFA). The final CFA models included a reduced set of items for each measure, which were found to have consistently strong factor loadings across administration times. All models had acceptable data-model fit and reliability. As Structured Means Modeling (SMM) was used to compare the latent means of each measure pre-post and by institution, gender, and URM status,

16
the scalar invariance of each was evaluated. Measurement invariance analyses help to support that measures are equally made across groups prior to comparing their results.65 As the data from each measure were treated as ordinal, evaluating scalar invariance required supporting the data-model fit with both the factor loadings and response thresholds fixed across groups. Each scalar invariance model (i.e., longitudinal, by institution, by gender, and by URM status) showed acceptable data-model fit. How do students’ self-efficacy and self-regulation change within each flipped learning environment? and How do changes in each construct compare across sites?
With regard to self-regulation (i.e., the TMT and CON measures), when differences from pre to post were detected, they were small effects. However, when examining differences across institutions for the pre measures, several differences were found between institutions (Figures 2 and 3). Thus, the pre-TMT and pre-CON factors were added as controls for the analyses of CSE and ASE. The evaluation of pre to post SMMs for CSE and ASE produced disparate results. Students at each institution reported significant decreases in ASE and increases in CSE at the end of the term. This may be due to the task-based focus of the CSE items compared to the more general academic focus of the ASE items. As the CSE scores showed an increase over the term for all institutions, and since more specific self-efficacy measures have been found to be a better predictor of performance than general self-efficacy measures,40 the decrease in ASE scores may not be representative of a change in students’ self-efficacy as a result of the structure of their chemistry course. Therefore, as the focus of this study was to explore differences between different flipped environments, the CSE measure was examined in more depth.
While two out of the three institutions showed significant CSE increases, students at the
Western institution showed a small, nonsignificant, increase in CSE. This nonsignificant change could be due to the term of the course that was surveyed. At the Southeastern and Northwestern institutions, the surveyed courses were the first-term of general chemistry, whereas, at the Western institution it was the second-term (Table 2). It is possible that the students in the second-term course have already had experiences informing their CSE by the beginning of this course and thus, their CSE did not change significantly by the end. Between the two institutions that consisted of the first-term general chemistry courses, students at the Southeastern institution showed the largest increase in CSE and had the highest post CSE. To better explore the difference between these courses, the in-class structures were examined. In a prior study,68 the instructional practices at these institutions were found to vary based on the structure of the F2F active learning techniques employed and students’ reported use of the PCMs. The F2F structure of the Southeastern institution course primarily included instructor-student interactions in the form of whole-class questioning, whereas the Northwestern institution course relied heavily on peer-to-peer interactions during groupwork (see Figure S1 in Supporting Information). These differences in F2F structure could have been a contributing factor to the differences seen in post CSE. Differences in the amount of structure included in a task has been found to contribute to differences in students’ self-efficacy on those tasks in secondary classrooms.80 In this prior study, both a “well-structured” task and an “ill-structured” task were provided to the students with the difference between the tasks described as varying “in the structural cues they provided for students”. When students’ self-efficacy during those tasks was measured, they found that students reported significantly higher self-efficacy when they were working on the well-structured task compared to the ill-structured task. In our study, it could be argued that the course

17
at the Southeastern institution, consisting of primarily instructor-guided questioning during F2F sessions, may have provided more “structured” tasks to students than the predominant use of peer-to-peer small group interactions found in course at the Northwestern institution. Given this result, future studies would be needed to further test the impacts of these types of structural differences in a learning environment.
When exploring the benefits of flipped learning environments on individual differences,
both males and females reported increases in CSE over the semester and there were no by gender differences detected at the end of the term. In regard to minority status, the results were a bit more complicated. URM differences were detected, although a potential confound by institution could be at play, since the majority of students with URM status were at the Southeastern institution, thus conflating a potential difference. However, previous studies have found differences in students’ CSE based on demographic profiles. For example, Villafane et al.37 found that even though most demographic groups showed an overall increase of CSE over the term, Black and Hispanic males reported a decrease in CSE. Thus, further research into differences and changes of CSE based on demographic profiles may be beneficial, if there is a large enough sample size to explore these differences at the institution level.
Overall, while students in each of the courses reported higher CSE at the end of the term,
the study was not designed to evaluate which structural features may have led to the differential increases detected. Bandura postulated that one’s self-efficacy is derived from four experiential sources of information: mastery experiences, vicarious learning, social persuasion, and psychological state.19 We reflect on these sources to postulate on why the experiences of the students in the predominantly whole-class questioning F2F environment might have led to higher self-efficacy than those in the peer-to-peer small groupwork environment.
Mastery experiences require that individuals experience success, or failure, in a task.19 Therefore, whole-class questioning may provide more individual opportunities to experience success (or failure), compared to small groupwork. Students may find more value in the frequent instructor feedback that occurs with whole-class questioning compared to less feedback during longer groupwork activities.81 Vicarious experiences occur through seeing a peer perform a task (i.e., modeling success) or in comparing one’s own performance to that of others (i.e., comparative success).19 While small groupwork, in theory, should provide consistent opportunities for both, this may be highly dependent on the makeup of a group, its discourse, and how it is facilitated by learning assistants or the instructor.82 It cannot be assumed that groupwork is equally supportive for all members.83 While whole-class questioning may not provide many opportunities to observe peer success (i.e., modeling success), each individual should at least have the chance to compile their own answers and compare them to those discussed (i.e., comparative success). Group dynamics may also encourage or discourage the social persuasion experiences (i.e., messages about ability)19 of students. Individuals in groups with established and well facilitated group-norms may receive more supportive feedback than those in groups dominated by one or more individuals.82, 84 In contrast, students may experience supportive social persuasion19 when the answers to instructor-initiated (i.e., whole-class or clicker) questions are discussed, as these types of questions are typically followed up with clarifying information to support learners understanding.68 Lastly, negative feelings (e.g., stress or anxiety) in a learning situation may be interpreted as an indicator that one is not capable.85

18
Therefore, the feelings associated with groupwork86-88 or group relationships89 may not be supportive of the self-efficacy development of all students. In concluding, Murphy and colleagues90 posited in their review that the success of discussions with regard to learning and motivation is less about small groups or instructor-led, but more about the level of structure provided during the discussion sessions. This study, and many more in the extant literature within discipline-based education research, document the quantitative impacts of a learning environment on students’ self-efficacy. However, few have actually studied what types of self-efficacy opportunities (SEOs) actually exist within a given learning environment. One study in physics did investigate the SEOs provided through the interactions among three learners performing a task from the Modeling Instruction91 curriculum.85 This observation-based study was able to identify a variety of SEOs while performing the task. Given the broad ways that active learning can be defined,1 or that flipped courses can be structured,68 these types of in-depth observational designs might be needed if researchers or practitioners wish to understand the nature of detected differences in self-efficacy across learning environments. Therefore, it is recommended that further research on flipped learning environments continue to account for the structural components connected to F2F active learning to examine each environment’s specific benefits to students’ motivation and learning, while controlling for different elements. Limitations This nonexperimental research has several limitations that should be considered when interpreting the outcomes presented. The outcomes are based on voluntary and self-reported student data and therefore only reflect the results of those students who agreed to participate in the study. As such, the data may not reflect the outcomes of other students, especially for cases where lower response rates were obtained. While the pre-score comparisons did not detect differences between students who appeared in the matched dataset and those who did not, other unmeasured factors could not be ruled out given the design of the study. Within any self-report study, students’ responses could be influenced by social desirability; that is, students might respond on the basis of what would make them “look best”. However, as no data from this study was collected within the authors’ institutions and none of the course instructors were involved in the data collection process, this influence was potentially diminished as the research team had no connections to the students. A potential confounding aspect with regard to the consistency (or priming) of students’ responses in this study may come from item- and/or scale-order effects, as neither were randomized. To reduce any potential order-effects, future researchers are encouraged to randomize their administrations at both levels. Finally, as changes in self-efficacy were measured from pre to post, students’ self-reported pre-term self-efficacy could be over-estimated based on their perceived incoming ability, which may be more targeted by the end of a term. However, these potential discrepancies would not impact the post self-efficacy comparisons conducted within this project, as these were not ‘gain scores’ but comparisons of students reported self-efficacy at the end of each course at each institution.
While this study employed a coordinated set of measures, and validated the data produced within each environment, these measures may not be supported for use in other course types or institutions. Therefore, those interested in conducting similar analyses are encouraged to support the validity of their data as appropriate.62, 64 This study utilized latent means to make

19
comparisons among different groups. While the scalar invariance models of each measure were supported, SMM comparisons by gender and by URM status could only be conducted using data from all institutions combined. This was due to the low number of students within one or more groups at certain institutions. For example, at the Southeastern institution, only 26 students (10% of the pre-post matched data) were categorized as non-URM (i.e., non-Latino/a White or Asian), with 211 students (80%) reporting as Latino/a. Therefore, not only was there an insufficient number of non-URM students to conduct an intra-institution comparison, there was also an insufficient number of Latino/a students in the other datasets to support inter-institution comparisons at this specific level. Future studies interested in exploring these measured outcomes by demographic groups within a single student population are encouraged to not only seek to collect data in large-enrollment course environments, but also those with more balanced demographics, such that large enough group-level populations are available. Another strategy would be to oversample students of minority status in order to conduct analyses based on race/ethnicity stratifications.
Finally, while evidence of the structural validity, single-administration reliability, and
consequential validity (via scalar measurement invariance) of the data from this study were provided, some items from each measure were flagged, evaluated, and subsequently dropped to produce the final models. These decisions were based on analysis of the apriori initial CFA model data, response process validity interviews were not conducted. This type of qualitative data could have provided insights to the functioning of the flagged items. However, this was beyond the scope of this multi-year and multi-institutional study. In future uses of these measures, qualitative data should be gathered to evaluate if the dropped items can be improved upon and therefore retained. Implications
In contrast to an increase in CSE over the term at all institutions, students’ ASE was found to decrease. The main difference between these two measures was the specificity of the items. Whereas the CSE measure included specific task-based items, the ASE items were more general and referred to all of a students’ courses that they were taking. This brings into light the importance of the specificity of the items when assessing self-efficacy. Other studies which measured students’ CSE with task-specific items also found increases in CSE over the term,36-39 whereas a study that used a measure with more general items found that students’ self-efficacy decreased by the end of the term.28 Therefore, when self-efficacy is assessed, or prior studies are interpreted, it is important to keep in mind the specificity of the items to ensure that they align with the goals of the study. As more task-specific measures have been found to be better predictors of performance40 and future success,41 it may be more beneficial to use a task-specific measure when assessing self-efficacy at the course-level.
It is important that the validity and reliability of the data collected with a measure in a
new environment are assessed, even if the measure has been previously shown to produce good data. In this study, evidence of both structural validity and single administration reliability were gathered for the data collected with each of the measures and at each of the institutions. Even if evidence of structural validity is found, group comparisons are not recommended without additional evidence of consequential validity.65 Evidence of consequential validity is gathered through the evaluation of different levels of measurement invariance. If latent means are to be

20
compared, scalar invariance of the different groups should be established. However, if observed scores are to be compared across groups, then strict invariance is recommended. Without evidence of scalar or strict invariance, comparisons between the groups would not be supported.65 The requirement of measurement invariance necessitates a reasonably large sample size with relatively equal populations in the different groups. For example, although it may have been beneficial in this study to compare latent means based on URM status within the different institutions, this analysis was limited by the sample sizes of these different populations within each institution (e.g., the Southeastern institution only had 26 non-URM students) and so were only assessed at the aggregate level where scalar measurement invariance could be established. Therefore, future studies that wish to focus on group differences within a factor analysis framework are encouraged to consider the sample sizes of the individual groups. In this study, students’ CSE was detected to increase over the term for all three institutions, suggesting that the students were more confident in their abilities by the end of the term. It should be noted that studies of other chemistry classrooms36, 37 and active learning environments39 have also found increases in CSE over the term. Thus, the inclusion of a flipped classroom structure cannot be said to be the cause of these increases and did not seem to negatively affect students’ CSE. Within a flipped learning environment, students are provided with the opportunity to initially engage in the course material before coming to class, leaving the F2F time for exploration of the material in a variety of manners. In this study, each of the three institutions structured their F2F time differently. The Southeastern institution primarily focused on student-instructor interactions through whole-class questioning, while the Northwestern institution included more peer-to-peer groupwork. Since significant differences were found in students’ post CSE between these two institutions, instructors who flip their course are encouraged to consider the active learning techniques that will be incorporated during the F2F time. Considering that the structure of the F2F time may lead to different student outcomes. Some demographic groups have been shown to increase more in their performance outcomes than other groups when additional structure is added to the course (e.g., Eddy and Hogan77).
ASSOCIATED CONTENT
Supporting Information The Supporting Information is available on the ACS Publications website at DOI:
10.1021/acs.jchemed.XXXXXXX. [ACS will fill this in.] CFA data for scale modifications, protocol for unused response categories, descriptive statistics, supplemental measurement invariance and structured means modeling tables, course observation (DOCX)
AUTHOR INFORMATION Corresponding Author *E-mail: [email protected] ORCID Jack Barbera: 0000-0003-3887-3301 Notes The authors declare no competing financial interest.
21
ACKNOWLEDGMENTS This material is based upon work supported by the National Science Foundation under Grant
Nos. (DUE 1611220 and 1611519). Any opinions, findings, and conclusions or recommendations expressed in this material are those of the authors and do not necessarily reflect the views of the National Science Foundation. This project would not have been possible without the participation of each instructor and the students in their flipped courses, we are therefore very thankful for their assistance in this study.

22
References 1. Freeman, S.; Eddy, S. L.; McDonough, M.; Smith, M. K.; Okoroafor, N.; Jordt, H.; Wenderoth, M. P. Active Learning Increases Student Performance in Science, Engineering, and Mathematics. Proc. Natl. Acad. Sci. 2014, 111 (23), 8410-8415. 2. National Research Council. Inquiry and the National Science Education Standards: A Guide for Teaching and Learning. National Academy Press: Washington, DC, 2000. 3. National Research Council. How People Learn: Bridging Research and Practice. National Academy Press: Washington, DC, 1999. 4. Michael, J.; Modell, H. I. Active Learning in Secondary and College Science Classrooms: A Working Model for Helping the Learner to Learn. Routledge: 2003. 5. King, A. From Sage on the Stage to Guide on the Side. Coll. Teach. 1993, 41 (1), 30-35. 6. Merriam, S. B.; Caffarella, R. S.; Baumgartner, L. M. Learning in Adulthood: A Comprehensive Guide. Jossey-Bass: 2007. 7. Barkley, E. F.; Major, C. H. Student Engagement Techniques: A Handbook for College Faculty. John Wiley & Sons: 2020. 8. Casselman, M. D.; Atit, K.; Henbest, G.; Guregyan, C.; Mortezaei, K.; Eichler, J. F. Dissecting the Flipped Classroom: Using a Randomized Controlled Trial Experiment to Determine When Student Learning Occurs. J. Chem. Educ. 2020, 97 (1), 27-35. 9. Ealy, J. B. Development and Implementation of a First-Semester Hybrid Organic Chemistry Course: Yielding Advantages for Educators and Students. J. Chem. Educ. 2013, 90 (3), 303-307. 10. Amaral, K. E.; Shank, J. D.; Shibley, I. A.; Shibley, L. R. Web-Enhanced General Chemistry Increases Student Completion Rates, Success, and Satisfaction. J. Chem. Educ. 2013, 90 (3), 296-302. 11. Smith, J. D. Student Attitudes Toward Flipping the General Chemistry Classroom. Acron. Initial. Abbr. Dict. 2013, 14, 607-614. 12. Mooring, S. R.; Mitchell, C. E.; Burrows, N. L. Evaluation of a Flipped, Large-Enrollment Organic Chemistry Course on Student Attitude and Achievement. J. Chem. Educ. 2016, 93 (12), 1972-1983. 13. Canelas, D. A.; Hill, J. L.; Novicki, A. Cooperative Learning in Organic Chemistry Increases Student Assessment of Learning Gains in Key Transferable Skills. Chem. Educ. Res. Pract. 2017, 18 (3), 441-456. 14. Rau, M. A.; Kennedy, K.; Oxtoby, L.; Bollom, M.; Moore, J. W. Unpacking “Active Learning”: A Combination of Flipped Classroom and Collaboration Support Is More Effective but Collaboration Support Alone Is Not. J. Chem. Educ. 2017, 94 (10), 1406-1414. 15. Donnelly, J.; Hernández, F. E. Fusing a Reversed and Informal Learning Scheme and Space: Student Perceptions of Active Learning in Physical Chemistry. Chem. Educ. Res. Pract. 2018, 19 (2), 520-532. 16. Liu, Y.; Ferrell, B.; Barbera, J.; Lewis, J. E. Development and Evaluation of a Chemistry-Specific Version of the Academic Motivation Scale (AMS-Chemistry). Chem. Educ. Res. Pract. 2017, 18 (1), 191-213. 17. Deci, E. L.; Ryan, R. M. Self-Determination Theory. Sage Publications Ltd: Thousand Oaks, CA, 2012; pp 416-436. 18. Hibbard, L.; Sung, S.; Wells, B. Examining the Effectiveness of a Semi-Self-Paced Flipped Learning Format in a College General Chemistry Sequence. J. Chem. Educ. 2016, 93 (1), 24-30.

23
19. Bandura, A. Self-Efficacy: The Exercise of Control. Freeman: New York, 1997. 20. Bandura, A. Social Cognitive Theory: An Agentic Perspective. Annu. Rev. Psychol. 2001, 52 (1), 1-26. 21. Komperda, R.; Hosbein, K. N.; Barbera, J. Evaluation of the Influence of Wording Changes and Course Type on Motivation Instrument Functioning in Chemistry. Chem. Educ. Res. Pract. 2018, 19 (1), 184-198. 22. Komperda, R.; Hosbein, K. N.; Phillips, M. M.; Barbera, J. Investigation of Evidence for the Internal Structure of a Modified Science Motivation Questionnaire II (mSMQ II): a Failed Attempt to Improve Instrument Functioning across Course, Subject, and Wording Variants. Chem. Educ. Res. Pract. 2020. 23. Brophy, J. Motivating Students to Learn. Third ed.; Routledge: New York, 2010. 24. Robbins, S. B.; Lauver, K.; Le, H.; Davis, D.; Langley, R.; Carlstrom, A. Do Psychosocial and Study Skill Factors Predict College Outcomes? Psychol. Bull. 2004, 130 (2), 261-288. 25. Anderman, E. M.; Dawson, H. Learning and Motivation. In Handbook of Research on Learning and Instruction, Mayer, R. E.; Alexander, P. A., Eds. Routledge: New York, 2011; pp 219-241. 26. Richardson, M.; Abraham, C.; Bond, R. Psychological Correlates of University Students' Academic Performance. Psychol. Bull. 2012, 138 (2), 353-387. 27. Pajares, F.; Urdan, T. Self-Efficacy Beliefs of Adolescents. In Adolescence and Education, Information Age Publishing: 2006; Vol. 5. 28. DiBenedetto, M. K.; Bembenutty, H. Within the Pipeline: Self-Regulated Learning, Self-Efficacy, and Socialization among College Students in Science Courses. Learn. Individ. Differ. 2013, 23, 218-224. 29. Galyon, C. E.; Blondin, C. A.; Yaw, J. S.; Nalls, M. L.; Williams, R. L. The Relationship of Academic Self-Efficacy to Class Participation and Exam Performance. Soc. Psychol. Educ. 2012, 15 (2), 233-249. 30. Chase, A.; Pakhira, D.; Stains, M. Implementing Process-Oriented, Guided-Inquiry Learning for the First Time: Adaptations and Short-Term Impacts on Students’ Attitude and Performance. J. Chem. Educ. 2013, 90 (4), 409-416. 31. Stanich, C. A.; Pelch, M. A.; Theobald, E. J.; Freeman, S. A New Approach to Supplementary Instruction Narrows Achievement and Affect Gaps for Underrepresented Minorities, First-Generation Students, and Women. Chem. Educ. Res. Pract. 2018, 19 (3), 846-866. 32. Ramnarain, U.; Ramaila, S. The Relationship between Chemistry Self-Efficacy of South African First Year University Students and their Academic Performance. Chem. Educ. Res. Pract. 2018, 19 (1), 60-67. 33. Reardon, R. F.; Traverse, M. A.; Feakes, D. A.; Gibbs, K. A.; Rohde, R. E. Discovering the Determinants of Chemistry Course Perceptions in Undergraduate Students. J. Chem. Educ. 2010, 87 (6), 643-646. 34. Villafañe, S. M.; Xu, X.; Raker, J. R. Self-Efficacy and Academic Performance in First-Semester Organic Chemistry: Testing a Model of Reciprocal Causation. Chem. Educ. Res. Pract. 2016, 17 (4), 973-984. 35. Ferrell, B.; Phillips, M. M.; Barbera, J. Connecting Achievement Motivation to Performance in General Chemistry. Chem. Educ. Res. Pract. 2016, 17 (4), 1054-1066.
24
36. Ferrell, B.; Barbera, J. Analysis of Students' Self-Efficacy, Interest, and Effort Beliefs in General Chemistry. Chem. Educ. Res. Pract. 2015, 16 (2), 318-337. 37. Villafañe, S. M.; Garcia, C. A.; Lewis, J. E. Exploring Diverse Students' Trends in Chemistry Self-Efficacy throughout a Semester of College-Level Preparatory Chemistry. Chem. Educ. Res. Pract. 2014, 15 (2), 114-127. 38. Graham, K. J.; Bohn-Gettler, C. M.; Raigoza, A. F. Metacognitive Training in Chemistry Tutor Sessions Increases First Year Students’ Self-Efficacy. J. Chem. Educ. 2019, 96 (8), 1539-1547. 39. Vishnumolakala, V. R.; Southam, D. C.; Treagust, D. F.; Mocerino, M.; Qureshi, S. Students’ Attitudes, Self-Efficacy and Experiences in a Modified Process-Oriented Guided Inquiry Learning Undergraduate Chemistry Classroom. Chem. Educ. Res. Pract. 2017, 18 (2), 340-352. 40. Choi, N. Self‐Efficacy and Self‐Concept as Predictors of College Students' Academic Performance. Psychol. Sch. 2005, 42 (2), 197-205. 41. Bandura, A. Toward a Psychology of Human Agency. Perspect. Psychol. Sci. 2006, 1 (2), 164-180. 42. Lawson, A. E.; Banks, D. L.; Logvin, M. Self-Efficacy, Reasoning Ability, and Achievement in College Biology. J. Res. Sci. Teach. 2007, 44 (5), 706-724. 43. Fenollar, P.; Román, S.; Cuestas, P. J. University Students' Academic Performance: An Integrative Conceptual Framework and Empirical Analysis. Br. J. Educ. Psychol. 2007, 77 (4), 873-891. 44. Komarraju, M.; Nadler, D. Self-Efficacy and Academic Achievement: Why do Implicit Beliefs, Goals, and Effort Regulation Matter? Learn. Individ. Differ. 2013, 25, 67-72. 45. Tabak, F.; Nguyen, N.; Basuray, T.; Darrow, W. Exploring the Impact of Personality on Performance: How Time-on-Task Moderates the Mediation by Self-Efficacy. Personal. Individ. Differ. 2009, 47 (8), 823-828. 46. Dalgety, J.; Coll, R. K. Exploring First-Year Science Students' Chemistry Self-Efficacy. Int. J. Sci. Math. Educ. 2006, 4 (1), 97-116. 47. Sunny, C. E.; Taasoobshirazi, G.; Clark, L.; Marchand, G. Stereotype Threat and Gender Differences in Chemistry. Instr. Sci. 2016, 45 (2), 157-175. 48. Zeldin, A. L.; Pajares, F. Against the Odds: Self-Efficacy Beliefs of Women in Mathematical, Scientific, and Technological Careers. Am. Educ. Res. J. 2016, 37 (1), 215-246. 49. Boz, Y.; Yerdelen-Damar, S.; Aydemir, N.; Aydemir, M. Investigating the Relationships among Students’ Self-efficacy Beliefs, Their Perceptions of Classroom Learning Environment, Gender, and Chemistry Achievement through Structural Equation Modeling. Res. Sci. Technol. Educ. 2016, 34 (3), 307-324. 50. Zimmerman, B. J. Developing Self-Fulfilling Cycles of Academic Regulation: An Analysis of Exemplary Instructional Models. In Self-Regulated Learning: From Teaching to Self-Reflective Practice, Schunk, D. H.; Zimmerman, B. J., Eds. Guilford Press: New York, 1998; pp 1-19. 51. Zimmerman, B. J. Attaining Self-Regulation: A Social Cognitive Perspective. In Handbook of Self-Regulation, Boekaerts, M.; Pintrick, P. R.; Zeidner, M., Eds. Academic Press: San Diego, CA, 2000; pp 13-41. 52. Pintrich, P. R. A Conceptual Framework for Assessing Motivation and Self-Regulated Learning in College Students. Educ. Psychol. Rev. 2004, 16 (4), 385-407.
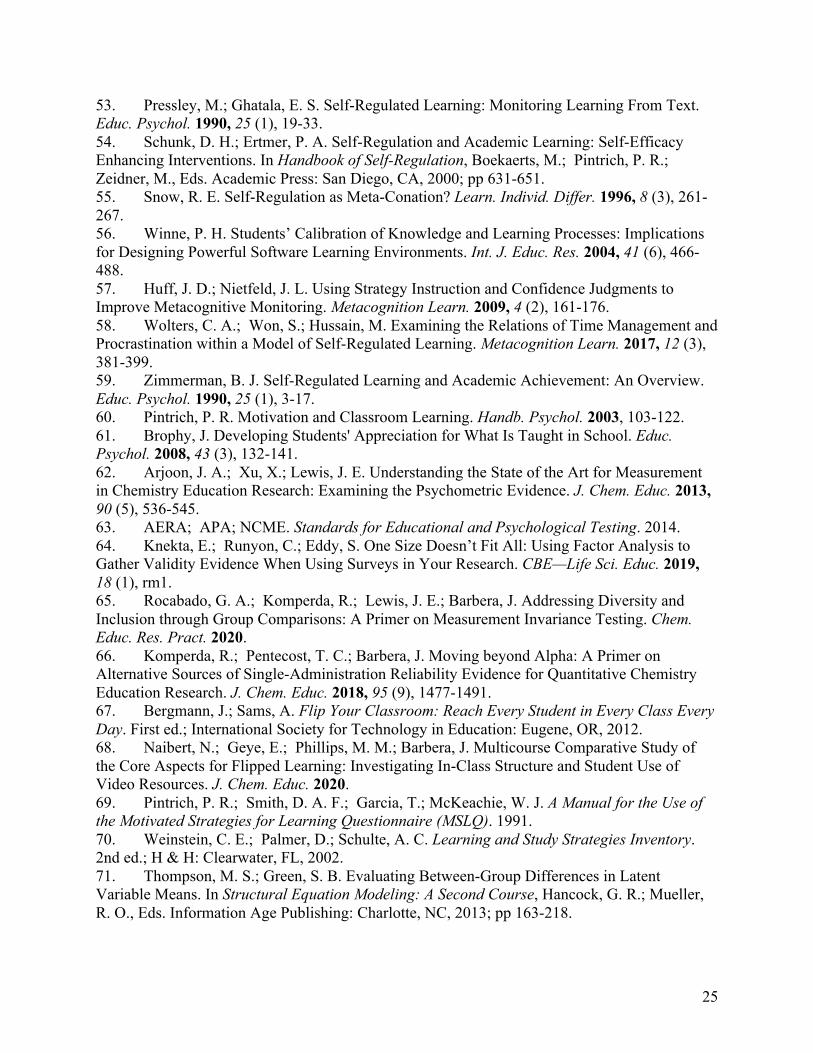
25
53. Pressley, M.; Ghatala, E. S. Self-Regulated Learning: Monitoring Learning From Text. Educ. Psychol. 1990, 25 (1), 19-33. 54. Schunk, D. H.; Ertmer, P. A. Self-Regulation and Academic Learning: Self-Efficacy Enhancing Interventions. In Handbook of Self-Regulation, Boekaerts, M.; Pintrich, P. R.; Zeidner, M., Eds. Academic Press: San Diego, CA, 2000; pp 631-651. 55. Snow, R. E. Self-Regulation as Meta-Conation? Learn. Individ. Differ. 1996, 8 (3), 261-267. 56. Winne, P. H. Students’ Calibration of Knowledge and Learning Processes: Implications for Designing Powerful Software Learning Environments. Int. J. Educ. Res. 2004, 41 (6), 466-488. 57. Huff, J. D.; Nietfeld, J. L. Using Strategy Instruction and Confidence Judgments to Improve Metacognitive Monitoring. Metacognition Learn. 2009, 4 (2), 161-176. 58. Wolters, C. A.; Won, S.; Hussain, M. Examining the Relations of Time Management and Procrastination within a Model of Self-Regulated Learning. Metacognition Learn. 2017, 12 (3), 381-399. 59. Zimmerman, B. J. Self-Regulated Learning and Academic Achievement: An Overview. Educ. Psychol. 1990, 25 (1), 3-17. 60. Pintrich, P. R. Motivation and Classroom Learning. Handb. Psychol. 2003, 103-122. 61. Brophy, J. Developing Students' Appreciation for What Is Taught in School. Educ. Psychol. 2008, 43 (3), 132-141. 62. Arjoon, J. A.; Xu, X.; Lewis, J. E. Understanding the State of the Art for Measurement in Chemistry Education Research: Examining the Psychometric Evidence. J. Chem. Educ. 2013, 90 (5), 536-545. 63. AERA; APA; NCME. Standards for Educational and Psychological Testing. 2014. 64. Knekta, E.; Runyon, C.; Eddy, S. One Size Doesn’t Fit All: Using Factor Analysis to Gather Validity Evidence When Using Surveys in Your Research. CBE—Life Sci. Educ. 2019, 18 (1), rm1. 65. Rocabado, G. A.; Komperda, R.; Lewis, J. E.; Barbera, J. Addressing Diversity and Inclusion through Group Comparisons: A Primer on Measurement Invariance Testing. Chem. Educ. Res. Pract. 2020. 66. Komperda, R.; Pentecost, T. C.; Barbera, J. Moving beyond Alpha: A Primer on Alternative Sources of Single-Administration Reliability Evidence for Quantitative Chemistry Education Research. J. Chem. Educ. 2018, 95 (9), 1477-1491. 67. Bergmann, J.; Sams, A. Flip Your Classroom: Reach Every Student in Every Class Every Day. First ed.; International Society for Technology in Education: Eugene, OR, 2012. 68. Naibert, N.; Geye, E.; Phillips, M. M.; Barbera, J. Multicourse Comparative Study of the Core Aspects for Flipped Learning: Investigating In-Class Structure and Student Use of Video Resources. J. Chem. Educ. 2020. 69. Pintrich, P. R.; Smith, D. A. F.; Garcia, T.; McKeachie, W. J. A Manual for the Use of the Motivated Strategies for Learning Questionnaire (MSLQ). 1991. 70. Weinstein, C. E.; Palmer, D.; Schulte, A. C. Learning and Study Strategies Inventory. 2nd ed.; H & H: Clearwater, FL, 2002. 71. Thompson, M. S.; Green, S. B. Evaluating Between-Group Differences in Latent Variable Means. In Structural Equation Modeling: A Second Course, Hancock, G. R.; Mueller, R. O., Eds. Information Age Publishing: Charlotte, NC, 2013; pp 163-218.

26
72. Hancock, G. R. Experimental, Quasi-Experimental, and Nonexperimental Design and Analysis with Latent Variables. SAGE Handb. Quant. Methodol. Soc. Sci. 2004, 317-334. 73. Pintrich, P. R.; Marx, R. W.; Boyle, R. A. Beyond Cold Conceptual Change: The Role of Motivational Beliefs and Classroom Contextual Factors in the Process of Conceptual Change. Rev. Educ. Res. 1993, 63 (2), 167-199. 74. Cohen, J. A Power Primer. Psychol. Bull. 1992, 112 (1), 155-159. 75. McNeish, D.; An, J.; Hancock, G. R. The Thorny Relation Between Measurement Quality and Fit Index Cutoffs in Latent Variable Models. J. Pers. Assess. 2018, 100 (1), 43-52. 76. Young, A. M.; Wendel, P. J.; Esson, J. M.; Plank, K. M. Motivational Decline and Recovery in Higher Education STEM Courses. Int. J. Sci. Educ. 2018, 40 (9), 1016-1033. 77. Eddy, S. L.; Hogan, K. A. Getting under the Hood: How and for Whom Does Increasing Course Structure Work? CBE—Life Sci. Educ. 2014, 13 (3), 453-468. 78. Baeten, M.; Dochy, F.; Struyven, K. The Effects of Different Learning Environments on Students’ Motivation for Learning and Their Achievement. Br. J. Educ. Psychol. 2013, 83 (3), 484-501. 79. Hanrahan, M. The Effect of Learning Environment Factors on Students’ Motivation and Learning. Int. J. Sci. Educ. 1998, 20 (6), 737-753. 80. Lodewyk, K. R.; Winne, P. H. Relations Among the Structure of Learning Tasks, Achievement, and Changes in Self-Efficacy in Secondary Students. J. Educ. Psychol. 2005, 97 (1), 3-12. 81. Wiggins, B. L.; Eddy, S. L.; Wener-Fligner, L.; Freisem, K.; Grunspan, D. Z.; Theobald, E. J.; Timbrook, J.; Crowe, A. J. ASPECT: A Survey to Assess Student Perspective of Engagement in an Active-Learning Classroom. CBE—Life Sci. Educ. 2017, 16 (2). 82. Chapman, K. J.; van Auken, S. Creating Positive Group Project Experiences: An Examination of the Role of the Instructor on Students’ Perceptions of Group Projects. J. Marketing Educ. 2016, 23 (2), 117-127. 83. Chang, Y.; Brickman, P. When Group Work Doesn't Work: Insights from Students. CBE—Life Sci. Educ. 2018, 17 (3), ar42. 84. Oakley, B.; Felder, R. M.; Brent, R.; Elhajj, I. Turning Student Groups into Effective Teams. Journal of Student Centered Learning 2004, 2 (1), 9-34. 85. Sawtelle, V.; Brewe, E.; Goertzen, R. M.; Kramer, L. H. Identifying Events that Impact Self-Efficacy in Physics Learning. Phys. Rev. Spec. Top.-PH 2012, 8 (2). 86. Shortlidge, E. E.; Rain-Griffith, L.; Shelby, C.; Shusterman, G. P.; Barbera, J. Despite Similar Perceptions and Attitudes, Postbaccalaureate Students Outperform in Introductory Biology and Chemistry Courses. CBE—Life Sci. Educ. 2019, 18 (1), ar3. 87. Cantwell, R. H.; Andrews, B. Cognitive and Psychological Factors Underlying Secondary School Students' Feelings Towards Group Work. Educ. Psychol.-UK 2002, 22 (1), 75-91. 88. Livingstone, D.; Lynch, K. Group Project Work and Student-centred Active Learning: two different experiences. J. Geogr. Higher Educ. 2002, 26 (2), 217-237. 89. Lavy, S. Who Benefits from Group Work in Higher Education? An Attachment Theory Perspective. Higher Education 2016, 73 (2), 175-187. 90. Murphy, P. K.; Wilkinson, I. A.; Soter, A. O. Instruction Based on Discussion. In Handbook of Research on Learning and Instruction, Mayer, R. E.; Alexander, P. A., Eds. Routledge: NY, 2011.

27
91. Brewe, E. Modeling Theory Applied: Modeling Instruction in Introductory Physics. Am. J. Phys. 2008, 76 (12), 1155-1160.

1
Supporting Information for Multi-institutional Study of Self-Efficacy within Flipped Chemistry Courses
Nicole Naiberta, Kerry D. Duckb, Michael M. Phillipsc, and Jack Barberaa* aDepartment of Chemistry, Portland State University, Portland, Oregon, 97207-0751, United States bSchool of Education, University of Delaware, Newark, Delaware, 19716, United States cSchool of Psychological Science, University of Northern Colorado, Greeley, Colorado 80639-6900, United States *Corresponding author: [email protected]
Table of Contents
Individual scale analyses and modifications .................................................................................. 2
Final CFA models by institution ..................................................................................................... 5
Descriptive statistics for each measure .......................................................................................... 7
Accounting for unused response categories ................................................................................... 9
Establishing measurement invariance ............................................................................................ 9
Supplemental structured means modeling tables .......................................................................... 14
Observations of the face-to-face environments ............................................................................. 17
References for Supporting Information ........................................................................................ 18

2
Individual scale analyses and modifications For each individual scale, a priori single-factor models were investigated using Confirmatory Factor
Analyses (CFA) on the full dataset. This step was undertaken to examine potential problematic items and to inform the need for modifications. After acceptable models were found for each scale, data-model fit was cross-validated at the institution level. Global and local data-model fit was assessed using the Comparative Fit Index (CFI),1 Root Mean Square Error of Approximation (RMSEA),2 and Standardized Root Mean Square Residual (SRMR).3 For data-model fit, Hu and Bentler4 have suggested CFI values greater than 0.95, RMSEA values less than 0.06, and SRMR values less than 0.08 as evidence of good fit. However, McNeish and colleagues5 only suggest adherence to these aforementioned cutoff values for models that have items with similar properties to those in Hu and Bentler’s4 simulation (i.e., all factor loadings approximately 0.7). McNeish et al.5 found that for models containing items with higher factor loadings (e.g., 0.9), that appropriate CFI values could be as low as 0.775 and RMSEA values could be as high as 0.20. This suggests that data could have appropriate data-model fit even when fit indices appear less ideal according to what Hu and Bentler4 originally found. Therefore, both item factor loadings and a range of fit indices were used when evaluating the data-model fit across all analyses in this study.
All initial models had poor RMSEA values. Table S1 contains the summary data-model fit indices for
the initial and final models using the full data sample. Individual scale modifications were made based upon modification indices and/or conceptual justifications.6 A discussion for each scale modification follows in the subsequent sections.
Table S1. Fit Indices for initial and final versions of scales.
Initial Modela Final Modelb
Measure CFI SRMR RMSEA CI RMSEA CFI SRMR RMSEA CI RMSEA
CSE Pre 0.984 0.035 0.150 0.138-0.162 0.994 0.024 0.168 0.143-0.195
Post 0.980 0.038 0.157 0.143-0.171 0.993 0.025 0.170 0.141-0.201
ASE Pre 0.967 0.063 0.206 0.198-0.214 0.996 0.022 0.085 0.073-0.097
Post 0.978 0.052 0.223 0.214-0.233 0.994 0.026 0.128 0.114-0.143
CON Pre 0.959 0.052 0.138 0.130-0.147 0.987 0.030 0.105 0.093-0.117
Post 0.949 0.058 0.161 0.152-0.171 0.988 0.031 0.106 0.092-0.121
TMT Pre 0.940 0.070 0.143 0.135-0.152 0.982 0.036 0.149 0.133-0.166
Post 0.928 0.081 0.162 0.153-0.172 0.977 0.043 0.183 0.164-0.202 aInitial models include all items. bFinal models include a reduced set of items.

3
Chemistry Self-Efficacy (CSE)
Items 1 and 6 were removed to produce the final CSE measure. Item 1 was removed because it showed consistently high modification indices (correlated errors to other items). Item 6 was removed as it was deemed to not necessarily be specific to the lecture portion of each course in the sample. Table S2. Factor loadings for Chemistry Self-Efficacy scale models.
Item Pre Post
Initial Final Initial Final 1. To what extent can you explain chemical laws and theories? 0.758 --- 0.778 --- 2. How well can you choose an appropriate formula to solve a chemistry problem? 0.812 0.784 0.775 0.745
3. How well can you describe the properties of elements by using the periodic table? 0.765 0.760 0.784 0.781
4. How well can you read the formulas of elements and compounds? 0.883 0.907 0.883 0.910 5. How well can you interpret chemical equations? 0.905 0.903 0.900 0.897 6. How well can you interpret graphs/charts related to chemistry? 0.754 --- 0.745 ---
Academic Self-Efficacy (ASE) Items 2 and 8 were removed to produce the final ASE measure. Each was removed due to their
consistently high modification indices. Additionally, each contained an aspect that may not have pertained to all courses (i.e., readings and assignments). Table S3. Factor loadings for Academic Self-Efficacy scale models.
Item Pre Post
Initial Final Initial Final 1. I'm confident that I can understand the most complex material presented by the instructor in my courses. 0.821 0.729 0.928 0.834
2. I'm certain I can understand the most difficult material presented in the readings for my courses. 0.803 --- 0.915 ---
3. I believe I will receive excellent grades in my courses. 0.870 0.873 0.866 0.904 4. I'm confident I can understand the basic concepts taught in my courses. 0.801 0.824 0.800 0.819 5. I expect to do well in my courses. 0.878 0.896 0.837 0.857 6. Considering the difficulty of my courses, the instructor, and my skills, I think I will do well in my courses. 0.904 0.920 0.923 0.942
7. I'm certain I can master the skills being taught in my courses. 0.869 0.852 0.888 0.863 8. I'm confident I can do an excellent job on the assignments and tests in my courses. 0.911 --- 0.926 ---

4
Concentration (CON)
Items 7 and 8 were removed to produce the final CON measure. Item 7 was removed due its consistently low factor loadings. Item 8 was removed as it was a double-barreled item. Table S4. Factor loadings for Concentration scale models. REV indicates a reverse-coded item.
Item Pre Post
Initial Final Initial Final 1. I concentrate fully when studying. 0.533 0.543 0.528 0.536 2. Because I don't listen carefully, I don't understand some course material. (REV) 0.598 0.569 0.638 0.618
3. I find it difficult to maintain my concentration while doing my coursework. (REV) 0.814 0.829 0.812 0.827
4. My mind wanders a lot when I study. (REV) 0.839 0.859 0.848 0.869 5. I find it hard to pay attention during lectures. (REV) 0.774 0.716 0.759 0.689 6. I am very easily distracted from my studies. (REV) 0.845 0.859 0.857 0.869 7. If I get distracted during class, I am able to refocus my attention. 0.247 --- 0.110 --- 8. I find that during lectures I think of other things and don't really listen to what is being said. (REV) 0.741 --- 0.727 ---
Time Management (TMT) Items 2, 6, and 7 were removed to produce the final TMT measure. Each was removed due to their
consistently low factor loadings. Additionally, correlated residuals were incorporated for items 5 and 8 based on their similarity in use of the word ‘cram’/‘cramming’. Table S5. Factor loadings for Time Management scale models.
Item Pre Post
Initial Final Initial Final 1. I find it hard to stick to a study schedule. 0.688 0.697 0.704 0.705 2. When I decide to study, I set aside a specific length of time and stick to it. 0.346 --- 0.286 ---
3. When it comes to studying, procrastination is a problem for me. 0.844 0.865 0.862 0.870 4. I put off studying more than I should. 0.898 0.912 0.916 0.933 5. I spread out my study times so I do not have to "cram" for a test. 0.627 0.549 0.550 0.467 6. I do not have enough time to study because I spend too much time with my friends. 0.469 --- 0.441 ---
7. I set aside more time to study the subjects that are difficult for me. 0.376 --- 0.195 --- 8. I end up "cramming" for every test. 0.702 0.658 0.712 0.670

5
Final CFA models by institution The RMSEA values were outside of the range as described by Hu and Bentler,4 but are
interpreted as being acceptable based on the findings and recommendations of McNeish and colleagues.5 Within their simulation studies, McNeish and colleagues5 found that CFA models that included scales with excellent measurement quality (defined by high standardized factor loadings and McDonald’s omega values) showed a higher power to detect even trivial model misspecifications, thereby resulting in “seemingly unsatisfactory [data-model fit] values”. While they make a point to not recommend alternative acceptable values, they do note that under these conditions that SRMR values may exceed 0.14, RMSEA values may exceed 0.20, and that CFI values may fall below 0.775. Therefore, given that the majority of the factor loadings for our items were high (majority >0.70 for the final models, Tables S2-S5) and that the McDonald’s omega values of each scale were also high (all above 0.80, Table S6), we believe that the data-model fit for each measure at each institution is acceptable (Table S6).
Komperda and colleagues7 discuss various methods of estimating the single-administration reliability of scale data. If data from scale items do not fit parallel or tau-equivalence factor structures, alternatives to Cronbach’s alpha are preferred (e.g., McDonald’s omega). To assess the single-administration reliability of each scale, CFA models were therefore fit as congeneric with McDonald’s omega values reported.

6
Table S6. Data-model fit indices and single-administration reliability values (omega) for CFA final models by institution. Scale Time Institution df c2 CFI SRMR RMSEA 90% CI omega
CSE
Pre Southeastern 2 30.368 0.995 0.024 0.160 0.113-0.213 0.91 Western 2 9.245 0.995 0.023 0.131 0.055-0.222 0.86 Northwestern 2 50.777 0.990 0.033 0.176 0.136-0.220 0.87
Post Southeastern 2 8.138 0.998 0.085 0.103 0.037-0.181 0.91 Western 2 23.126 0.984 0.044 0.222 0.147-0.308 0.83 Northwestern 2 45.929 0.994 0.033 0.217 0.109-0.345 0.88
ASE
Pre Southeastern 9 56.371 0.996 0.025 0.098 0.074-0.123 0.95 Western 9 36.783 0.993 0.033 0.122 0.082-0.164 0.92 Northwestern 9 68.842 0.994 0.029 0.092 0.072-0.113 0.92
Post Southeastern 9 74.510 0.994 0.030 0.159 0.127-0.193 0.95 Western 9 25.225 0.997 0.022 0.091 0.050-0.134 0.93 Northwestern 9 113.979 0.998 0.018 0.114 0.086-0.145 0.93
CON
Pre Southeastern 9 73.373 0.984 0.035 0.115 0.091-0.140 0.87 Western 9 52.195 0.967 0.049 0.153 0.115-0.195 0.84 Northwestern 9 106.381 0.986 0.033 0.099 0.078-0.121 0.86
Post Southeastern 9 62.035 0.985 0.041 0.143 0.111-0.178 0.89 Western 9 58.064 0.974 0.053 0.160 0.122-0.200 0.86 Northwestern 9 70.475 0.986 0.033 0.099 0.078-0.121 0.86
TMT
Pre Southeastern 4 14.746 0.998 0.016 0.070 0.034-0.110 0.88 Western 4 7.181 0.997 0.023 0.062 0.000-0.135 0.84 Northwestern 4 17.901 0.996 0.019 0.067 0.037-0.099 0.84
Post Southeastern 4 3.952 1.000 0.011 0.000 0.000-0.088 0.88 Western 4 8.811 0.996 0.022 0.075 0.000-0.144 0.82 Northwestern 4 16.374 0.997 0.017 0.067 0.035-0.102 0.84

7
Descriptive statistics for each measure Descriptive statistics for each scale were calculated using the psych package (Version 1.9.12) in R
(Table S7). All observed means were calculated as the average of the individual items retained in the CFAs. Descriptive statistics by institution are shown in Table S8. While there is evidence of non-normality in the data, the individual items are also ordinal in nature. Therefore, in all subsequent analyses, the WLSMV estimator was chosen to appropriately account for these data structures. Table S7. Descriptive statistics by scale and time point.
Scales Time Mean Standard Deviation Skew Kurtosis
Chemistry Self-Efficacy (CSE) Pre 3.17 0.90 -0.32 2.83
Post 3.64 0.81 -0.43 3.41
Academic Self-Efficacy (ASE) Pre 3.93 0.80 -1.08 4.44
Post 3.44 1.03 -0.44 2.41
Concentration (CON) Pre 3.23 0.87 0.06 2.44
Post 3.20 0.88 0.13 2.43
Time Management (TMT) Pre 2.89 0.92 0.19 2.53
Post 2.81 0.91 0.25 2.64

8
Table S8. Descriptive statistics for measures by institution. Aggregated Southeastern Western Northwestern
CSE
Pre
n 1,559 554 211 794 M (SD) 3.180 (0.789) 2.883 (0.925) 3.487 (0.787) 3.307 (0.804) Sk -0.320 -0.048 -0.543 -0.350 Ku 2.920 2.688 3.973 3.072
Post
n 1,216 293 217 706 M (SD) 3.638 (0.789) 3.892 (0.815) 3.610 (0.670) 3.540 (0.790) Sk -0.381 -0.428 0.208 -0.547 Ku 3.359 2.902 2.309 3.659
ASE
Pre
n 1,562 554 211 797 M (SD) 3.899 (0.817) 4.148 (0.793) 3.748 (0.816) 3.765 (0.793) Sk -1.021 -1.671 -0.692 -0.836 Ku 4.162 6.703 3.491 3.607
Post
n 1,221 293 219 709 M (SD) 3.410 (1.046) 3.975 (0.940) 3.474 (0.922) 3.157 (1.030) Sk -0.434 -1.022 -0.409 -0.300 Ku 2.469 3.853 2.848 2.263
CON
Pre
n 1,562 554 211 797 M (SD) 3.197 (0.856) 3.389 (0.874) 2.952 (0.826) 3.128 (0.825) Sk 0.066 -0.163 0.380 0.118 Ku 2.441 2.538 2.694 2.471
Post
n 1,220 293 219 708 M (SD) 3.216 (0.874) 3.373 (0.958) 2.846 (0.790) 3.265 (0.830) Sk 0.089 -0.010 0.215 0.034 Ku 2.417 2.158 2.894 2.417
TMT
Pre
n 1,560 554 210 796 M (SD) 2.865 (0.906) 2.950 (0.968) 2.781 (0.866) 2.828 (0.753) Sk 0.211 0.060 0.283 0.288 Ku 2.591 2.419 3.116 2.612
Post
n 1,220 293 218 709 M (SD) 2.823 (0.890) 2.950 (1.018) 2.679 (0.819) 2.814 (0.847) Sk 0.263 0.222 0.467 0.145 Ku 2.771 2.236 3.162 2.816

9
Accounting for unused response categories In this study some of the measurement invariance and structural means modeling analyzes required
comparing institutional data. However, for some institutions, the data collected for the CSE scale did not include responses spanning the entire response scale. When conducting comparisons, response category thresholds cannot easily be removed from only a subset of the data. Therefore, a method was developed to account for these missing response categories when comparisons between institutions were conducted. To conduct these analyses, at least one response is required in each response category for each item in the scale at the institution level. Therefore, a single ‘dummy participant’ with a response pattern that included the missing response category was added to the data set as needed. For the remaining items on the scale, where students had used the full response scale, the dummy response pattern included the average value for that item. For example, a ‘dummy’ response pattern was added for the Western institution, which accounted for no students responding “strongly disagree” to Items 2, 4, and 5 on the post CSE scale. The effect of adding dummy response patterns was examined by first evaluating data-model fit statistics and latent means for only the institutions that included full response scale data (i.e., no dummy responses present). Then trial dummy response patterns were added to these institutions and the measurement invariance and latent means analysis was again examined and compared to the previous analysis that included only real data. The results from the ‘real’ and ‘real & dummy’ data were similar and no significant differences were detected. This suggested that adding these response patterns, in minimal quantities, for the institutions with missing response data would not significantly affect the outcome of the results. Based on this, a single dummy response pattern was added to the institution that was missing at least one response category, as needed.
Establishing measurement invariance The focus of these analyses was to establish scalar invariance of the four measures, which
involves setting factor loading and threshold response patterns equal across comparator groups. To address this, the CFI, SRMR, and RMSEA data-model fit values for both the configural and scalar models were evaluated and also compared, based upon the recommendations by Chen3 as well as Jin.8 With respect to some items on the CSE scale, some of the institution’s data did not contain response for all categories (i.e., no students responded “strongly disagree”), which resulted in a different number of thresholds for these institutions. Since thresholds cannot be easily removed from only a subset of institutions, a ‘dummy’ response pattern was added. A detailed description of this method is presented in the Supporting Information. Finally, pre to post longitudinal invariance was assessed for all measures using the full sample. Syntax for the longitudinal invariance models was generated using the measEq.syntax feature within the semTools package (Version 0.5-3) in R.
While it is also recommended to evaluate the change in the fit indices when moving from the
configural to the scalar model, this is not a requirement to establish invariance.9 We do, however, report the change values for each measurement invariance evaluation (Tables S9-S12) and note that while most fall into the recommended ranges,3, 8 the RMSEA values of the by gender (Table S11) and by URM status (Table S12) regularly fall outside of the range. However, given the model sensitivity issues noted by McNeish and colleagues,5 we may not be able to use the recommended change values to conclude if the change is acceptable or unacceptable in a definitive fashion. Therefore, we support the invariance of each by group comparison based on the acceptable data-model fit to each of the scalar models.

10
Table S9. Data-model fit indices for scalar longitudinal measurement invariance. Model df c2 p-Value CFI SRMR RMSEA Ddf Dc2 DCFI DSRMR DRMSEA CSE Configural 15 85.338 < 0.001 0.995 0.025 0.069 --- --- --- --- --- Scalar 26 99.550 0.057 0.995 0.025 0.054 11 19.249 0.000 0.000 0.015 ASE Configural 47 241.689 < 0.001 0.994 0.028 0.065 --- --- --- --- --- Scalar 64 351.229 < 0.001 0.990 0.029 0.068 17 116.39 0.004 -0.001 -0.003 CON Configural 47 275.771 < 0.001 0.983 0.038 0.071 --- --- --- --- --- Scalar 64 280.482 0.722 0.984 0.038 0.059 17 13.028 -0.001 0.000 0.012 TMT Configural 27 198.411 < 0.001 0.985 0.038 0.081 --- --- --- --- --- Scalar 41 215.803 0.036 0.984 0.038 0.066 14 24.811 0.001 0.000 0.015
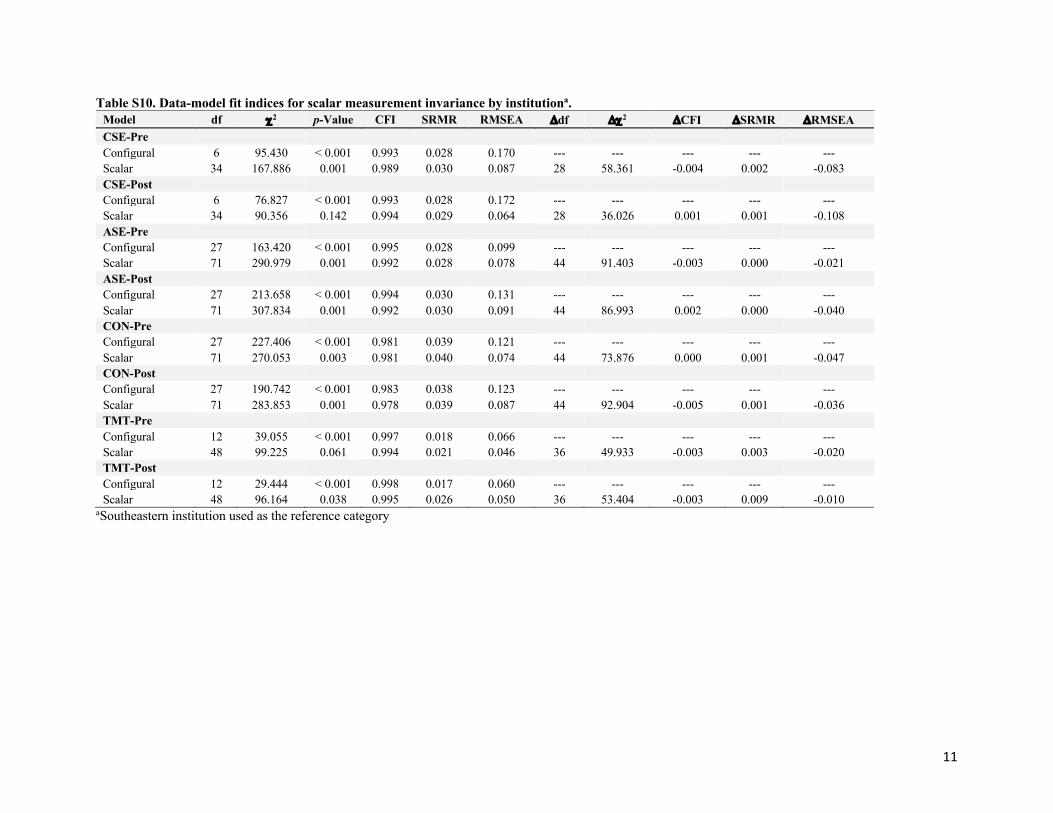
11
Table S10. Data-model fit indices for scalar measurement invariance by institutiona. Model df c2 p-Value CFI SRMR RMSEA Ddf Dc2 DCFI DSRMR DRMSEA CSE-Pre Configural 6 95.430 < 0.001 0.993 0.028 0.170 --- --- --- --- --- Scalar 34 167.886 0.001 0.989 0.030 0.087 28 58.361 -0.004 0.002 -0.083 CSE-Post Configural 6 76.827 < 0.001 0.993 0.028 0.172 --- --- --- --- --- Scalar 34 90.356 0.142 0.994 0.029 0.064 28 36.026 0.001 0.001 -0.108 ASE-Pre Configural 27 163.420 < 0.001 0.995 0.028 0.099 --- --- --- --- --- Scalar 71 290.979 0.001 0.992 0.028 0.078 44 91.403 -0.003 0.000 -0.021 ASE-Post Configural 27 213.658 < 0.001 0.994 0.030 0.131 --- --- --- --- --- Scalar 71 307.834 0.001 0.992 0.030 0.091 44 86.993 0.002 0.000 -0.040 CON-Pre Configural 27 227.406 < 0.001 0.981 0.039 0.121 --- --- --- --- --- Scalar 71 270.053 0.003 0.981 0.040 0.074 44 73.876 0.000 0.001 -0.047 CON-Post Configural 27 190.742 < 0.001 0.983 0.038 0.123 --- --- --- --- --- Scalar 71 283.853 0.001 0.978 0.039 0.087 44 92.904 -0.005 0.001 -0.036 TMT-Pre Configural 12 39.055 < 0.001 0.997 0.018 0.066 --- --- --- --- --- Scalar 48 99.225 0.061 0.994 0.021 0.046 36 49.933 -0.003 0.003 -0.020 TMT-Post Configural 12 29.444 < 0.001 0.998 0.017 0.060 --- --- --- --- --- Scalar 48 96.164 0.038 0.995 0.026 0.050 36 53.404 -0.003 0.009 -0.010
aSoutheastern institution used as the reference category

12
Table S11. Data-model fit indices for scalar measurement invariance by gender.a Values in italics outside of the recommended range noted by Chen3 and by Jin.8
Model df c2 p-Value CFI SRMR RMSEA Ddf Dc2 DCFI DSRMR DRMSEA CSE-Pre Configural 4 81.733 < 0.001 0.994 0.026 0.159 --- --- --- --- --- Scalar 18 79.652 0.702 0.995 0.026 0.067 14 10.799 -0.001 0.000 0.092 CSE-Post Configural 4 72.815 < 0.001 0.992 0.027 0.178 --- --- --- --- --- Scalar 18 94.682 0.005 0.991 0.028 0.089 14 31.552 0.001 -0.001 0.089 ASE-Pre Configural 18 129.028 < 0.001 0.996 0.025 0.090 --- --- --- --- --- Scalar 40 166.346 0.006 0.995 0.025 0.064 22 42.240 0.001 0.000 0.026 ASE-Post Configural 18 171.487 < 0.001 0.994 0.027 0.125 --- --- --- --- --- Scalar 40 204.986 0.003 0.994 0.027 0.087 22 44.416 0.000 0.000 0.038 CON-Pre Configural 18 206.902 < 0.001 0.982 0.036 0.118 --- --- --- --- --- Scalar 40 208.585 0.002 0.984 0.037 0.074 22 45.217 -0.002 -0.001 0.044 CON-Post Configural 18 165.400 < 0.001 0.984 0.036 0.123 --- --- --- --- --- Scalar 40 162.922 0.032 0.986 0.037 0.076 22 35.730 -0.002 -0.001 0.047 TMT-Pre Configural 8 36.976 < 0.001 0.997 0.017 0.069 --- --- --- --- --- Scalar 26 60.562 0.080 0.996 0.019 0.042 18 26.940 0.001 -0.002 0.027 TMT-Post Configural 8 33.507 < 0.001 0.997 0.018 0.077 --- --- --- --- --- Scalar 26 71.180 0.008 0.994 0.023 0.057 18 35.472 0.003 -0.005 0.020
aMale was used as the reference category.

13
Table S12. Data-model fit indices for scalar measurement invariance by URM status.a Values in italics outside of the recommended range noted by Chen3 and by Jin.8
Model df c2 p-Value CFI SRMR RMSEA Ddf Dc2 DCFI DSRMR DRMSEA CSE-Pre Configural 4 82.973 < 0.001 0.994 0.026 0.160 --- --- --- --- --- Scalar 18 120.792 < 0.001 0.992 0.026 0.086 14 38.066 0.002 0.000 0.074 CSE-Post Configural 4 84.369 < 0.001 0.991 0.028 0.183 --- --- --- --- --- Scalar 18 101.540 0.002 0.991 0.029 0.088 14 33.921 0.000 -0.001 0.095 ASE-Pre Configural 18 150.359 < 0.001 0.995 0.027 0.098 --- --- --- --- --- Scalar 40 180.524 0.013 0.995 0.027 0.067 22 39.180 0.000 0.000 0.031 ASE-Post Configural 18 211.726 < 0.001 0.994 0.028 0.133 --- --- --- --- --- Scalar 40 241.346 0.002 0.993 0.028 0.091 22 45.287 0.001 0.000 0.042 CON-Pre Configural 18 208.937 < 0.001 0.982 0.036 0.118 --- --- --- --- --- Scalar 40 209.401 0.003 0.984 0.037 0.074 22 44.352 -0.002 -0.001 0.044 CON-Post Configural 18 197.575 < 0.001 0.982 0.036 0.129 --- --- --- --- --- Scalar 40 196.593 0.004 0.984 0.037 0.081 22 43.459 -0.002 -0.001 0.048 TMT-Pre Configural 8 39.812 < 0.001 0.996 0.017 0.072 --- --- --- --- --- Scalar 26 60.267 0.115 0.996 0.019 0.041 18 25.371 0.000 -0.002 0.031 TMT-Post Configural 8 31.170 < 0.001 0.997 0.016 0.070 --- --- --- --- --- Scalar 26 41.403 0.391 0.998 0.017 0.031 18 19.022 -0.001 -0.001 0.039
anon-URM was used as the reference category.

14
Supplemental structured means modeling tables
Table S13 shows the results of the pre to post latent mean differences for the TMT and CON factors for each institution. As most of the differences were not significant, and the significant differences only represented small effect sizes, the decision was made to use the pre TMT and pre CON factors as controls in our larger CSE and ASE post comparisons between institutions.
Table S13. Pre to post latent mean differences for each institution. Bolded values indicate the difference was statistically significant (p < 0.05).
Scale Institution Responses, n Observed Pre Scorea
Pre to Post Latent Mean Difference (Effect Size)
Time Management
(TMT)
Southeastern 261 2.98 -0.03 (0.03)
Western 162 2.83 -0.16 (0.18)
Northwestern 547 2.88 -0.01 (0.01)
Concentration
(CON)
Southeastern 258 3.42 -0.04 (0.05)
Western 163 3.02 -0.09 (0.15)
Northwestern 547 3.15 0.12 (0.19)
aObserved pre scale scores were calculated as an unweighted average of the items included in the final version of each scale. Table S14. Sample size of matched data set by gender and URM status shown by institution. Southeastern Western Northwestern Aggregated
Male, n (%)a 97 (37) 62 (37) 185 (33) 344 (34)
Female, n (%)a 168 (63) 106 (63) 374 (67) 648 (66)
non-URM, n (%)a 26 (10) 81 (49) 417 (75) 524 (53)
URM, n (%)a 238 (90) 86 (51) 139 (25) 463 (47)
aPercentage of group responses within each data set

15
Table S15 shows the pre to post latent mean differences for all four factors based on aggregated male and female groups. Results indicated that both male and female groups had an increase in CSE and decrease in ASE over the term. Only nonsignificant to small effects were seen for pre to post differences for TMT and CON. Table S15. Pre to post latent mean differences for male and female groups. Bolded values indicate the difference was statistically significant (p < 0.05).
Scale Group Responses, n Observed Pre Scorea
Pre to Post Latent Mean Difference (Effect Size)
Chemistry Self-efficacy
(CSE)
Male 335 3.28 0.62 (0.52)
Female 632 3.23 0.63 (0.53)
Academic Self-efficacy
(ASE)
Male 331 3.94 -0.30 (0.27)
Female 637 3.85 -0.62 (0.49)
Time Management
(TMT)
Male 331 2.84 -0.03 (0.03)
Female 623 2.93 -0.04 (0.04)
Concentration (CON)
Male 324 3.23 0.00 (0.01)
Female 628 3.19 0.07 (0.10) aObserved pre scale scores were calculated as an unweighted average of the items included in the final version of each scale. Table S16 includes the post CSE differences between demographic groups from the aggregated data set. Comparisons between non-URM and URM groups showed that URM students had lower pre CSE compared to non-URM students but a higher post CSE when the pre latent means are controlled for. No differences were found between male and female groups. Table S16. Pairwise post chemistry self-efficacy (CSE) latent mean differences by demographic group with pre CSE, TMT, and CON factors as covariates. Each comparison is between two groups (i.e., non-URM vs. URM and male vs. female) while accounting for the pre latent means. Bolded values indicate the difference was statistically significant (p < 0.05).
Reference Group
Comparison Group
Pre Latent Mean Differences (Effect Size)
Post CSE Latent Mean Difference (Effect Size)
non-URM (n = 492)
URM (n = 444)
CSE -0.40 (0.28)
0.60 (0.60) TMT -0.03 (0.03)
CON 0.11 (0.14)
Male (n = 324)
Female (n = 637)
CSE -0.08 (0.06)
-0.06 (0.06) TMT 0.10 (0.08)
CON -0.03 (0.05)

16
Table S17 shows the pre to post latent mean differences for the four factors based on aggregated non-URM and URM groups. Results indicated that both non-URM and URM groups had an increase in CSE and decrease in ASE over the term. Only nonsignificant to small effects were seen for pre to post differences for TMT and CON. Table S17. Pre to post latent mean differences for non-URM and URM groups. Bolded values indicate the difference was statistically significant (p < 0.05).
Scale Group Responses, n Observed Pre Scorea
Pre to Post Latent Mean Difference (Effect Size)
Chemistry Self-efficacy
(CSE)
non-URM 509 3.35 0.34 (0.27)
URM 453 3.13 0.89 (0.79)
Academic Self-efficacy
(ASE)
non-URM 511 3.76 -0.58 (0.51)
URM 452 4.01 -0.40 (0.31)
Time Management
(TMT)
non-URM 502 2.91 -0.01 (0.01)
URM 447 2.88 -0.05 (0.06)
Concentration (CON)
non-URM 502 3.16 0.09 (0.14)
URM 445 3.25 -0.01 (0.01) aObserved pre scale scores were calculated as an unweighted average of the items included in the final version of each scale. Table S18 includes the post ASE differences between demographic groups from the aggregated data set. Comparisons between non-URM and URM groups showed that URM students had higher pre and post ASE compared to non-URM students. Comparisons between male and female groups found that female students had lower post ASE compared to male students. Table S18. Pairwise post academic self-efficacy (ASE) latent mean differences by demographic group with pre ASE, TMT, and CON factors as covariates. Each comparison is between two groups (i.e., non-URM vs. URM and male vs. female) while accounting for the pre latent means. Bolded values indicate the difference was statistically significant (p < 0.05).
Reference Group
Comparison Group
Pre Latent Mean Differences (Effect Size)
Post ASE Latent Mean Difference (Effect Size)
non-URM (n = 494)
URM (n = 443)
ASE 0.38 (0.37)
0.36 (0.28) TMT -0.08 (0.06)
CON 0.10 (0.12)
Male (n = 321)
Female (n = 616)
ASE -0.13 (0.14)
-0.46 (0.33) TMT 0.10 (0.09)
CON -0.04 (0.05)
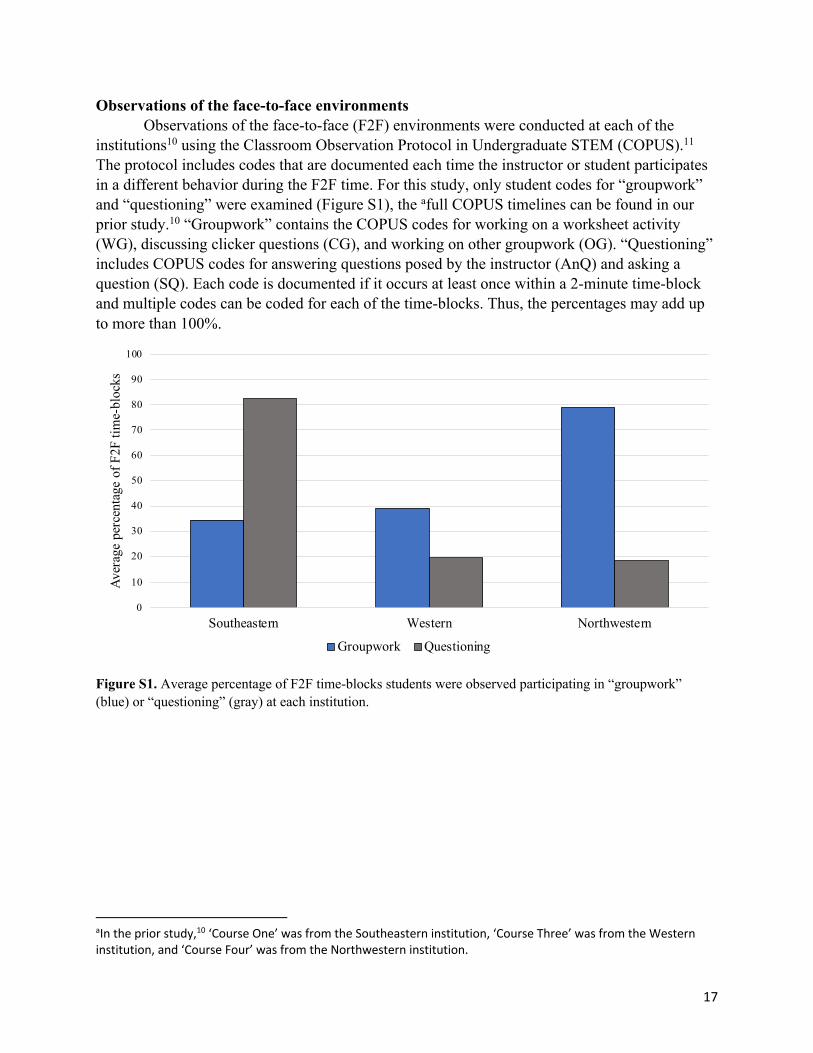
17
Observations of the face-to-face environments Observations of the face-to-face (F2F) environments were conducted at each of the institutions10 using the Classroom Observation Protocol in Undergraduate STEM (COPUS).11 The protocol includes codes that are documented each time the instructor or student participates in a different behavior during the F2F time. For this study, only student codes for “groupwork” and “questioning” were examined (Figure S1), the afull COPUS timelines can be found in our prior study.10 “Groupwork” contains the COPUS codes for working on a worksheet activity (WG), discussing clicker questions (CG), and working on other groupwork (OG). “Questioning” includes COPUS codes for answering questions posed by the instructor (AnQ) and asking a question (SQ). Each code is documented if it occurs at least once within a 2-minute time-block and multiple codes can be coded for each of the time-blocks. Thus, the percentages may add up to more than 100%.
Figure S1. Average percentage of F2F time-blocks students were observed participating in “groupwork” (blue) or “questioning” (gray) at each institution.
aIn the prior study,10 ‘Course One’ was from the Southeastern institution, ‘Course Three’ was from the Western institution, and ‘Course Four’ was from the Northwestern institution.
0
10
20
30
40
50
60
70
80
90
100
Southeastern Western Northwestern
Aver
age
perc
enta
ge o
f F2F
tim
e-bl
ocks
Groupwork Questioning

18
References for Supporting Information 1. Bentler, P. Comparative Fit Indices in Structural Models. Quant. Methods Psychol. 1990, 107 (2),
238-246. 2. Steiger, J. H., Statistically Based Tests for the Number of Common Factors. In The Annual
Meeting of the Psychometric Society, Iowa City, IA., 1980. 3. Chen, F. F. Sensitivity of Goodness of Fit Indexes to Lack of Measurement Invariance. Struct.
Equ. Model. Multidiscip. J. 2007, 14 (3), 464-504. 4. Hu, L. T.; Bentler, P. M. Cutoff Criteria for Fit Indexes in Covariance Structure Analysis:
Conventional Criteria versus New Alternatives. Struct. Equ. Model. Multidiscip. J. 1999, 6 (1), 1-55.
5. McNeish, D.; An, J.; Hancock, G. R. The Thorny Relation Between Measurement Quality and Fit Index Cutoffs in Latent Variable Models. J. Pers. Assess. 2018, 100 (1), 43-52.
6. Wang, J.; Wang, X. Structural Equation Modeling: Applications using Mplus. John Wiley & Sons: 2019.
7. Komperda, R.; Pentecost, T. C.; Barbera, J. Moving beyond Alpha: A Primer on Alternative Sources of Single-Administration Reliability Evidence for Quantitative Chemistry Education Research. J. Chem. Educ. 2018, 95 (9), 1477-1491.
8. Jin, Y. A Note on the Cutoff Values of Alternative Fit Indices to Evaluate Measurement Invariance for ESEM Models. Int. J. Behav. Dev. 2020, 44 (2), 166-174.
9. Rocabado, G. A.; Komperda, R.; Lewis, J. E.; Barbera, J. Addressing Diversity and Inclusion through Group Comparisons: A Primer on Measurement Invariance Testing. Chem. Educ. Res. Pract. 2020.
10. Naibert, N.; Geye, E.; Phillips, M. M.; Barbera, J. Multicourse Comparative Study of the Core Aspects for Flipped Learning: Investigating In-Class Structure and Student Use of Video Resources. J. Chem. Educ. 2020.
11. Smith, M. K.; Jones, F. H. M.; Gilbert, S. L.; Wieman, C. E. The Classroom Observation Protocol for Undergraduate STEM (COPUS): a New Instrument to Characterize University STEM Classroom Practices. CBE—Life Sci. Educ. 2013, 12 (4), 618-627.