
MULTI-DISCIPLINARY DESIGN INVESTIGATION OF PROPULSIVE...
15
1 MULTI-DISCIPLINARY DESIGN INVESTIGATION OF PROPULSIVE FUSELAGE AIRCRAFT CONCEPTS JULIAN BIJEWITZ, ARNE SEITZ and MIRKO HORNUNG Bauhaus Luftfahrt e.V., Lyonel-Feininger-Straße 28 80807 Munich, Germany [email protected] www.bauhaus-luftfahrt.net Abstract Motivated by the potential of gaining noticeable improvements in vehicular efficiency, the benefits attainable from introducing a more synergistic integration of the propulsion system to the airframe is investigated in this paper. In previous work, the concept of a boundary layer ingesting propulsor encircling the aft section of an axisymmetric fuselage was identified to be particularly promising for the realization of aircraft wake filling, and hence, a significant reduction of the propulsive power required. After reviewing the theoretical foundation of the Propulsive Fuselage concept, a book-keeping and model matching procedure was introduced, which was subsequently used to incorporate the numerical aerodynamic characteristics of a Propulsive Fuselage aircraft configuration into a propulsion system sizing and performance model. As part of this, design heuristics for important characteristics intrinsic to Propulsive Fuselage power plants are derived. Thereafter, parametric study results of the propulsion system are discussed and the obtained characteristics are compared to those of a conventionally installed power plant. Finally, the impact of the investigated propulsion system on the integrated performance of a Propulsive Fuselage aircraft concept is studied, and the results are compared and contrasted to previously conducted analyses based on semi-empirical characteristics. Keywords Distributed Propulsion, Propulsive Fuselage, Boundary Layer Ingestion, Aircraft Wake Filling, Conceptual Aircraft Design 1. Introduction In order to close the gap between the ambitious long-term environmental targets outlined by the European Commission (EC, 2011; ACARE, 2012) and the improvements attainable from incremental enhancement of conventional technology, an exploration of the efficiency potentials and feasibility of novel options for propulsion system design and synergistic aircraft integration is highly warranted. Particular aircraft-level benefits are expected from the prospect of distributing the production of thrust along main components of the airframe, i.e. distributed propulsion (Kim, 2010). A most promising concept for distributed propulsion is the “Propulsive Fuselage” (PF) concept (Steiner et al., 2012), which is currently subject to a multi-disciplinary investigation in the EU-funded Level 0 project “DisPURSAL” (Isikveren, 2012; Isikveren et al., 2014). Key element of the concept is a single large propulsor encircling the aft part of a cylindrical fuselage with intent to ingest the fuselage boundary layer, thereby allowing for aircraft wake filling to the greatest extent. A number of variations of the general PF idea can be found in the literature (Bolonkin, 1999; Stückl, 2012; Schwarze, 2013). Seitz and Gologan (2013, 2014) introduced a unified book-keeping scheme of system-level efficiency figures applicable to highly integrated boundary layer ingesting propulsion systems and conducted an initial sizing study based on semi-empirical modelling of the fuselage boundary layer ingestion (BLI). Kaiser et al. (2014) introduced a set of quasi-analytical aerodynamic methods for efficient exploration of PF configurations. Seitz et al. (2014) focused on the conceptualization and preliminary sizing of a PF aircraft layout and identified a best and balanced design yielding an increase in vehicular efficiency of approximately 10% compared to an advanced reference aircraft targeting year 2035 Entry-into-Service (EIS). In the present paper, a procedure for the incorporation of numerical aerodynamic characteristics of a PF configuration into a propulsion system design model is introduced. Based hereon, parametric design studies of a
Transcript of MULTI-DISCIPLINARY DESIGN INVESTIGATION OF PROPULSIVE...

1
MULTI-DISCIPLINARY DESIGN INVESTIGATION OF PROPULSIVE FUSELAGE
AIRCRAFT CONCEPTS
JULIAN BIJEWITZ, ARNE SEITZ and MIRKO HORNUNG
Bauhaus Luftfahrt e.V., Lyonel-Feininger-Straße 28
80807 Munich, Germany
www.bauhaus-luftfahrt.net
Abstract
Motivated by the potential of gaining noticeable improvements in vehicular efficiency, the benefits attainable from introducing a more
synergistic integration of the propulsion system to the airframe is investigated in this paper. In previous work, the concept of a
boundary layer ingesting propulsor encircling the aft section of an axisymmetric fuselage was identified to be particularly promising for
the realization of aircraft wake filling, and hence, a significant reduction of the propulsive power required. After reviewing the
theoretical foundation of the Propulsive Fuselage concept, a book-keeping and model matching procedure was introduced, which was
subsequently used to incorporate the numerical aerodynamic characteristics of a Propulsive Fuselage aircraft configuration into a
propulsion system sizing and performance model. As part of this, design heuristics for important characteristics intrinsic to Propulsive
Fuselage power plants are derived. Thereafter, parametric study results of the propulsion system are discussed and the obtained
characteristics are compared to those of a conventionally installed power plant. Finally, the impact of the investigated propulsion
system on the integrated performance of a Propulsive Fuselage aircraft concept is studied, and the results are compared and contrasted
to previously conducted analyses based on semi-empirical characteristics.
Keywords Distributed Propulsion, Propulsive Fuselage, Boundary Layer Ingestion, Aircraft Wake Filling, Conceptual Aircraft Design
1. Introduction
In order to close the gap between the ambitious long-term environmental targets outlined by the European
Commission (EC, 2011; ACARE, 2012) and the improvements attainable from incremental enhancement of
conventional technology, an exploration of the efficiency potentials and feasibility of novel options for
propulsion system design and synergistic aircraft integration is highly warranted.
Particular aircraft-level benefits are expected from the prospect of distributing the production of thrust along
main components of the airframe, i.e. distributed propulsion (Kim, 2010). A most promising concept for
distributed propulsion is the “Propulsive Fuselage” (PF) concept (Steiner et al., 2012), which is currently subject
to a multi-disciplinary investigation in the EU-funded Level 0 project “DisPURSAL” (Isikveren, 2012; Isikveren
et al., 2014). Key element of the concept is a single large propulsor encircling the aft part of a cylindrical
fuselage with intent to ingest the fuselage boundary layer, thereby allowing for aircraft wake filling to the
greatest extent. A number of variations of the general PF idea can be found in the literature (Bolonkin, 1999;
Stückl, 2012; Schwarze, 2013).
Seitz and Gologan (2013, 2014) introduced a unified book-keeping scheme of system-level efficiency figures
applicable to highly integrated boundary layer ingesting propulsion systems and conducted an initial sizing study
based on semi-empirical modelling of the fuselage boundary layer ingestion (BLI). Kaiser et al. (2014)
introduced a set of quasi-analytical aerodynamic methods for efficient exploration of PF configurations. Seitz et
al. (2014) focused on the conceptualization and preliminary sizing of a PF aircraft layout and identified a best
and balanced design yielding an increase in vehicular efficiency of approximately 10% compared to an advanced
reference aircraft targeting year 2035 Entry-into-Service (EIS).
In the present paper, a procedure for the incorporation of numerical aerodynamic characteristics of a PF
configuration into a propulsion system design model is introduced. Based hereon, parametric design studies of a

J. Bijewitz, A. Seitz and M. Hornung
2
PF power plant are presented and discussed. Finally, the suitability of the method for analyses at integrated
vehicular level is demonstrated.
2. Theoretical Basis
This section provides a brief overview of the general implementation of the PF concept and the associated
propulsion system. Important metrics for performance assessment of boundary layer ingesting and conventional
power plants, as well as evaluation of the vehicular efficiency are reviewed.
2.1. The Propulsive Fuselage concept
In Figure 1, a PF integration concept as selected in (Seitz et al., 2014; Isikveren et al., 2014) is presented. The
configuration is based on a three-engine layout. The aft-installed power plant is primarily intended to serve the
purpose of wake filling, while conventionally installed turbofans deliver the residual thrust required to operate
the aircraft. By ingesting the fuselage boundary layer and re-energizing the momentum deficit in the aircraft
viscous wake caused by skin friction on the wetted fuselage surface, a reduction of propulsive power can be
attained (Seitz and Gologan, 2014). In the investigated concept, the so-called Fuselage Fan, FF, installed at the
aft of the fuselage is driven by a turbo engine installed in the fuselage aft cone, which is supplied with air
through an s-shaped inlet duct installed downstream of the FF (see Figure 1, right). The FF is powered by the
Low Pressure Turbine, LPT, via a planetary reduction gear system. Further key aspects of the propulsion system
concept, in particular regarding integration aspects, are discussed in detail by Seitz et al. (2014). In view of a
potential Entry-Into-Service, EIS, year 2035, technology freeze was set as 2030.
Fuselage Fan
Gas turbine
installation
position
x
z
FuselageFan Rotor
IntakeStrut
Fan StatorVertical Tail
S-duct (Core Intake)
Core Exhaust
Fuselage Fan Drive Gear System
Booster
High PressureCompressor
High PressureTurbine
Low PressureTurbine
Figure 1: Propulsive Fuselage aircraft concept (left, adopted from Isikveren et al., 2014) and Fuselage Fan propulsion system (right)
2.2. Review of metrics for performance evaluation
For consistent treatment of conventionally installed, i.e. under wing podded, and highly integrated propulsion
systems such as the PF concept, the definition of unified efficiency standards is required. Seitz and Gologan
(2014) introduced a scheme for the definition of propulsion system efficiency figures applicable to conventional
and FF power plants. Here, the interface of thrust/drag book-keeping between the propulsion system and the
airframe is geared to the propulsion system streamtube. Hence, all aerodynamic effects in the streamtube ahead
of the FF inlet are incorporated in the power plant sizing and performance analysis. As will be shown later in the
paper, the breakdown of overall propulsion system efficiency, ηov, into the three individual contributors, i.e. the
core efficiency, ηco, the transmission efficiency, ηtr, and the propulsive efficiency, ηpr, is convenient in order to
identify the impact of BLI on power plant performance:
prtrco
Supply
N
Supply
Thrustov
P
VF
P
P
0 (1)
where FN denotes the net thrust and V0 the free stream velocity. A detailed discussion of the individual
efficiencies in the context of the PF concept is provided by Seitz and Gologan (2013, 2014). Nacelle external
aerodynamics are considered to belong to the aircraft characteristics, thus influencing the thrust required to
operate the aircraft. The amount of aircraft drag captured inside the propulsion system streamtube and hence

Multi-Disciplinary Design Investigation of Propulsive Fuselage Aircraft Concepts
3
taken as being removed from the aircraft drag balance, Ding, is described using the ingested drag ratio (cf. Steiner
et al., 2012),
tN
ing
F
D
,
(2)
where FN,t represents the total net thrust required for aircraft operation. The assessment of vehicular performance
may be performed using the Energy Specific Air Range, ESAR, indicating the change of aircraft range, R, per
change of energy, E (cf. Seitz et al., 2012):
gm
DL
gmTSPC
DLV
dE
dRESAR
CA
ov
CA
//
0 // (3)
including the aircraft aerodynamic efficiency, L/D, its mass, mA/C, and the propulsion system overall efficiency.
3. Book-keeping and Matching Procedure for Propulsive Fuselage Concept
The present section firstly summarizes the setup used for the numerical calculations of the PF concept.
Thereafter, the method used for modeling of the FF propulsion system is discussed and a procedure for the
matching of CFD results with gas turbine performance calculations is introduced.
3.1. Description of the CFD setup
An essential task associated with a PF concept refers to the aerodynamic assessment of the airframe-propulsion
integration. During the research activities associated with the DisPURSAL Project, numerical flow computations
of the PF configuration were performed by the French research institute Office National d'Études et de
Recherches Aérospatiales, ONERA (Isikveren et al., 2014). An overview of the institute’s expertise in this field
including the validation of the aero-numerical methods applied in the present context can be found in (Atinault et
al., 2013). Pursuing the purpose of an initial design space exploration, two-dimensional RANS calculations of an
axisymmetric arrangement comprising the fuselage and the FF nacelle were conducted for a representative cruise
condition (FL350, M0.80). Hence, the flow received into the FF inlet is assumed to be orthogonal to the fan
vertical plane. The pressure increase due to the FF power plant was simulated using an appropriately adapted
actuator disk model. Potential detrimental interference emanating from the vertical tail attachment disregarded in
the CFD analysis was accounted for in the aircraft sizing studies using an appropriately selected interference
factor. A detailed description of the computational setup, imposed assumptions and main results is given in
(Isikveren et al., 2014). Aerodynamic computations were conducted for a number of PF power plant designs
based on an experimental plan designed by Bauhaus Luftfahrt. The correspondingly investigated PF geometries
were generated by Airbus Group Innovations, AGI. For each geometric configuration, a number of FF rotational
speeds were simulated in order to examine different power settings. Important results relevant for aircraft and
propulsion system sizing such as performance parameters, flow Mach numbers and pressure ratios were fed back
to Bauhaus Luftfahrt for further data analysis and subsequent system sizing. As part of the CFD data post-
processing, a common design axial fan inlet Mach number, Max,2,des, was identified for the sampled PF designs.
Max,2,des typically constitutes an important similarity parameter for gas turbine sizing and performance mapping.
Based on an interpolation of the mass flow averaged fan inlet Mach numbers of the simulated PF designs at
different power settings, Max,2,des = 0.56 was identified suitable in order to ensure PF design similarity. This fan
inlet Mach number is approximately 20% below the value typical for conventionally installed advanced turbofan
propulsion systems (Grieb, 2004).
3.2. Modeling of the propulsion system
For propulsion system sizing and performance simulation the gas turbine performance software GasTurb®11
(Kurzke, 2010) was utilized. For cycle and flow path sizing typical design laws based on Seitz (2012) and Grieb
(2004) were applied including iteration of design net thrust, Overall Pressure Ratio (OPR), outer and inner Fan
Pressure Ratios (FPR), fan tip speed as well as nozzle gross thrust and discharge coefficients. Consistent settings

J. Bijewitz, A. Seitz and M. Hornung
4
for the parametric mapping of High Pressure Turbine (HPT) cooling air demand as a function of hot gas, bulk
material and cooling air temperature were implemented using the approach given by Seitz (2012). Turbo
component efficiencies, basic cycle characteristics as well as duct pressure losses were adjusted in order to
reflect an EIS of year 2035. Technology settings were retained constant throughout the studies performed. A best
and balanced OPR was determined with respect to Turbine Entry Temperature (TET) at take-off and
corresponding cooling air demand. Compressor work split was chosen to allow for uncooled LPTs. In the first
instance, core size effects on the efficiency of turbo components were neglected. Gearbox losses intrinsic to a
Geared Turbofan (GTF) architecture were incorporated in the mechanical losses of the low pressure spool.
Propulsion system dimensions and weight estimation referred to a component build-up approach described in
detail in (Seitz, 2012). The estimation of propulsor drive gearbox masses was based on Reynolds (1985),
however, calibrated to reflect advanced technology status. Since the FF features a very high hub-to-tip ratio
compared to podded fan designs, the weight of the FF module was estimated using the method described in
(Steiner et al., 2012). For the fans of both the podded power plants and the FF propulsion system a material mix
consisting of 20% titanium and 80% CFRP was chosen corresponding to advanced technology standard (Seitz et
al., 2014).
For the modelling of the FF propulsion system, a number of adjustments relative to the reference power plant
were required. The fan hub-to-tip ratio was iterated according to the duct height and the prescribed hub radius,
which was assumed to equal the fuselage radius at the given axial position. Due to the high hub-to-tip ratio of the
FF compared to conventionally installed power plants, outer and inner fan pressure ratios were assumed to be
identical.
3.3. Matching of CFD and system performance prediction
The following sections initially provide an overview of the design space investigated in the present context.
Furthermore, the approach for the mapping of key characteristics associated with the integration of the FF
propulsion system is discussed.
3.2.1 Investigated design space
In order to maximize computational throughput, emphasis was placed on investigating the impact of the most
important free variables applicable to a FF power plant design. Apart from the FF inlet duct height, which has
been identified as an essential design variable (cf. Seitz and Gologan, 2014; Seitz et al., 2014), FPR was
considered important, since it governs the level of specific thrust produced by the power plant and is, therefore
directly related to ηpr. While for given duct heights specific values were prescribed explicitly for the aero-
numerical analyses, FPR was set implicitly by specifying the required nozzle exit area obtained from initial
GasTurb® calculations. As a first step, an initial geometry was optimized in a multi-disciplinary design effort
according to the workflow described in detail by Isikveren et al. (2014). Here, particular emphasis was placed on
the identification of an optimum FF nacelle shape for minimum intake spillage drag, and, the optimization of the
fuselage body contour in front of the FF in order to avoide unfavorable flow conditions such as localized
supervelocities or flow separation. Using this optimized configuration, a design space exploration of the
described parameters was performed. The feasible range of duct heights at the Aerodynamic Interface Plane
(AIP), hAIP, was chosen from 0.50 m to 0.90 m. Due to the employed actuator disc model, FPR was limited to
1.50. For the lower feasible bound, a value of 1.20 was selected. During the investigations, the distribution of
design points was continuously subject to adaptation based on the results obtained for each previous design
point. Fuselage shaping was retained as defined during the initial optimization (denoted as D0). Also, the general
nacelle parameterization was kept invariant, in the first instance, and a constant offset between the tip radii at the
AIP, and the first actuator disk was implemented. Based hereon, five additional design points (D1 through D5)
were evaluated through CFD and used for the subsequent derivation of propulsion system (PPS) sizing and
performance heuristics. The computed designs were distributed in the design space as given in Figure 2.

Multi-Disciplinary Design Investigation of Propulsive Fuselage Aircraft Concepts
5
1.2 1.3 1.4 1.5 1.60.4
0.6
0.8
1
D0
D1
D2
D3
D4
D5
Du
ct
He
ight
at
AIP
(h
AIP
) [m
]Design Fan Pressure Ratio (FPR) [-] Figure 2: Investigated design space
3.2.2 Matching procedure
Exploration of the PF design across the entire feasible design space requires a propulsion system model capable
of reflecting the system behavior within the corresponding range of design parameters. In order to enable
continuous power plant calculations over a wide range of design parameters, the results derived from the aero-
numerical experimentation described above and the subsequent post-processing procedure were used for
adaptation of the PF sizing and performance model simulated in GasTurb®. The scope of the GasTurb
® model
was tailored to cover all streamtube effects for the FF power plant system (cf. Seitz and Gologan, 2014). Now,
the target of the matching procedure was to incorporate the physical effects derived from the aero-numerical
analysis, such that the response of the GasTurb® model is consistent with the CFD results obtained for the
sample points (D0, D1 through D5). Therefore, regression models were derived for important parameters affected
by the present application, such as the intake pressure ratio (pt2/pt0). Subsequently, these heuristics were
integrated to the propulsion system design and performance model which was finally wrapped for aircraft-
integrated simulation using surrogate modelling techniques. The employed workflow is schematically presented
in Figure 3.
Nonlinear Regression of
derived parameters
(MATLAB®)
PPS Design Model
matched to Aero-
numerical data
(GasTurb®11)
Aero-numerical Data
(Isikveren et al., 2014)
Semi-empirical Boundary
Layer Method (Based on
Seitz and Gologan, 2014)
Parametric PPS Design
Studies
(GasTurb®11)
Verification
PPS Surrogate
Modelling
(Seitz, 2012)
Figure 3: Procedure used for CFD and gas turbine performance matching
3.2.3 Modelling of intake pressure ratio
As a consequence of the momentum deficit formed by fuselage skin friction in front of the intake of a PF
arrangement, the total pressure at the intake is decreased relative to the total pressure at undisturbed free stream
velocity. Hence, the intake total pressure ratio is degraded compared to a conventionally installed power plant.
Depending on the specific geometry investigated, the impact on the pressure ratio can be significant (Seitz and
Gologan, 2014).

J. Bijewitz, A. Seitz and M. Hornung
6
As hAIP and FPR constituted the variables investigated in the aero-numerical investigation, the influence of
these parameters on pt2/pt0 was investigated. As recognized in a previous investigation (Seitz and Gologan,
2014), pt2/pt0 was found to be highly sensitive with hAIP. In contrast to that, the dependence on design FPR was
identified to be small. Hence, only the sensitivity of pt2/pt0 with duct height was included in the approximation
model, which was based on a polynomial approach and is presented in Figure 4. The maximum approximation
error was 0.17%, while the mean error was 0.12%. The model is considered valid for duct heights between 0.3 m
and 1.1 m. The derived correlation is included in the figure.
0.5 0.55 0.6 0.65 0.7 0.75 0.8 0.85 0.9 0.950.84
0.85
0.86
0.87
0.88
0.89
0.9
0.91
0.92
D0
D1
D2
D3
D4
D5
Duct Height at AIP (hAIP
) [m]
Inta
ke
Pre
ssu
re R
atio
(p
t2/p
t0)
[-]
Study Settings:
Operating Condition: FL350, M0.80, ISA
Fuselage Geometry acc. to Isikveren et al. (2014)
Rel. Longitudinal Position of AIP: 85%
Fuselage Length: 69 m
Fuselage Equivalent Diameter: 6.07 m
Data points obtained from CFD analysis
Polynomial Approx.: pt2
/pt0
= 0.767 + 0.221*hAIP
- 0.081*hAIP
2, valid in h
AIP = [0.5m, 0.9m]
Figure 4: Implemented approximation model for intake pressure ratio
The sensitivity of flight Mach number was only analyzed for the investigation associated with the initially
optimized geometry (D0). In order to still allow for a parametric mapping of flight Mach number, the sensitivity
obtained from the D0 design was considered representative, in the first instance. From that, normalized scaling
factors were determined and introduced into the model given in Figure 4. The obtained trend causes the pressure
recovery to decrease slightly for increasing flight Mach numbers, M0. This is intuitive as the intake total pressure
ratio of a boundary layer ingesting power plant is dominated by the ratio of the mean total pressure at the intake,
pt1, and the respective value at free stream condition, pt0. This may be expressed through an equivalent isentropic
ram pressure recovery factor (cf. Seitz and Gologan, 2014):
120
012,1
1
0
1 0
0
1
1
2
11
2
11
MM
p
pm
t
t (4)
where M1,m represents the mean intake Mach number. Despite the fact that the boundary layer thickness
decreases with increasing free stream Mach numbers, and hence pt1 tends to increase, the effect is
overcompensated by the strong correlation between pt0 and M0.
3.2.4 Mapping of integration losses
An important implication associated with a PF configuration refers to the additional drag effects caused by the
presence of the FF power plant at the aft fuselage. The CFD-based design space exploration had shown that FF
intake spillage drag is highly sensitive to both fuselage and nacelle contour definition. Beyond that, the FF
nozzle shear flow across the fuselage aft-cone creates additional drag. As the setup for the aero-numerical
computation did not facilitate a component based analysis of the individual drag effects, a conversion procedure

Multi-Disciplinary Design Investigation of Propulsive Fuselage Aircraft Concepts
7
was employed in order to identify the individual contributors to the overall thrust/drag balance. The matching
procedure applied for a consistent transformation of thrust values and the quantification of integration drag
effects is briefly outlined below. Therefore, in Figure 5 a scheme of a generic PF layout is depicted indicating the
propulsion system streamtube, the fuselage boundary layer, as well as forces and corresponding control volumes,
thus illustrating the thrust/drag book-keeping used in the present context.
Propulsion System Streamtube
DNac
AIP
2 13 18
Fuselage Drag Ingested (DFus,ing)
Fuselage Drag not Ingested (DFus, not ing)
Drag due to Jet Shear Flow (Djsf)
Fuselage Body
Fuselage Boundary Layer
Boundary Layer
Velocity Profile
DFus,not ing
DFus, ing
Djsf
Thermodynamic Station Numbering
Thrust of Propulsor
Nacelle DragDNac
0
Control Volume
Figure 5: Scheme used for thrust/drag book-keeping
The definition of net thrust measured in the frame of reference used for the CFD simulation, NF̂ , is given by the
thrust produced by the actuator disks, F̂ , reduced by the drag of the configuration accounted for in the CFD:
DFFN
ˆˆˆ (5)
where variables denoted with the hat symbol indicate parameters referring to CFD calculations. In the context of
the CFD setup, the fuselage drag, DFus, the nacelle drag, DNac, as well as jet shear flow losses occurring at the
fuselage aft-cone, Djsf, constitute the contributors to D̂ . Thus, equation (5) yields:
jsfFusNacN DDDFF ˆˆ (6)
Depending on the boundary layer thickness and the duct height of the propulsor, not necessarily the entire
fuselage viscous drag is ingested into the propulsive device. Hence, the fuselage drag may be split up into:
ingnotFusingFusFus DDD ,, (7)
where DFus,ing represents the fuselage drag share that is ingested into the propulsive device, while DFus,not ing
constitutes the outer part of the fuselage viscous flow field that is spilled around the nacelle, e.g. in case the
intake duct height is smaller than the boundary layer thickness at the intake position. Substituting equation (7)
into equation (6) produces:
jsfingnotFusingFusNacN DDDDFF ,,ˆˆ (8)
Since the individual contributors to D̂ including DFus and DNac were not available from CFD results, these were
parametrically determined based on the approach given by Raymer (2006). As a plausibility check, DFus was
compared to the corresponding CFD result obtained for the clean fuselage geometry which yielded good

J. Bijewitz, A. Seitz and M. Hornung
8
agreement (order of +1% deviation). As it is of interest to quantify the fuselage drag share that is actually
ingested into the FF, a semi-empirical boundary layer method based on Seitz and Gologan (2014) was utilized.
Here, numerically computed boundary layer results derived for a generic elliptical fuselage geometry (van Dyck,
2012) had been employed. In order to account for the contraction of the fuselage towards the FF intake as
considered in the present configuration, the boundary layer thickness obtained from the semi-empirical model
was calibrated with the respective value measured from the newly obtained CFD results.
The approach for calculating the fuselage drag share that is not ingested is based on the decomposition of the
incoming flow into different shares of fluid momentum. In Figure 6, a boundary layer profile is schematically
shown for a case where the intake duct height is smaller than the boundary layer thickness. The momentum of
the complete boundary layer (profile assumed to be developed until 99% V0) is approximated through the
product of area averaged mean intake velocity, V1,m, and the mass flow that is captured in the corresponding
layer, 1m :
1,1 mVI m (9)
The shares corresponding to the momentum that is ingested into the propulsive device, Iing, as well as the
momentum that is passing around the FF nacelle, Inot ing, may be expressed in a similar fashion. The term I0
represents the momentum equivalent to free stream condition (V0).
Inta
ke D
uct H
eig
ht
Boundary
Layer
Thic
kness
Momentum share of complete
boundary layer (Iδ)
Ingested momentum share of
boundary layer (Iing)
Momentum share not ingested (Inot ing)Momentum share equivalent to free
stream condition (I0)
u
y
Free stream momentum extending to
intake duct height (I0,h)
Figure 6: Scheme indicating momentum shares associated with the Fuselage Fan inflow
As can be seen from Figure 6, the share that is not ingested is given by:
)( ,00 inghingnot IIIII (10)
where I0,h represents the share of the free stream momentum extending only to the intake duct height. From this,
an ingestion factor, fβ, may be defined measuring the share of fuselage drag ingested into the propulsor relative
to the complete ingestion:
intake
ingnot
intake
hII
I
h
f,1
,0.1
0
(11)

Multi-Disciplinary Design Investigation of Propulsive Fuselage Aircraft Concepts
9
Hence, the fuselage drag that is ingested into the FF in equation (8) is given by DFus,ing = fβ ∙ DFus. Knowing the
thrust produced by the propulsor ( F̂ ) as well as the individual contributors to the overall drag, equation (8) may
be rearranged to determine the drag effect caused by nozzle jet shear flow:
NingnotFusingFusNacjsf FDDDFD ˆˆ,, (12)
In gas turbine design and performance, losses occurring in the propulsion system streamtube upstream and
downstream of the engine, are typically accounted for in the thrust calculation using an adequate streamtube
factor (cf. Seitz, 2012). For highly integrated propulsion system arrangements as considered in the present
context, this factor incorporates all effects occurring due to installation of the FF propulsion system and hence
correlates the isolated gas turbine performance to the respective values obtained for the integrated arrangement.
Thus, it is convenient to introduce an integration factor, fint, which not only captures the fuselage drag spilled
around the FF nacelle, but also covers additional effects caused by the integration of the FF propulsion system.
These include, e.g. friction losses associated with nozzle shear flow at the fuselage aft-cone. Accordingly, for
input settings corresponding to the CFD setup, the net thrust obtained from the gas turbine model, FN,calc, is
overestimating the value NF̂ yielded from equation (8), since yet none of the integration effects named above are
included in FN,calc. The integration factor quantifying these losses is declared as:
0.1ˆ
,
N
calcN
intF
Ff (13)
The sum of all losses occurring due to FF integration may be considered as an additional contribution to the
overall drag balance:
NintNintNintNcalcN FfFfFDFF ˆˆ)1(ˆˆ, (14)
where Dint denotes the drag due to the FF integration. As can be seen, this is consistent with the inequality
constraint formulated in equation (13).
Using the sample designs indicated in Figure 2, a nonlinear two-dimensional regression model was derived
featuring sensitivity with the inlet duct height at the Aerodynamic Interface Plane (AIP, see Figure 5), hAIP, and
the design fan pressure ratio, pt13/pt2. The root mean squared error between the sample points and the
corresponding model approximation was 0.6%, while the maximum occurred error was +0.9%. The resulting
correlation is defined as:
14.1
0.1
2
13 139.0765.1033.0797.0
AIPAIP
t
tint hh
p
pf , hAIP in [m] (15)
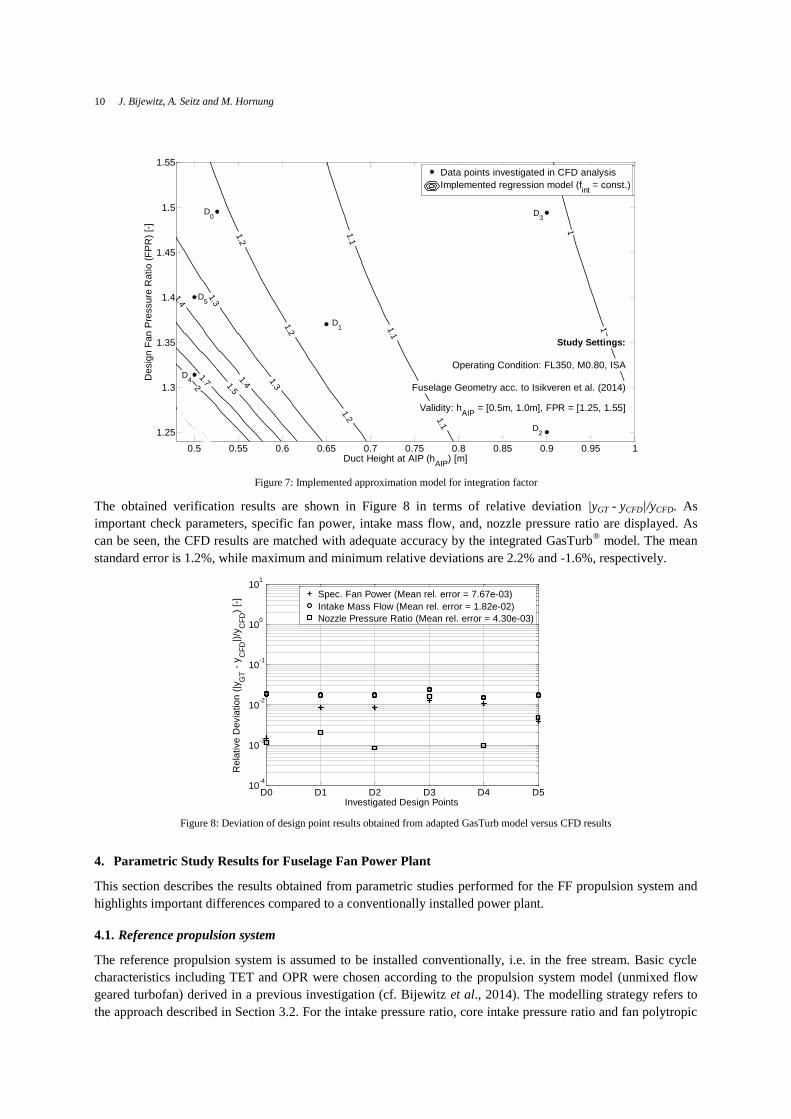
A contour plot showing lines of constant fint as a function of hAIP and FPR is presented in Figure 7. It was found
that fint is primarily dependent on the size of the propulsor intake. Here, the dominating effect is rooted in the
increase of the portion of the fuselage drag that is not ingested but spilled around the nacelle as the duct height is
decreased. In addition, decreasing duct heights cause increased interaction between the flow field around the
nacelle stagnation point and the FF inflow field. The dependence of fint on FPR is only modest. As can be seen
from Figure 7, increasing FPR yields improvement of fint, which is considered to be caused by an increased
suction effect of the FF, and thus reduced intake spillage drag for growing FPR.
Based on the derived approximation models, iterative design laws were subsequently integrated into the
GasTurb® propulsion system sizing and performance suite. In order to evaluate the quality of the implemented
approach, the results obtained for a representative set of parameters using the adapted gas turbine model (yGT)
were compared to the respective values available from the CFD computations (yCFD).
J. Bijewitz, A. Seitz and M. Hornung
10
1
1
1.1
1.1
1.1
1.2
1.2
1.2
1.3
1.3
1.4
1.41.5
1.72
De
sig
n F
an
Pre
ssu
re R
atio
(F
PR
) [-
]
Duct Height at AIP (hAIP
) [m]
D0
D1
D2
D3
D4
D5
Study Settings:
Operating Condition: FL350, M0.80, ISA
Fuselage Geometry acc. to Isikveren et al. (2014)
Validity: hAIP
= [0.5m, 1.0m], FPR = [1.25, 1.55]
0.5 0.55 0.6 0.65 0.7 0.75 0.8 0.85 0.9 0.95 1
1.25
1.3
1.35
1.4
1.45
1.5
1.55Data points investigated in CFD analysis
Implemented regression model (fint
= const.)
Figure 7: Implemented approximation model for integration factor
The obtained verification results are shown in Figure 8 in terms of relative deviation |yGT - yCFD|/yCFD. As
important check parameters, specific fan power, intake mass flow, and, nozzle pressure ratio are displayed. As
can be seen, the CFD results are matched with adequate accuracy by the integrated GasTurb® model. The mean
standard error is 1.2%, while maximum and minimum relative deviations are 2.2% and -1.6%, respectively.
D0 D1 D2 D3 D4 D510
-4
10-3
10-2
10-1
100
101
Investigated Design Points
Re
lative
De
via
tio
n (
|yG
T -
yC
FD
|)/y
CF
D)
[-]
Spec. Fan Power (Mean rel. error = 7.67e-03)
Intake Mass Flow (Mean rel. error = 1.82e-02)
Nozzle Pressure Ratio (Mean rel. error = 4.30e-03)
Figure 8: Deviation of design point results obtained from adapted GasTurb model versus CFD results
4. Parametric Study Results for Fuselage Fan Power Plant
This section describes the results obtained from parametric studies performed for the FF propulsion system and
highlights important differences compared to a conventionally installed power plant.
4.1. Reference propulsion system
The reference propulsion system is assumed to be installed conventionally, i.e. in the free stream. Basic cycle
characteristics including TET and OPR were chosen according to the propulsion system model (unmixed flow
geared turbofan) derived in a previous investigation (cf. Bijewitz et al., 2014). The modelling strategy refers to
the approach described in Section 3.2. For the intake pressure ratio, core intake pressure ratio and fan polytropic

Multi-Disciplinary Design Investigation of Propulsive Fuselage Aircraft Concepts
11
efficiency, typical values corresponding to the advanced technology status were applied. A synopsis of essential
parameters is provided in Table 1.
4.2. Discussion of study results
In order to ensure a consistent comparison against the reference power plant, OPR and TET were kept identical.
Further design parameters were selected as given in Table 1. In order to account for the expected degradation of
fan performance emanating from the disturbed, non-uniform inflow condition, fan polytropic efficiency was
assumed to be reduced by 2.0 percentage points (Seitz et al., 2014).
Table 1: Settings for power plant design studies
Parameter Unit Reference PPS Fuselage Fan PPS
Turbine Entry Temperature (T4) a [K] 1750 1750
Overall Pressure Ratio (OPR) a [-] 60.0 60.0
Axial Fan Inlet Mach number (Max,2) [-] 0.70 0.56
Fan Inlet Hub/Tip Ratio (HTR2) [-] 0.29 Iterated acc. to intake duct height
Intake Pressure Ratio (pt2/pt0) [-] 0.997 Iterated acc. to Figure 4
Core Intake Pressure Ratio (pt22/pt21) [-] 0.990 0.97
Fan polytropic efficiency (ηFan) [-] Base -0.02 a Max. Climb at Top-of-Climb (FL350, M0.80, ISA)
In Figure 9, the characteristics of a sizing study are presented for both the reference propulsion system and
the FF power plant. Here, specific thrust was varied for different values of net thrust requirement. Overall
efficiency (ηov) was selected as a metric for comparison against the reference. The abscissa displays the intake
area (A2). As can be seen, the reference propulsion system exhibits no sensitivity between ηov and net thrust, thus
reflecting the assumption of invariant component efficiencies as well as zero secondary power and customer
bleed air extraction. As expected, decreasing levels of specific thrust yield improvements in propulsive
efficiency, which are, however, incrementally compensated by decreasing levels of transmission efficiency,
thereby causing the contours of constant overall efficiency to converge towards the lower end of FN/W2 shown.
In contrast to the reference engine, the FF power plant shows a significant dependency of overall efficiency with
net thrust. This is primarily caused by the influence of the inlet duct height on the intake pressure ratio, whose
characteristics are included in Figure 9 using dashed contour lines. As can be seen, the identified trend of pt2/pt0
presented in Figure 4 is also reflected in the power plant model. Counterintuitively, for constant net thrust,
reduced levels of specific thrust yield decreasing values of ηov within the range of parameters studied.
2 4 6 8 10 12 14
0.25
0.3
0.35
0.4
0.45
15
25
35
45
5565
Net Thrust [kN]
8575
65
55
45
35
Spec. Thrust FN/W
2 [m/s]
0.8
3
0.8
4
0.8
5
0.8
6
0.8
7 0.8
8 0.8
9 0.9
0.9
1
Fuselage Fan Propulsion System
Intake Pressure Ratio [-]
Intake Area (A2) [m
2]
Overa
ll E
ffic
iency (
ov)
[-]
655545352515
Net Thrust [kN]
105
8565
Spec. Thrust (FN/W
2) [m/s]
2.0 2.5 3.0 3.5
Underwing Podded Geared Turbofan
Fan Diameter [m]
Study Settings:
Technology Level: EIS 2035
Operation Conditions: FL350, M0.80, ISA
Reference PPS: pt2
/pt0
= 0.997
Zero Off-take/Customer Bleed Scenario
Figure 9: Design study for Fuselage Fan and reference propulsion system

J. Bijewitz, A. Seitz and M. Hornung
12
In order to deeper explore this behavior, a detailed analysis of the FF propulsion system was conducted and
the characteristics are given in Figure 10, where contours of net thrust and specific thrust are presented as a
function of design fan pressure ratio and the intake duct height at the fan plane. As a consequence of the above
illustrated strong dependence of the characteristics with propulsor size, the improving intake pressure ratio yields
decreasing fan pressure ratios for equal specific thrust levels. As can be seen, decreasing values of specific thrust
cause the transmission efficiency to degrade. As an inherent characteristic of ducted propulsive devices, the
impact of pressure losses in the transmission system scales inversely proportional to FN/W2. While for the
reference power plant the increase in propulsive efficiency still yields increasing propulsive device efficiencies
(ηpd = ηtr × ηpr) (which propagates to increased overall efficiencies) within the range of FN/W2 values investigated,
the increased stream tube losses of the FF power plant exceed the respective losses occurring for the free stream
case, i.e. podded power plants. Hence, the transmission efficiency is penalized more severely, thereby
counteracting the improvement of propulsive efficiency stronger than for the reference case. This behavior
reflects the findings gained from a previously conducted PF investigation (Seitz and Gologan, 2014).
0.2 0.3 0.4 0.5 0.6 0.7 0.8 0.9 1 1.1 1.21.2
1.25
1.3
1.35
1.4
1.45
1.5
1.55
1.6
1.65 15
25
35
4555
65
Net Thrust [kN]85
75
65
55
45
35
Spec. Thrust(F
N/W
2) [m/s]
0.4 0.42 0.44
0.46
0.46
0.48
0.48
0.5
0.5
0.52
0.52
0.54
Intake Duct Height at Fan Plane (h2) [m]
Desig
n F
an P
ressure
Ratio (
FP
R)
[-]
Study Settings:
Technology Level: EIS 2035
Operation Conditions: FL350, M0.80, ISA
Zero Off-take/Customer Bleed Scenario
Transmission Efficiency (tr)
Figure 10: Characteristics of Fuselage Fan Propulsion System
5. Integrated Performance Assessment
As a final step, the impact of the investigated propulsion system characteristics on the integrated performance of
the PF aircraft was studied. Here, emphasis was placed on identifying potential differences relative to a previous
investigation which had been based on pure semi-empirical boundary layer methods (Seitz et al., 2014; Isikveren
et al., 2014). Therefore, surrogate models for convenient mapping of engine design and off-design behavior were
derived for the FF power plant model developed in the present context using the approach described in (Seitz,
2012). For the conceptual sizing and performance evaluation of the PF aircraft, the aircraft conceptual design
methodology discussed in (Seitz, 2012) was employed. Implemented extensions required for the handling of PF
concepts are outlined by Seitz et al. (2014). Generally, in the present context, the aircraft performance evaluation
was conducted for the three-engine aircraft configuration given in Figure 1 for an air transport task of design
range 4800 nm accommodating 340 passengers. In particular, the FF geometric arrangement was retained, which
had been identified as suitable for the PF concept (Seitz et al., 2014). The results were compared to the
characteristics of an advanced twin-engine reference aircraft sized for identical requirements and technology
status, which is discussed in detail in (Seitz et al., 2014).
Maximum wing loadings were retained constant for similar low-speed performance and common wing spans
of 65.0 m were applied to ensure similar airport compatibility. The characteristics of the podded power plants

Multi-Disciplinary Design Investigation of Propulsive Fuselage Aircraft Concepts
13
were adopted unchanged. A common core strategy for the under wing podded and the FF power plants was
implemented, i.e. the thrust split ratio was iterated to yield identical LPT design power outputs for all engines
installed on the PF aircraft. A comparative synopsis of important propulsion system and aircraft related
parameters is provided in Table 2. The FF core intake pressure ratio resulted from a parametric pressure loss
model derived for a generic s-shape geometry, which was based on basic 1D flow relations. Regarding the
weight estimation of the FF power plant, a number of refinements were implemented yielding an improved level
of detail relative to the values predicted in (Seitz et al., 2014). This includes e.g. the parametric mapping of the
weight of the s-duct and the intake structural elements. As can be seen from Table 2, the ingested drag ratio is
significantly increased relative to results obtained from the semi-empirical method. While in Seitz et al. (2014)
additional drag occurring due to the presence of the FF power plant integration was included in the prediction of
ingested drag using a conservatively assumed constant factor, in the present method, integration losses were
directly considered as part of FF power plant sizing via the integration factor, fint, introduced in Section 3.2.4.
Hence, β obtained using the present method is increased and is propagated to an increased apparent lift-to-drag
ratio, while fint contributes to the degraded overall thrust specific fuel consumption (TSFC) relative to the semi-
empirical results. Due to the increased FF power plant weight and resulting vehicular cascade effects, e.g.
increased wing reference area, Operating Weight Empty (OWE) is penalized more strongly than calculated
before. This translates into an increase in Maximum Take-off Weight (MTOW) of 1.2% relative to the reference
aircraft. The substantially reduced aircraft apparent drag still outweighs the BLI-induced degradation of power
plant performance as well as the weight increase primarily caused by the third aft-installed engine. As a
consequence, a block fuel burn reduction of 9.4%, or 10.4% relative improvement in ESAR, is obtained over the
advanced reference aircraft for the selected PF design. The deltas in block fuel and ESAR relative to the
previously obtained results are below 1%. In summary, important aircraft characteristics including the fuel burn
improvement proved to be confirmed against semi-empirical methods.
Table 2: Comparative synopsis of integrated aircraft characteristics using semi-empirical and CFD-derived methods
Parameter Unit Semi-empirical methods
(Seitz et al., 2014) Present method Delta a [%]
FF Inlet Duct Height [m] 0.526 0.526 ±0.0
FF Diameter [m] 4.05 4.05 ±0.0
FF Specific Thrust [m/s] 65.0 61.3 -5.7
FF Intake Pressure Ratio [-] 0.909 0.861 -5.3
FF Core Intake Pressure Ratio [-] 0.970 0.976 +0.6
Delta FF Design Fan Efficiency [-] -0.02 -0.02 ±0.0
FF Propulsion System Weight [kg] 7811 8924 +14.2
Total TSFC at typical cruise c [g/s/kN] 14.3 16.0 +11.9
Ingested Drag Ratio [-] 0.21 0.29 +38.1
Apparent Lift-to-Drag Ratio d [-] 27.3 30.9 +13.2
Wing Reference Area [m2] 335.4 340.0 +1.4
Delta OWE e [%] +3.5 +5.6 +2.1 b
Delta MTOW e [%] +0.1 +1.2 +1.1b
Delta Block Fuel Burn e [%] -8.9 -9.4 -0.5 b
Delta ESAR e [%] +9.8% +10.4 +0.6 b a Results obtained from present method compared to semi-empirical methods b Percentage points c FL350, M0.80, ISA d at CL = 0.55, M0.80 e Relative to advanced reference aircraft (cf. Seitz et al., 2014)
6. Conclusion and Future Work
In this paper, an analytical procedure for the matching of numerically calculated characteristics of a Propulsive
Fuselage layout to the respective propulsion system was discussed. Based on the results of an initial CFD-based
design space exploration, important heuristics specific to a Fuselage Fan propulsion system were identified and
integrated into a power plant sizing and performance model. Thereafter, parametric design studies of the
Fuselage Fan propulsion system were conducted. The results were compared and contrasted to the parametric

J. Bijewitz, A. Seitz and M. Hornung
14
design results of a conventionally installed advanced turbofan architecture. Finally, the implication of the newly
derived design heuristics on the integrated performance of the Propulsive Fuselage aircraft concept was studied.
Here, emphasis was placed on identifying potential differences relative to a previous investigation which had
been based on pure semi-empirical boundary layer methods. As a result, the aircraft-level benefit originally
predicted using semi-empirical methods could be confirmed using the CFD-derived propulsion system
characteristics yielding a fuel burn benefit of -9.4% (or relative improvement in ESAR of +10.4%) over the
advanced reference aircraft.
Future work will focus on a detailed exploration of the design space feasible for a Propulsive Fuselage
aircraft. While the present paper considered a certain split of net thrust between the aft-installed and the podded
power plants, this particularly will include variation of the thrust split. Additionally, the sensitivity of the
investigated Propulsive Fuselage concept to important parameters such as design flight speed or Fuselage Fan
design efficiency will be analyzed. Uncertainties of models and technical assumptions immanent at this early
stage of technology evaluation will be treated using non-deterministic methods. Moreover, future work should
also explore alternative solutions for the integration of fuselage fan power supply. This includes novel ways of
power transmission to the large fuselage propulsor, for example through (hybrid-) electric power train options.
Acknowledgements
The authors would like to thank Dr. Askin T. Isikveren for fruitful discussions and valuable advice. Special
gratitude is conveyed to Richard Grenon and Jean-Luc Godard, ONERA, as well as Stefan Stückl, Airbus Group
Innovations, for their CFD analysis and CAD generation effort, respectively, which was conducted within the
DisPURSAL project. This research was performed within the FP7-L0 project DisPURSAL (Grant Agreement
No. FP7-323013), co-funded by the European Commission.
References
Advisory Council for Aviation Research and Innovation in Europe. (2012). Strategic Research and Innovation Agenda.
Brussels
Atinault, O., Carrier, G., Grenon, R., Verbecke, C., Viscat, P. (2013). Numerical and Experimental Aerodynamic
Investigations of Boundary Layer Ingestion for Improving Propulsion Efficiency of Future Air Transport. Proceedings of the
31st AIAA Applied Aerodynamics Conference, San Diego, California, 2013
Bijewitz, J., Seitz, A., Hornung, M. (2014). Architectural Comparison of Advanced Ultra-High Bypass Ratio Turbofans for
Medium to Long Range Application. Document ID. 340105, Deutscher Luft- und Raumfahrtkongress 2014, Augsburg,
Germany, 2014
Bolonkin, A. (1999). A high efficiency fuselage propeller (‘Fusefan’) for subsonic aircraft. Word Aviation Conference, San
Francisco, 1999
European Commission. (2011). Flightpath 2050: Europe’s Vision for Aviation, Report of the High Level Group on
Aviation Research. Luxembourg
Grieb, H. and Schubert, H. (Ed.) (2004). Projektierung von Turboflugtriebwerken, Birkhäuser Verlag, Basel-Boston-Berlin
Isikveren, A.T. (2012). Distributed Propulsion and Ultra-high By-pass Rotor Study at Aircraft Level (DisPURSAL). FP7-
AAT-2012-RTD-L0, Proposal No. 323013, European Commission Directorate General for Research and Innovation
Isikveren, A.T., Seitz, A., Bijewitz, J., Hornung, M., Mirzoyan, A., Isyanov, A., Godard, J.-L., Stückl, S., van Toor, J.
(2014). Recent Advances in Airframe-Propulsion Concepts with Distributed Propulsion, Proceedings of the 29th Congress of
the International Council of the Aeronautical Sciences, St. Petersburg, Russia, September 7-12, 2014
Kaiser, S., Grenon, R., Bijewitz, J., Prendinger, A., Atinault, O., Isikveren, A., Hornung, M. (2014). Quasi-Analytical
Aerodynamic Methods for Propulsive Fuselage Concepts. Proceedings of the 29th Congress of the International Council of
the Aeronautical Sciences, St. Petersburg, Russia, September 7-12, 2014
Kim, H. D. (2010). Distributed propulsion vehicles. Proceedings of the 27th Congress of the International Council of the
Aeronautical Sciences, Nice, France, September 19-24, 2010
Kurzke, J., Gasturb11, Compiled with Delphi 2007 on 27 January, 2010
Raymer, D. (2006). Aircraft Design: A Conceptual Approach, 4th edition, AIAA Education Series, American Institute of
Aeronautics and Astronautics, Inc., New York, NY
Reynolds, C. (1985). Advanced Propfan Engine Technology (APET) Single- and Counterrotation Gearbox / Pitch Change
Mechanism, Final Report. Pratt & Whitney United Technologies Corporation, NASA CR-168114, Vol. 1 & 2

Multi-Disciplinary Design Investigation of Propulsive Fuselage Aircraft Concepts
15
Schwarze, M. and Zold, T. (2013). Angepasste Flugzeugkonfigurationen für die Energieeffiziente Open-Rotor Integration
auf zukünftigen Kurzstrecken-Verkehrsflugzeugen. Document ID. 301447, Deutscher Luft- und Raumfahrtkongress 2013,
Stuttgart, Germany, 2013
Seitz, A. (2012). Advanced Methods for Propulsion System Integration in Aircraft Conceptual Design, PhD Dissertation,
Institut für Luft und Raumfahrt, Technische Universität München
Seitz, A., Schmitz, O., Isikveren, A.T., Hornung, M. (2012). Electrically Powered Propulsion: Comparison and Contrast to
Gas Turbines. Paper No. 1358, Deutscher Luft- und Raumfahrtkongress 2012, Berlin, Germany, 2012.
Seitz, A. and Gologan, C. (2013). Parametric Design Studies for Propulsive Fuselage Aircraft Concepts. Paper No. 257,
Proceedings of the 4th CEAS Air & Space Conference, 2013, Linköping, Sweden, September 2013
Seitz, A. and Gologan, C. (2014). Parametric Design Studies for Propulsive Fuselage Aircraft Concepts. DOI
10.1007/s13272-014-0130-3, CEAS Aeronautical Journal, August 2014
Seitz, A., Bijewitz, J., Kaiser, S., Wortmann, G., (2014). Conceptual Investigation of a Propulsive Fuselage Aircraft
Layout, DOI: 10.1108/AEAT-06-2014-0079, Aircraft Engineering and Aerospace Technology Journal, Vol. 86, Issue 6
Steiner, H.-J., Seitz, A., Wieczorek, K., Plötner, K., Isikveren, A.T., Hornung, M. (2012). Multi-Disciplinary Design and
Feasibility Study of Distributed Propulsion Systems. Proceedings of the 28th International Congress of the Aeronautical
Sciences, Brisbane, Australia, September 23-28, 2012
Stückl, S., van Toor, J., Lobentanzer, H. (2012). Voltair – The All Electric Propulsion Concept Platform – A Vision for
Atmospheric Friendly Flight. Proceedings of the 28th International Congress of the Aeronautical Sciences, Brisbane,
Australia, September 23-28, 2012
The Mathworks, Inc. (2013). Matlab, Version 8.2.0.701 (R2013b)
The Mathworks, Inc. (2013). Optimization Toolbox, Version 6.4
Van Dyck, L. (2012). Design study of a boundary layer ingesting Propulsive Fuselage concept. Master’s Thesis, Delft
University of Technology


