
Multi-Dimensional Comparative Visualization for Patent ... · Multi-Dimensional Comparative...
11
MITSUBISHI ELECTRIC RESEARCH LABORATORIES http://www.merl.com Multi-Dimensional Comparative Visualization for Patent Landscaping Wittenburg, K.B.; Pekhteryev, G. TR2015-123 October 2015 Abstract Patent landscaping is a significant activity for modern businesses. Understanding and taking action on information gleaned from analyses of intellectual property (IP) in specific product or technology domains is necessary for many business decisions. Examples include deci- sions about future product development, about how to guard against litigation threats from competitors, about how to set R&D priorities, about how to value IP for sale or licens- ing, and about how to target companies for mergers and acquisitions. This paper proposes a novel method for visualizing patent landscapes that supports the complex hierarchical, multi-dimensional, multi-typed data found in this domain. Our solution directly addresses the problem of how to provide high-level overviews of such a complex domain while at the same time providing enough detail to draw attention to the most significant areas of difference for further drill-down leading to actionable intelligence. 2015 BusinessVis15, IEEE VIS Workshop, Chicago, IL, October 24, 2015. This work may not be copied or reproduced in whole or in part for any commercial purpose. Permission to copy in whole or in part without payment of fee is granted for nonprofit educational and research purposes provided that all such whole or partial copies include the following: a notice that such copying is by permission of Mitsubishi Electric Research Laboratories, Inc.; an acknowledgment of the authors and individual contributions to the work; and all applicable portions of the copyright notice. Copying, reproduction, or republishing for any other purpose shall require a license with payment of fee to Mitsubishi Electric Research Laboratories, Inc. All rights reserved. Copyright c Mitsubishi Electric Research Laboratories, Inc., 2015 201 Broadway, Cambridge, Massachusetts 02139
Transcript of Multi-Dimensional Comparative Visualization for Patent ... · Multi-Dimensional Comparative...
MITSUBISHI ELECTRIC RESEARCH LABORATORIEShttp://www.merl.com
Multi-Dimensional Comparative Visualization for PatentLandscaping
Wittenburg, K.B.; Pekhteryev, G.
TR2015-123 October 2015
AbstractPatent landscaping is a significant activity for modern businesses. Understanding and takingaction on information gleaned from analyses of intellectual property (IP) in specific productor technology domains is necessary for many business decisions. Examples include deci-sions about future product development, about how to guard against litigation threats fromcompetitors, about how to set R&D priorities, about how to value IP for sale or licens-ing, and about how to target companies for mergers and acquisitions. This paper proposesa novel method for visualizing patent landscapes that supports the complex hierarchical,multi-dimensional, multi-typed data found in this domain. Our solution directly addressesthe problem of how to provide high-level overviews of such a complex domain while at thesame time providing enough detail to draw attention to the most significant areas of differencefor further drill-down leading to actionable intelligence.
2015 BusinessVis15, IEEE VIS Workshop, Chicago, IL, October 24, 2015.
This work may not be copied or reproduced in whole or in part for any commercial purpose. Permission to copy inwhole or in part without payment of fee is granted for nonprofit educational and research purposes provided that allsuch whole or partial copies include the following: a notice that such copying is by permission of Mitsubishi ElectricResearch Laboratories, Inc.; an acknowledgment of the authors and individual contributions to the work; and allapplicable portions of the copyright notice. Copying, reproduction, or republishing for any other purpose shall requirea license with payment of fee to Mitsubishi Electric Research Laboratories, Inc. All rights reserved.
Copyright c© Mitsubishi Electric Research Laboratories, Inc., 2015201 Broadway, Cambridge, Massachusetts 02139

Multi-Dimensional Comparative Visualization
for Patent Landscaping
Kent Wittenburg, Senior Member, IEEE, and Georgiy Pekhteryev
Abstract—Patent landscaping is a significant activity for modern businesses. Understanding and taking action on information
gleaned from analyses of intellectual property (IP) in specific product or technology domains is necessary for many business
decisions. Examples include decisions about future product development, about how to guard against litigation threats from
competitors, about how to set R&D priorities, about how to value IP for sale or licensing, and about how to target companies for
mergers and acquisitions. This paper proposes a novel method for visualizing patent landscapes that supports the complex
hierarchical, multi-dimensional, multi-typed data found in this domain. Our solution directly addresses the problem of how to
provide high-level overviews of such a complex domain while at the same time providing enough detail to draw attention to the most
significant areas of difference for further drill-down leading to actionable intelligence.
Index Terms— Patent data, Intellectual Property, Visualization for Business, Visual Comparison, Multi-dimensional visualization
INTRODUCTION
Patent landscaping is an often-used term that, for all practical purposes, simply means analyzing a set of patent-related data. There are various purposes for such analyses, ranging from sociological studies of innovation and government policy to practical business concerns such as freedom to operate for product planning and competitive benchmarking for R&D planning. In this study we will propose a design for comparative patent landscaping for actionable business intelligence. Specifically, we will address the problem of how to provide visual overviews for comparative analysis that allow business decision-makers to drill down into relevant areas of difference in large, multidimensional patent-related datasets. Comparative analysis is an appropriate focus for practical business applications, which tend to value competitive intelligence and benchmarking highly.
We will first discuss the basic data involved in patent landscaping. Then we introduce sample tasks and actions that are the target for this work. Next we review relevant prior work in commercial practice and in the research literature before introducing our proposed interactive visualization methods. We describe a use case to illustrate the methods in practice before our conclusions and prospect for future work.
1 THE DATA
Patent-related data, which drives patent landscaping efforts, mostly originates with governmental patent authorities. This data is moderately highly dimensional and mostly nominal. For example, the US Patent and Trade Office (USPTO) includes 56 searchable fields in their online granted patent database [1]. By our measure, 18 of the fields are categorical (with 4 of those set-based), 14 of the fields are names/references (with 5 of those set-based), 11 of the fields are dates, 5 of them are free text, 5 are Boolean, and the remaining 2 are complex types. Simply counting the number of fields by type is of course not necessarily a measure of the importance of those types. Free-text fields, for example, include the all-important patent abstract, claims, and description. It is
nevertheless significant to note that none of this data is continuous; whatever numeric data there might be is discrete--dates as mentioned above and also counts.
Some of the interesting relations that add structure to the core patent data are references: patents and patent applications include backward references to prior art (usually patent records themselves). For a given patent or patent application, one can also impute forward references (all patents or patent applications that backward reference that document). Patents and patent applications can also reference other applications as priority documents. Patents and applications that have a common source but that may be prosecuted in different patent authorities or as continuations or divisionals are grouped in a family relation.
Set-based data types play a significant role in this data. Patents and their applications have sets of authors, of owners, of references, and of classification values within a number of different patent classification systems. All standard classification systems utilize large and complex hierarchies. For example, the Cooperative Patent Classification (CPC) system, a recent harmonization of the US classification system and the European classification system, is estimated to have 250,000 classification entries [2]. A given patent or application then will have one or more CPC values, each representing a node from a 250,000 element hierarchy. Another source of set-based hierarchical values has been added automatically by some systems through topic clustering. It is also typical for patent documents to be associated with multiple values from a topic hierarchy.
Aside from the data from patent authorities, data for patent landscaping can be usefully augmented with litigation data including plaintiff (usually company) names, defendant (usually company) names, courts, dates, and outcomes. Also, if it is available, company business data, including sales data broken down by geographical area and/or product (type), is very useful when doing business-oriented patent landscaping. IP related products and services also augment the data with fields such as patent value score and normalized assignee (company) names and relationships.
To give an idea of data size, the largest patent holder in the US in 2014 was Samsung. It had a portfolio of 55,417 actively maintained granted patents and 21,659 active applications [3]. For search purposes, commercial tools typically support searching world-wide collections of patent-related documents in the 100s of millions. For the visualization of business-related landscapes we are addressing here, however, we think a reasonable target is a data table with rows in the 1000s and columns of attributes in the 10s. Most business-relevant patent landscaping activities are concerned with a particular product or a technology domain rather than with comparisons at
Kent Wittenburg is with Mitsubishi Electric Research Laboratories.E-mail:
Georgiy Pekhtyerev was formerly with Mitsubishi Electric Research
Laboratories and is now an independent consultant. E-mail:
Manuscript received 15 Aug. 2015; accepted 18 Sept. 2015. Date of
Publication 24 Oct. 2015; date of current version 30 Sept. 2015.
For information on obtaining reprints of this article, please send e-mail to: [email protected].
larger scales. However, comparing total company holdings is a relevant business activity, so further scaling to 10,000s or 100,000s of rows would be desirable for large conglomerate comparison.
2 SAMPLE TASKS AND ACTIONS
Here is a list of sample intelligence-gathering tasks that we believe visual analysis should facilitate for the purpose of actionable business intelligence related to a particular patent landscape. These tasks are primarily associated with analysis of a relevant set of patent data after such a set has been determined through iterative search and refinement.
T1: Determine how a company stacks up against its competitors
in terms of IP strengths and weaknesses viewed globally as well as within local patent and business jurisdictions? What is the main competition? T2: Determine a company’s points of vulnerability, i.e., in what
jurisdictions, product components, or classes of technology is a company at risk of attack from competitors? T3: Determine a company’s points of strength, i.e., in what
jurisdictions, product components, or classes of technology might a company be capable of initiating an attack or responding to an attack from its competitors? T4: Determine whether a company’s investment in areas of its
patent portfolio are appropriately sized. Are there areas where there is more strength than needed to satisfy business requirements?
Actions that would result from answers to the above questions
include the following. A1: Adjust R&D plans to respond to vulnerabilities by
increasing or reducing patent filings in certain areas or working around threats. A2: Identify patent sales, licensing, or abandon candidates that
exceed what is needed to defend business interests. A3: Identify potential patent purchasing, acquisition, or in-
licensing opportunities to address vulnerabilities. A4: Adjust investments in new or existing product lines as a
result of risk/opportunity assessments. A5: Identify promising targets for an out-licensing campaign. A primary function for visualization given the above tasks and
actions involves comparison according to categorizations of the data. Each of tasks T1-T4 requires a business decision-maker or analyst to acquire insights in the context of the business competition through categorizations such as product components or technologies. Both overviews and details are of course required. We now turn to related work in the commercial and research sectors.
3 RELATED WORK
Two sources on the web provide evaluations and listings of some of the many commercial tools that are designed to improve upon the capabilities offered by governmental patent authorities. The Intellogist web site provides detailed reviews and comparison tables of 16 vendor tools at last access [4]. The Patent Information Users Group provides a blog and an up-to-date listing of industry tools and services [5].
For visualization, the most common practice in the industry is to use a series of low-dimensional charts and graphs independently to illustrate various dimensions of the landscape. These visualizations may be used for the purposes of refinement of a search or for communication and insights into the result of a search. Typical charts include (a) distributions by patent owners (bar charts); (b) trends in patent priority dates, applications, or grants (timelines or histograms); (c) geographical distributions of inventors or patent applications (geographical heatmaps); and (d) distributions by classification hierarchies (hierarchical pie charts, stacked bar charts, or expandable outline trees). The strengths and weaknesses of using
independent low-dimensional charts are well-known in the visualization community. While each type of chart can yield different insights, none of these independent views by themselves provide an overall gestalt of comparative strengths and weaknesses. These views reveal only highly aggregated data and don’t show detail or relationships across multiple attributes.
From IP professional practices, the best work in patent landscaping involves building custom classification schemes. No classification scheme fits all, and most business users have a specific purpose in mind such as classifying patent holdings by product component and/or technology. For example, see [6][7] and other reports available through those and other similar web sites. A visual technique seen here and elsewhere is to use two classification schemes (say, product component by technology or company) and form a table whose cells are colored as a heatmap. Typically, other separate visualizations of, say, filing trends or geographical distributions are still required.
On the research side, groups funded through the EU project PATExpert expanded the boundaries of visualization in iterative search and refinement for patent data through linking and coordination of sets of independent views [8]. The focus of this work has been on integrating multiple sources of data as well as multiple views so as to enhance iterative search and refinement. It does not specifically address the overview and comparison tasks that we have defined in Section 2.
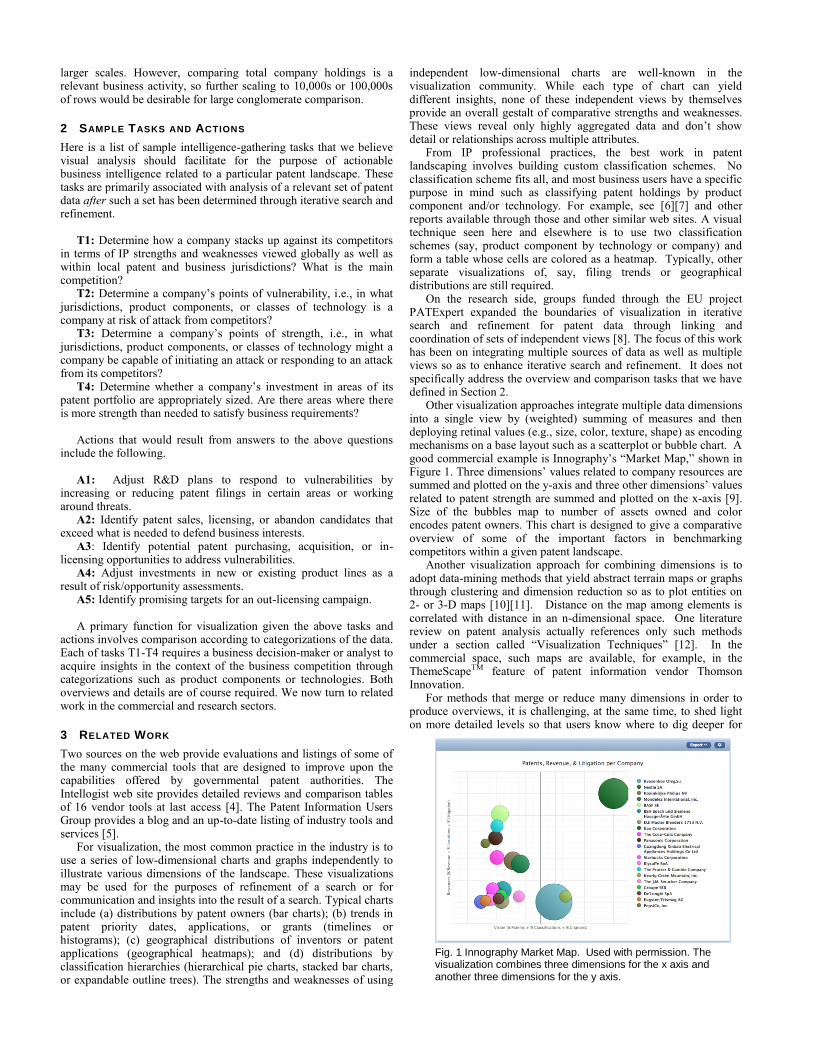
Other visualization approaches integrate multiple data dimensions into a single view by (weighted) summing of measures and then deploying retinal values (e.g., size, color, texture, shape) as encoding mechanisms on a base layout such as a scatterplot or bubble chart. A good commercial example is Innography’s “Market Map,” shown in Figure 1. Three dimensions’ values related to company resources are summed and plotted on the y-axis and three other dimensions’ values related to patent strength are summed and plotted on the x-axis [9]. Size of the bubbles map to number of assets owned and color encodes patent owners. This chart is designed to give a comparative overview of some of the important factors in benchmarking competitors within a given patent landscape.
Another visualization approach for combining dimensions is to adopt data-mining methods that yield abstract terrain maps or graphs through clustering and dimension reduction so as to plot entities on 2- or 3-D maps [10][11]. Distance on the map among elements is correlated with distance in an n-dimensional space. One literature review on patent analysis actually references only such methods under a section called “Visualization Techniques” [12]. In the commercial space, such maps are available, for example, in the ThemeScapeTM feature of patent information vendor Thomson Innovation.
For methods that merge or reduce many dimensions in order to produce overviews, it is challenging, at the same time, to shed light on more detailed levels so that users know where to dig deeper for
Fig. 1 Innography Market Map. Used with permission. The visualization combines three dimensions for the x axis and another three dimensions for the y axis.
actionable information. By definition, dimension reduction hides information from individual dimensions. An overview can indeed be conveyed, but there is no visible connection to detail according to specific dimensions that can drive further intelligence gathering leading to business action.
Although we have not seen the approach applied to patent data, another set of multidimensional visualization methods is available that does not hide data from individual dimensions. Stemming originally from on-line analytical processing (OLAP) in the database world [13], dynamic dimension hierarchies can be used to hierarchically organize and “slice and dice” the data. More than two or three dimensions can be incorporated. Two types of basic layouts have been proposed for such dynamic hierarchies for categorical data: table-based layouts and proportionally-based layouts.
Among the table-based approaches, Kehrer et al. use the x- and y- dimensions of a table to incorporate a dynamic dimension hierarchy [14]. The cells of the table are small multiples with a variety of visualizations possible. It is an extension of Polaris [15] and its commercial descendent Tableau [16]. Kehrer et al. contribute a generalized table algebra that allows small multiple views for all three types of comparative visualization noted by Gleicher et al. [17]: “juxtaposition (showing different objects separately), superposition (overlaying objects in the same space), and explicit encoding of relationships.…” The generalized algebra of Kehrer et al. offers a theoretical foundation for a tabular approach to comparative visual analytics. However, its use of small multiples shows comparisons only at the leaves of the hierarchical information structures. It does not sum or aggregate to include comparative overviews at the higher levels.
Treemaps are a solution that reveals aggregate information at the higher levels of a hierarchical tree proportional to the sizes of its children in the lower levels of the hierarchical structure, thus providing a possible solution to visual comparison that includes an overview with connection to detail [18]. Researchers have suggested using dynamic dimension hierarchies to form hierarchical trees [19]. Color and size of the nodes are typically utilized as visual encodings that can be mapped to data. When used for visual comparison, users must find the comparable elements and then note their relative size and/or color. An acknowledged difficulty, however, is that the standard treemap layouts place parallel structural elements at different relative positions, and they are typically of different sizes. Juxtaposition or alignment, basic to some forms of visual comparison, are not easily achieved, and visual searching is needed to locate structurally parallel cells for comparison purposes [19][20].
A generalization of treemaps has solved the juxtaposition/alignment problem by incorporating the use of constant sized nodes at comparison points and using empty nodes to fill the remaining allocated space [19]. The methods have successfully been demonstrated, for example, in visual comparison of schools through a large data set of 200,000 student grades and a hierarchical information breakdown by schools, by years, by subjects, and by individual students, etc. The overview in this example is achieved primarily through color at detailed levels, and the consumer of this visualization can examine detail at will. Design choices at different levels of the layout provide parallel structure such that visual comparison is possible.
For comparison of time-oriented data, an explicit difference method for hierarchically structured comparisons has been proposed called Stem View [20]. While some subtasks within patent landscaping draw upon temporal data (e.g., application or abandonment trends), the primary points of comparison in patent landscaping tend to be categorical, and the Stem View is not designed for this purpose. Nevertheless, we believe that a solution in our domain does also require incorporation of some temporal data within an overall categorical structure. Sifer and colleagues have integrated both time-oriented data and categorical data using fixed scales for the former and proportional scales for the latter that is related to our work here [25]. However, they are not focused on comparison tasks.
Lastly, we note that pixel bar charts and matrices have been proposed for comparative tasks in dynamically structured multidimensional data [22]. Techniques utilizing color at the pixel level have been shown to reveal data distributions within tabular, hierarchical, and time-line layouts [23], although each of these layouts is independent from one another. It’s also been suggested that pixel bar charts can be used to present a variety of comparisons as a user drills down in a dynamic information hierarchy [24], but in this case the techniques are not intended to provide an overview comparison at high levels simultaneously with the detail.
Therefore, for patent landscaping we believe there is a need for categorically-focused visualization methods that can utilize dynamic dimension hierarchies in order to provide overviews while at the same time expose comparison details at the individual dimension level for further drill-down. Such methods should incorporate multiple dimension types, including set-based categorical data as well as discrete temporal data.
4 OUR SOLUTION
Our solution is driven by the insight that, for comparison purposes, hierarchical structure should determine constraints on visual position and size of structurally parallel value cells. Parallel values should be aligned horizontally or vertically (Alignment Constraint), and the areas on which the data is rendered to show comparison information for parallel value cells should be equal in size and shape (Shape Constraint). These constraints are basically an extension to juxtaposition as a method for visual comparison since parallel elements are not necessarily juxtaposed (immediately next to), but they are still aligned in position, shape, and size, though there may be other visual material intervening.
Prior work has proposed equal-height histograms (bargrams) as an organizing visual framework for multi-dimensional data exploration and has shown how set-valued attributes can be incorporated by using counts of singleton set values [26][27]. Here we extend this framework with incorporation of dynamic dimension hierarchies. We then introduce layout methods that support structurally comparable visualizations of elements in complex hierarchies. Last we show how aggregation methods appropriate to datatypes found in patent landscaping can afford scaling up the size of the datasets to meet the demands of our application domain.
4.1 Layout
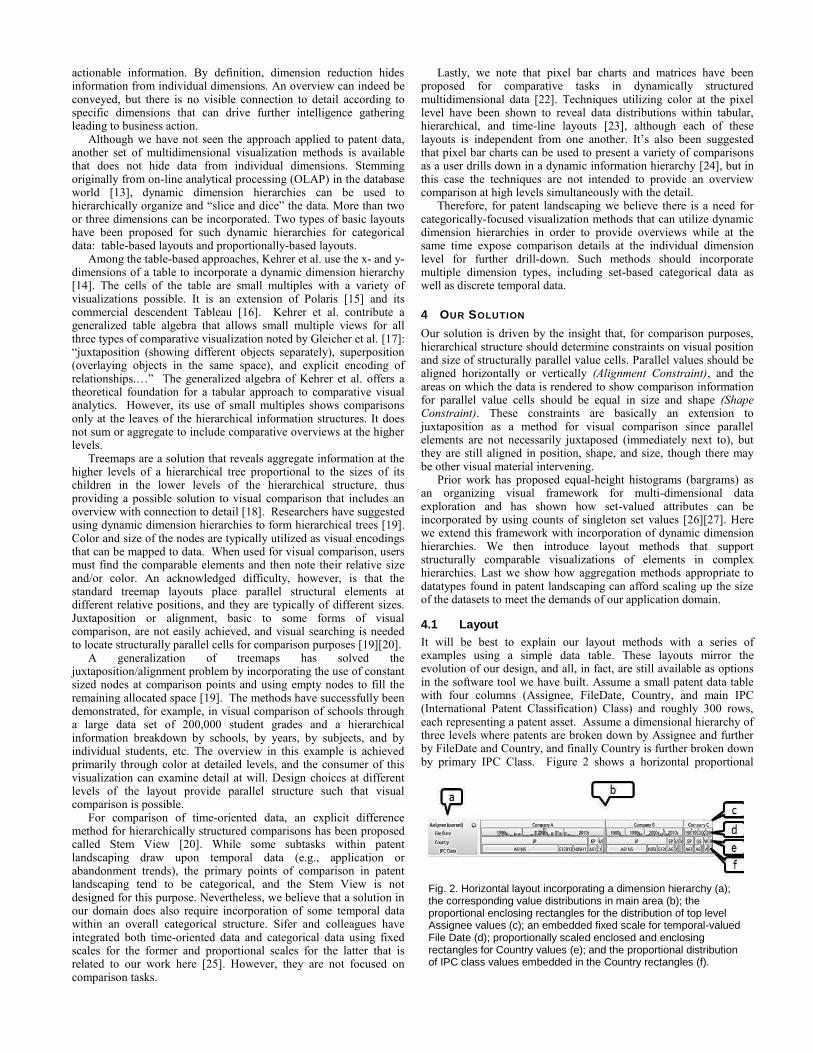
It will be best to explain our layout methods with a series of examples using a simple data table. These layouts mirror the evolution of our design, and all, in fact, are still available as options in the software tool we have built. Assume a small patent data table with four columns (Assignee, FileDate, Country, and main IPC (International Patent Classification) Class) and roughly 300 rows, each representing a patent asset. Assume a dimensional hierarchy of three levels where patents are broken down by Assignee and further by FileDate and Country, and finally Country is further broken down by primary IPC Class. Figure 2 shows a horizontal proportional
Fig. 2. Horizontal layout incorporating a dimension hierarchy (a); the corresponding value distributions in main area (b); the proportional enclosing rectangles for the distribution of top level Assignee values (c); an embedded fixed scale for temporal-valued File Date (d); proportionally scaled enclosed and enclosing rectangles for Country values (e); and the proportional distribution of IPC class values embedded in the Country rectangles (f).
layout. The information hierarchy is shown in Figure 2(a). The main part of the figure, 2(b), contains the value distribution corresponding row-by-row to the dimension hierarchy. Starting with the top level of the hierarchy, the first row, 2(c), uses enclosing rectangles reflecting the horizontally proportional distribution of counts of patent assets corresponding to assignees Company A, B, and C. In the next row, 2(d), inside the container of the outermost tree level values, there is a second type of dimensional layout. It is a conventional histogram for File Date values--temporal data that is displayed here on x/y linear scales embedded in each of the outermost rectangles. The next row, Figure 2(e), contains more proportionally-sized enclosed and enclosing rectangles for Country values. The last row, Figure 2(f), shows the proportional distribution of IPC class by Country. The horizontally oriented layout in Figure 2 thus incorporates both space-filling horizontally proportional rectangles (equal-height histograms or bargrams) as well as fixed-scale equal-width histograms, particularly suited for temporal attributes since they efficiently expose trends. Either may be used to “contain” the structures below them to reflect the attribute hierarchy.
The layout in Figure 2 is relatively compressed vertically, which makes it appropriate in cases where there are many other dimensions displayed at the top level. Note that all parallel elements are aligned, in this case horizontally. However, not all parallel elements are of the same size and shape, which affects the ability to find and compare comparable elements. An additional limitation with the layout in Figure 2 is that it utilizes very little of the vertical space that may be available in the display. Treemaps were originally designed to maximize space usage, and though the horizontal layout in Figure 2 resembles a simplistic Treemap, there are no steps in the layout to maximize the use of vertical display space. Further, even in this simple example, we can see that labels are hard to read in the smaller value cells.
Figure 3 shows a vertically oriented embedded layout. The overall layout is basically a bar chart that has embedded structures within it, similar to Tableau’s use of bar charts embedded with Treemaps [16]. The dimension tree is repeated at left for each of the main value bars, 3(a), and the main area, 3(b), again shows the value distributions. Each of the value bars that were placed end-to-end in Figure 2 are now aligned at left. We are able to utilize more of the available real estate by turning an equal-height histogram into a bar chart. The largest value is stretched to maximize horizontal space usage, and the other value bars are rendered proportionally. The embedded structures within the bars remain the same. This option is sometimes useful just to be able to read the value labels that are compressed in the horizontal mode; the value labels for the top level all now appear within the indented tree in display area 3(a). Also, as is well-known, using length, as bar charts do, is the most effective way to visually encode numeric data [29].
Fig. 3. Vertical layout (embedded bar chart) for top-level in hierarchy (Assignee). Each Assignee value is labeled within (a) and its value rectangle comprises a bar in (b) whose length shows its proportion to the largest. The layout employs better use of vertical space, but parallel value cells such the value of WO in (c), (d), and (e) are not aligned nor rendered at the same size.
Despite its merits, the layout in Figure 3 does not satisfy our requirements for comparative visualization. It suffers from some of
the same problems previously noted for Treemaps. Compare, for example, the rendering of parallel structures (c) Assignee:CompanyA/Country:WO (seemingly absent), (d) Assignee:CompanyB/Country:WO (at the end of the row), and (e) Assignee:CompanyC/Country:WO (at the next to last position in the row). They are at different positions in the orderings of the row, they are of different sizes, and they are not aligned vertically or horizontally. It is therefore still difficult to locate and compare comparable elements.
Furthermore, an important observation is that neither of the layouts in Figures 2 or 3 directly reveals comparative information that is negative. For the tasks mentioned in Section 2, it is a requirement that visualization reveals vulnerabilities (the comparative absence of patent holdings) as well as strength. If an assignee owned no patents in any of the given categorizations, there would be no direct indication in these layouts. For example, the WO category for Company A in Figure 2(c) is invisible.
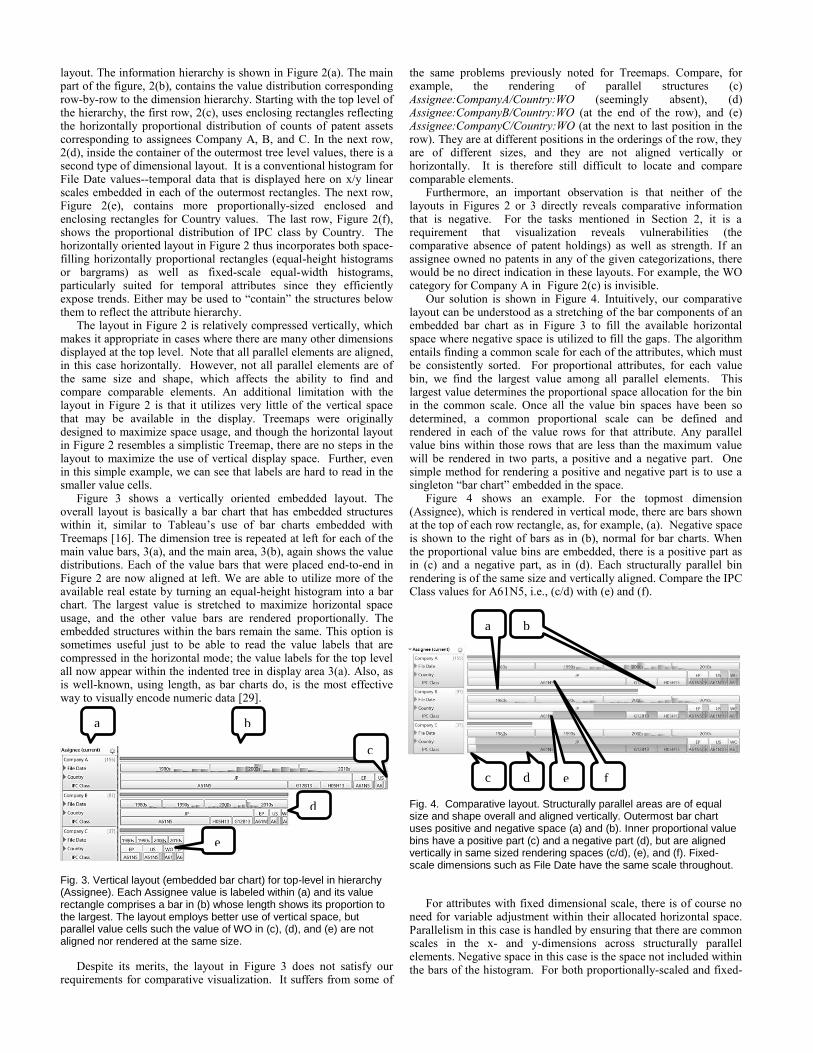
Our solution is shown in Figure 4. Intuitively, our comparative layout can be understood as a stretching of the bar components of an embedded bar chart as in Figure 3 to fill the available horizontal space where negative space is utilized to fill the gaps. The algorithm entails finding a common scale for each of the attributes, which must be consistently sorted. For proportional attributes, for each value bin, we find the largest value among all parallel elements. This largest value determines the proportional space allocation for the bin in the common scale. Once all the value bin spaces have been so determined, a common proportional scale can be defined and rendered in each of the value rows for that attribute. Any parallel value bins within those rows that are less than the maximum value will be rendered in two parts, a positive and a negative part. One simple method for rendering a positive and negative part is to use a singleton “bar chart” embedded in the space.
Figure 4 shows an example. For the topmost dimension (Assignee), which is rendered in vertical mode, there are bars shown at the top of each row rectangle, as, for example, (a). Negative space is shown to the right of bars as in (b), normal for bar charts. When the proportional value bins are embedded, there is a positive part as in (c) and a negative part, as in (d). Each structurally parallel bin rendering is of the same size and vertically aligned. Compare the IPC Class values for A61N5, i.e., (c/d) with (e) and (f).
Fig. 4. Comparative layout. Structurally parallel areas are of equal size and shape overall and aligned vertically. Outermost bar chart uses positive and negative space (a) and (b). Inner proportional value bins have a positive part (c) and a negative part (d), but are aligned vertically in same sized rendering spaces (c/d), (e), and (f). Fixed-scale dimensions such as File Date have the same scale throughout.
For attributes with fixed dimensional scale, there is of course no
need for variable adjustment within their allocated horizontal space. Parallelism in this case is handled by ensuring that there are common scales in the x- and y-dimensions across structurally parallel elements. Negative space in this case is the space not included within the bars of the histogram. For both proportionally-scaled and fixed-
c
d
e
a b
d
a
a
b
c
a
e
a
a
f
a
a
scale dimensions, the layout has the effect of producing “row-skipping” alignment for structurally parallel elements.
Note that comparative information, absent from the first two layouts, is now apparent. For example, the fact that Company A has comparatively fewer international applications (abbreviated “WO”) is now easily seen. Another quick insight is that Company C overall has comparatively fewer patent assets, but that stems from a lack of filings in Japan; they are well in the game for EU and US patent assets, and so on.
In sum, we have arrived at a solution for comparative layouts for hierarchical multidimensional structures by (1) proposing horizontal and vertically oriented options for embedded layouts, (2) providing mappings per dimension for proportional scales and fixed scales, (3) specifying methods to create a common scale for every instance of each dimension in the hierarchy, and (3) utilizing negative space as filler within the commonly sized and aligned rendering areas.
4.2 Aggregation
Aside from layout, another significant design feature for any scalable multidimensional visualization tool is the use of aggregation. Aggregation has already been evident in the File Date field from the previous examples. Data in the original data table gives file dates as day/month/year. Numerical-type dimensions are binned into decimal bins—10s, 100s. 1000s. and so on. The binning is view dependent--whether the data is aggregated into days, months, years, or decades (shown in Figures 2-4) depends on available space; aggregation is automatically recalculated each time data is reduced or added to the view or the view size changes. The rule of thumb we use is to find a binning closest to 7 +/- 2 [30] by picking a cut through a level in the data aggregation hierarchy.
For fixed scale layouts, we show two levels of the hierarchy in any one view—a higher level for labeling and “button” construction, and the next lower level as the columns of the histogram. This design choice was motivated in the patent domain by noting that users are inclined to use comparative temporal information such as filing dates at a fairly high level. It is more significant to note what the overall trends may be over decades rather than year-to-year or month-to-month. Also, aggregation at higher levels can be rendered as and can behave as buttons, which adds a convenient affordance to the UI.
Our aggregation methods for categorical values are designed to accept user-specified hierarchies or else a parser for standardized hierarchical classification codes. Users can specify delimiters such as slash “/” for manually specified hierarchies. Standardized patent classification codes, as mentioned earlier, can be parsed. Our technique again tries to find the binning that is closest to 7 +/- 2 bins. When the hierarchy trees for binning are unbalanced, a cut through a given level must include leaf nodes for branches that end prematurely. These methods work for set-based categorical dimensions as well as simple categorical dimensions. An example of set-based hierarchical categories can be seen in our use case to follow.
4.3 Measures and Comparisons
From OLAP and related literature, the distinction between structures and measures is well known. See, e.g., [15]. So far we have discussed layout for dimension structures. Any given cell in a structure may also be associated with a measure, and a comparison function may be defined across structurally comparable cells.
For the patent landscaping domain, simple measures applicable to many attribute comparisons are sums of counts of patent assets. More complex measures might bring in sales information if it is available, or litigation, or an amalgamation of a patent quality score based on reference counts, claim characteristics, litigation, and/or judgements about discoverability of infringement. As mentioned, the most useful patent landscapes usually involve expert judgements of quality and relevance for patents within one or more classification
schemes specific to products or technology within an industry. Tables representing the results of these metrics can be incorporated into the measures for attribute cells.
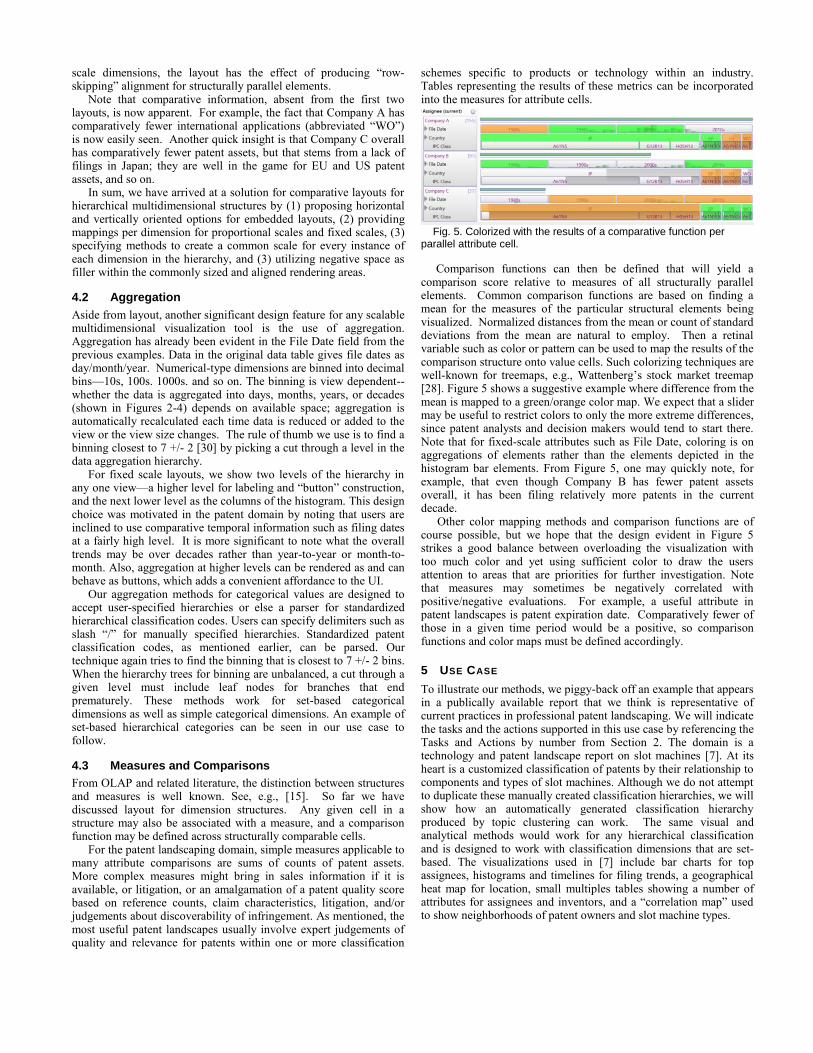
Fig. 5. Colorized with the results of a comparative function per parallel attribute cell.
Comparison functions can then be defined that will yield a comparison score relative to measures of all structurally parallel elements. Common comparison functions are based on finding a mean for the measures of the particular structural elements being visualized. Normalized distances from the mean or count of standard deviations from the mean are natural to employ. Then a retinal variable such as color or pattern can be used to map the results of the comparison structure onto value cells. Such colorizing techniques are well-known for treemaps, e.g., Wattenberg’s stock market treemap [28]. Figure 5 shows a suggestive example where difference from the mean is mapped to a green/orange color map. We expect that a slider may be useful to restrict colors to only the more extreme differences, since patent analysts and decision makers would tend to start there. Note that for fixed-scale attributes such as File Date, coloring is on aggregations of elements rather than the elements depicted in the histogram bar elements. From Figure 5, one may quickly note, for example, that even though Company B has fewer patent assets overall, it has been filing relatively more patents in the current decade.
Other color mapping methods and comparison functions are of course possible, but we hope that the design evident in Figure 5 strikes a good balance between overloading the visualization with too much color and yet using sufficient color to draw the users attention to areas that are priorities for further investigation. Note that measures may sometimes be negatively correlated with positive/negative evaluations. For example, a useful attribute in patent landscapes is patent expiration date. Comparatively fewer of those in a given time period would be a positive, so comparison functions and color maps must be defined accordingly.
5 USE CASE
To illustrate our methods, we piggy-back off an example that appears in a publically available report that we think is representative of current practices in professional patent landscaping. We will indicate the tasks and the actions supported in this use case by referencing the Tasks and Actions by number from Section 2. The domain is a technology and patent landscape report on slot machines [7]. At its heart is a customized classification of patents by their relationship to components and types of slot machines. Although we do not attempt to duplicate these manually created classification hierarchies, we will show how an automatically generated classification hierarchy produced by topic clustering can work. The same visual and analytical methods would work for any hierarchical classification and is designed to work with classification dimensions that are set-based. The visualizations used in [7] include bar charts for top assignees, histograms and timelines for filing trends, a geographical heat map for location, small multiples tables showing a number of attributes for assignees and inventors, and a “correlation map” used to show neighborhoods of patent owners and slot machine types.
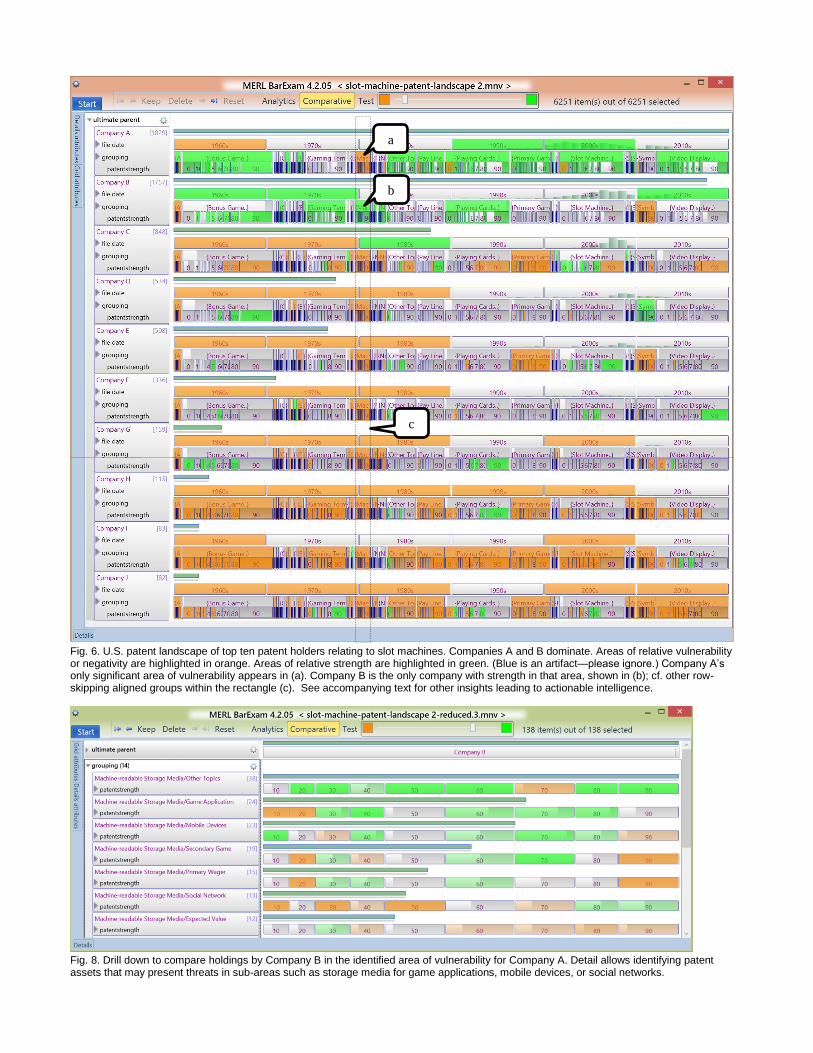
Fig. 6. U.S. patent landscape of top ten patent holders relating to slot machines. Companies A and B dominate. Areas of relative vulnerability or negativity are highlighted in orange. Areas of relative strength are highlighted in green. (Blue is an artifact—please ignore.) Company A’s only significant area of vulnerability appears in (a). Company B is the only company with strength in that area, shown in (b); cf. other row-skipping aligned groups within the rectangle (c). See accompanying text for other insights leading to actionable intelligence.
Fig. 8. Drill down to compare holdings by Company B in the identified area of vulnerability for Company A. Detail allows identifying patent assets that may present threats in sub-areas such as storage media for game applications, mobile devices, or social networks.
a
b
c
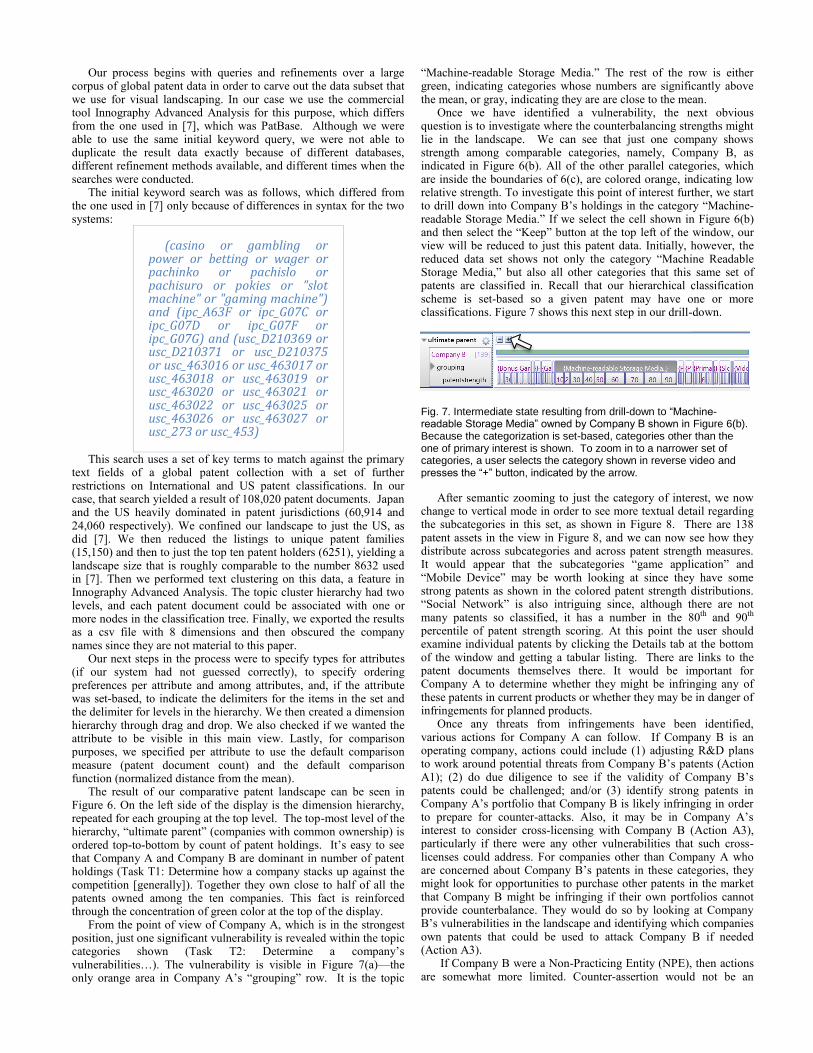
Our process begins with queries and refinements over a large corpus of global patent data in order to carve out the data subset that we use for visual landscaping. In our case we use the commercial tool Innography Advanced Analysis for this purpose, which differs from the one used in [7], which was PatBase. Although we were able to use the same initial keyword query, we were not able to duplicate the result data exactly because of different databases, different refinement methods available, and different times when the searches were conducted.
The initial keyword search was as follows, which differed from the one used in [7] only because of differences in syntax for the two systems:
(casino or gambling or power or betting or wager or pachinko or pachislo or pachisuro or pokies or "slot machine" or "gaming machine") and (ipc_A63F or ipc_G07C or ipc_G07D or ipc_G07F or ipc_G07G) and (usc_D210369 or usc_D210371 or usc_D210375 or usc_463016 or usc_463017 or usc_463018 or usc_463019 or usc_463020 or usc_463021 or usc_463022 or usc_463025 or usc_463026 or usc_463027 or usc_273 or usc_453)
This search uses a set of key terms to match against the primary text fields of a global patent collection with a set of further restrictions on International and US patent classifications. In our case, that search yielded a result of 108,020 patent documents. Japan and the US heavily dominated in patent jurisdictions (60,914 and 24,060 respectively). We confined our landscape to just the US, as did [7]. We then reduced the listings to unique patent families (15,150) and then to just the top ten patent holders (6251), yielding a landscape size that is roughly comparable to the number 8632 used in [7]. Then we performed text clustering on this data, a feature in Innography Advanced Analysis. The topic cluster hierarchy had two levels, and each patent document could be associated with one or more nodes in the classification tree. Finally, we exported the results as a csv file with 8 dimensions and then obscured the company names since they are not material to this paper.
Our next steps in the process were to specify types for attributes (if our system had not guessed correctly), to specify ordering preferences per attribute and among attributes, and, if the attribute was set-based, to indicate the delimiters for the items in the set and the delimiter for levels in the hierarchy. We then created a dimension hierarchy through drag and drop. We also checked if we wanted the attribute to be visible in this main view. Lastly, for comparison purposes, we specified per attribute to use the default comparison measure (patent document count) and the default comparison function (normalized distance from the mean).
The result of our comparative patent landscape can be seen in Figure 6. On the left side of the display is the dimension hierarchy, repeated for each grouping at the top level. The top-most level of the hierarchy, “ultimate parent” (companies with common ownership) is ordered top-to-bottom by count of patent holdings. It’s easy to see that Company A and Company B are dominant in number of patent holdings (Task T1: Determine how a company stacks up against the competition [generally]). Together they own close to half of all the patents owned among the ten companies. This fact is reinforced through the concentration of green color at the top of the display.
From the point of view of Company A, which is in the strongest position, just one significant vulnerability is revealed within the topic categories shown (Task T2: Determine a company’s vulnerabilities…). The vulnerability is visible in Figure 7(a)—the only orange area in Company A’s “grouping” row. It is the topic
“Machine-readable Storage Media.” The rest of the row is either green, indicating categories whose numbers are significantly above the mean, or gray, indicating they are are close to the mean.
Once we have identified a vulnerability, the next obvious question is to investigate where the counterbalancing strengths might lie in the landscape. We can see that just one company shows strength among comparable categories, namely, Company B, as indicated in Figure 6(b). All of the other parallel categories, which are inside the boundaries of 6(c), are colored orange, indicating low relative strength. To investigate this point of interest further, we start to drill down into Company B’s holdings in the category “Machine-readable Storage Media.” If we select the cell shown in Figure 6(b) and then select the “Keep” button at the top left of the window, our view will be reduced to just this patent data. Initially, however, the reduced data set shows not only the category “Machine Readable Storage Media,” but also all other categories that this same set of patents are classified in. Recall that our hierarchical classification scheme is set-based so a given patent may have one or more classifications. Figure 7 shows this next step in our drill-down.
Fig. 7. Intermediate state resulting from drill-down to “Machine-readable Storage Media” owned by Company B shown in Figure 6(b). Because the categorization is set-based, categories other than the one of primary interest is shown. To zoom in to a narrower set of categories, a user selects the category shown in reverse video and presses the “+” button, indicated by the arrow.
After semantic zooming to just the category of interest, we now change to vertical mode in order to see more textual detail regarding the subcategories in this set, as shown in Figure 8. There are 138 patent assets in the view in Figure 8, and we can now see how they distribute across subcategories and across patent strength measures. It would appear that the subcategories “game application” and “Mobile Device” may be worth looking at since they have some strong patents as shown in the colored patent strength distributions. “Social Network” is also intriguing since, although there are not many patents so classified, it has a number in the 80th and 90th percentile of patent strength scoring. At this point the user should examine individual patents by clicking the Details tab at the bottom of the window and getting a tabular listing. There are links to the patent documents themselves there. It would be important for Company A to determine whether they might be infringing any of these patents in current products or whether they may be in danger of infringements for planned products.
Once any threats from infringements have been identified, various actions for Company A can follow. If Company B is an operating company, actions could include (1) adjusting R&D plans to work around potential threats from Company B’s patents (Action A1); (2) do due diligence to see if the validity of Company B’s patents could be challenged; and/or (3) identify strong patents in Company A’s portfolio that Company B is likely infringing in order to prepare for counter-attacks. Also, it may be in Company A’s interest to consider cross-licensing with Company B (Action A3), particularly if there were any other vulnerabilities that such cross-licenses could address. For companies other than Company A who are concerned about Company B’s patents in these categories, they might look for opportunities to purchase other patents in the market that Company B might be infringing if their own portfolios cannot provide counterbalance. They would do so by looking at Company B’s vulnerabilities in the landscape and identifying which companies own patents that could be used to attack Company B if needed (Action A3).
If Company B were a Non-Practicing Entity (NPE), then actions are somewhat more limited. Counter-assertion would not be an
available strategy since NPEs by definition do not have infringing products. Threatened companies would have to focus on workarounds, on plans for attacking the patents’ validity, or on adjustments to business plans to avoid sales in jurisdictions where those patents exist. Yet another possible action is to gird for possible litigation by budget planning or procuring insurance.
So far we have discussed defensive business strategies. However, other possible actions are relevant to companies that are less concerned about defensive moves to protect their products. They may have aggressive licensing policies and associated revenue targets, so they would be interested in identifying any companies and areas with the goal of out-licensing. They would look for areas where there may be vulnerabilities in relationship to their own company’s strengths (Task T3). From Figure 6, we can see that Company B, for instance, has a comparatively strong portfolio with the “Playing Cards” classification, stronger than any company on this list other than Company A. We could drill down into that subarea of the topic landscape eliminating Company A from the view. We would discover that Company B has 64% of all remaining assets in “Playing Cards” and very strong patent strength values. We can reveal many potential targets for a licensing campaign if infringement of specific patents in this part of the portfolio can be demonstrated (Action A5). If company sales were added to the view, which can easily be done, it would be a further help to narrow down licensing targets. We might pick Companies C, E, and F as potential candidates based on the numbers and (lack of) patent strength and then specify a view with companies B, C, E, and F at a global level since it would also be important to identify areas of potential counterattack from these companies if B asserted any patents against them. The prospects for Company B look good. There are no classes of patents that any of these other companies have comparatively more strength in than Company B.
The last task we’ll consider is Task T4, determining whether a company has overinvested in its IP portfolio. Ultimately it will be important to bring in sales data to answer such questions, but even with the data we have it is possible to note where areas of a portfolio are overmatched relative to comparables. We’ll focus just on Company A and Company B since they have by far the most investments in their patent portfolios. If we drill down and compare just the two of them, we see that the biggest areas of difference are in the categories Slot Machine and Video Display. Company A has 40% more patent assets in both Slot Machine and Video Display categories compared to Company B. Also the distribution of Patent Strength scores is in the higher ranges for Company A. Perhaps Company A could consider abandoning or selling patents or reducing the pace of filing patent applications in these areas since they seem to have more than covered the bases (Actions A2, A4).
6 CONCLUSION
In this paper we have addressed a significant problem for business, namely, how to visualize multi-dimensional patent data in order to present both an overview of the landscape as well as enough detail to drive drill-down necessary to solve practical business problems. We gave example tasks and business actions within the scope of this chosen problem. From a review of the state of the art both in commercial practice as well as in the information visualization literature, we identified dynamic information hierarchies as a promising method to build upon since it can handle more than two or three dimensions, and it has the potential to present overview and detail at the same time. Our proposal for comparative multidimensional landscaping uses horizontal and vertical layouts integrating proportional and fixed layouts as well as a novel layout for comparison. The comparison layout is suited to visualizing the results of comparison functions to highlight areas of weakness or vulnerability as well as areas of strength. Through a use case involving real data, we gave examples of how our methods can be used to support related intelligence gathering tasks and subsequent business actions.
As for future research, we have further work to do to bring in more sophisticated statistics more tuned to comparison purposes than the simple patent counts and suggestive comparison functions shown in our examples. Our software framework includes the capability to import custom tables for measures and to specify custom functions for comparison although we have just begun to explore that space. We also think that an exploration of automatic methods, rather than relying on manual user interactions, to create appropriate combinations of layout options are in order. Lastly, we would like to create customized drill-down detail views that can automatically add or delete dimensions more appropriate to the tasks at hand.
We have presented no formal evaluations of these methods in this paper, as it is being presented in a workshop, and the work is at a relatively early stage. Informal feedback from practitioners in the industry has been very positive, but we would aspire in future to incorporate rounds of user testing as well as to show empirical evidence that supports our hypothesis that we have advanced the state of the art of comparative visualization in patent landscaping.
REFERENCES
[1] “USPTO Patent Full-text and Image Database,”
http://patft.uspto.gov/netahtml/PTO/search-adv.htm, 2015.
[2] “EPO – Cooperative Patent Classification,”
https://www.epo.org/searching/essentials/classification/cpc.html, 2015.
[3] M. Chernoff, “Patent Kings—the Dominant Players in the US Patent
Landscape,” Intellectual Asset Management, vol. 71, pp. 49-53,
May/June 2015.
[4] “Intellogist,” http://www.intellogist.com/wiki/Main_Page, 2015.
[5] “Patent Analysis, Mapping, and Visualization Tools – PIUG Space –
PIUG Wiki,”
http://wiki.piug.org/display/PIUG/Patent+Analysis%2C+Mapping%2C
+and+Visualization+Tools, 2015.
[6] P. Totaro. “Reduction of Cost of Energy (COE) through Innovation,”
European Wind Energy Association (EWEA), Poster Presentation 296,
February 2013.
[7] R. Luniya, “Slot Machines: A Technology Insight Report,”
http://www.slideshare.net/robinluniya/technology-insight-report-slot-
machines, 2015.
[8] S. Koch, H. Bosch, M. Giereth, and T. Ertl, "Iterative Integration of
Visual Insights during Scalable Patent Search and Analysis," in
Visualization and Computer Graphics, IEEE Transactions on , vol.17,
no.5, pp.557-569, May 2011.
[9] “Innography Adds Visualization Tools and Playbooks to IP Analysis,”
Law Technology News, August 8, 2013. Available at
https://www.innography.com/public/upload/files/general-files/INNO-
LTN-0813.pdf, 2015.
[10] K. W. Boyack, B. N. Wylie, G. S. Davidson, and D. K. Johnson,
“Analysis of Patent Databases Using VxInsightTM,” Presented at New
Paradigms in Information Visualization and Manipulation, a Workshop
at the 9th International Conference on Information and Knowledge
Management (CIKM 2000), McLean, VA, November 10, 2000,.
[11] V. Avasarala and P. Bonissone, “iPresage: An innovative Patent
Landscaping Tool,” in WCCI 2012 IEEE World Congress on
Computational Intelligence, Brisbane Australia, June, 10-15, 2012.
[12] A. Abbas, L. Zhang, and S. U. Khan, S. U., “A literature review on the
state-of-the-art in patent analysis,” World Patent Information, vol. 37,
pp. 3-13, 2014.
[13] S. Chaudhuri and U. Dayal, “An overview of data warehousing and
OLAP technology,” SIGMOD Rec. vol. 26, no. 1, pp. 65-74, March
1997.
[14] J. Kehrer, H. Piringer, W. Berger, and M. E. Groller, "A Model for
Structure-Based Comparison of Many Categories in Small-Multiple
Displays," Visualization and Computer Graphics, IEEE Transactions
on, vol. 19, no.12, pp. 2287-2296, Dec. 2013.
[15] C. Stolte, D. Tang, and P. Hanrahan, "Polaris: A system for query,
analysis, and visualization of multidimensional relational databases."
Visualization and Computer Graphics, IEEE Transactions on, vol. 8,
no. 1, pp. 52-65, 2002
[16] “Tableau,” http://www.tableau.com, 2015.
[17] M. Gleicher, D. Albers, R. Walker, I. Jusufi, C. D. Hansen, and J. C.
Roberts, “Visual comparison for information visualization,”
Information Visualization, vo. 10, no. 4, pp. 289-309 , October 2011.
[18] B. Shneiderman, "Tree Visualization with Tree-Maps: A 2-D Space
Filling Approach,” ACM Transactions on Graphics, Jun. 18, 1991.
[19] G. Chintalapani, C. Plaisant, and B. Shneiderman, "Extending the utility
of treemaps with flexible hierarchy," in Proceedings of Information
Visualisation (IV 2004), pp. 335-344, July 2004.
[20] J. Guerra-Gomez, M. L. Pack, C. Plaisant, B. Shneiderman,
"Visualizing Change over Time Using Dynamic Hierarchies:
TreeVersity2 and the StemView," Visualization and Computer
Graphics, IEEE Transactions on, vol. 19, no. 12, pp. 2566-2575, Dec.
2013.
[21] R. Vliegen, J. J. van Wijk, and E. van der Linden, “Visualizing Business
Data with Generalized Treemaps,” IEEE Transactions on Visualization
and Computer Graphics, vol. 12, no. 5., pp 789-796, September 2006.
[22] D. A. Keim, M. C. Hao, and U. Dayal, "Hierarchical pixel bar charts,"
Visualization and Computer Graphics, IEEE Transactions on, vol. 8,
no. 3, pp. 255-269, Jul-Sep 2002.
[23] M. C. Hao , U. Dayal , D. Keim , and T. Schreck, “A visual analysis of
multi-attribute data using pixel matrix displays,” Proc. SPIE
Visualization and Data Analysis, vol. 6495, January 2007.
[24] “Method and System for Automated Visual Comparison Based on User
Drilldown Sequences,” US Patent 7643029B2.
[25] M. Sifer, "User interfaces for the exploration of hierarchical multi-
dimensional data," IEEE Visual Analytics Science And Technology
IEEE Symposium on, pp. 175-182. 2006.
[26] K. Wittenburg, T. Lanning, M. Heinrichs, and M. Stanton. 2001.
“Parallel bargrams for consumer-based information exploration and
choice,” in Proceedings of the 14th annual ACM symposium on User
interface software and technology (UIST '01), New York, NY, USA,
pp. 51-60, 2001.
[27] K. Wittenburg, A. Malizia, L. Lupo, and G. Pekhteryev, “Visualizing
set-valued attributes in parallel with equal-height histograms,” in
Proceedings of Advanced Visual Interfaces (AVI 2012), ACM, pp. 632-
635, 2012.
[28] M. Wattenberg, “Visualizing the stock market,” in CHI '99 Extended
Abstracts on Human Factors in Computing Systems (CHI EA '99),
ACM, pp. 188-189, 1999.
[29] J. Bertin, Semiology of Graphics, University of Wisconsin Press, 1983.
[30] G. A. Miller, "The magical number seven, plus or minus two: Some
limits on our capacity for processing information," Psychological
Review, vol. 63, no. 2, pp. 81–97, 1956.


