MULISA : A New Strategy for Discovery of Protein Functional Motifs and Residues
14
Jan Zizka et al. (Eds) : CCSEIT, MoWiN, IT, AIAP, ICBB - 2015 pp. 75–88, 2015. © CS & IT-CSCP 2015 DOI : 10.5121/csit.2015.51109 MULISA : A NEW STRATEGY FOR DISCOVERY OF PROTEIN FUNCTIONAL MOTIFS AND RESIDUES Yi-Yuan Chiu 1 , Chih-Ta Lin 1 , Chien-Heng Lin 1 and Jinn-Moon Yang 1,2 1 Institute of Bioinformatics and Systems Biology, National Chiao Tung University, Hsinchu, Taiwan. [email protected] [email protected] 2 Department of Biological Science and Technology, National Chiao Tung University, Hsinchu, Taiwan. [email protected] ABSTRACT To predict and identify details regarding function from protein sequences is an emergency task since the growing number and diversity of protein sequence. Here, we develop a novel approach for identifying conservation residues and motifs of ligand-binding proteins. In this method, called MuLiSA (Multiple Ligand-bound Structure Alignment), we first superimpose the ligands of ligand-binding proteins and then the residues of ligand-binding sites are naturally aligned. We identify important residues and patterns based on the z-scores of the residue entropy and residue-segment entropy. After identifying new pattern candidates, the profiles of patterns are generated to predict the protein function from only protein sequences. We tested our approach on ATP-binding proteins and HEM-binding proteins. The experiments show that MuLiSA can identify the conservation residues and novel patterns which are really correlated with protein functions of certain ligand-binding proteins. We found that our MuLiSA can identify conservation patterns and is better than traditional alignments such as CE and CLUSTALW in some ligand-binding proteins. We believe that our MuLiSA is useful to discover ligand-binding specificity-determining residues and functional important patterns of proteins. KEYWORDS Multiple ligand-bound structure alignment, Functional motifs, Conserved patterns, ATP-binding proteins, HEM-binding proteins. 1. INTRODUCTION Human genome have been sequenced and led to a flood of sequence information. On the other hand, recent developments in X-ray crystallography and NMR have made it faster in solving protein structures. These data contains a lot of information that can be extracted by techniques which were used to visualize the sequence conservation information. The residues most related to the functions of a protein are often the most conserved (1). Many studies have demonstrated that most protein domains of same protein families, such as PROSITE (2) and Pfam (3), share conserved peptide patterns, called motifs, and some critical residues. The fundamental problems in proteomics include both identifying and understanding the role of the essential sites that determine that structure and proper function of the proteins. After solving these problems,
-
Upload
csandit -
Category
Engineering
-
view
45 -
download
3
Transcript of MULISA : A New Strategy for Discovery of Protein Functional Motifs and Residues
Jan Zizka et al. (Eds) : CCSEIT, MoWiN, IT, AIAP, ICBB - 2015 pp. 75–88, 2015. © CS & IT-CSCP 2015 DOI : 10.5121/csit.2015.51109
MULISA : A NEW STRATEGY FOR
DISCOVERY OF PROTEIN FUNCTIONAL
MOTIFS AND RESIDUES
Yi-Yuan Chiu1, Chih-Ta Lin1, Chien-Heng Lin1 and Jinn-Moon Yang1,2
1Institute of Bioinformatics and Systems Biology, National Chiao Tung University, Hsinchu, Taiwan.
[email protected] 2Department of Biological Science and Technology, National Chiao Tung University, Hsinchu, Taiwan.
ABSTRACT
To predict and identify details regarding function from protein sequences is an emergency task
since the growing number and diversity of protein sequence. Here, we develop a novel approach
for identifying conservation residues and motifs of ligand-binding proteins. In this method,
called MuLiSA (Multiple Ligand-bound Structure Alignment), we first superimpose the ligands
of ligand-binding proteins and then the residues of ligand-binding sites are naturally aligned.
We identify important residues and patterns based on the z-scores of the residue entropy and
residue-segment entropy. After identifying new pattern candidates, the profiles of patterns are
generated to predict the protein function from only protein sequences. We tested our approach
on ATP-binding proteins and HEM-binding proteins. The experiments show that MuLiSA can
identify the conservation residues and novel patterns which are really correlated with protein
functions of certain ligand-binding proteins. We found that our MuLiSA can identify
conservation patterns and is better than traditional alignments such as CE and CLUSTALW in
some ligand-binding proteins. We believe that our MuLiSA is useful to discover ligand-binding
specificity-determining residues and functional important patterns of proteins.
KEYWORDS
Multiple ligand-bound structure alignment, Functional motifs, Conserved patterns, ATP-binding
proteins, HEM-binding proteins.
1. INTRODUCTION Human genome have been sequenced and led to a flood of sequence information. On the other hand, recent developments in X-ray crystallography and NMR have made it faster in solving protein structures. These data contains a lot of information that can be extracted by techniques which were used to visualize the sequence conservation information. The residues most related to the functions of a protein are often the most conserved (1). Many studies have demonstrated that most protein domains of same protein families, such as PROSITE (2) and Pfam (3), share conserved peptide patterns, called motifs, and some critical residues. The fundamental problems in proteomics include both identifying and understanding the role of the essential sites that determine that structure and proper function of the proteins. After solving these problems,
76 Computer Science & Information Technology (CS & IT)
researchers can apply this useful information as a clue to predict protein functions without protein structure information. Many groups have used the identification of conserved patterns as a method to predict protein function. Some of these groups predict protein motifs using principle component analysis (4-7). Other groups use structure alignment (8) or sequence alignment (9) as a method to identify conservation sites. Evolutionary trace analysis was used to predict functional patterns in different phylogenic trees and look for functional important residues (8, 10-13). However, these methods always use protein structure or protein sequence information to predict protein conservation patterns and may miss these conservation patterns because of the noises from other protein structures which are far apart from ligand-binding site.
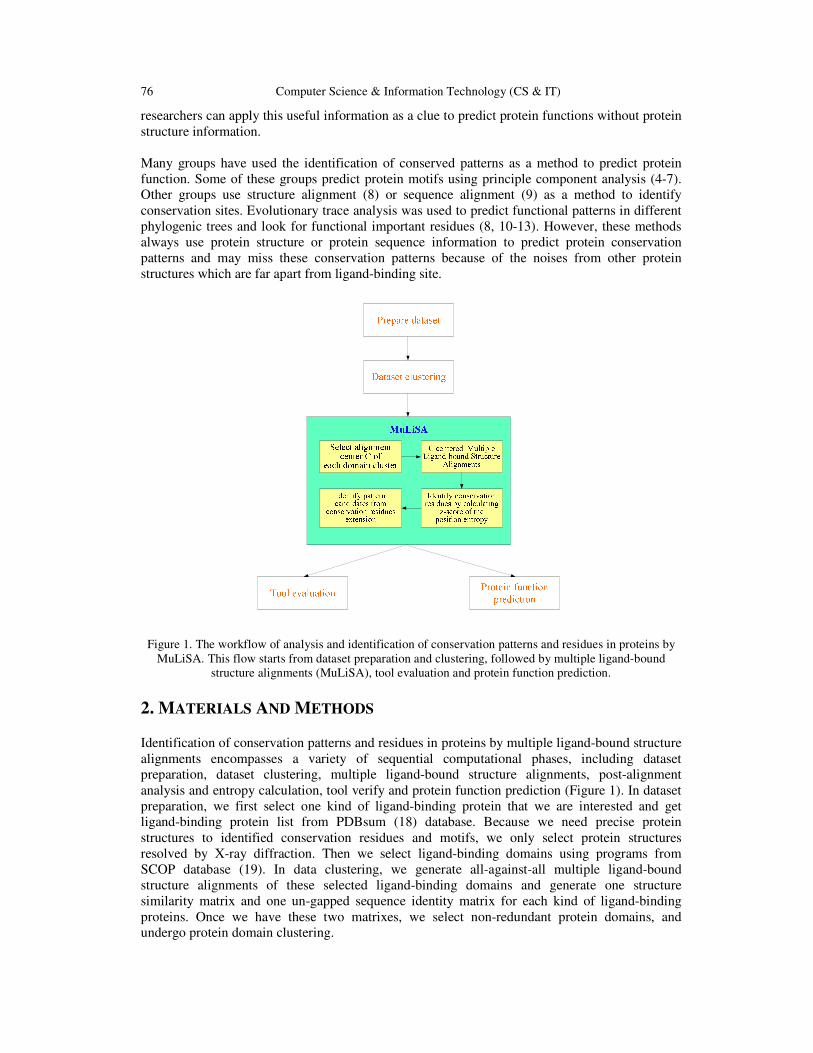
Figure 1. The workflow of analysis and identification of conservation patterns and residues in proteins by MuLiSA. This flow starts from dataset preparation and clustering, followed by multiple ligand-bound
structure alignments (MuLiSA), tool evaluation and protein function prediction. 2. MATERIALS AND METHODS
Identification of conservation patterns and residues in proteins by multiple ligand-bound structure alignments encompasses a variety of sequential computational phases, including dataset preparation, dataset clustering, multiple ligand-bound structure alignments, post-alignment analysis and entropy calculation, tool verify and protein function prediction (Figure 1). In dataset preparation, we first select one kind of ligand-binding protein that we are interested and get ligand-binding protein list from PDBsum (18) database. Because we need precise protein structures to identified conservation residues and motifs, we only select protein structures resolved by X-ray diffraction. Then we select ligand-binding domains using programs from SCOP database (19). In data clustering, we generate all-against-all multiple ligand-bound structure alignments of these selected ligand-binding domains and generate one structure similarity matrix and one un-gapped sequence identity matrix for each kind of ligand-binding proteins. Once we have these two matrixes, we select non-redundant protein domains, and undergo protein domain clustering.
Computer Science & Information Technology (CS & IT) 77
In the main step of MuLiSA, first we choose the alignment center domains C of each domain cluster based on structure similarity. Second, we undergo C centered multiple ligand-bound structure alignment. After we generate the alignments, z-score calculation of position entropy can help us to identify conservation residues of each domain cluster. For we believed that the functional important motifs mostly composed of functional important residues, we identified pattern candidates by conservation residues extension. Finally, we used SCOP (19) and PROSITE (2) databases to verify our results; and then we generate profiles of pattern candidates and use them to search for protein sequence with these patterns in SWISS-PROT database (20). 2.1. Preparation of ligand-binding proteins
We have applied MuLiSA to three kinds of ligand-binding proteins, which are ATP-binding proteins, ADP-binding proteins, and HEM-binding proteins. The ligand-binding protein lists were taken from PDBsum database (18). In order to get ligand-binding domains, first we need to get ligand-binding protein structures. Protein structure three-dimensional information was downloaded from Protein Data Bank (PDB) database(21) according to ligand-binding protein lists getting from PDBsum database (18). The ligand-binding domains were chosen downloaded from Structure Classification of Proteins (SCOP) database (19). Ligand-binding domains were chosen with four criteria, they are as follows: 1) When one of distances between atoms of residues of the domain and atoms of ligands is near than 5Å, we think that this domain is a ligand-binding domain. 2) Because multiple ligand-bound structure alignment first superimposed the ligands of aligned proteins, we only choose protein domains which only bind with one ligand. 3) We only choose ligand-binding domains which the ligand they bind is only bind by one protein domain. 4) We only choose one protein domain in one protein structure. Because the SCOP domain files do not contain ligand information, after choosing these domains we must add back ligand information from Protein Data Bank (PDB) database (21) into these protein domain files. It must be mentioned that we only choose protein domains solved by x-ray crystallography because we think that these structures are more convincing. 2.2. Datasets for verification To verify whether our alignment results is reasonable and can reflect protein function information, we use the classification of Structural Classification of Proteins (SCOP) database (19) as the benchmark of our structure similarity matrix for non-redundant domain clustering. PROSITE patterns from PROSITE database (2) were also used to quality assessment and refinement of multiple ligand-bound structure alignments. The protein sequences and annotations were downloaded from SWISS-PROT database (20) and were used for profile verification and protein function prediction. 2.3. Method The main idea of this tool is that we try to align together conservation residues of proteins at ligand-binding sites by ligand superimposition; and then identify conservation residues and patterns by z-score of entropy calculation. Because we have to change the three-dimensional coordinates of proteins along with superimposed ligands, we developed a structure superimpose tool to deal with this problem. We developed this program MuLiSA from ICP algorithm(22), this program can make proteins and ligands rotation and displacement on three-dimensional space. After we get the superimposed protein structures, we regard two residues are aligned together based on three order rules: 1) Rule 1: Cβ or Cα (Gly) atom of amino acid residues in 1Å; 2) Rule 2: Cβ or Cα (Gly) atom of same amino acid residues in 4Å; 3) Rule 3: Cβ or Cα (Gly) atom of
78 Computer Science & Information Technology (CS & IT)
same group amino acid residues in 4Å or Cβ or Cα (Gly) atom of different group amino acid residues in 2Å. The amino acid groups are defined as follows: 1) Basic amino acids: lysine, arginine, and histidine; 2) Acidic amino acids: aspratate, glutamate, asparagine, and glutamine; 2) Aromatic amino acids: phenylalanine, and tryptophan; 3) Aliphatic amino acids: glycine, alanine, valine, leucine, isoleucine, and methionine; 4) Hydroxyl containing amino acids: serine, threonine, and tyrosine; 5) Disulfide-bond forming amino acid: cysteine; 6) Cyclic amino acid: proline. 2.4. Sequence identity matrix and structure similarity matrix If two protein domains have the similar function and have highly similar structures in ligand-binding sites, these two protein domain structures should fit well in three-dimensional space. We introduced structure similarities in accordance with multiple ligand-bound structure alignments to present this information. ST
ab is the structure similarity of protein domain a and protein domain b. La is the length (residue numbers) of protein domain a, Lb is the length (residue numbers) of protein domain b, and L is the aligned residue number of protein domains a and b. ST
ab is given as
{ }LLS
ba
T
ab
L
,min=
. We also generate un-gapped sequence identity matrix between protein domains
for non-redundant protein domain selection based on only aligned residues of protein domains a and bS
Eab is the un-gapped sequence identity of protein domain a and protein domain b. mt is the
number of identical aligned residues of protein domain a and protein domain b; mmt is the number of non-identical aligned residues of protein domain a and protein domain b and
mmtmt
mtS
E
ab += .
Redundant protein domains must be removed because the profiles generated from alignments may be incredible. We regarded two protein domains are redundant protein domains when their structure similarity and sequence identity are both above 0.8; therefore, we first cluster these protein domains and only choose one with no mutation residues and with the smallest X-ray diffraction resolution. In order to generate a convincing multiple alignments, we must choose an alignment center domains C before we generate this alignments. In structure similarity matrixes, the non-redundant protein domain of one cluster which has the highest structure similarity with other protein domains than others was selected as the alignment center C of this cluster. This protein domain was used to be the alignment center of multiple ligand-bound structure alignment. 2.5. Identification of conservation residues and pattern candidates
To identify these conservation residues, we used entropy (Sp), defined as ( )∑
=
−=20
1
ln*i
pipiP ffS,
where i and fpi denote the ith amino acid type, the probability of finding the amino acid type i at position p. The entropy is 0 when this position is totally conserved. In order to estimate the statistical significance of the position entropy, z-score was applied to identify relative
conservation positions: σ
µ−=
XZ
p
p
, where Zp is the z-score value of position p, σis the standard
deviation of all positions entropy,µis the average value of all positions entropy and Xp is the entropy of position p. We identified a conservation position p when Zp > 2.5. We generate alignment profiles of pattern candidates (discovered by our MuLiSA) and PROSITE patterns from multiple ligand-bound structure alignments. { } 201 where ≤≤= ifPF
i
ppi, where
PFp is the profile of position p; fpi is the probability of the ith amino acid type at position p.We
Computer Science & Information Technology (CS & IT) 79
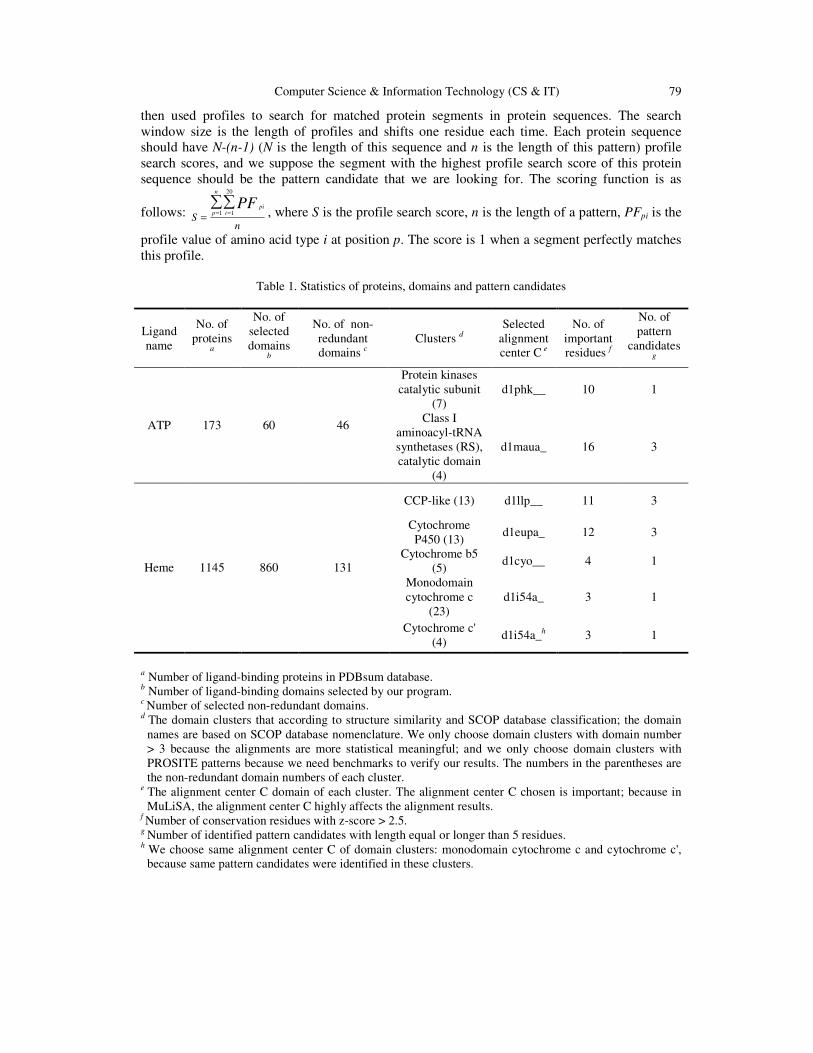
then used profiles to search for matched protein segments in protein sequences. The search window size is the length of profiles and shifts one residue each time. Each protein sequence should have N-(n-1) (N is the length of this sequence and n is the length of this pattern) profile search scores, and we suppose the segment with the highest profile search score of this protein sequence should be the pattern candidate that we are looking for. The scoring function is as
follows: n
S
n
p ipiPF∑∑
= ==
1
20
1 , where S is the profile search score, n is the length of a pattern, PFpi is the
profile value of amino acid type i at position p. The score is 1 when a segment perfectly matches this profile.
Table 1. Statistics of proteins, domains and pattern candidates
Ligand name
No. of proteins
a
No. of selected domains
b
No. of non-redundant domains c
Clusters d Selected
alignment center C e
No. of important residues f
No. of pattern
candidates g
ATP 173 60 46
Protein kinases catalytic subunit
(7) d1phk__ 10 1
Class I aminoacyl-tRNA synthetases (RS), catalytic domain
(4)
d1maua_ 16 3
Heme 1145 860 131
CCP-like (13) d1llp__ 11 3
Cytochrome P450 (13)
d1eupa_ 12 3
Cytochrome b5 (5)
d1cyo__ 4 1
Monodomain cytochrome c
(23) d1i54a_ 3 1
Cytochrome c' (4)
d1i54a_h 3 1
a Number of ligand-binding proteins in PDBsum database. b Number of ligand-binding domains selected by our program. c Number of selected non-redundant domains. d The domain clusters that according to structure similarity and SCOP database classification; the domain
names are based on SCOP database nomenclature. We only choose domain clusters with domain number > 3 because the alignments are more statistical meaningful; and we only choose domain clusters with PROSITE patterns because we need benchmarks to verify our results. The numbers in the parentheses are the non-redundant domain numbers of each cluster.
e The alignment center C domain of each cluster. The alignment center C chosen is important; because in MuLiSA, the alignment center C highly affects the alignment results.
f Number of conservation residues with z-score > 2.5.
g Number of identified pattern candidates with length equal or longer than 5 residues. h We choose same alignment center C of domain clusters: monodomain cytochrome c and cytochrome c',
because same pattern candidates were identified in these clusters.
80 Computer Science & Information Technology (CS & IT)
3. RESULTS
In order to identify the wealth of information present in protein structures, we analyzed conservation residues and patterns in multiple ligand-bound structure alignments. Most sequence and structure alignment techniques are protein-based alignment; in other words, these techniques analyze residue conservation only by comparing protein structure or protein sequence similarity. At the present, we have applied MuLiSA to ATP- and HEM-binding proteins and identified several conservation residues and pattern candidates. We have generated sequence profiles from multiple alignments and used them to discover protein sequences which may have these profiles. We also proved that MuLiSA is better than other tools in several cases and can discover functional information when comparing with SCOP (19) and PROSITE database(2). Our major intention was to extract protein structure information from ligand-binding proteins and apply this information to protein function prediction. Table 1 shows some statistics about the dataset we used in this study. Through getting ligand-binding protein lists, selecting ligand-binding domains, domain clustering, non-redundant domains and alignment center C selection, we use MuLiSA and z-score of entropy calculation to identified conservation residues and pattern candidates of each cluster. These identified conservation residues may be functional important and we survey the literature and it proves that some of these identified conservation residues are critical to ligand-binding or correlate with conformation stability. After pattern candidate identification, we generate profiles of these pattern candidates and use these profiles predict protein functions. 3.1. ATP-binding proteins ATP, adenosine triphosphate, is the major energy currency of the cell. It transfers energy from chemical bonds to endergonic reactions of the cell. ATP powers most of the energy-consuming activities of cells, such as muscle contraction, synthesis of polysaccharides, active transport of ions and nerve impulse. Because of ATP is a so important compound and because of the large number of experimental data, like ATP-binding protein structures and literatures, we choose ATP-binding proteins as our first research target. We have generated structure similarity matrix of non-redundant ATP-binding domains for functional-based domain clustering, and we also identified conservation residues and pattern candidates. Finally, we used profiles of pattern candidates to undergo protein function prediction.
3.1.1 Structure similarity matrix and alignment center selection
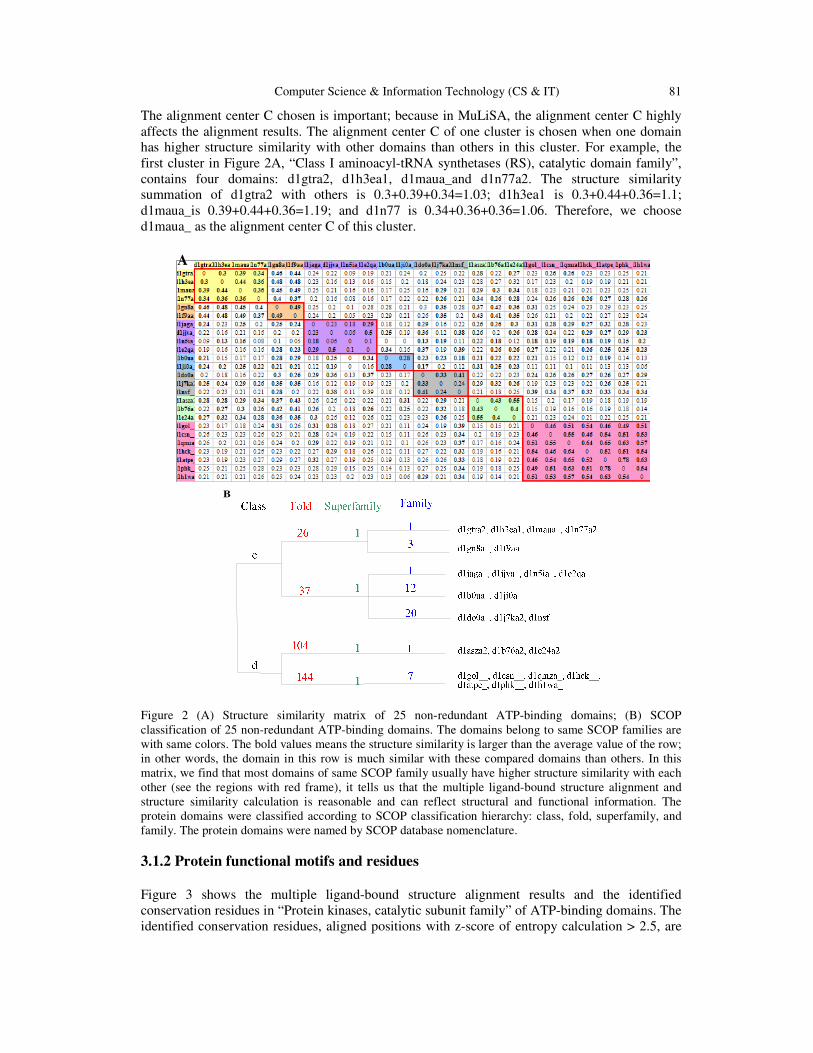
Figure 2 shows the structure similarity matrixes and SCOP classifications of 25 non-redundant ATP-binding domains. When comparing with classifications of SCOP database (19), protein domains with higher structure similarities are usually clustered together and they are always belong to same SCOP families. As we all agree that SCOP database (19) is a convincing domain structural and functional classification database, it tells us that the multiple ligand-bound alignment and structure similarity calculation is reasonable and can reflect structural and functional information. In Figure 2A, the domains belong to the same SCOP families are with same colors. The bold values means the structure similarity is larger than the average value of the row; in other words, the domain in this row is much similar with these compared domains than others. In this matrix, we find that most domains of same SCOP family usually have higher structure similarity with each other (see the regions with red frame), it tell us that the multiple ligand-bound structure alignment and structure similarity calculation is reasonable and can reflect structural and functional information. Figure 2B shows the SCOP classification of protein domains.
Computer Science & Information Technology (CS & IT) 81
The alignment center C chosen is important; because in MuLiSA, the alignment center C highly affects the alignment results. The alignment center C of one cluster is chosen when one domain has higher structure similarity with other domains than others in this cluster. For example, the first cluster in Figure 2A, “Class I aminoacyl-tRNA synthetases (RS), catalytic domain family”, contains four domains: d1gtra2, d1h3ea1, d1maua_and d1n77a2. The structure similarity summation of d1gtra2 with others is 0.3+0.39+0.34=1.03; d1h3ea1 is 0.3+0.44+0.36=1.1; d1maua_is 0.39+0.44+0.36=1.19; and d1n77 is 0.34+0.36+0.36=1.06. Therefore, we choose d1maua_ as the alignment center C of this cluster.
Figure 2 (A) Structure similarity matrix of 25 non-redundant ATP-binding domains; (B) SCOP classification of 25 non-redundant ATP-binding domains. The domains belong to same SCOP families are with same colors. The bold values means the structure similarity is larger than the average value of the row; in other words, the domain in this row is much similar with these compared domains than others. In this matrix, we find that most domains of same SCOP family usually have higher structure similarity with each other (see the regions with red frame), it tells us that the multiple ligand-bound structure alignment and structure similarity calculation is reasonable and can reflect structural and functional information. The protein domains were classified according to SCOP classification hierarchy: class, fold, superfamily, and family. The protein domains were named by SCOP database nomenclature. 3.1.2 Protein functional motifs and residues
Figure 3 shows the multiple ligand-bound structure alignment results and the identified conservation residues in “Protein kinases, catalytic subunit family” of ATP-binding domains. The identified conservation residues, aligned positions with z-score of entropy calculation > 2.5, are
A
B
82 Computer Science & Information Technology (CS & IT)
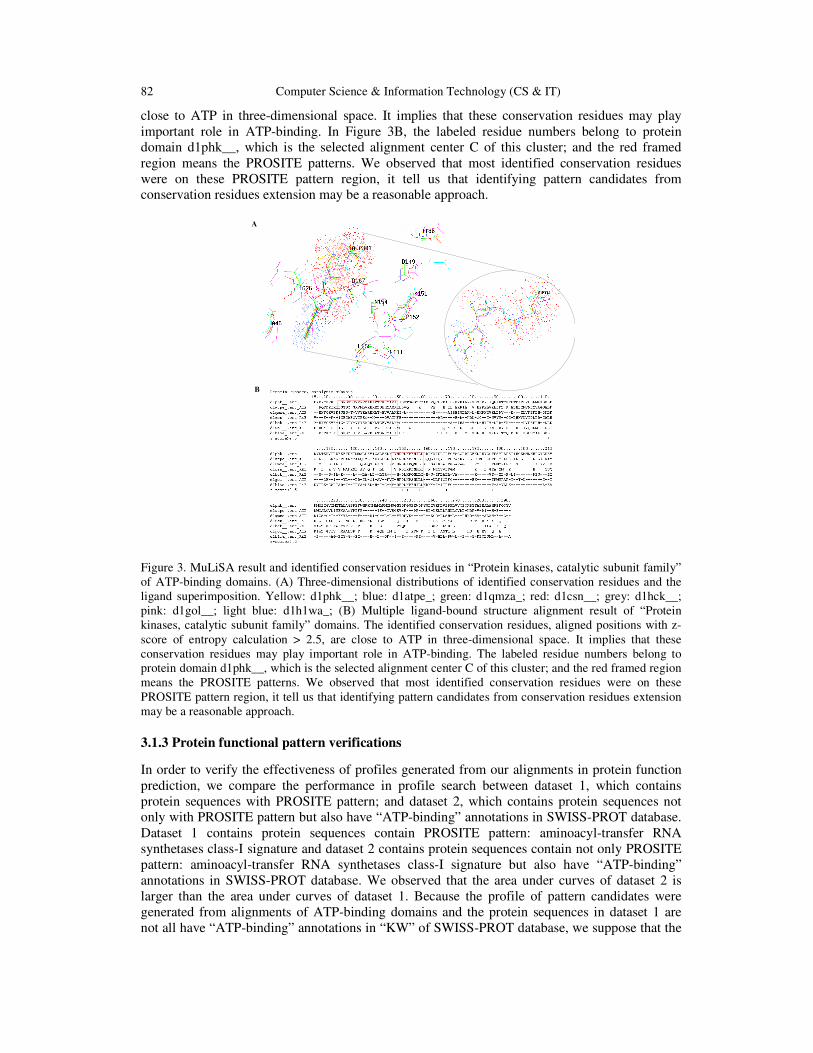
close to ATP in three-dimensional space. It implies that these conservation residues may play important role in ATP-binding. In Figure 3B, the labeled residue numbers belong to protein domain d1phk__, which is the selected alignment center C of this cluster; and the red framed region means the PROSITE patterns. We observed that most identified conservation residues were on these PROSITE pattern region, it tell us that identifying pattern candidates from conservation residues extension may be a reasonable approach.
Figure 3. MuLiSA result and identified conservation residues in “Protein kinases, catalytic subunit family” of ATP-binding domains. (A) Three-dimensional distributions of identified conservation residues and the ligand superimposition. Yellow: d1phk__; blue: d1atpe_; green: d1qmza_; red: d1csn__; grey: d1hck__; pink: d1gol__; light blue: d1h1wa_; (B) Multiple ligand-bound structure alignment result of “Protein kinases, catalytic subunit family” domains. The identified conservation residues, aligned positions with z-score of entropy calculation > 2.5, are close to ATP in three-dimensional space. It implies that these conservation residues may play important role in ATP-binding. The labeled residue numbers belong to protein domain d1phk__, which is the selected alignment center C of this cluster; and the red framed region means the PROSITE patterns. We observed that most identified conservation residues were on these PROSITE pattern region, it tell us that identifying pattern candidates from conservation residues extension may be a reasonable approach. 3.1.3 Protein functional pattern verifications
In order to verify the effectiveness of profiles generated from our alignments in protein function prediction, we compare the performance in profile search between dataset 1, which contains protein sequences with PROSITE pattern; and dataset 2, which contains protein sequences not only with PROSITE pattern but also have “ATP-binding” annotations in SWISS-PROT database. Dataset 1 contains protein sequences contain PROSITE pattern: aminoacyl-transfer RNA synthetases class-I signature and dataset 2 contains protein sequences contain not only PROSITE pattern: aminoacyl-transfer RNA synthetases class-I signature but also have “ATP-binding” annotations in SWISS-PROT database. We observed that the area under curves of dataset 2 is larger than the area under curves of dataset 1. Because the profile of pattern candidates were generated from alignments of ATP-binding domains and the protein sequences in dataset 1 are not all have “ATP-binding” annotations in “KW” of SWISS-PROT database, we suppose that the
A
B
Computer Science & Information Technology (CS & IT) 83
profile of pattern candidate is more convincing in ATP-binding proteins but not proteins only with PROSITE patterns.
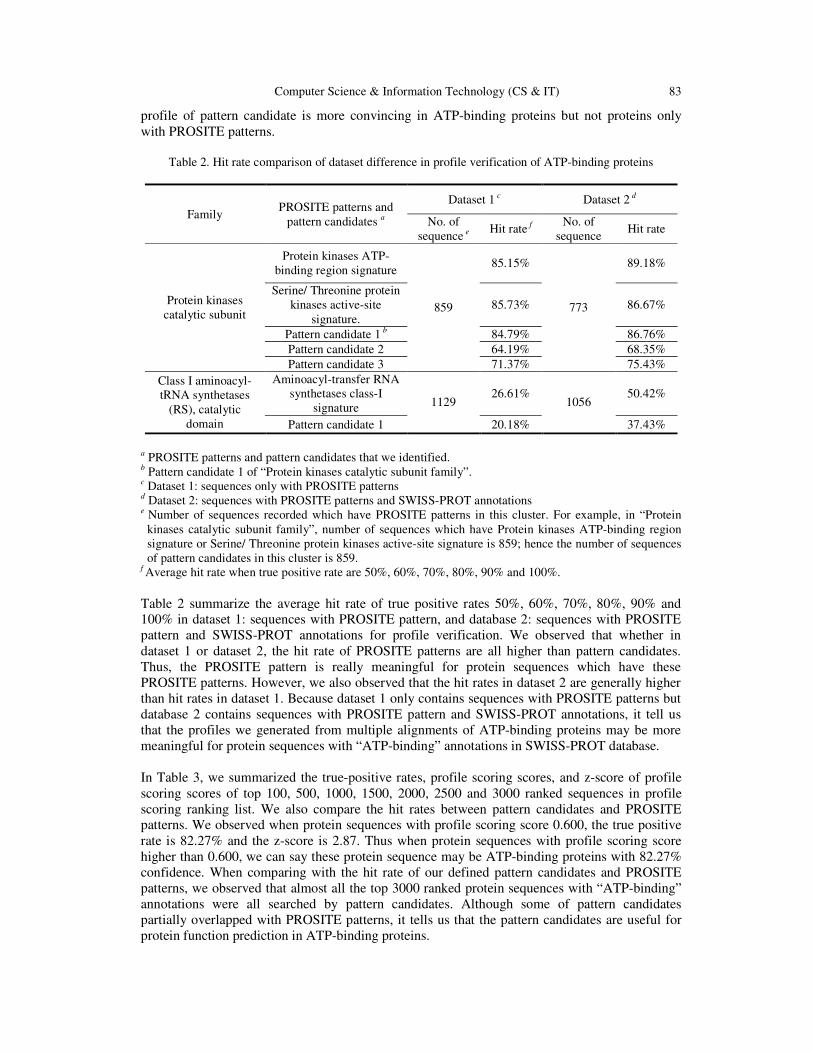
Table 2. Hit rate comparison of dataset difference in profile verification of ATP-binding proteins
Family PROSITE patterns and
pattern candidates a
Dataset 1 c Dataset 2 d
No. of sequence e
Hit rate f No. of
sequence Hit rate
Protein kinases catalytic subunit
Protein kinases ATP-binding region signature
859
85.15%
773
89.18%
Serine/ Threonine protein kinases active-site
signature. 85.73% 86.67%
Pattern candidate 1 b 84.79% 86.76% Pattern candidate 2 64.19% 68.35% Pattern candidate 3 71.37% 75.43%
Class I aminoacyl-tRNA synthetases
(RS), catalytic domain
Aminoacyl-transfer RNA synthetases class-I
signature 1129 26.61%
1056 50.42%
Pattern candidate 1 20.18% 37.43%
a PROSITE patterns and pattern candidates that we identified. b Pattern candidate 1 of “Protein kinases catalytic subunit family”. c Dataset 1: sequences only with PROSITE patterns d Dataset 2: sequences with PROSITE patterns and SWISS-PROT annotations e Number of sequences recorded which have PROSITE patterns in this cluster. For example, in “Protein
kinases catalytic subunit family”, number of sequences which have Protein kinases ATP-binding region signature or Serine/ Threonine protein kinases active-site signature is 859; hence the number of sequences of pattern candidates in this cluster is 859.
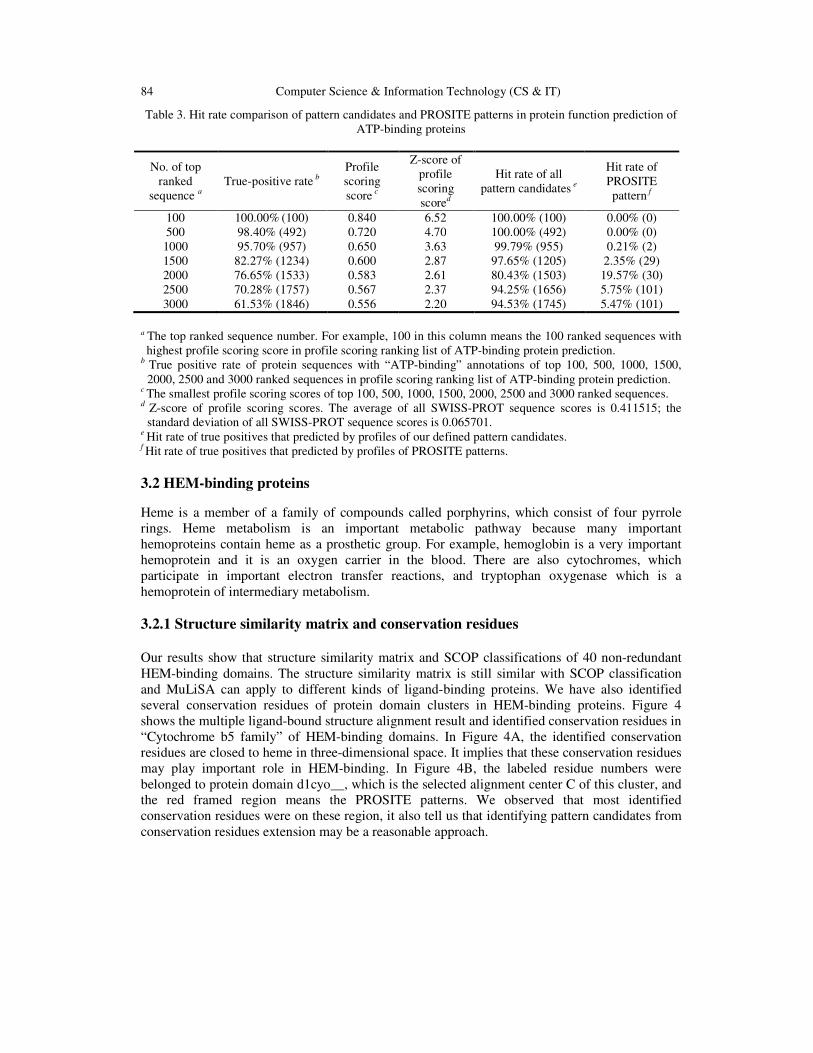
f Average hit rate when true positive rate are 50%, 60%, 70%, 80%, 90% and 100%. Table 2 summarize the average hit rate of true positive rates 50%, 60%, 70%, 80%, 90% and 100% in dataset 1: sequences with PROSITE pattern, and database 2: sequences with PROSITE pattern and SWISS-PROT annotations for profile verification. We observed that whether in dataset 1 or dataset 2, the hit rate of PROSITE patterns are all higher than pattern candidates. Thus, the PROSITE pattern is really meaningful for protein sequences which have these PROSITE patterns. However, we also observed that the hit rates in dataset 2 are generally higher than hit rates in dataset 1. Because dataset 1 only contains sequences with PROSITE patterns but database 2 contains sequences with PROSITE pattern and SWISS-PROT annotations, it tell us that the profiles we generated from multiple alignments of ATP-binding proteins may be more meaningful for protein sequences with “ATP-binding” annotations in SWISS-PROT database. In Table 3, we summarized the true-positive rates, profile scoring scores, and z-score of profile scoring scores of top 100, 500, 1000, 1500, 2000, 2500 and 3000 ranked sequences in profile scoring ranking list. We also compare the hit rates between pattern candidates and PROSITE patterns. We observed when protein sequences with profile scoring score 0.600, the true positive rate is 82.27% and the z-score is 2.87. Thus when protein sequences with profile scoring score higher than 0.600, we can say these protein sequence may be ATP-binding proteins with 82.27% confidence. When comparing with the hit rate of our defined pattern candidates and PROSITE patterns, we observed that almost all the top 3000 ranked protein sequences with “ATP-binding” annotations were all searched by pattern candidates. Although some of pattern candidates partially overlapped with PROSITE patterns, it tells us that the pattern candidates are useful for protein function prediction in ATP-binding proteins.
84 Computer Science & Information Technology (CS & IT)
Table 3. Hit rate comparison of pattern candidates and PROSITE patterns in protein function prediction of ATP-binding proteins
No. of top ranked
sequence a True-positive rate b
Profile scoring score c
Z-score of profile scoring scored
Hit rate of all pattern candidates e
Hit rate of PROSITE pattern f
100 100.00% (100) 0.840 6.52 100.00% (100) 0.00% (0) 500 98.40% (492) 0.720 4.70 100.00% (492) 0.00% (0) 1000 95.70% (957) 0.650 3.63 99.79% (955) 0.21% (2) 1500 82.27% (1234) 0.600 2.87 97.65% (1205) 2.35% (29) 2000 76.65% (1533) 0.583 2.61 80.43% (1503) 19.57% (30) 2500 70.28% (1757) 0.567 2.37 94.25% (1656) 5.75% (101) 3000 61.53% (1846) 0.556 2.20 94.53% (1745) 5.47% (101)
a The top ranked sequence number. For example, 100 in this column means the 100 ranked sequences with highest profile scoring score in profile scoring ranking list of ATP-binding protein prediction.
b True positive rate of protein sequences with “ATP-binding” annotations of top 100, 500, 1000, 1500, 2000, 2500 and 3000 ranked sequences in profile scoring ranking list of ATP-binding protein prediction.
c The smallest profile scoring scores of top 100, 500, 1000, 1500, 2000, 2500 and 3000 ranked sequences. d Z-score of profile scoring scores. The average of all SWISS-PROT sequence scores is 0.411515; the
standard deviation of all SWISS-PROT sequence scores is 0.065701. e Hit rate of true positives that predicted by profiles of our defined pattern candidates.
f Hit rate of true positives that predicted by profiles of PROSITE patterns. 3.2 HEM-binding proteins
Heme is a member of a family of compounds called porphyrins, which consist of four pyrrole rings. Heme metabolism is an important metabolic pathway because many important hemoproteins contain heme as a prosthetic group. For example, hemoglobin is a very important hemoprotein and it is an oxygen carrier in the blood. There are also cytochromes, which participate in important electron transfer reactions, and tryptophan oxygenase which is a hemoprotein of intermediary metabolism. 3.2.1 Structure similarity matrix and conservation residues
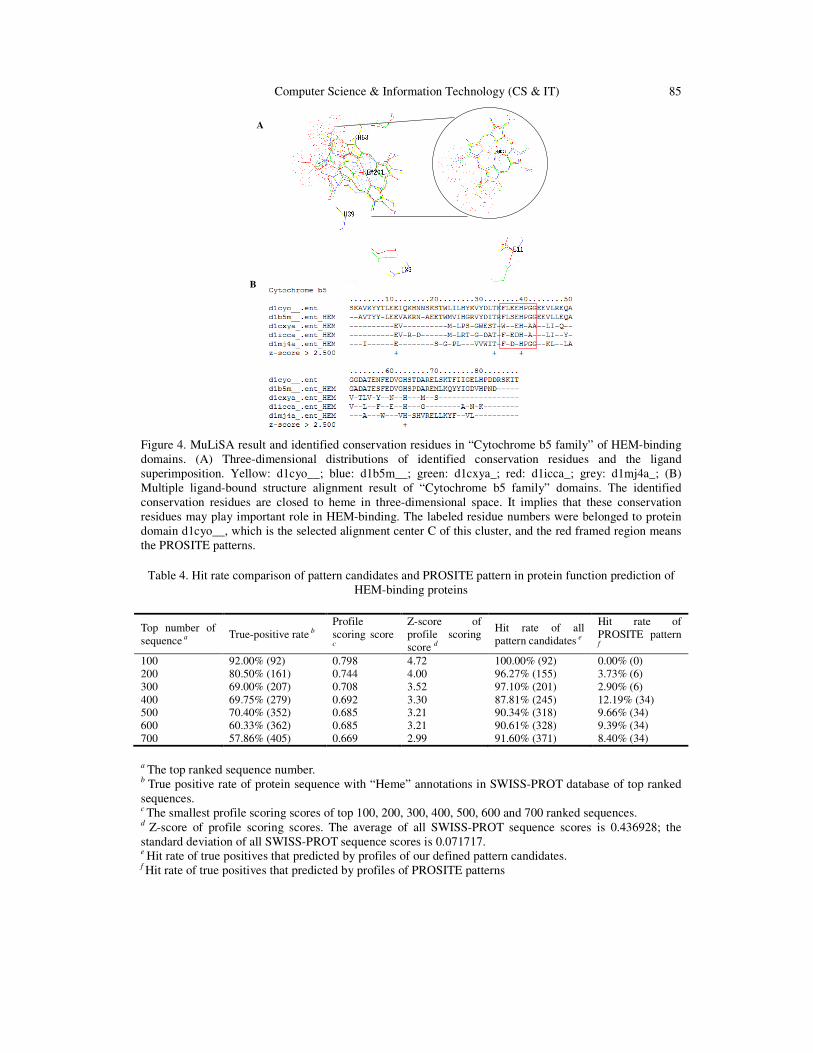
Our results show that structure similarity matrix and SCOP classifications of 40 non-redundant HEM-binding domains. The structure similarity matrix is still similar with SCOP classification and MuLiSA can apply to different kinds of ligand-binding proteins. We have also identified several conservation residues of protein domain clusters in HEM-binding proteins. Figure 4 shows the multiple ligand-bound structure alignment result and identified conservation residues in “Cytochrome b5 family” of HEM-binding domains. In Figure 4A, the identified conservation residues are closed to heme in three-dimensional space. It implies that these conservation residues may play important role in HEM-binding. In Figure 4B, the labeled residue numbers were belonged to protein domain d1cyo__, which is the selected alignment center C of this cluster, and the red framed region means the PROSITE patterns. We observed that most identified conservation residues were on these region, it also tell us that identifying pattern candidates from conservation residues extension may be a reasonable approach.
Computer Science & Information Technology (CS & IT) 85
Figure 4. MuLiSA result and identified conservation residues in “Cytochrome b5 family” of HEM-binding domains. (A) Three-dimensional distributions of identified conservation residues and the ligand superimposition. Yellow: d1cyo__; blue: d1b5m__; green: d1cxya_; red: d1icca_; grey: d1mj4a_; (B) Multiple ligand-bound structure alignment result of “Cytochrome b5 family” domains. The identified conservation residues are closed to heme in three-dimensional space. It implies that these conservation residues may play important role in HEM-binding. The labeled residue numbers were belonged to protein domain d1cyo__, which is the selected alignment center C of this cluster, and the red framed region means the PROSITE patterns.
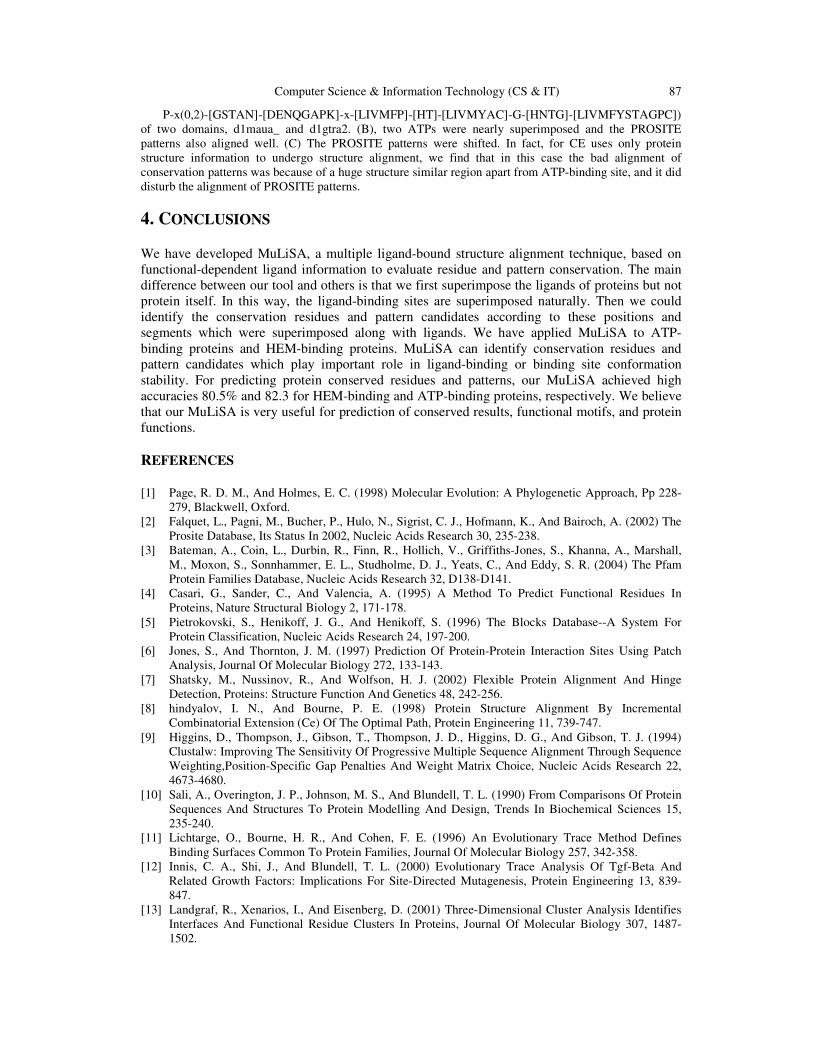
Table 4. Hit rate comparison of pattern candidates and PROSITE pattern in protein function prediction of HEM-binding proteins
Top number of sequence a
True-positive rate b Profile scoring score
c
Z-score of profile scoring score d
Hit rate of all pattern candidates e
Hit rate of PROSITE pattern
f 100 92.00% (92) 0.798 4.72 100.00% (92) 0.00% (0) 200 80.50% (161) 0.744 4.00 96.27% (155) 3.73% (6) 300 69.00% (207) 0.708 3.52 97.10% (201) 2.90% (6) 400 69.75% (279) 0.692 3.30 87.81% (245) 12.19% (34) 500 70.40% (352) 0.685 3.21 90.34% (318) 9.66% (34) 600 60.33% (362) 0.685 3.21 90.61% (328) 9.39% (34) 700 57.86% (405) 0.669 2.99 91.60% (371) 8.40% (34)
a The top ranked sequence number. b True positive rate of protein sequence with “Heme” annotations in SWISS-PROT database of top ranked sequences. c The smallest profile scoring scores of top 100, 200, 300, 400, 500, 600 and 700 ranked sequences.
d Z-score of profile scoring scores. The average of all SWISS-PROT sequence scores is 0.436928; the standard deviation of all SWISS-PROT sequence scores is 0.071717. e Hit rate of true positives that predicted by profiles of our defined pattern candidates.
f Hit rate of true positives that predicted by profiles of PROSITE patterns
A
B
86 Computer Science & Information Technology (CS & IT)
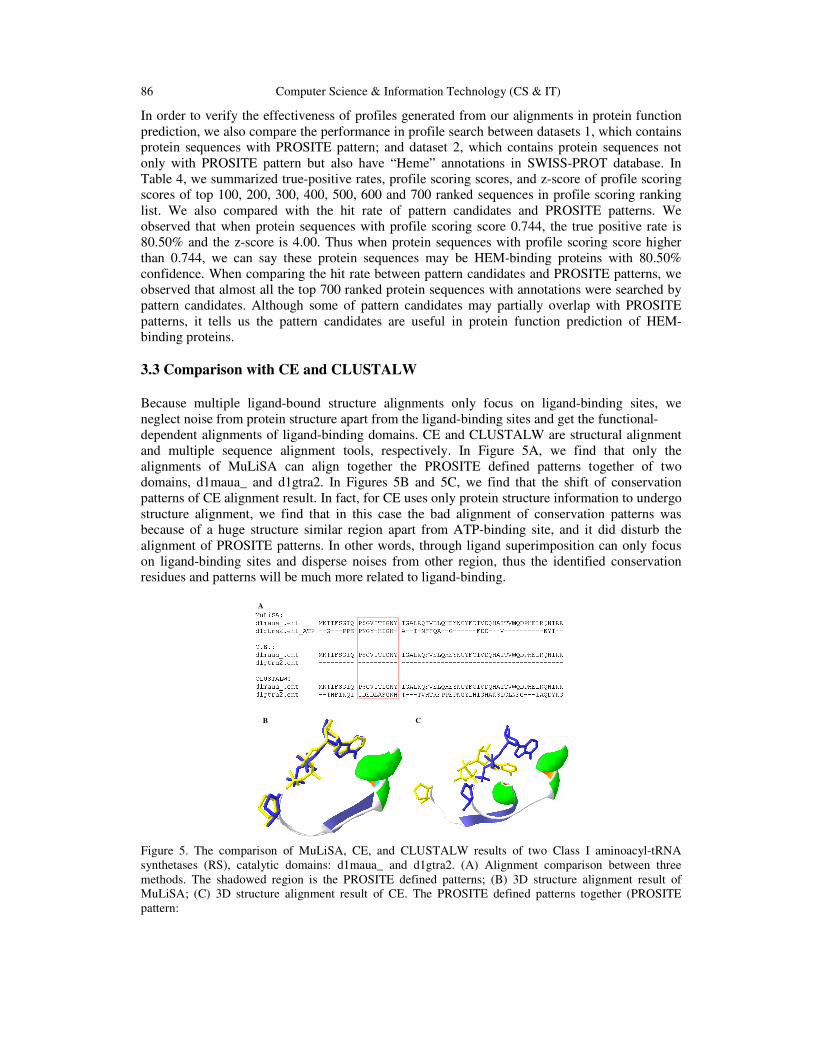
In order to verify the effectiveness of profiles generated from our alignments in protein function prediction, we also compare the performance in profile search between datasets 1, which contains protein sequences with PROSITE pattern; and dataset 2, which contains protein sequences not only with PROSITE pattern but also have “Heme” annotations in SWISS-PROT database. In Table 4, we summarized true-positive rates, profile scoring scores, and z-score of profile scoring scores of top 100, 200, 300, 400, 500, 600 and 700 ranked sequences in profile scoring ranking list. We also compared with the hit rate of pattern candidates and PROSITE patterns. We observed that when protein sequences with profile scoring score 0.744, the true positive rate is 80.50% and the z-score is 4.00. Thus when protein sequences with profile scoring score higher than 0.744, we can say these protein sequences may be HEM-binding proteins with 80.50% confidence. When comparing the hit rate between pattern candidates and PROSITE patterns, we observed that almost all the top 700 ranked protein sequences with annotations were searched by pattern candidates. Although some of pattern candidates may partially overlap with PROSITE patterns, it tells us the pattern candidates are useful in protein function prediction of HEM-binding proteins. 3.3 Comparison with CE and CLUSTALW Because multiple ligand-bound structure alignments only focus on ligand-binding sites, we neglect noise from protein structure apart from the ligand-binding sites and get the functional- dependent alignments of ligand-binding domains. CE and CLUSTALW are structural alignment and multiple sequence alignment tools, respectively. In Figure 5A, we find that only the alignments of MuLiSA can align together the PROSITE defined patterns together of two domains, d1maua_ and d1gtra2. In Figures 5B and 5C, we find that the shift of conservation patterns of CE alignment result. In fact, for CE uses only protein structure information to undergo structure alignment, we find that in this case the bad alignment of conservation patterns was because of a huge structure similar region apart from ATP-binding site, and it did disturb the alignment of PROSITE patterns. In other words, through ligand superimposition can only focus on ligand-binding sites and disperse noises from other region, thus the identified conservation residues and patterns will be much more related to ligand-binding.
Figure 5. The comparison of MuLiSA, CE, and CLUSTALW results of two Class I aminoacyl-tRNA synthetases (RS), catalytic domains: d1maua_ and d1gtra2. (A) Alignment comparison between three methods. The shadowed region is the PROSITE defined patterns; (B) 3D structure alignment result of MuLiSA; (C) 3D structure alignment result of CE. The PROSITE defined patterns together (PROSITE pattern:
B C
A
Computer Science & Information Technology (CS & IT) 87
P-x(0,2)-[GSTAN]-[DENQGAPK]-x-[LIVMFP]-[HT]-[LIVMYAC]-G-[HNTG]-[LIVMFYSTAGPC]) of two domains, d1maua_ and d1gtra2. (B), two ATPs were nearly superimposed and the PROSITE patterns also aligned well. (C) The PROSITE patterns were shifted. In fact, for CE uses only protein structure information to undergo structure alignment, we find that in this case the bad alignment of conservation patterns was because of a huge structure similar region apart from ATP-binding site, and it did disturb the alignment of PROSITE patterns.
4. CONCLUSIONS We have developed MuLiSA, a multiple ligand-bound structure alignment technique, based on functional-dependent ligand information to evaluate residue and pattern conservation. The main difference between our tool and others is that we first superimpose the ligands of proteins but not protein itself. In this way, the ligand-binding sites are superimposed naturally. Then we could identify the conservation residues and pattern candidates according to these positions and segments which were superimposed along with ligands. We have applied MuLiSA to ATP-binding proteins and HEM-binding proteins. MuLiSA can identify conservation residues and pattern candidates which play important role in ligand-binding or binding site conformation stability. For predicting protein conserved residues and patterns, our MuLiSA achieved high accuracies 80.5% and 82.3 for HEM-binding and ATP-binding proteins, respectively. We believe that our MuLiSA is very useful for prediction of conserved results, functional motifs, and protein functions. REFERENCES
[1] Page, R. D. M., And Holmes, E. C. (1998) Molecular Evolution: A Phylogenetic Approach, Pp 228-
279, Blackwell, Oxford. [2] Falquet, L., Pagni, M., Bucher, P., Hulo, N., Sigrist, C. J., Hofmann, K., And Bairoch, A. (2002) The
Prosite Database, Its Status In 2002, Nucleic Acids Research 30, 235-238. [3] Bateman, A., Coin, L., Durbin, R., Finn, R., Hollich, V., Griffiths-Jones, S., Khanna, A., Marshall,
M., Moxon, S., Sonnhammer, E. L., Studholme, D. J., Yeats, C., And Eddy, S. R. (2004) The Pfam Protein Families Database, Nucleic Acids Research 32, D138-D141.
[4] Casari, G., Sander, C., And Valencia, A. (1995) A Method To Predict Functional Residues In Proteins, Nature Structural Biology 2, 171-178.
[5] Pietrokovski, S., Henikoff, J. G., And Henikoff, S. (1996) The Blocks Database--A System For Protein Classification, Nucleic Acids Research 24, 197-200.
[6] Jones, S., And Thornton, J. M. (1997) Prediction Of Protein-Protein Interaction Sites Using Patch Analysis, Journal Of Molecular Biology 272, 133-143.
[7] Shatsky, M., Nussinov, R., And Wolfson, H. J. (2002) Flexible Protein Alignment And Hinge Detection, Proteins: Structure Function And Genetics 48, 242-256.
[8] hindyalov, I. N., And Bourne, P. E. (1998) Protein Structure Alignment By Incremental Combinatorial Extension (Ce) Of The Optimal Path, Protein Engineering 11, 739-747.
[9] Higgins, D., Thompson, J., Gibson, T., Thompson, J. D., Higgins, D. G., And Gibson, T. J. (1994) Clustalw: Improving The Sensitivity Of Progressive Multiple Sequence Alignment Through Sequence Weighting,Position-Specific Gap Penalties And Weight Matrix Choice, Nucleic Acids Research 22, 4673-4680.
[10] Sali, A., Overington, J. P., Johnson, M. S., And Blundell, T. L. (1990) From Comparisons Of Protein Sequences And Structures To Protein Modelling And Design, Trends In Biochemical Sciences 15, 235-240.
[11] Lichtarge, O., Bourne, H. R., And Cohen, F. E. (1996) An Evolutionary Trace Method Defines Binding Surfaces Common To Protein Families, Journal Of Molecular Biology 257, 342-358.
[12] Innis, C. A., Shi, J., And Blundell, T. L. (2000) Evolutionary Trace Analysis Of Tgf-Beta And Related Growth Factors: Implications For Site-Directed Mutagenesis, Protein Engineering 13, 839-847.
[13] Landgraf, R., Xenarios, I., And Eisenberg, D. (2001) Three-Dimensional Cluster Analysis Identifies Interfaces And Functional Residue Clusters In Proteins, Journal Of Molecular Biology 307, 1487-1502.

88 Computer Science & Information Technology (CS & IT)
[14] Notredame, C., Higgins, D. G., And Heringa, J. (2000) T-Coffee: A Novel Method For Fast And Accurate Multiple Sequence Alignment., Journal Of Molecular Biology 302, 205-217.
[15] Altschul, S. F., Gish, W., Miller, W., Myers, E. W., And Lipman, D. J. (1990) Basic Local Alignment Search Tool, Journal Of Molecular Biology 215, 403-410.
[16] Holm, L., And Sander, C. (1993) Protein Structure Comparison By Alignment Of Distance Matrices, Journal Of Molecular Biology 233, 123-138.
[17] Gibrat, J. F., Madej, T., And Bryant, S. H. (1996) Surprising Similarities In Structure Comparison, Current Opinion In Structural Biology 6, 377-385.
[18] Laskowski, R. A., Hutchinson, E. G., Michie, A. D., Wallace, A. C., Jones, M. L., And Thornton, J. M. (1997) Pdbsum: A Web-Based Database Of Summaries And Analyses Of All Pdb Structures, Trends In Biochemical Sciences 22, 488-490.
[19] Murzin, A. G., Brenner, S. E., Hubbard, T., And Chothia, C. (1995) Scop: A Structural Classification Of Proteins Database For The Investigation Of Sequences And Structures, Journal Of Molecular Biology 247, 536-540.
[20] Boeckmann, B., Bairoch, A., Apweiler, R., Blatter, M. C., Estreicher, A., Gasteiger, E., Martin, M. J., Michoud, K., O'donovan, C., Phan, I., Pilbout, S., And Schneider, M. (2003) The Swiss-Prot Protein Knowledgebase And Its Supplement Trembl In 2003, Nucleic Acids Research 31, 365-370.
[21] Berman, H. M., Westbrook, J., Feng, Z., Gilliland, G., Bhat, T. N., Weissig, H., Shindyalov, I. N., And Bourne, P. E. (2000) The Protein Data Bank, Nucleic Acids Research 28, 235-242.
[22] Besl, P. J., And Mckay, N. D. (1992) A Method For Registration Of 3-D Shapes, Ieee Transactions On Pattern Analysis And Machine Intelligence 14, 239-256.