
Mukund Moorthy 2nd February 1999
45
Mixed Structural and Behavioral Models for Behavioral Models for Predicting the Future Predicting the Future Behavior of some Behavior of some Aspects of the Aspects of the Macroeconomy Macroeconomy Mukund Moorthy Mukund Moorthy 2nd February 1999 2nd February 1999
-
Upload
tamara-simmons -
Category
Documents
-
view
58 -
download
1
description
Mixed Structural and Behavioral Models for Predicting the Future Behavior of some Aspects of the Macroeconomy. Mukund Moorthy 2nd February 1999. Contents. Economic Modeling System Dynamics Fuzzy Inductive Reasoning Proposed Macroeconomic Model Food Demand Modeling Conclusion. - PowerPoint PPT Presentation
Transcript of Mukund Moorthy 2nd February 1999

Mixed Structural and Mixed Structural and Behavioral Models for Behavioral Models for Predicting the Future Predicting the Future
Behavior of some Aspects Behavior of some Aspects of the Macroeconomyof the Macroeconomy
Mukund MoorthyMukund Moorthy
2nd February 19992nd February 1999

ContentsContents
Economic ModelingEconomic Modeling System DynamicsSystem Dynamics Fuzzy Inductive ReasoningFuzzy Inductive Reasoning Proposed Macroeconomic ModelProposed Macroeconomic Model Food Demand ModelingFood Demand Modeling ConclusionConclusion
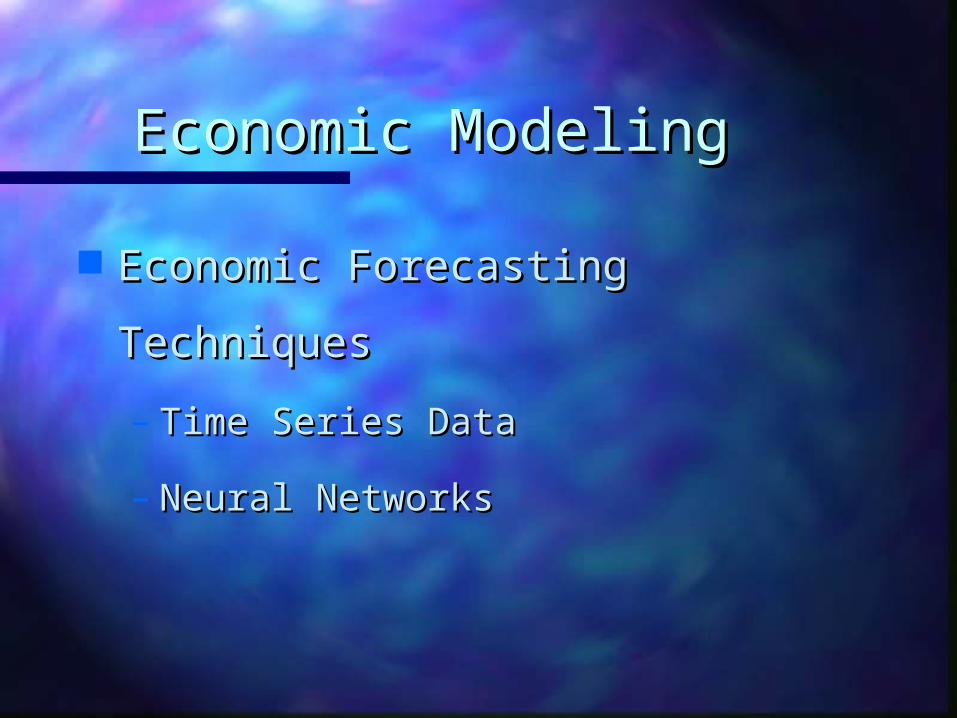
Economic ModelingEconomic Modeling
Economic Forecasting TechniquesEconomic Forecasting Techniques
– Time Series DataTime Series Data
– Neural NetworksNeural Networks
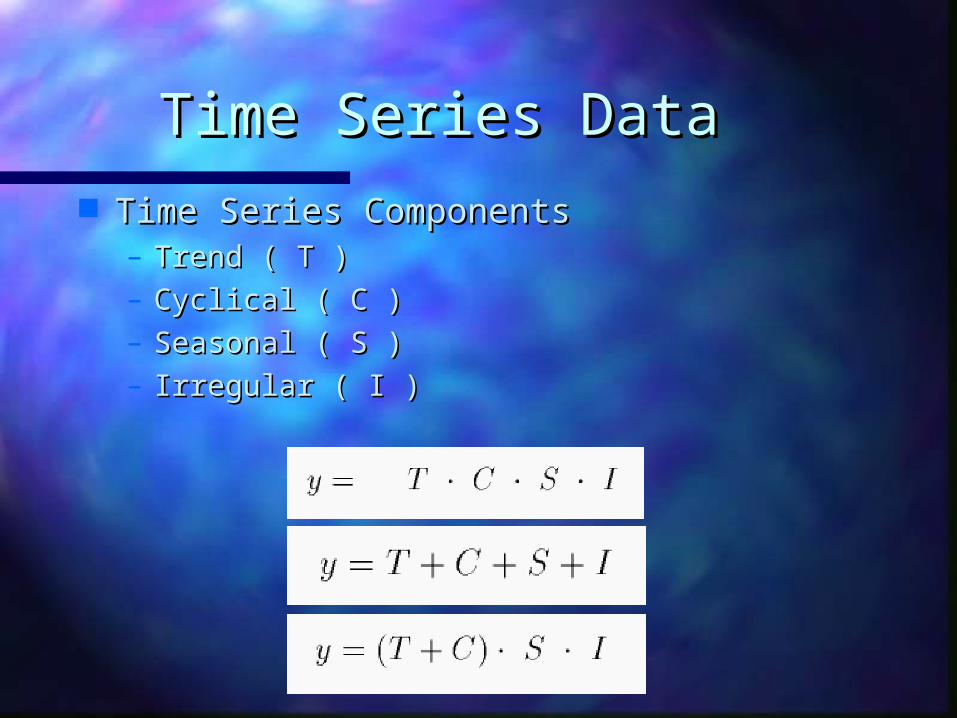
Time Series DataTime Series Data Time Series ComponentsTime Series Components
– Trend ( T )Trend ( T )– Cyclical ( C )Cyclical ( C )– Seasonal ( S )Seasonal ( S )– Irregular ( I )Irregular ( I )
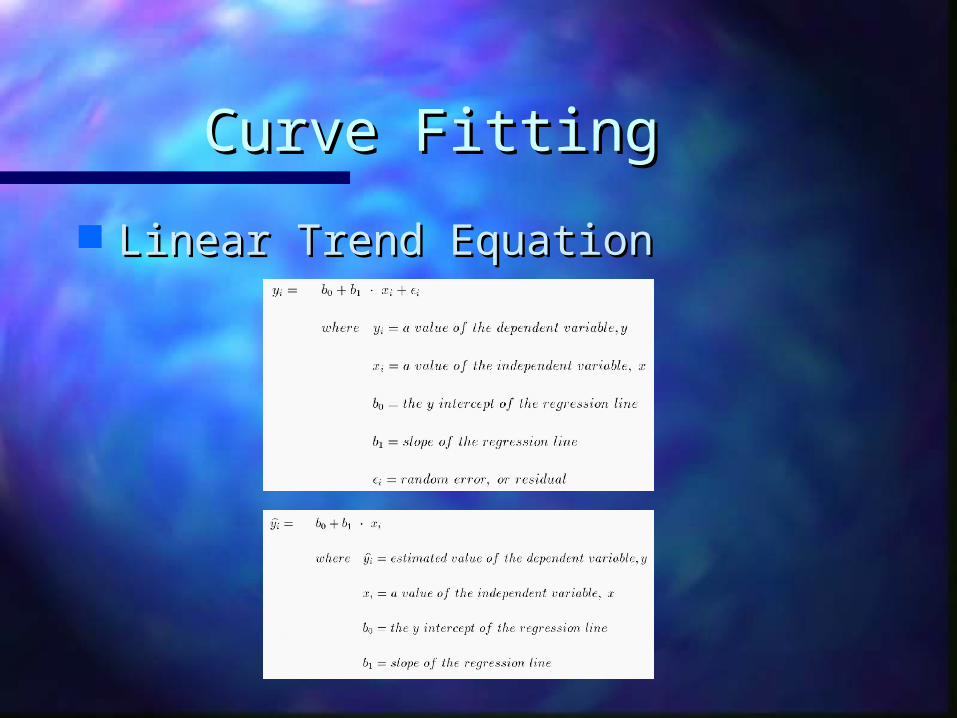
Curve FittingCurve Fitting
Linear Trend EquationLinear Trend Equation
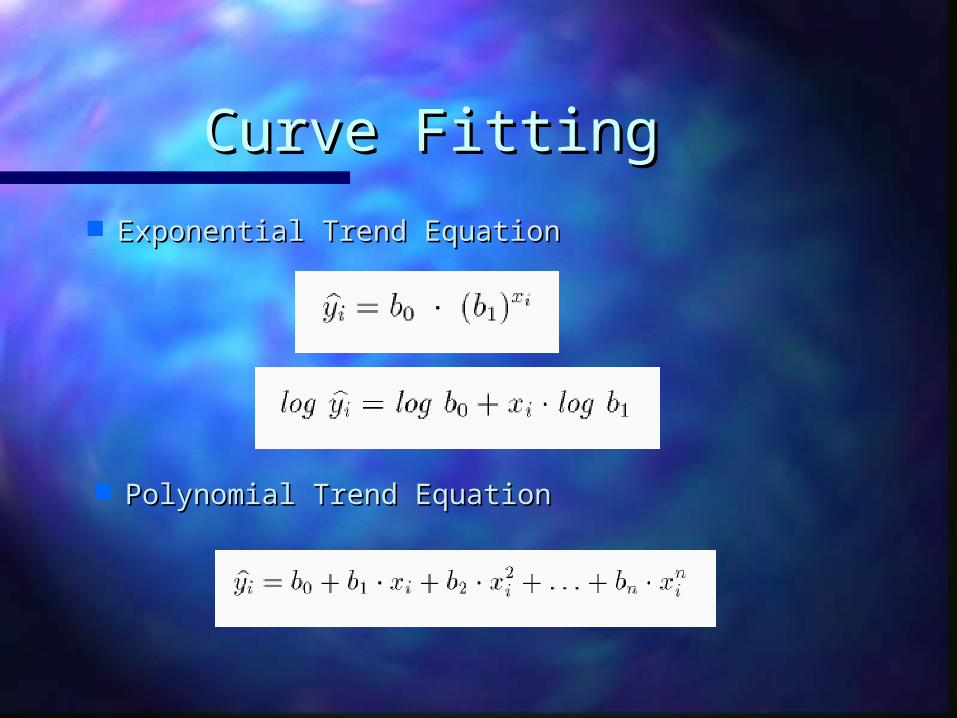
Curve FittingCurve Fitting Exponential Trend EquationExponential Trend Equation
Polynomial Trend EquationPolynomial Trend Equation

Smoothing TechniquesSmoothing Techniques
Moving AverageMoving Average
– each point is average of N pointseach point is average of N points
Exponential SmoothingExponential Smoothing

Time Series ForecastingTime Series Forecasting
Box-Jenkins MethodBox-Jenkins Method
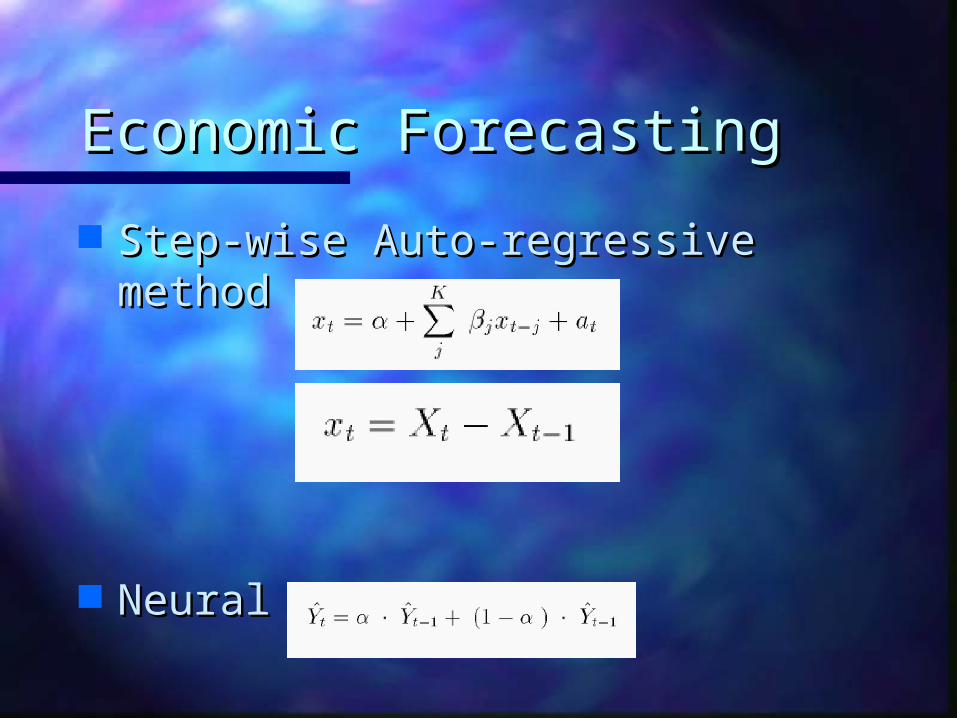
Economic ForecastingEconomic Forecasting
Step-wise Auto-regressive methodStep-wise Auto-regressive method
Neural NetworksNeural Networks

System DynamicsSystem Dynamics
Modeling Dynamic SystemsModeling Dynamic Systems– Information feedback loopsInformation feedback loops

System DynamicsSystem Dynamics
– LevelsLevels
– Flow RatesFlow Rates
– Decision FunctionsDecision Functions

System DynamicsSystem Dynamics
Levels and RatesLevels and Rates
Laundry ListLaundry List
Levels Rates Inflows Outflows
Population Birth Rate Death RateMoney Income ExpensesFrustration Stress AffectionLove Affection FrustrationTumor Cells Infection TreatmentInventory on Stock Shipments SalesKnowledge Learning Forgetting
Birth Rate:
• Population• Material Standard of Living• Food Quality• Food Quantity• Education• Contraceptives• Religious Beliefs

Structure DiagramStructure Diagram

Forrester’s World ModelForrester’s World Model
PopulationPopulation Capital InvestmentCapital Investment Unrecoverable Natural ResourcesUnrecoverable Natural Resources Fraction of Capital Invested in the Fraction of Capital Invested in the
Agricultural SectorAgricultural Sector PollutionPollution
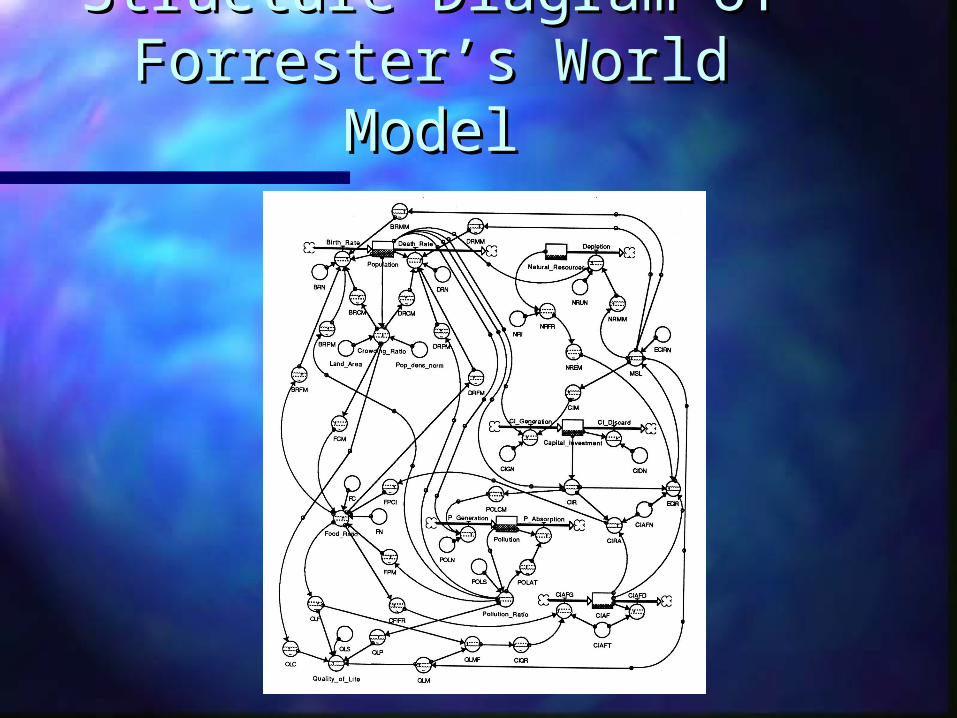
Structure Diagram of Structure Diagram of Forrester’s World ModelForrester’s World Model
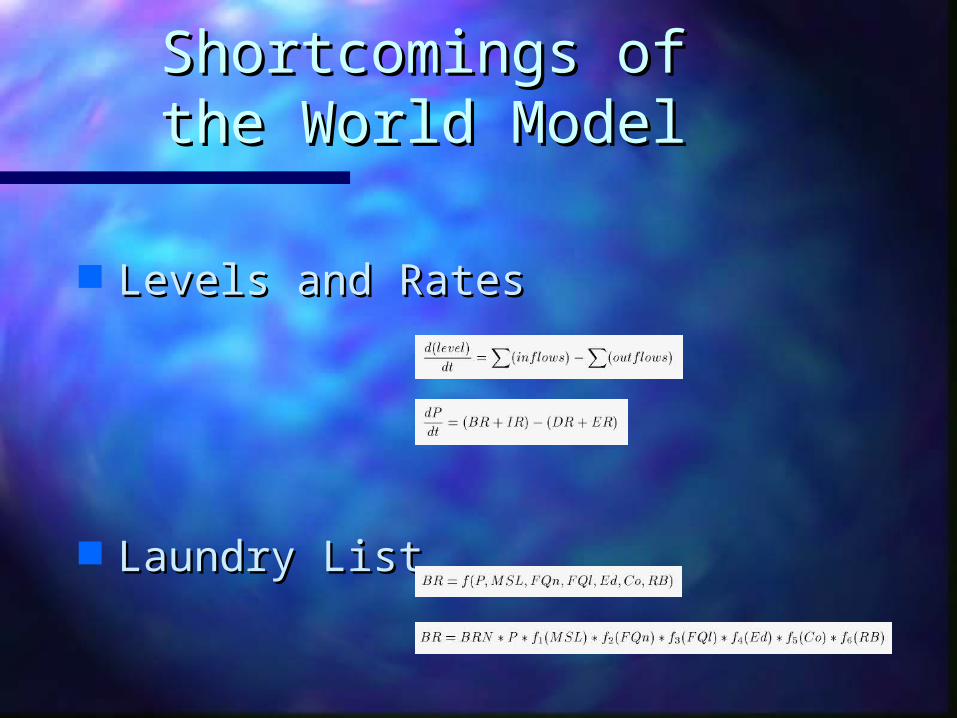
Shortcomings of the Shortcomings of the World ModelWorld Model
Levels and RatesLevels and Rates
Laundry ListLaundry List
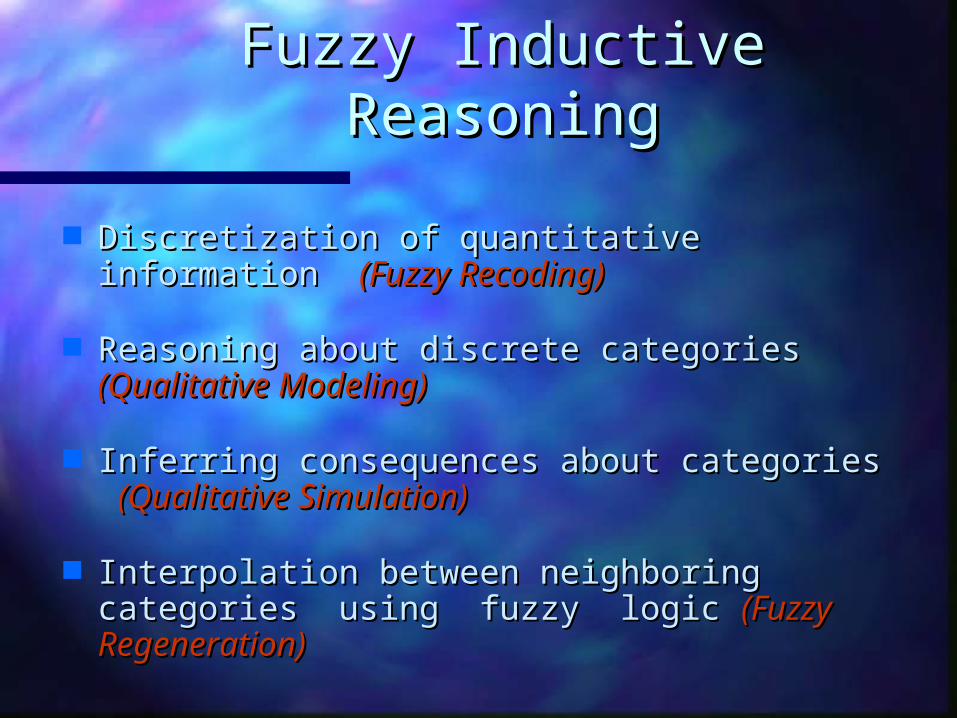
Fuzzy Inductive Fuzzy Inductive ReasoningReasoning
Discretization of quantitative information Discretization of quantitative information (Fuzzy Recoding)(Fuzzy Recoding)
Reasoning about discrete categories Reasoning about discrete categories (Qualitative Modeling)(Qualitative Modeling)
Inferring consequences about categories Inferring consequences about categories (Qualitative Simulation)(Qualitative Simulation)
Interpolation between neighboring Interpolation between neighboring categories using fuzzy logic categories using fuzzy logic (Fuzzy (Fuzzy Regeneration)Regeneration)
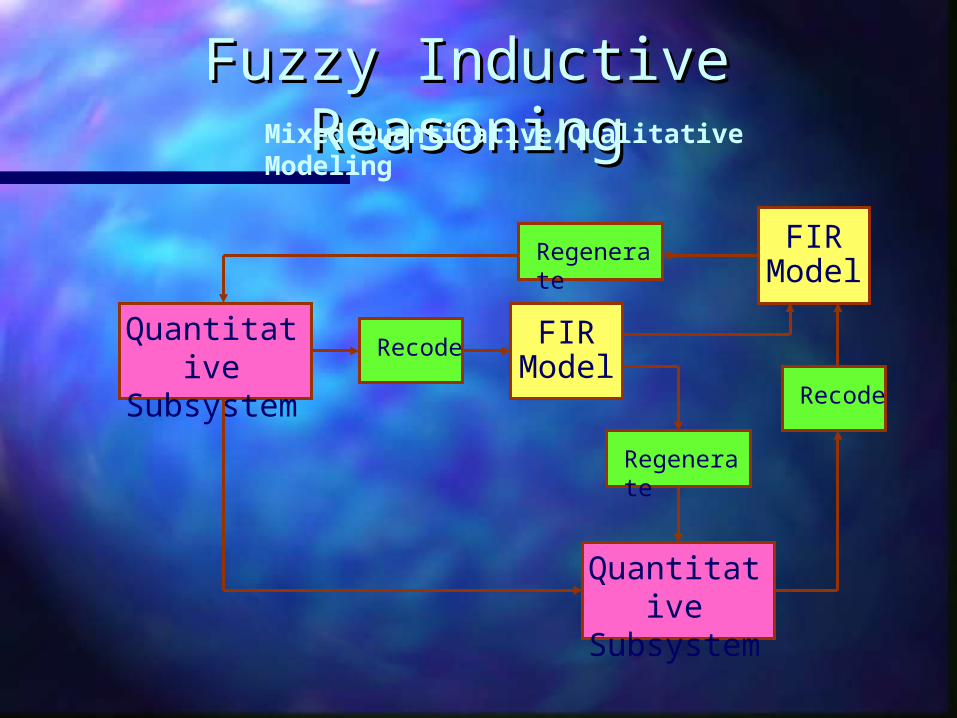
Fuzzy Inductive Fuzzy Inductive ReasoningReasoningMixed Quantitative/Qualitative Modeling
Quantitative Subsystem
Recode FIR Model
Regenerate
Quantitative Subsystem
Recode
FIR Model
Regenerate

FuzzificationFuzzification
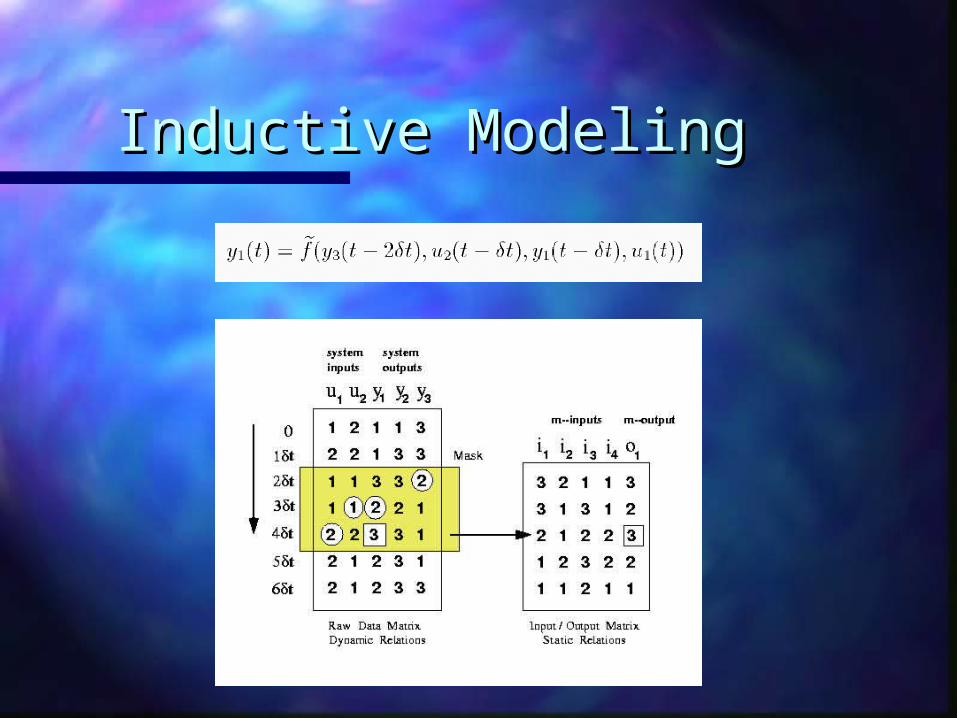
Inductive ModelingInductive Modeling

Inductive SimulationInductive Simulation

Modeling the ErrorModeling the Error
Making predictions is easy!Making predictions is easy!
Knowing how good the predictions are: Knowing how good the predictions are: That is the real problem!That is the real problem!
A modeling/simulation methodology that A modeling/simulation methodology that doesn’t assess its own error is worthless!doesn’t assess its own error is worthless!
Modeling the error can only be done in a Modeling the error can only be done in a statistical sense … because otherwise, the statistical sense … because otherwise, the error could be subtracted from the error could be subtracted from the prediction leading to a prediction without prediction leading to a prediction without the error.the error.

Food Demand ModelFood Demand Model
Naïve ModelNaïve Model Enhanced Macroeconomic ModelEnhanced Macroeconomic Model
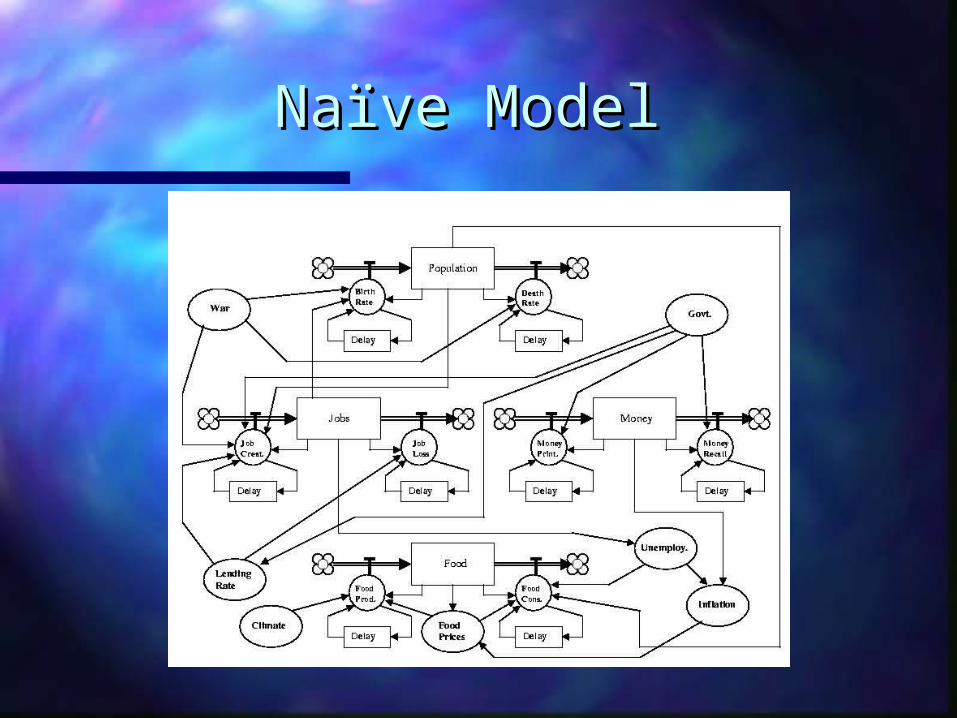
Naïve ModelNaïve Model
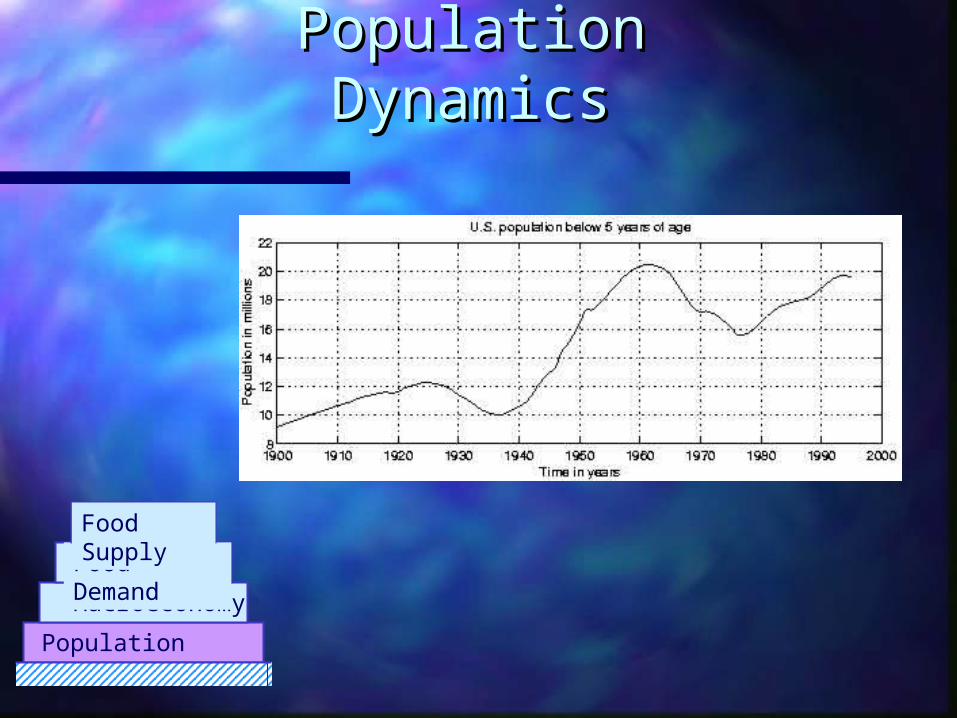
Population DynamicsPopulation Dynamics
Population Dynamics
Macroeconomy
Food Demand
Food Supply

Population DynamicsPopulation Dynamics
Predicting Growth FunctionsPredicting Growth Functions
k(n+1) = FIR [ k(n), P(n), k(n-1), P(n-1), … ]
Population Dynamics
Macroeconomy
Food Demand
Food Supply

Population DynamicsPopulation Dynamics
Population Dynamics
Macroeconomy
Food Demand
Food Supply

MacroeconomyMacroeconomy
Population Dynamics
Macroeconomy
Food Demand
Food Supply

MacroeconomyMacroeconomy
Population Dynamics
Macroeconomy
Food Demand
Food Supply

Food Food Demand/SupplyDemand/Supply
Population Dynamics
Macroeconomy
Food Demand
Food Supply
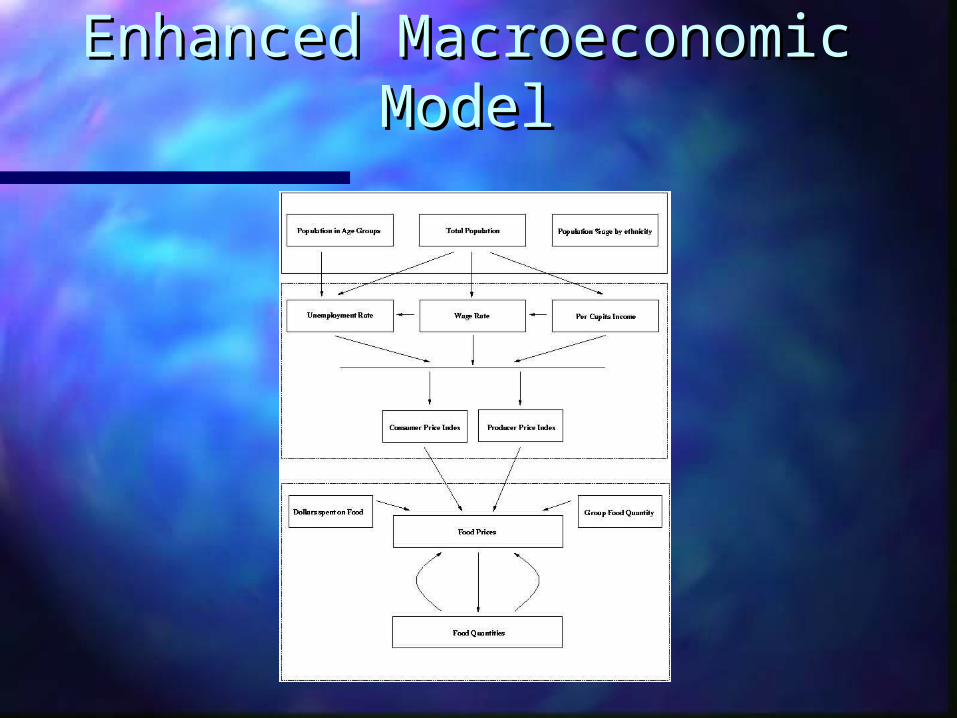
Enhanced Macroeconomic Enhanced Macroeconomic ModelModel
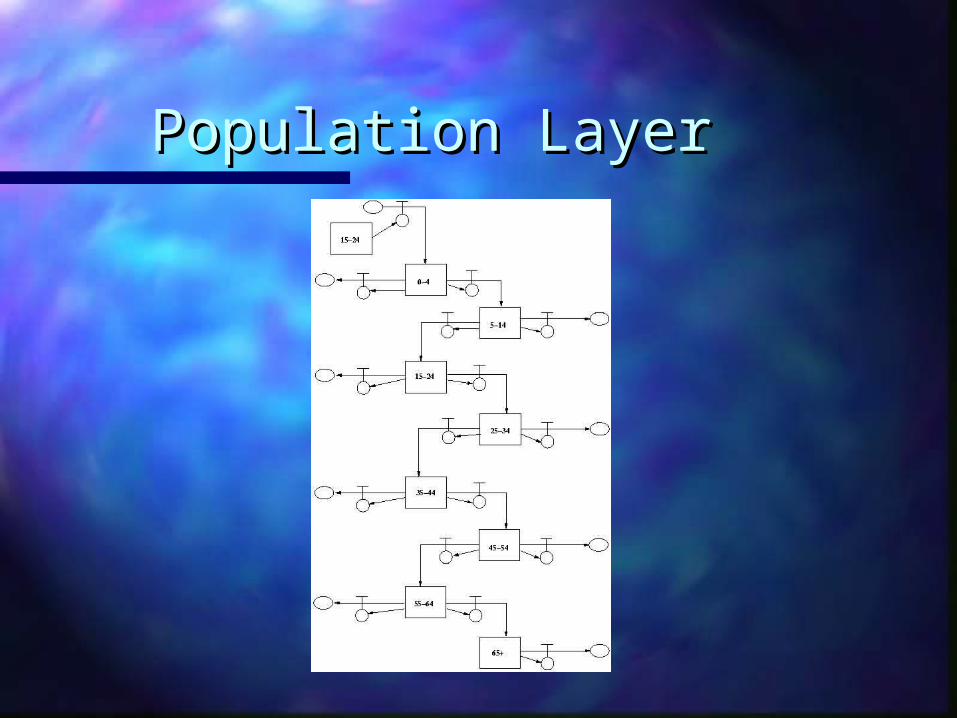
Population LayerPopulation Layer
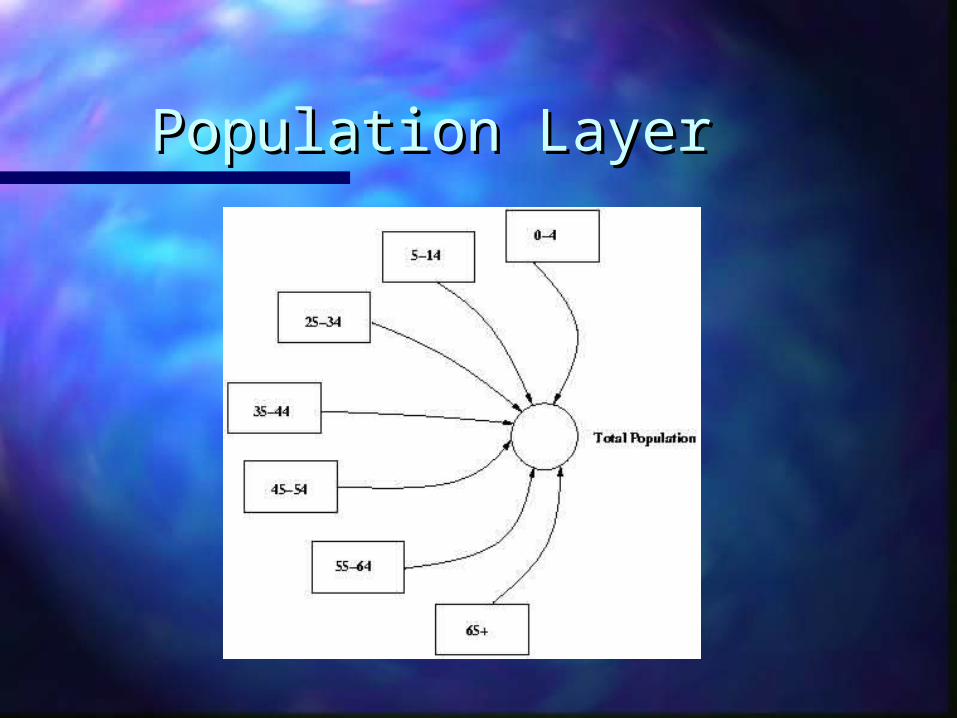
Population LayerPopulation Layer
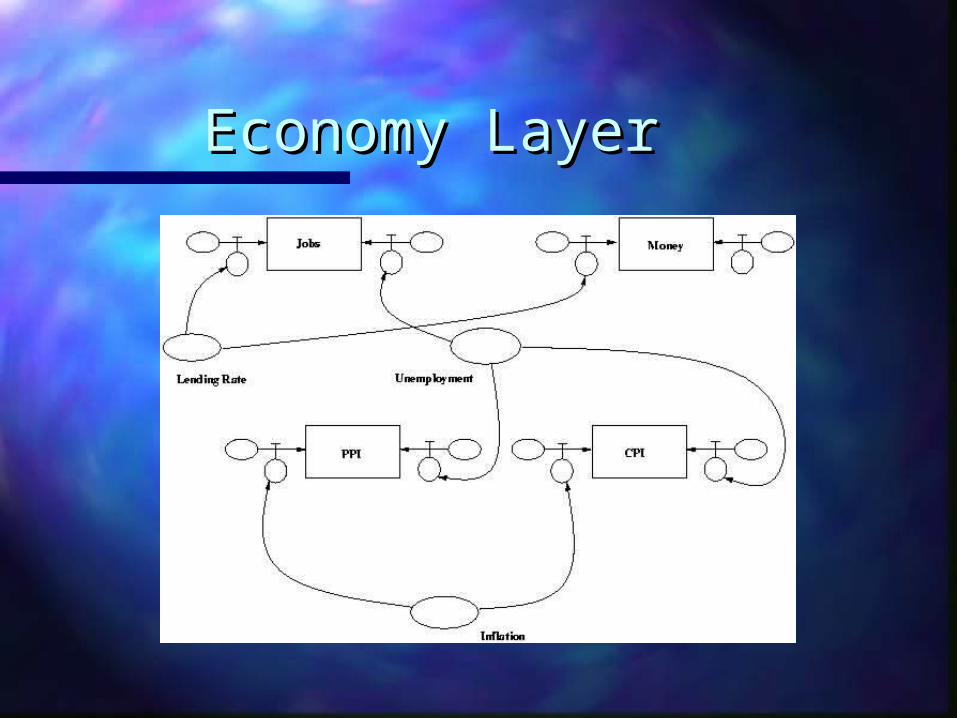
Economy LayerEconomy Layer
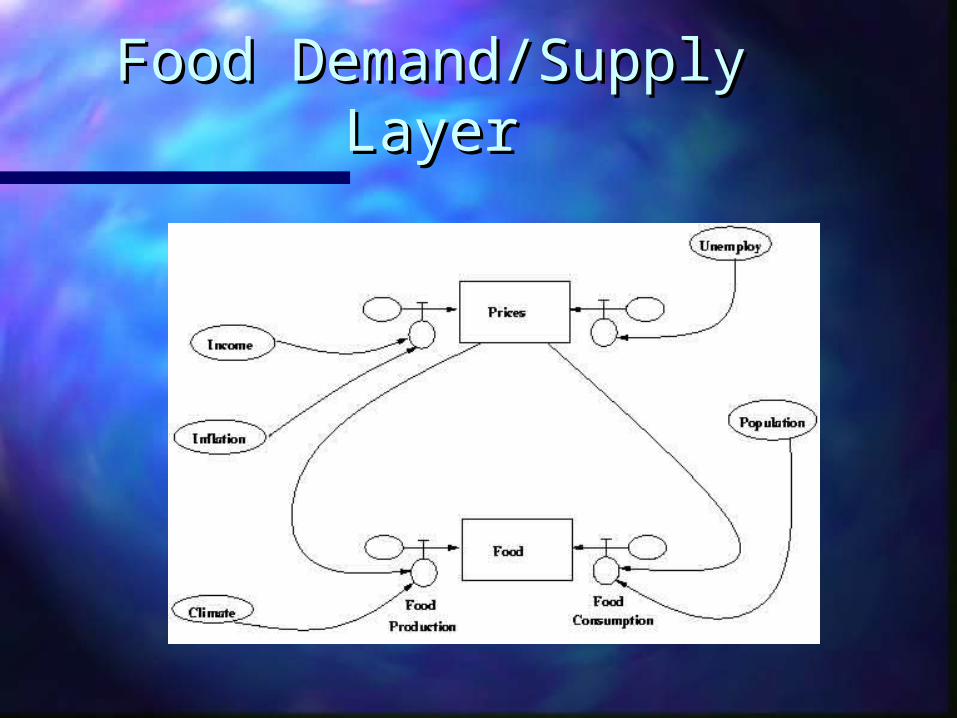
Food Demand/Supply Food Demand/Supply LayerLayer
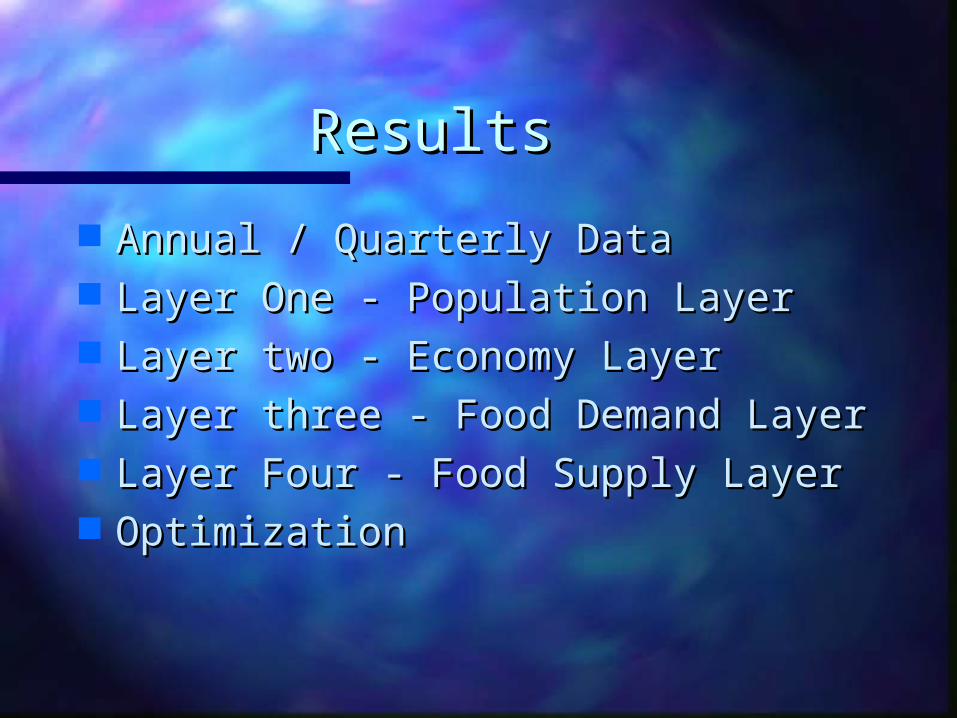
ResultsResults
Annual / Quarterly DataAnnual / Quarterly Data Layer One - Population LayerLayer One - Population Layer Layer two - Economy LayerLayer two - Economy Layer Layer three - Food Demand LayerLayer three - Food Demand Layer Layer Four - Food Supply LayerLayer Four - Food Supply Layer OptimizationOptimization
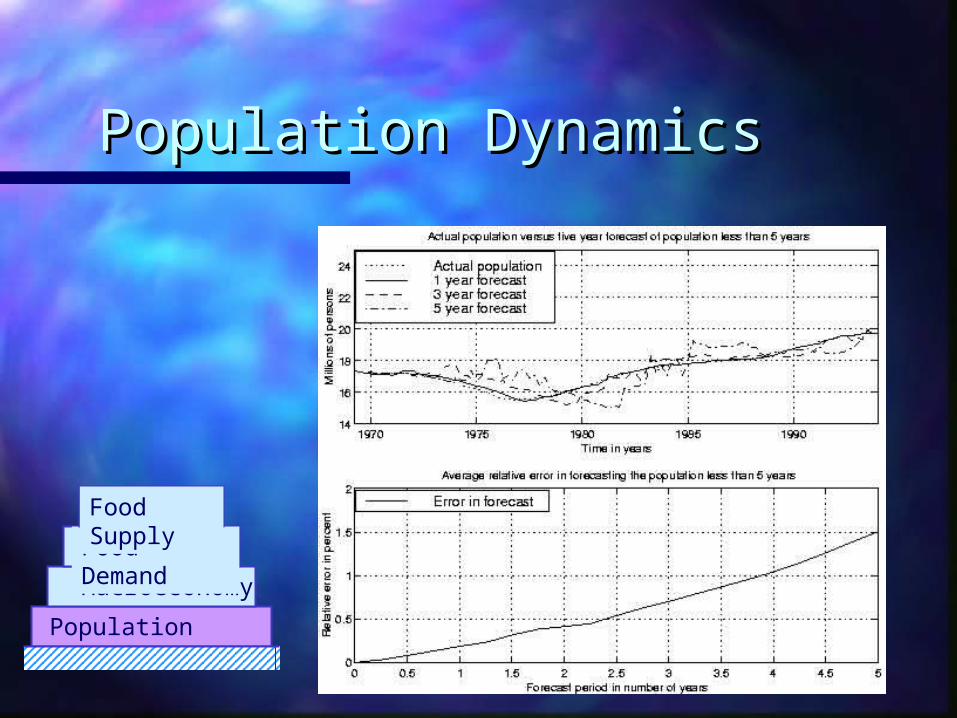
Population DynamicsPopulation Dynamics
Population Dynamics
Macroeconomy
Food Demand
Food Supply
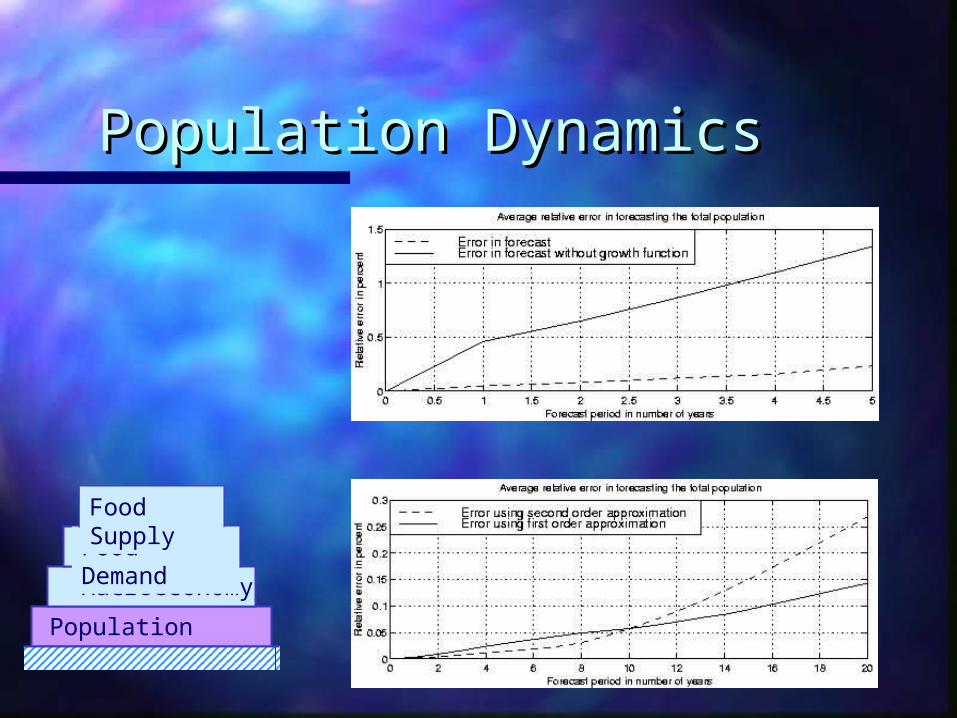
Population DynamicsPopulation Dynamics
Population Dynamics
Macroeconomy
Food Demand
Food Supply
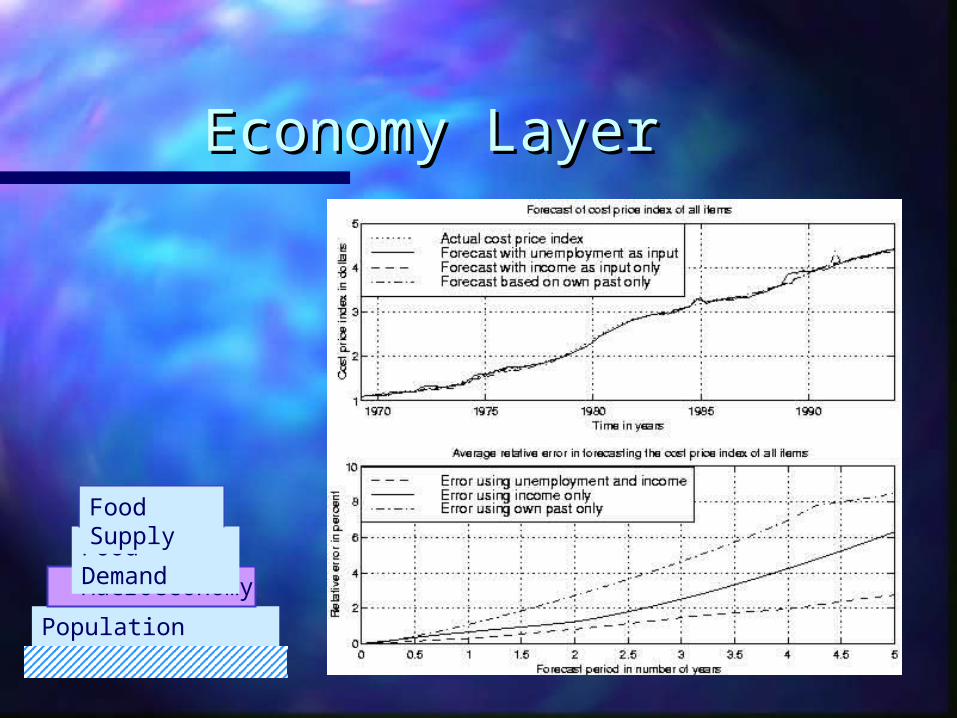
Economy LayerEconomy Layer
Population Dynamics
Macroeconomy
Food Demand
Food Supply
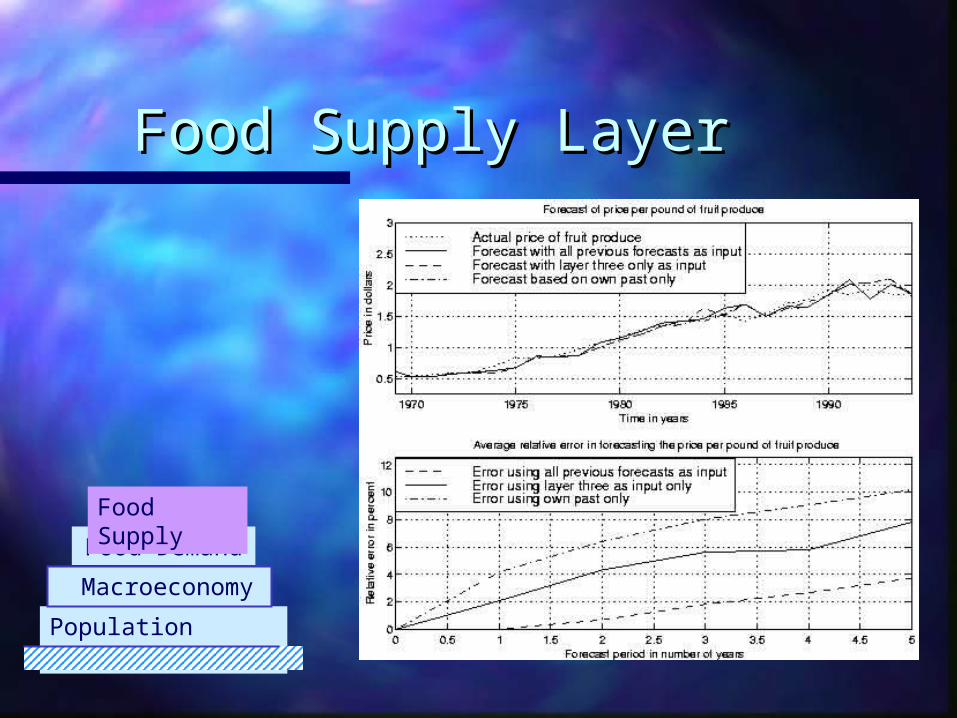
Food Supply LayerFood Supply Layer
Population Dynamics
Macroeconomy
Food Demand
Food Supply

Food Demand LayerFood Demand Layer
Population Dynamics
Macroeconomy
Food Demand
Food Supply

OptimizationOptimization
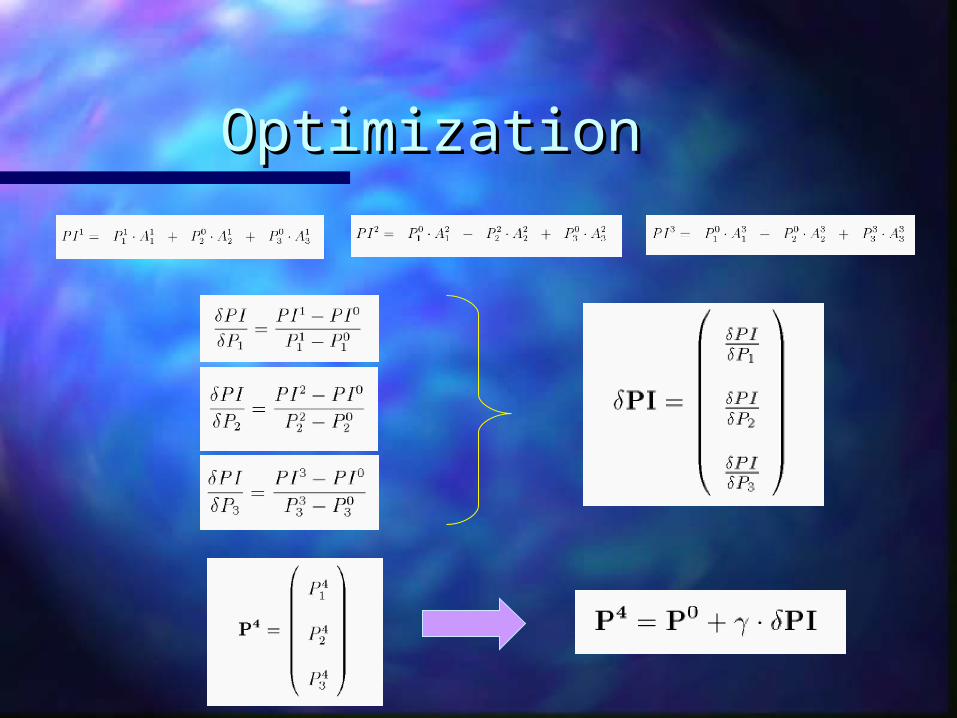
OptimizationOptimization

Conclusion and Future Conclusion and Future WorkWork
Mixed SD/FIR Mixed SD/FIR offers the best of both worlds.offers the best of both worlds.
Application to any U.S. industry with change of Application to any U.S. industry with change of demand and supply layers alone.demand and supply layers alone.
Application to any new country or region with Application to any new country or region with new data for layers 1 and 2.new data for layers 1 and 2.
Fuzzy Inductive Reasoning Fuzzy Inductive Reasoning features a features a model model synthesissynthesis capability rather than a capability rather than a model learningmodel learning approach. It is therefore quite fast in setting up approach. It is therefore quite fast in setting up the model.the model.

Conclusion and Future Conclusion and Future WorkWork
Fuzzy Inductive Reasoning Fuzzy Inductive Reasoning is highly robust is highly robust when used correctly.when used correctly.
Fuzzy Inductive Reasoning Fuzzy Inductive Reasoning offers a offers a self-self-assessmentassessment feature, which is easily the most feature, which is easily the most important characteristic of the methodology.important characteristic of the methodology.
OptimizationOptimization with data collected at more with data collected at more frequent intervals.frequent intervals.