
Mud Mountain Dam Seepage Control Cutoff Wall - … · Mud Mountain Dam Seepage Control Cutoff Wall...
261
JAN 41992 00M3 U 8 I US Army Coros Construction/ of Engineers Seattle District Foundation Report AD-A244 923 0. 0 C; Mud Mountain Dam Seepage Control Cutoff Wall White River, Washington 11!9 2-019 111 uut19 V_2_3_0_6I
Transcript of Mud Mountain Dam Seepage Control Cutoff Wall - … · Mud Mountain Dam Seepage Control Cutoff Wall...

JAN 41992 00M3U8 IUS Army Coros Construction/of EngineersSeattle District Foundation Report
AD-A244 923
0. 0 C;
Mud Mountain DamSeepage Control Cutoff WallWhite River, Washington
11!9 2-019 111 uut19
V_2_3_0_6I

DVIC TAB3U. or.J
CONSTRUCTION FOUNDATION REPORT B% .I...... .. ..4....SEEPAGE CONTROL WALL Dj.bV
CONTRACT NO. DACW67-88-C-0047 -
Di;t
-4.
MUD MOUNTAIN DAM (LOOKING N.E.). SPILLWAY (FOREGROUND) WITH DAMAND DOWNSTREAM ACCESS ROAD (RIGHT CENTER). PROJECT AND RESIDENT OFFICESTO THE LEFT OF SPILLWAY.

MUD MOUNTAIN D.'.
CONSTRUCTION FOUNDATION REPORT, AUGUST 1991
This report has been prepared by the following Seattle District personnel
assigned to the Mud Mountain Resident Office:
NAME SIGNATURE DATE
Hiroshi Eto, P.E. __ _ _ ?lA $/..Acting Resident Engineer
Matthew V. Satter, P.C.__zA /Resident Geologist
Kenneth L. Forbes zbio Alo,Certified Concrete Construction T'pc tor

TABLE OF CONTENTS
CONSTRUCTION FOUNDATION REPORTSEEPAGE CONTROL WALL
CONTRACT NO. DACW67-88-C-0047
Page No.
PERTINENT DATA 1
REPORTS AND REFERENCES 3
SECTIONS
Section
I - Intzoduction
A. Location and Description of Project I-I
B. Construction and Study Authorizations I-I
C. Purpose of Report 1-2
D. Statement of Problem 1-2
E. Location of Structure 1-3
F. Contractor and Contract Supervision 1-3
II - Geology
A. Areal Geology II-1
B. Seismic Setting Il-I
C. Site Geology 11-2
D. Stratigraphy 11-3
E. Structure 11-6
F. Weathering 11-7
G. Groundwater 11-8

SECTIONS CONTINUED
III- Embananent/Foundation Explorations Page No.
A. Investigations III-i
B. Engineering Characteristics of Overburden 111-6
C. Engineering Characteristics of Bedrock 111-6
IV - Existing Dam
A. Design IV-l
B. Construction History IV-1
C. Post-Construction Problems IV-2
V - Access Shaft V-I
VI - Construction
A. General VI-l
B. Site Preparation VI-1
C. Bentonite Slurry VI-2
D. Excavation VI-8
VII - QA/QC Program VII-I
VIII - Contract Construction Problems VIII-1

SECTIONS CONTINUED
IX - In-Situ Core Modification Pag e No.
A. Introduction IX-1
B. Recompaction Grouting Procedures IX-l
C. Recompaction Grouting Reaults IX-iO
D. Reactivated Dam Settlement IX-10
X -- Dam Monitoring
A. Purpose X-1
B. Piezometers X-1
C. Inclinometers X-3
D. Settlement Monuments X-4
E. Seismic Recorder X-5
XI - Concrete Materials, Batching, and Placing
A. Aggregate Source X1-1
B. Aggregate Production XI-3
C. Cementitious Materials XI-6
D. Admixtures XI-7
E. Concrete XI-8
PHOTOGRAPHS
PLATES
PII
Jy

PERTINENT DATA
1. General
Federal Identification Number WA00300Owner/Operator U.S. Army Corps of Engineers,
Seattle DistrictDate Constructed 1939-1942 and 1947-1948Purpose Flood ControlDownstream Hazard Potential Category 1 (high)Size Classification Large
2. Jfcation
County, State King/Pierce, WashingtonGLO Location Sec 17, T19N, R7E, W.M.USGS quadrangle EnumclawLatitude 470 - 8.4'Longitude 1210 55.91Upstream from Mouth of White River 28 milesUpstream from Mouth of Puyallup River 38 miles
3. Reservoir Data
Watershed Upper White RiverDrainage Area 400 square milesPMF Outflow 245,000 c.f.z.Capacity at Spillway Crest 106,000 acre-feetCapacity at Pool Elevation of 1252 feet 147,500 acre-feetPool at PMF 1,252.2 feet
4. Dam
Type Rockfill (Concrete cutoff wall inearth core)
Structural Height 432 feetHydraulic Height 360 feetCrest Elevation 1,257 feet mslCrest Length 810 feetWidth
at Base 1,600 feetat Crest 25.5 feet
Volume of Fill 2,300,000 cubic yardsConcrete in Project 87,000 cubic yardsConcrete in Cutoff Wall 17,00C cubic yardsDesign Freeboard 4.8 feet
5. S~lla
Location Right AbutmentType Concrete Free-O0verflow Chute
4

Crest 1,215 feetElevation 315 feetWidth 1200 feetLength 245,000 c.f.s.
Capacity at Pool Elevation 1,252.2 feet
6. Outlet Works
9-Foot TunnelType Concrete, HorseshoeLocation Right bankLength 1,800 feetIntake Elevation 895 feetControl 9-foot Radial Gate at
Upstream EndDischarge at Pool Elev. 1,215 feet 5,200 c.f.s.1
23-Foot TunnelType Concrete, CircularLocation Right BankLength 1991.5 feetIntake Elevation 970 feet mslControl Three PenstocksDischarge at Pool Elev. 1,215 feet 12,400 c.f.s.1
Penstocks (in 23-foot tunnel)Number ThreeLength 867.5 feetDiameter 8.5 feetRegulating Valves Three 8-foot Howell-Bunger
valvesDischarge at Pool Elev. 1,215 feet approx. 4,200 c.f.s. for each
valve
1 Discharge for new intake structure:Total authorized flood control discharge: 17,600 c.f.s.9' Tunnel discharge I elov. 1,215' msl: 4,600 c.f.s.23' Tunnel discharge 0 alev. 1,215' msl: 13,000 c.f.s.*
* maximum possible discharge: 19,550 c.f.s.
2

SEATTLE DISTRICT, US ARMY CORPS OF ENGINEERS
MUD MOUNTAIN DAMREPORTS AND REFERENCES
Subject Date
Construction Plans
Geological Report, Edwin T. Hodge 18 July 1938
Analysis of Design, Mud Mountain Dam 3 December 1938
Design of Mud Mountain Dam and Appurtenances 30 December 1938
Report oa Soil Tests for Mud Mountain Dam 11 May 1939
TH 164-1, WES, Results of Soil Test onMaterials from Proposed Mud Mountain Dam 20 December 1939
Contract Specifications for the Dam 1939
Test Fill Report for Mud Mountain Dam
Bonneville Hydraulic Laboratory, ModelStudy of the Spillway for Mud Mountain Dam 1942
WES Bulletin No. 14, PermaeabilityCharacteristics of Mud Mountain Impre-vious Clay Materials 20 February 1942
Foundation Report 21 March 1942
Bonneville Hydraulic Laboratory, ModelStudy of the 23-Foot Outlet Tunnel forMud Mountain Dam 15 July 1942
Prototype Testing January 1945
Agenda for Consulting Board Meeting 28-29 July 1945
Analysis of Design-mbankment Design 1946
Analysis of Design-Design Other ThanEmbankment 1946
Analysis of Design-Original 9-Foot Gate,Modified 9-Foot Gate and Cable Way 1946
Master Recreation Plan 1946
Real Estate, Preliminary Planning Report-
Civil Project-Tracts 14 and 15 4 March 1948
3

Subject Date
Supplement to Agenda for ConsultingBoard Meeting 28-29 July 1948
Proceedings of Consulting BoardMeeting 28-29 July 1948
Real Estate, Preliminary PlanningReport-Civil Project-Easements forRadio Reporting Network, Puyallup RiverBasin, Mud Mountain Dam 4 May 1949
Report of Earthquake Damage 1949
Proposed Improvements-Right Bank January 1950
Proposed Revisios-Outlet Works January 1950
Real Estate Supplement to PreliminaryPlanning Report-Easements for RadioReporting Netwo.k, Puyallup River Basin,Mud Mountain Dam 13 February 1950
Real Estate Supplement to Supplementdated 13 February 1950 (same title) 6 March 1952
Reservoir Regulation Manual August 1954
Real Estate Planning Report-CivilProject--ud Mountain Dam, PiezometerStations 26 August 1954
Real Estate--Design Memorandum No. i--Access Road and Bridge i February 1953
Design Memorandum (unnumbered)-ImprovedAccess Upstream and Downstream OutletWorks Structures December 1960
Design Memorandum Supplement No. 1-Improved Access to Upstream and Down-stream Outlet Works Structures December 1962
Design Memorandum No. LA (no approval date)
Design Memorandum No. lB-ReservoirManagement and Public Use Development(Master Plan) March 1964
4

Subject Date
Report of Earthquake Damage 1965
Periodic Inspection and ContinuedEvaluation Report-Inspection of: 20 July 1967
Design Memorandum No. 1B RevisedMaster Plan December 1968
Periodic Inspection and ContinuingEvaluation Report-Inspection of: 29 April 1969
Periodic Inspection and ContinuingEvaluation Report No. 3-Inspection of: 7 October 1971
Environmental Impact Statement-MudMountain Dam and Reservoir, White River,Washington April 1972
Cableway Replacement Planning Report May 1973
Periodic Inspection and ContinuingEvaluation Report No. 4--Inspection of: 23 May 1973
Feasibility of Forest ManagementDetermination Report December 1973
Mud Mountain Dam, Interpretive ConceptPlan April 1974
USGS Water Resources Investigation 78-113Sediment Transportation by the White River June 1974-into Mud Mountain Reservoir June 1976
Design Memorandum No. 20B--The MudMountain Dam Master Plans, Phase III September 1974
Periodic Inspection and ContinuedEvaluation Report No. 5-Inspection of: 22 April 1975
Design Memorandum No. LC-Mud Mountain
Master Plan April 1976
Design Memorandum No. 2-Visitors Center May 1976
Design Memorandum No. 3-Water TreatmentPlant September 1976
4 5

Subject Date
Real Estate-Design Memorandum No. 8-Revised Guide Taking Line September 1976
Means of Improving the Capability andQuality of the Water System-HarstadAccounts, Inc. March 1977
Periodic Inspection Report No. 6-Inspection of: April 1977
Design Memorandum No. 4-StabilizingRight Downstream Bank September 1977
Design Memorandum No. 5-Constructionof Road on Upstream Face of Dam September 1977
Design Memorandum No. 6-Stop Log Hoistfor 9-Foot Tunnel September 1978
Design Memorandum No. 7-Rehabilitationof Apron Structure for 9-Foot Tunnel August 1979
Supplement No. 1 to Design Memorandum IC-Landscaping and Parking Improvements October 1979
Design Memorandum No. L2--SupplementNo. 9, Rockfill Dam, Spillway OutletWorks and Related Project Facilities --
Operational and Maintenance Manual June 1981
Emergency Preparedness Brief with DamBreak Flood Inundation Maps April 1982
Periodic Inspection Report No. 7-Inspection of: 5 May 1982
Effect of Mud Mountain Dam Regulationon Sediment Movement in the White River,Northwest Hydraulic Consultants, Inc. July 1983
Design Memorandum No. 25-EarthquakeAnalysis of Mud Mountain Dam September 1983
Reconnaissance Report for Mud MountainDam, Dam Safety Assurance Program April 1984
6

Subject Date
Preliminary Reconnaissance Report on
Seepage Studies at Mud Mountain Dam 20 August 1985
Reconnaissance Report on SeepageControl, Mud Mountain Dam 13 December 1985
Real Estate-Design Memorandum No. 27-Contractor Staging Area Dam SafetyAssurance Program, Mud Mountain Dam January 1986
General Design Memorandum No. 26-Dam Safety Assurance Program, MudMountain Dam July 1986
Supplement No. 1 to General Design
Memorandum No. 26--Mud Mountain DamCore of Dam Seepage Control Measures July 1986
Feature Design Memorandum No. 28-Outlet Works Modifications, Mud MountainDam February 1989
Soletanche "As-Built" Final Report 1990Concrete Cutoff Wall
7

SECTION I
INTRODUCTION
SECTION I INTRODUCTION
A. Location and Description of Project. Mud Mountain Dam is located on the
White River,.approximately 40 miles southeastof Seattle, Washington.just
inside the western Cascade Mountain front, at the eastern edge of the uget
Sound basin (Plate l).4 The dam is used solely as a flood control facility for
Puyallup, Sumner, Tacoma and the lower White and Puyallup river basin.-, The
adjacent Puyallup and Carbon Rivers to the south are unregulated and converge
with the White River in Sumner.
The dam is a zoned, 425 ft. high, earthfill structure consisting of a
central dam core, flanking transition zones and sluiced rock shells. Elevation
at the top of the dam (pre-contract) is 1250, with a flanking concrete chute
spillway (crest El. 1215) on the right abutment (Plate 2). Normal riverflow is
passed through two controlled 2,000 ft. long tunnels in the right bank. The
dam embankment was constructed from 1939 to 1941 and was at that time the
highest embankment dam in the world.
B. Construction and Study Authorizations. AThe construction of,1a flood control
dam at Mud Mountainwas authorized by the Flood Control Act of 1936. The flood
Control Act of 1938 provided for the operation and maintenance (O&M) of the
completei projectwhich is under the supervision of the Seattle District, U.S.
I-I

Army Corps of Engineers. Construction and O&M of the dam and its recreational
tacilities was authorized by the Flood Control Act of 1944.
Study authority for the current project was in accordance with ER 1110-2-
417, Project Operation Major Rehabilitation Program and Dam Safety Assurance
Program dated November 30, 1980. Construction of the seepage cutoff wall is
pursuant to Supplement No. 1 of General Design Memorandum No. 26.
C. Purpose of Report. This foundation report is prepared and submitted in
accordance with ER 1110-1-1801, dated December 15, 1981. itAdocuments
construction procedures and foundation conditions.encountered on this unique
project. The information contained herein will be useful for future work on
the embankment, or for planning purposes on projects with similar design
requirements.
D. Statement of Problem: 'In 1980 a single open piezometer tube (P-40) was
installed in the core of the dam at its deepest point. The piezometric surface
was monitored through 1984 with some unsettling results. Through the 4 year
period, the piezometer responded progressively faster to fluctuations in
seasonal pools. This was disturbing in light of the fact that design core
-6permeability was on the order of XO - cm/sec. Seventeen additional
piezometers were installed in 1985-06 to verify and characterize the problem.
These borings encountered loose zon s, heaving, "clean" sands and gravels and
suspected "voids". Gradation tests pn samples taken from these borings
suggested they were core materials from which the fine sand sizes had beenN
removed.
1-2

2
Subsequent information gained from the additional piezometers corroborated
the suspicion that the fines were progressively being removed from the dam
core by seasonal pool raises. It is suspected that water from each pool raise
infiltrated a network of cracks and loose zones in the upstream face of the
core, then pulled the finer faction upstream upon lowering.
E. Location of Structure. Most of the cutoff wall alignment is located 10
feet upstream and parallel to the dam axis as shown on Plate 2. The wall is
807.5 feet long, 32" to 40" wide and 20 to 402.6 feet deep, depending on
bedrock elevation, including a minimum 15 feet embedment normal to bedrock
surfaces.
F. Contractor and Contract Supervision.' Construction of cutoff walls by the
slurry trench method has been proven reliable and effective inseveral large
Corps of Engineers and Bureau of Reclamation*dam remediation projects" along
with many similar private, domestic and foreign projects. Seattle District
requested prequalification of bidders. Four companies bid on the (revised)
contract in July 1988; Soletanche, Inc., Bachy/Bauer/Raymond/Green (Joint
Venture), S.A. Healy Co. - I.C.O.S. SPA (Joint Venture), and Bencor Petrifond
(Joint Venture).
The Government estimate for the work was $31,6769000.00 and was
based on conventional clamshell excavation utilizing steel guide members. The
contract was awarded July 26, 1988 to Soletanche, Inc. for $19,948,900.00 with
1-3

Notice to Proceed issued August 12, 1988. This low bid was based on
Soletanche's anticipated use of their state-of-the-art excavator called the
"hydrofraise".
On site personnel included the following:
Soletanche - Management COE Resident Staff
Jacques Levallois - Project Manager Larry D. Ems - Resident Engineer
Marc Van de Eynde - Q.C. Manager Hiroshi Eto - Assistant R.E.
Etienne Dietsche - Proj. Superintendent Matthew Satter - Resident Geologist
Brent Jones - Field Engineer Ken Forbes - Concrete Specialist
Merrall Sims :-Field Engineer Dick Wilsey - Const. Representative
Jean-Luc Gobert - Q.C. Manager Stu Wright - Const. Representative
Phil Fachan - Site Superintendent Jacqueline Perreault - Secretary
1-4

SECTION II
GEOLOGY

SECTION II - GEOLOGY
A. Areal Geology. The project is located on the edge of the western Cascade
Mountain front, where the White River Valley joins the Puget Sound Basin. The
unique and complex topography and geology which influence the whole project
area are a product of multiple Pleistocene glaciations in an ice border
environment and periodic deposition of pyroclastic mudflows (lahars) and debris
flows originating from the present and ancestral Mount Rainier volcanic center.
This Pleistocene and Holocene geologic history has resulted in a complex of
ice-marginal fill terraces and channels across and adjacent to the mouth of the
valley and flanking areas of the Puget Sound Basin. It has further resulted in
several diversions of the White River in this vicinity. At the dam site, the
river channel lies in a sharp turn against the south valley side where the
river has cut a deep canyon through the Pleistocene units and into the
underlying mudflows and volcanic bedrock. Bedrock is comprised of Tertiary
volcanics which are dominated by andesitic lavas, breccias and agglomerates,
with subordinate amounts of tuff and local zones of hydrothermal alteratiuns.
B. Seismic Setting. The Puget Sound area is considered a region of moderate
seismicity, a product of crustal and subcrustal events linked to the subduction
of oceanic crust beneath the Puget Sound basin. Historic macroseismicity and
microseismicity have occurred on, or near the Buckley fault and historic
II-I
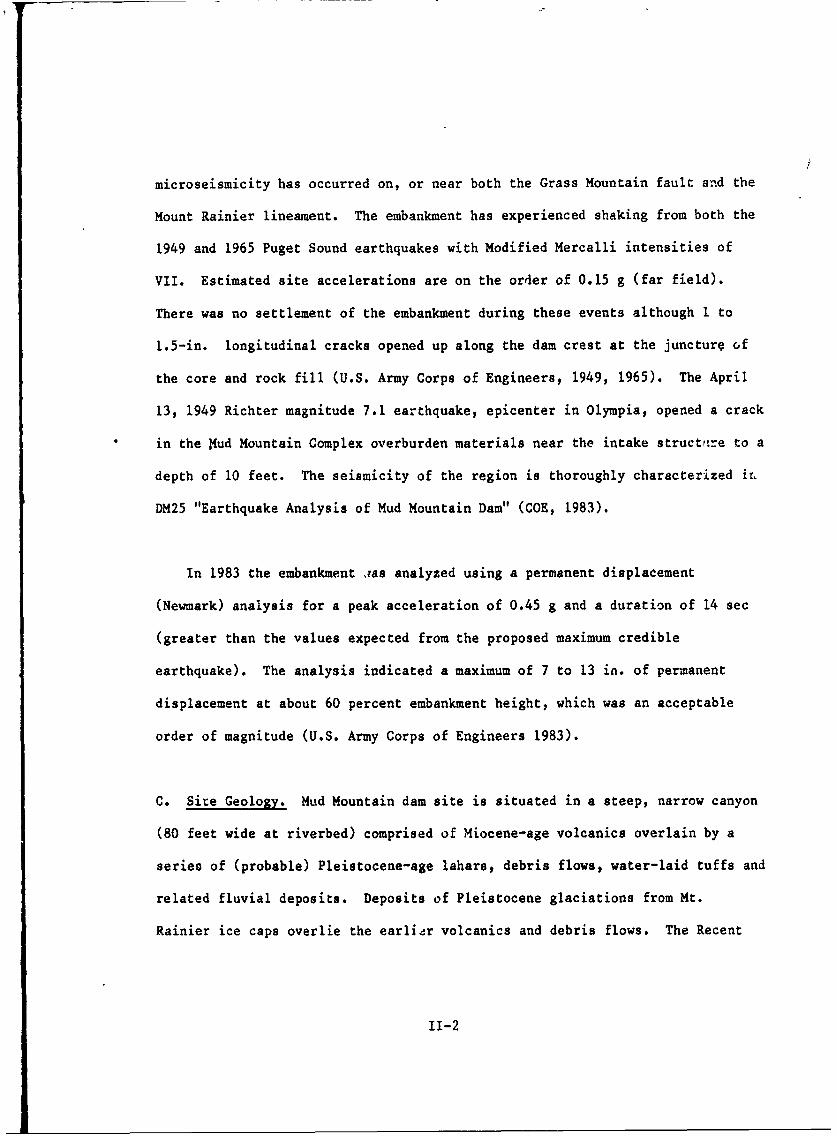
microseismicity has occurred on, or near both the Grass Mountain fault and the
Mount Rainier lineament. The embankment has experienced shaking from both the
1949 and 1965 Puget Sound earthquakes with Modified Mercalli intensities of
VII. Estimated site accelerations are on the order of 0.15 g (far field).
There was no settlement of the embankment during these events although I to
1.5-in. longitudinal cracks opened up along the dam crest at the juncture of
the core and rock fill (U.S. Army Corps of Engineers, 1949, 1965). The April
13, 1949 Richter magnitude 7.1 earthquake, epicenter in Olympia, opened a crack
in the 14ud Mountain Complex overburden materials near the intake struct!'re to a
depth of 10 feet. The seismicity of the region is thoroughly characterized ir,
DM25 "Earthquake Analysis of Mud Mountain Dam" (COE, 1983).
In 1983 the embankment tas analyzed using a permanent displacement
(Newmark) analysis for a peak acceleration of 0.45 g and a duration of 14 sec
(greater than the values expected from the proposed maximum credible
earthquake). The analysis indicated a maximum of 7 to 13 in. of permanent
displacement at about 60 percent embankment height, which was an acceptable
order of magnitude (U.S. Army Corps of Engineers 1983).
C. Site Geology. Mud Mountain dam site is situated in a steep, narrow canyon
(80 feet wide at riverbed) comprised of Miocene-age volcanics overlain by a
series of (probable) Pleistocene-age lahars, debris flows, water-laid turfs and
related fluvial deposits. Deposits of Pleistocene glaciations from Mt.
Rainier ice caps overlie the earlijr volcanics and debris flows. The Recent
11-2
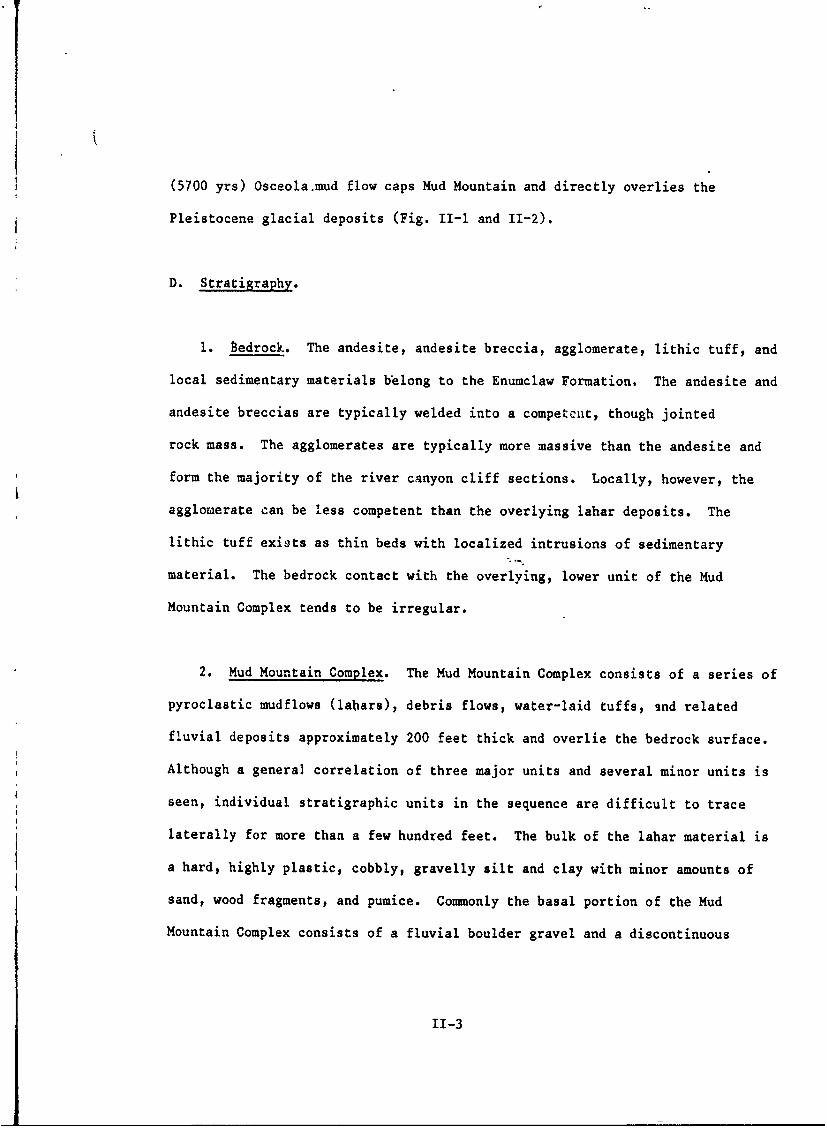
(5700 yrs) Osceola.mud flow caps Mud Mountain and directly overlies the
Pleistocene glacial deposits (Fig. II-1 and 11-2).
D. Stratigraphy.
1. Bedrock. The andesite, andesite breccia, agglomerate, lithic tuff, and
local sedimentary materials belong to the Enumclaw Formation. The andesite and
andesite breccias are typically welded into a competent, though jointed
rock mass. The agglomerates are typically more massive than the andesite and
form the majority of the river canyon cliff sections. Locally, however, the
agglomerate can be less competent than the overlying lahar deposits. The
lithic tuff exists as thin beds with localized intrusions of sedimentary
material. The bedrock contact with the overlying, lower unit of the Mud
Mountain Complex tends to be irregular.
2. Mud Mountain Complex. The Mud Mountain Complex consists of a series of
pyroclastic mudflows (lahars), debris flows, water-laid tuffs, and related
fluvial deposits approximately 200 feet thick and overlie the bedrock surface.
Although a general correlation of three major units and several minor units is
seen, individual stratigraphic units in the sequence are difficult to trace
laterally for more than a few hundred feet. The bulk of the lahar material is
a hard, highly plastic, cobbly, gravelly silt and clay with minor amounts of
sand, wood fragments, and pumice. Commonly the basal portion of the Mud
Mountain Complex consists of a fluvial boulder gravel and a discontinuous
11-3

water-laid tuff bed sandwiched between the lowest lahar unit and the thickest
lahar unit.
The uppermost part of the complex is locally characterized by a bouldery
debris flow which exhibits fluvial channeling at its base. Where the debris
flow is missing, 10 to 15 feet of deeply weathered residium characterizes the
top of the sequence. Close examination indicates microvesiculation and charred
wood fragments in some zones indicative of the still hot nature of the material
at the time of deposition. These materials are believed to be at least as old
as middle Pleistocene and the noted lack of clasts from the modern Mount
Rainier volcano suggest a source from an earlier volcanic center. In the south
canyon wall the Mud Mountain Complex exhibits a far more fluvial and bouldery
character and extends about 30 t6'40 feet higher in elevation than on the north
bank suggesting post-Mud Mountain Complex erosion prior to the deposition of
the overlying Hayden Creek drift.
3. Glacial Deposits. While not encountered in the cutoff wall
construction, the upper glacial units are discussed here for a comprehensive
stratigraphic familiarization:
a. Hayden Creek Drift. Deposits of the Hayden Creek glaciation
overlie the Mud Mountain Complex in this portion of the White River Canyon. On
the south bank the drift consists of about 25 ft. of very dense gravelly clay
containing slightly oxidized gravel overlain by 30 ft. of varved to thick-
11-4
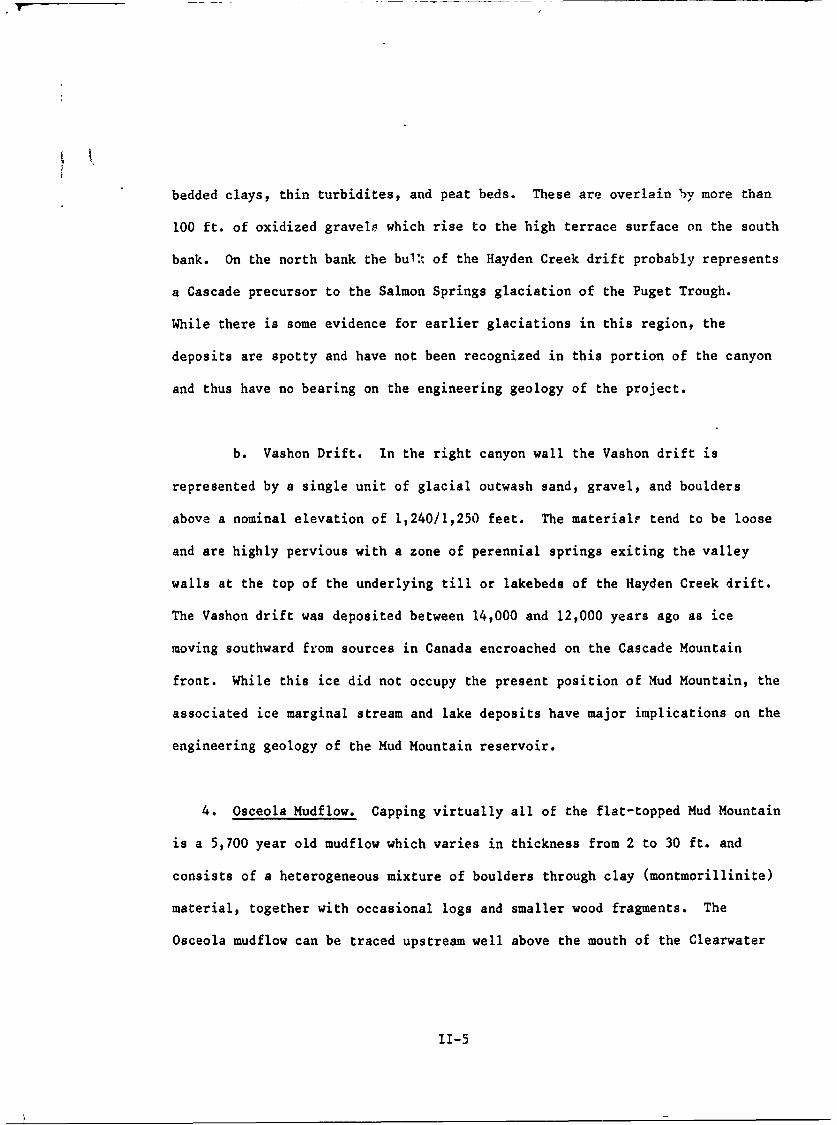
bedded clays, thin turbidites, and peat beds. These are overlain .y more than
100 ft. of oxidized gravels which rise to the high terrace surface on the south
bank. On the north bank the bul% of the Hayden Creek drift probably represents
a Cascade precursor to the Salmon Springs glaciation of the Puget Trough.
While there is some evidence for earlier glaciations in this region, the
deposits are spotty and have not been recognized in this portion of the canyon
and thus have no bearing on the engineering geology of the project.
b. Vashon Drift. In the right canyon wall the Vashon drift is
represented by a single unit of glacial outwash sand, gravel, and boulders
above a nominal elevation of 1,240/1,250 feet. The materialf tend to be loose
and are highly pervious with a zone of perennial springs exiting the valley
walls at the top of the underlying till or lakebeds of the Hayden Creek drift.
The Vashon drift was deposited between 14,000 and 12,000 years ago as ice
moving southward from sources in Canada encroached on the Cascade Mountain
front. While this ice did not occupy the present position of Mud Mountain, the
associated ice marginal stream and lake deposits have major implications on the
engineering geology of the Mud Mountain reservoir.
4. Osceola Mudflow. Capping virtually all of the flat-topped Mud Mountain
is a 5,700 year old mudflow which varies in thickness from 2 to 30 ft. and
consists of a heterogeneous mixture of boulders through clay (montmorillinite)
material, together with occasional logs and smaller wood fragments. The
Osceola mudflow can be traced upstream well above the mouth of the Clearwater
11-5

River. The mudflow provides a relatively impervious cap over the Vashon
outwash and tends to pond water in low areas on the ridge top.
E. Structure. Major geologic structures identified in the area include the
Grass Mountain, Buckley, Boise Creek-Clearwater River faults, and the Mt.
Rainier lineament. In this area the Grass Mountain Fault may well be the
southern boundary of the Olympic-Wallowa lineament, a regional northwest-
southeast trending zone of transverse geologic structure which separates the
North Cascades from the southern volcanic part of the range.
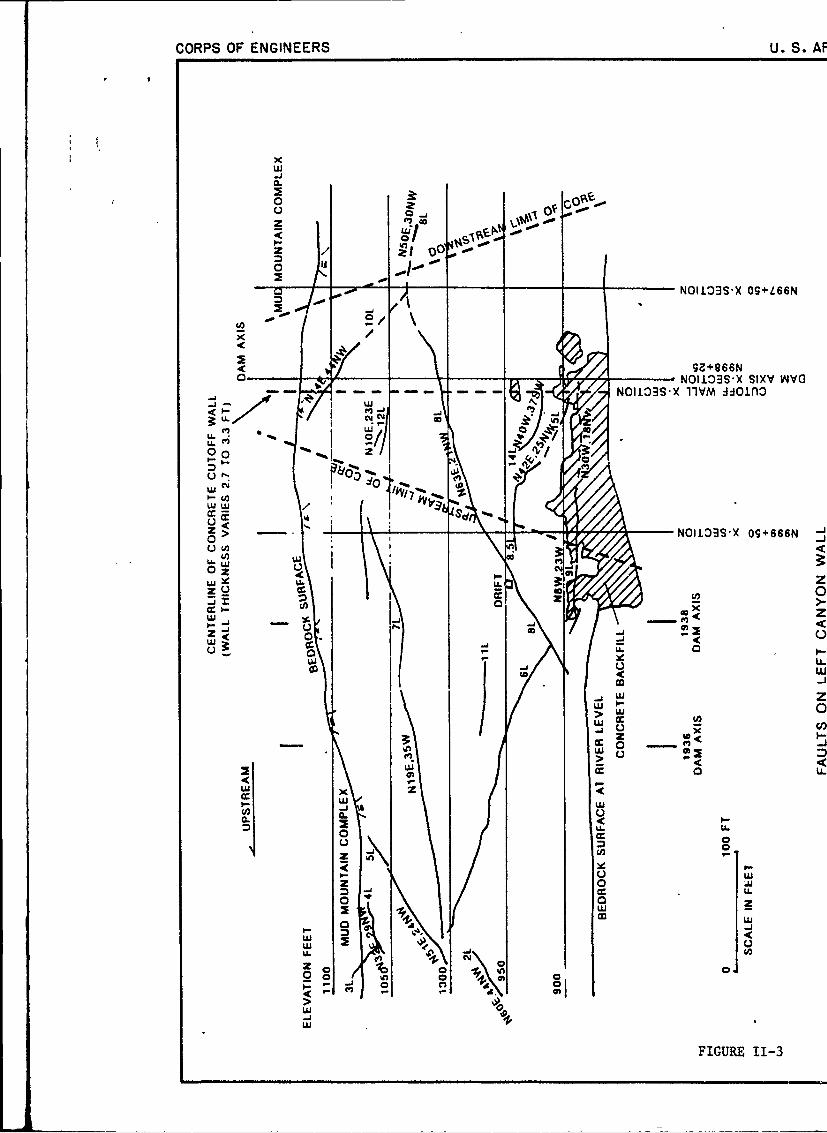
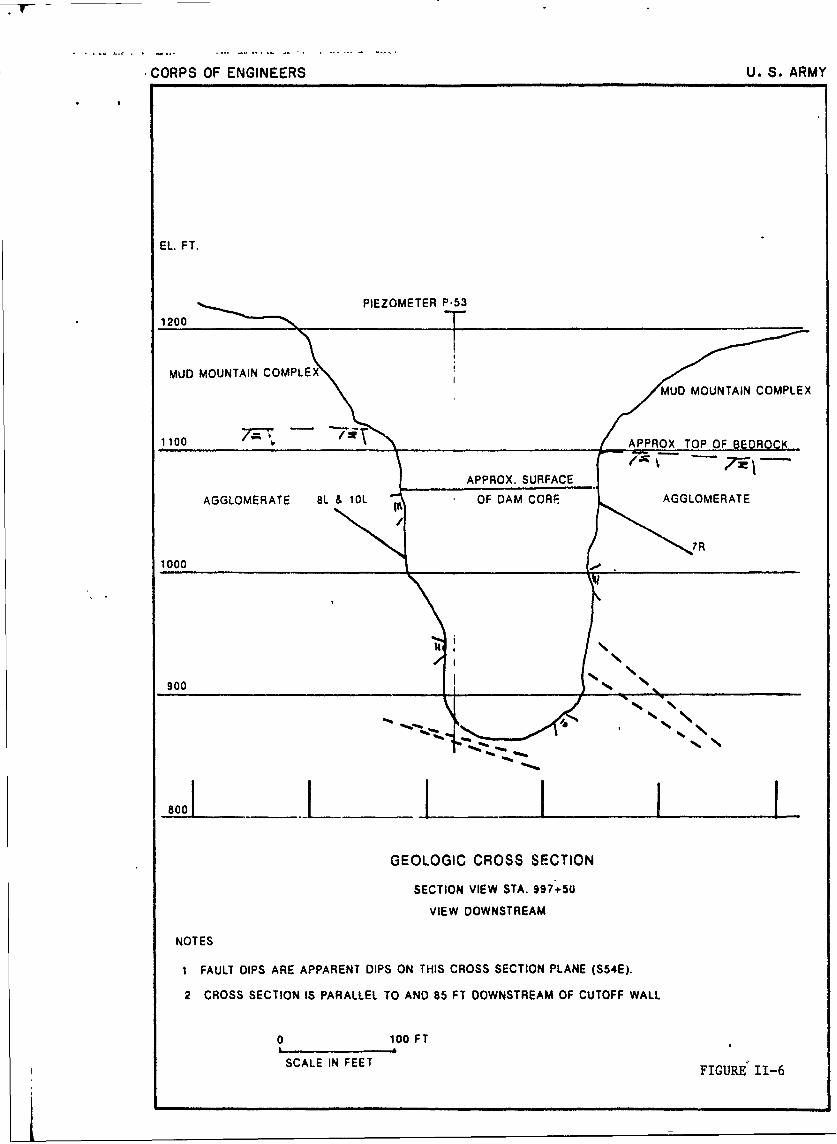
I. Bedrock. The bedrock is crossed by numerous local faults which may be
related to the period of volcanic deposition. Major faults typically dip
upstream and generally strike Northeast-Southwest (Figures 11-3 through 11-6
and Table II-1). The andesite and andesite breccias are characterized by
closely to moderately spaced joints while jointing in the agglomerates is more
likely to be more widely spaced. The thin beds of lithic tuff provide the
major clue to structural attitudes.
2. Mud Mountain Complex. Shear zones and fissures occur locally in the
Mud Mountain Complex materials. Some cracks are known to have been induced by
recent seismic events and there is evidence of prehistoric displacements
downstream of the spillway as evidenced by extensively weathered fissure
boundaries on down-dropped blocks exposed in the canyon walls.
Stress relief cracks have been noted in asid near the canyon walls. The
11-6

cracks are apparently confined to the lahar sequence of the Mud Mountain
complex. In 1948 a 200 ft. long crack was discovered in the narrow overburden
spur separating the south side of the spillway from the downstream canyon. In
1974 a 75 ft. high mudflow cornice on the canyon wall, 200 ft south of the
earlier crack, developed cracks high on the slope and was removed. A 10 ft.
deep crack opened up above the intake structure as a result of the 1949
earthquake (U.S. Army Corps of Engineers, 1949) and material outboard of the
crack was removed. In 1984, while drilling high on the canyon wall above the
intake structure, some 1,800 gal of drilling fluid were lost into the Mud
Mountain complex in a zone of otherwise impervious lahar deposits. No fluid
could be seen exiting on the steep slope belowp and a stress relief feature
parallel to the canyon wall appears a reasonable explanation. When drilling
piezometer PZ-4 (a.k.a. Piezometer 110) during this contract, circul;tion was
rapidly lost and never regained at 150 feet. Again, no trace of the drill
fluid was evident in the canyon walls to the south.
F. Weathering.
I. Bedrock. The andesite agglomerates are typically the bedrock factions
showing signs of hydrothermal alteration. During the original dam construction
excessively weathered bedrock surfaces were barred and scaled off, while
pockets or zones of weathered and punky material around fractures and shear
zones were removed by dental excavation and backfilled with concrete.
11-7

2. Mud Mountain Complex. These overburden materials contain shear zones of
sand, silt and ash that have been altered to clay minerals, while the gravel,
cobbles and boulders vary from fresh, to totally weathered (exfoliated).
G. Groundwater. Since original dam construction, groundwater flowing in and
through bedrock fractures and seams in the canyon walls has been recognized.
This was especially true in the left bank since it receives drainage from the
higher topographic elevations to the south. Surface flows into the project
site include Upper Cascade Creek, which drops as a falls into the normally
drafted reservoir and Lower Cascade Creek, which enters the site on the top of
the dam at the far left valley, where the left dam axis is keyed. Flows from
Lower Cascade Creek are collected by a culvert, then diverted and dumped on the
upstream face of the dam, where it dissipates into the rock shell. When there
is no pool behind the dam, much of the ground water present in the left canyon
wall is believed to be derived from the portion of these surface flows which
percolate down into bedrock, then "daylights" in the left canyon wall at the
core/bedrock boundary. During high pools, water is transmitted downstream
through the network of joints and fractures in both canyon walls. These
groundwater sources may have had significant erosional influence on the core
along the rock contact, especially in the left bank area, which reflected
faster piezometric responses to reservoir pools. Water trapped in the canyon
walls adjacent to the core subsequent to a pool draft, could have accentuated
the problem by flushing fines back upstream.
11-8

STRATIGRAPHIC COLUMNLEFT ABUTMENT
UPPER CASCADE CREEK
APPROX.
EL.- FT.
1300 , Hayden Creek outwash
Hayden Creek lakebed
12601250 -Hayden Creek till
MUD MOUNTAIN COMPLEX
Unit C- debris flow
1210 ""'""
Unit B- undiff. mud flows
.,-,. & pyrociastic flows (lahars)
1110Unit A- undiff. mud flows
1090 ;- & pyroclastic flows (lahars)log o .Unit AA- basal boulder bed
1075 "lv Bedrock-includes tuff, andesite,
volcanic breccia, andL~V agglomerate (undifferentiated)
Not to scale FIGURE "-'

STRATIGRAPHIC COLUMNRIGHT ABUTMENT
UPSTREAM FROM SPILLWAY
APPROX.EL. FT.
Osceola mudflow1300 ---*o* :
Vashon outwash
1245 Z erosional unconformity1235 Hayden Creek lakebed1235
Hayden Creek till1215 ' MUD MOUNTAIN COMPLEX
1 -Unit C- debris flow1200
.-
Unit B- undiff. mud flows
VW.
107 !"n & pyroclastic flows (lahars)-. *-
.--- ,0
1090 Unit BB- tuff1085 " - Unit A- undiff. mud flows1075 .,_ & pyroclastic flows (lahars)
1060 Unit AA- basal boulder bed
Bedrock- Includes tuff, andesite,volcanic breccia, andagglomerate (undifferentiated
Not to scale FIGURE 11-2
A
CORPS OF ENGINEERS U. S. Al
'C
0
0 O,z owl0
N011039S-X Og+L66N
0 0
002
2>. -
00I2 U
U) I 0I z
I C.
Cfl LL
IJ ws U.
ui 0
J I- -
w0
c) I-
FIUR FE-

G OF ENGINEERS U. S. AR.M'
cc 0Ow
z
U.
4,
CL -J 0,b Ia c >
o if w0 UIa0 cc IL
I- 3?. Zj
A- <,- 'I.
- C,?,ou
-J Ljj
- m.
U. z0
00z
w-4- C40 \ Of 0+666N Co0 V% o-
CI-
zzz 0
ojCl
00
TFGR N114S-

CORPS OF ENGINEERS U. S. ARN
EL FT
1200\X
MUD MOUNTAI"OMPLEX ,.,, ,.Z MUD MOUNTAIN COMPLEX
1100 X Z ,
7L 121 ,Z-OF ROCX
AGALLOMERATEO
100 E7I
AGGLOMERATE
APPROX
VF DAM CORE909L CONCRE TE BACKFILL
CONCRETE IPS ON
GEOLOGIC CROSS SECTION
SECTION STA N999+50
VIEW DOWNSTREAM
NO'T ES.
1 FAULT DIPS ARE APPARENT DIPS ON THIS CROSS SECTION PLANE ($54E)
2 CROSS SECTION IS PARALLEL AND 115 FEET UPSTREAM OF CUTOFF WALL
0 100 FT
SCALE IN FEET FIGURE 11-5
CORPS OF ENGINEERS U. S. ARMY
EL. FT.
PIEZOMETER P-53
M 1200 .
MUD MOUNTAIN COMPLEX
1100 - APPROX TOP OF BEDROCK
APPROX. SURFACE,
AGGLOMERATE 8L & 10L OF DAM CORF AGGLOMERATE
?R1000 -,
900
sooo
_______ ______ I I!GEOLOGIC CROSS SECTION
SECTION VIEW STA. 997+50
VIEW DOWNSTREAM
NOTES
1 FAULT DIPS ARE APPARENT DIPS ON THIS CROSS SECTION PLANE ($54E).
2 CROSS SECTION IS PARALLEL TO AND 85 FT DOWNSTREAM OF CUTOFF WALL
0o100 FT
SCALE IN FEET FIGURE 11-6

Faults were recorded as primary, secondary and tertiary.
NaMM _alue Description
Right Canyon Wall
iR Primary At sta. N1002+60, el. 975', 5' blue gougewith slickensides, probably connects with4R, SR, 9R, and 10R.
2R Tertiary 14" of crushed and oxidized gouge,slickensides
3R Tertiary 1' to 8' crushed and oxidized gouge, noslicks.
4R,5R Primary Same as iR description6R Secondary 1' of oxidized gouge7R Secondary 1' of oxidized gouge8R Tertiary No gouge or slicks.9R,1OR Primary Same as 1R; occas. 4" wide zone crushed
material; striations on all surfaces12R Tertiary Tight to 1' of oxidized gouge, slicks run
downdip13R Tertiary Tight and no gouge14R Tertiary Appears tight15R Tertiary Tight and no gouge
Left Canyon Wall
IL Tertiary Up to 0.7' oxidized gouge2L Tertiary Up to 0.3' oxidized gouge3L Tertiary Up to 0.5' oxidized gouge4L Tertiary Up to 0.5' oxidized gouge5L Secondary Tight, no water, slicks indicate a normal
fault6L Primary Tight, strikes approx N20W and dips 45NE7L Primary Up to 0.2' open, slickensides, no gouge8L Primary Blue clay and crushed oxidized gouge in zone
0.2' to 1.5' wide. In adit 0.2' to 0.8'oxidized gouge
9L Primary 0.2' to 5' wide gouge and fractured crushedrock, variable
10L Secondary 0.2' oxidized gouge
An exploration adit was driven along fault 8L on the leftcanyon wall. Within the adit, inclination of fault 8L wasmeasured at 32 degrees and the fault walls were found to behighly polished. Fault width varied from 2 feet to 1/4 inch andfilling was clay gouge and crushed rock. During the rainy seasonthe fault segment in the adit remained dry for approximately twoweeks, then ground water began percolating from it. Whiledrilling a calyx hole on the right abutment drill water was lostat elevation 1049 feet. Two hours later the water emerged 300feet upstream from a vertical crack, elevation 950 feet,associated with fault 3R.
TABLE II-1
SECTION III
EMBANKMENT/FOUNDATION EXPLORATIONS
SECTION III - EMBANKMENT/FOUNDATION EXPLORATIONS
A. Investigations.
1. Pre-1980 North Pacific Division, U.S. Army Corps of Engineers started
initial investigations in 1936 and continued through dam construction
completion in 1941. Bedrock and overburden conditions were investigated by
diamond core drilling, calyx drilling, tunnels, test pits, and trenches.
2. Pre-Cutoff Wall (1980-87). Piezometers were installed during original
dam construction but their location and any subsequently acquired data have
been lost in antiquity. The first post-construction piezometer (P-40) was a
single, open tube-type, installed in the deepest section of the dam embankment
in 1980 (Plate 3). The piezometer responded fairly rapidly to pool
fluctuations which suggested that the effective core permeability was higher
than that anticipated by design (XI0 -6 cm/sec). This fact became even more
disconcerting when in September 1984, the pool held a similar elevation (975
ft) for a comparable period of time as in 1982, and the piezometer showed a 6
ft. increase in piezometric surface (EI.950 vs EI.944). This suggested that
not only was the present permeability higher than design, but that the
effective permeability was increasing with time. The need for further
definition of the problem led to the installation of an additional nine
11-

piezometers in 1985, and eight more in 1986 (Plate 3). This drilling
encountered a variety of soil conditions, all of which suggested the finer
factions of the core being removed. The drilling encountered loose areas with
possible voids as evidenced by the ease of advance. In one instance, the drill
casing dropped 6 feet, of its own weight. Gradation tests on many of these
materials indicate zones of loose, coarse sand and gravel present in the core.
3. Cutoff Wall Contract Investigations. Contract investigations were
divided into embankment, overburden (Mud Mtn. Complex) and bedrock portions.
The embankment portion was explored with an access shaft drilled 180 feet into
the core, discussed at length in Section "V", and the piezometer drilling which
occurred in the recompaction grouting zone in the vicinity of the cutoff wall.
The original intent of the piezometer drilling and soil sampling was to
identify "loose" zones in the embankment for monitoring. As a result of the
recompaction of the core, the sampling portion of the installation was deleted
from the contract. This deletion also lessened the impact costs resulting from
the recompression grouting program.
The intent of the overburden and bedrock explorations was twofold: (1) to
delineate the dam embankment/rock interface prior to hydrofraise excavation,
especially in the critical steep canyon wall areas (two on the left bank, one
on the right) and (2) determine the appropriate depth to which the cutoff wall
should be carried, based on the quality of rock encountered at depth.
Contractually, exploration of the bedrock was to take place within the 45 foot
111-2

periphery of the canyon profile (Plates 4 and 5), to identify zones of "punky"
or highly fractured rock. It could then be determined to either remove it by
means of hydrofraise panel excavation, or grout it up in a follow-on contract.
This exploration program was carried out concurrently with ongoing
hydrofraise panel excavation i.e., the hydrofraise would excavate to within 20
feet of the anticipated embankment/bedrock interface. It would then move off
the panel while the core drill suspended a 4" ID casing full depth in the
slurry-supported panel. The casing was "washed" through the remainder of the
core material until it sat on bedrock, then an HX drill string was lowered
inside to commence coring rock (Panels 13, 15, 17 and 19). The verticality of
the suspended casing string could not be verified at greater depth, especially
after it had washed through 20 feet of sediment. Therefore the accuracy of the
embankment/bedrock contact was questionable. In practice, the hydrofraise
ended up producing the most reliable bedrock profile, a product of it's "real-
time" inclinometer and cutter head torque readout's ability to differentiate
the easier embankment excavation from the harder rock. This information is
presented on Plates 4 and 5 as a series of connected squares (overburden), or
dots (bedrock). The data is shown for the primary or alternating one-bite
panels only, as the readout from the hydrofraise torque dat, could not
differentiate the embankment/rock boundary in closure panels with a background
reading of the cutter wheels grinding out 4-6 inches of the adjacent primary
panels.
111-3

Subsequently, the exploratory drilling and concrete quality control coring
were carried out in a combined hole after panel concrete was placed. The
panels were core drilled full depth and if bedrock exploration was desired, the
hole continued to the target depth. Information on the exploratory and QC
holes is given on Plates 5 and 6 and also Tables III-1 and 111-2.
Core drilling was accomplished with a Longyear 44 truck-mounted drill,
powered by a Detroit 353 diesel (120 hp) engine. It had wire-line retrieval
capability and was fitted with a swivel ("H") head that would chuck 3.5 inch
O.D. pipe. Drill circulation (and pressure testing concrete and rock) was
handled with a diesel-powered Bean 70 pump. Core holes more than 200 ft. deep
were drilled with an RX bit (3.65" hole), while those less than 200 ft. were
drilled with an NX bit (2.98" hole). Drill depth capability was 1,600 feet.
Drilling a 400 ft. core hole within the confines of a 40-inch thick wall
had problems. Early on, several holes left the panel into the core, so it
becamae imperative to be able to control the direction of the drilling. The
"Navidrill", as it is called, is manufactured by Eastman-Christensen Co., and
utilized a down-the-hole motor, driven by water pressure at the end of non-
rotating drill rods. This in turn, ran a face-discharge, diamond plug-bit
through double-tilt U-joints. The Navidrill was powered by a trailer-mounted
Bean-Royal 3-valve pump, with a GM 4-cylinder diesel motor. The Navidrill
motor typically ran on 45 gpm at 300 psi. If a hole deviated too far, it would
be grouted back to a point where correction could take place within the cutoff
111-4

wall panel, then directionally-drilled with the Navidrill. The amount of
deviation was periodically monitored with an Eastman device, which was sent
down the hole to photograph the orientation of the hole. Several time
consuming corrections using backfill grout and directional-drill techniques led
the drilling subcontractor (Boyles Bros., Salt Lake City) to increase the
frequency of his hole monitoring. He detected and rectified problems early
without having to grout back and re-drill. Quality of concrete is discussed in
Section "XI".
As previously mentioned, it was important to delineate the core/canyon wall
contacts prior to panel excavation, especially in the steep sections. Failure
to do so could mean the 15 ft. embedment normal to the contact was not met.
Prior to hydrofraise excavation, drill hole data from the gravity grouting
program (discussed in Section IX) showed some discrepancies with respect to the
contact in the lower left canyon wall. The bedrock contact in gravity grout
holes 418 and 419 suggested a canyon bottom 15-20 ft. narrower (contact further
to the right) than holes 415, 416A, 416B, and 417. An interpretation of these
mixed results was aided by a review of several original dam construction
photographs. It was found that the lower left canyon wall had a rather
innocuous recess which just happened to fall on the cutoff wall alignment. The
decision was made to deepen panel 27 from 357.5 ft. to 400 ft. to guarantee a
minimum 15 ft. cutoff wall embedment. In the absence of a good photographic
record for reference, it was possible that panel 127 would have been terminated
at 357.5 ft., giving only 5-7 feet of cutoff wall embedment.
111-5

B. Engineering Characteristics of Overburden. As previously mentioned, the
Mud Mountain complex consists of a series of pyroclastic mud flows (lahars),
debris flows, water-laid tuffs and related fluvial deposits. The bulk of the
mudflow material is a hard, highly plastic, cobbly, gravelly silt and clay
(CH, MH, GC, and GM), with minor amounts of sand, wood fragments and pumice.
Natural moisture content of these materials is 30 to 50 percent with the dry
unit weights range from 60 to 90 pounds per cubic foot. Laboratory testing
indicates preconsolidation of the material, which is consistent with the
geologic record. The complex contains a large content of cobbles in the 6-9
inch plus range, as well as numerous boulders (to 6 foot diameter).
Compressive strengths on the cobbles and boulders range from 680 to 27,200 psi.
C. Engineering Characteristics of Bedrock. Bedrock in the project area
consists of andesite, andesite breccia, agglomerate and lithic tuff w/local
intrusions of sedimentary material. Its competency and therefore its
engineering quality is highly variable and unconfined compressive strengths can
also range to over 20,000 psi. The andesites and andesite breccias are
typically welded into a competent, though jointed, rock mass. The agglomerates
form the mijority of the cliff sections of the river canyon and are typically
the weaker rock generally more massive but susceptible to hydrothermal
alteration. Locally, it can actually be lese competent than the overlying Mud
Mountain ^-a rix.
An incomplete tabulation of laboratory tests on samples of both the Mud
.111-6

Mountain Complex and bedrock, taken prior to and during original dam
construction, are available in "Analysis of Dam Design of Mud Mountain Dam"
dated 6 May 1946. These tests included compressive strength, shearing strength
and modulus of elasticity of selected bedrock samples.
111-7
|1

e4 .4
-4 -4'4-4
-4
UIA to tO M IA 12
CC3
0 0 u Vd-r '4 4 -4..4 -,404* Iu
I 0'4rH4''' t4 $4 .-14A CJdC m L LALWL L L
IIH 0U'50 01 Icc4 4J 4 U U 4J 4J4 J 4
00 1- 4 0 111$4H al LLL I II w01 k00 00E e E E E O
1aj O0 0 a0 00 0 a HO0)%.- Asc cc c cc ci 0OH
I H s '4 *,4,1v, w 0Ir S: -H 0-4 r4 4 r4 -4 q 4 1
E -4b oac c c cc c M '$
IJ I. 1-4141-1-4 ~41 0
0t0
Lmit. I HOra I m Occ
0.t Q~* 0 t a 1%.e~f .O.Ifl.lfls~s~4C14I~I IN.4?~i.4fl0 . .40~ I
I CDN t ,0 t'r4 ) It I .01 0 N'rji
N 1- .4 -4 N Ht 1,$q4 c
0 H
N~~~r flNL oar
o0 4 104
a LL CA4 ; N it
ED Ic44,. IT r. V) Iq,4.44tl M CD 'N N (1 N 1HIWI 0i.o N v10m - 1.4
>- ' Nl 4
II.I w 0
wl IZjI Ii Zz zi ' j IAi i - j aw)L1w)I a-:33 D:3N 00.1
W I3 cE4'u .4ra a (LSW.E'AWWWWWWW 3%
2i ri12- 7P 1r . 3f3P 3r cL : aC o E40

4-.,. . . .- 44- . 4 ; 4 4;
-0 - 4-U
f) t&-1b) 0i
' 0 0 00000 0-4
ci w- a
'.4 ~ -4 r4 4 0
c .4 '.-4 -4u-l 4 r-4r-4 -4
SC C C C 0 C CC C " O ,.. c
.4 A *f 4 x .xr4 4 - c"x cc c 0
E rE 52 SE c c c~
, 0 '• 0, 0 .. 0 . *. .4. ~'
' D 19-~ (31-9 4' o41'io
0 0 0 0 0- a 0 , 4.4.q- ,
0 0 0 0 q-4 0 00 0 u V4 0 u uu~ uHU) j V 4J V 4J.4J4J V4 4-' V
z0 0 00a a 0 00 0 L LL L L4I 4J 43+4 C 4-4J 4C aI I a
4I C 4I IJ V V !J 4I 41IJ I I
0 ~ M I 0 1"0CL- i w I w
1 01 010 a10 01 0 0010 'D 0 '0 +- 10."0 ' 13 c 0 c c c C C0 0
z III w i i) I w i I Pi w i r -i i i i i I ,
IIWW 0 wWWw U"HOW W
!- MU a m s a~) a a s N a * a *4 a @ s " a o a a e * # s. j W I
xr at (LJ' b") ot 0 ) . IflN nN _ 4& ()r 0.~ 4tMmM NM(I N11 -1-u n LU '..-'- N- 0- N-'.~ -4 '- 0 - I N
0 :3 0 QIu. I-
w Mo
LC z z z J- i- i- . 1J.I-ir D W --c >4:w C ixcc 0 C > I0' 3- NNWWXXCC0 I
En ! I I I ILU -% M ~t m) -- CMm)W 0 , Z0(IM O-4N-axqr
i- NNNM~ I v4f-4-4NNNNNN I I NoIt.~) I CC I W M-Na40. I IC I ~It I C I a " P* N W I I I I
-4 'NN N.- t'(" N F) N'4t0 N - 4('
G 4 N0%0N N0W W WW or 1>
0o 44v 4"v 4 v 4v 4v w41..w,.Iv4 "" 1 1 1 1 1 11 1Z II I IIIMI 1 11 Itt NtItO~.t~Ot
ED N N 0 a- 0 0tN W -4 -00-o-N4'f-.N0v fv 44v4 -4 4z 4 4w v4 ItW M M W q 4 v 4 v4 n v4 W W W WW LWWW UI
l~ll tth t~I I I11 1 I I I I I I1 11 Iz00
03 W 0 W 03 W D W C W W W 0 W W W W W W 0 .O D % O~

SECTION IV
EXISTING DAM
SECTION IV - EXISTING DAM
A. Design. The dam is a zoned embankment, earthfill structure 425 ft. high.
It consists of a central core of gravelly, sandy, silt and clay; flanking
transition zones of 4" minus crushed diorite rock and; dumped and sluiced rock
shells (Figure IV-l). An uncontrolled, concrete-lined chute spillway is
situated adjacent to the embankment on the top of the right abutment. Water
can be passed through two, 2,000 ft. tunnels in the right bank. The lower (El.
895 invert) 9 ft. diameter tunnel is controlled by means of a single radial
gate at the entrance. The higher (intake El. 970) 23 ft. diameter tunnel
passes river flows into three 8 1/2 ft. diameter penstocks toward the lower end
of tunnel and are independently operated by Howell-Bunger valves at the
discharge.
B. Construction History. The dam embankment was constructed from 1939 to 1941
and at the time was the highest embankment dam in the world. The proposed dam
designs in the 1930's included a thin-arch concrete, concrete gravity, or
concrete gravity thrust-type structures. These concepts were abandoned in
favor of a rolled-fill earth dam. Subsequent to the commencement of
construction, ongoing borrow-site investigations of the Osceola mud flow on top
of Mud Mountain, revealed a small percentage of montmorillonite clay in the
samples, which made it unsuitable for a rolled-fill application. At that point
IV-l
the design was changed to a rock-fill structure with impervious core. The
natural moisture content of the montmorillonite-rich flows was well above
optimum, so the mudflow materials were blended with 80% sand and gravel and
rotary kiln-dried prior to placement. There is a predominance of sand, rather
than gravel above El. 1020, a result of differing borrow source locations. The
moisture content of placed core lifts was insured by the erection of a large
circus tent across the canyon during the winter months.
Restrictions on critically needed war materials deferred the installation
of the 23 ft. penstocks, regulating valves, and valve house into a post-war
contract. During this period, flows through the 23 ft. tunnel were regulated
by a temporary orifice plug installed near the intake. Starting again in 1947,
construction began for the completion of the 23 ft. tunnel appurtenances,
fishway structures at Buckley, 9 ft. tunnel intake improvements and out
buildings. Final project completion was June 1953.
C. Post-Construction Problems. Mud Mountain Dam was built using modern
construction techniques, though state-of-the-art for embankment dam design has
since changed. In this regard, the gradation of the existing transition zones
does not meet currently accepted requirements for graded filters and, earthfill
dam settlements and the phenomenon of soil arching is better understood.
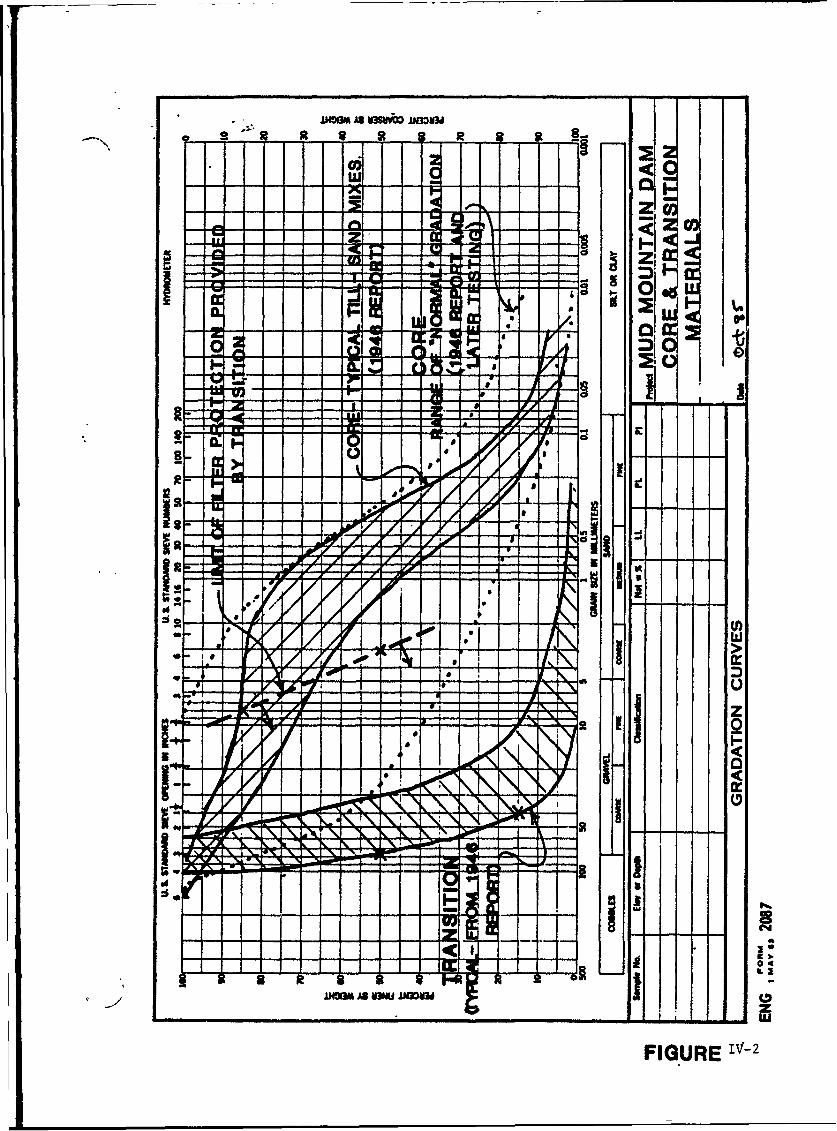
I. Transition Zone. The purpose of the transition zones was to separate
embankment materials of different gradation and permeability. It allowed
IV-2

drainage while preventing finer material in the core from being washed away.
The design intent was to provide two gradational zones of 4-inch minus crushed
diorite rock, with the finer faction adjacent to the core. However, samples of
material taken during construction were tested and the transition zone, as-
built, did not end up with the specified zonation or gradation. 180 out of 299
control samples tested were coarser than specified (Figure IV-2).
2. Embankment Settlement. The second problem pertained to the complex
nature of differential settlements occurring between the core, canyon walls and
rockfill shells. Post-construction embankment settlement is normal and
generally quantifiable. In zoned embankment dams, the compressibility of
materials used for the core, transition zones and rock shells, along with the
construction geometry, influence how much and where dam settlement occurs. In
the case of Mud Mountain Dam, the rock shells and transition zones settled
first, then became fairly rigid. Conversely, the core material (clay, silt,
sand and gravel) being more compressible over the long term, continued to
settle between the steep canyon walls and rock shells.
As the core continues to differentially settle, it can shear along
boundarys parallel to it's confining medium. This manifests itself as
cracking, either longitudinally along the axis of the dam, between the
core/rock shell and/or transversely, parallel to the core/canyon interface
above the steep "stair step" grade breaks. It was the anticipated presence of
longitudinal and (especially) transverse cracking at depth, that was a pre-
IV-3
cutoff wall contract concern. In this scenario, if low stress zones were
associated with this cracking and the soil pressures were less than
hydrostatic, a cutoff wall panel filled with slurry that intersected a crack
could hydrofracture to the rock shell, destabilize the trench and remove more
core material, further weakening it. The purpose of the contract access shaft
was to examine the core at depth, to determine if this type of cracking did, in
fact, occur.
The differential settlement of the core within the confines of it's rigid
boundarys can precipitate another phenomenon. In this scenario, as the core
settles, it arches longitudinally between the confining canyon walls and/or
transversely between the rock shells. Longitudinal arching would be more
pronounced in the deeper portions of the core between the steep canyon walls.
If this arching does occur, further settlement of the core above the arch is
inhibited, while settlemnt below may continue, due to saturation from pool
fluctuations. Hence, a low stress zone develops below the arch and soil
pressures become reduced to the point where induced hydrostatic pressures from
impounded pools might exceed soil pressures in these sub-horizontal planes.
During this time these zones are vulnerable to saturation and hydrofracture.
Additionally, fines can be progressively removed from hydrofracture cracks or
low stress zones and sucked back upstream upon pool drafting. These planes of
low stress or cracking could also transmit full reservoir pressures to the
downstream side of the core, accelerating the loss of fines, producing even
larger flow paths. The creation of low stress zones and suspected flushing of
core fines through the transition zone from repeated pool raises probably
worked interdependently.
IV-4

.CORPS OF ENGINEERS Mkv
0.0wo
Ul
-izhiw
0 ~21
)ww
FIGURE Tv-i
MM)4IM A U39MY* AN3MUd
N. 3 _~22
I I ~l II0
zIi
z I
400
I I NJ-
FIUE2'-

SECTION V
ACCESS SHAFT

SECTION V - ACCESS SHAFT
A temporary access shaft was constructed approximately 5 feet upstream of
the cutoff wall alinement at station 14+00 to investigate the condition of the
dam core. The access shaft was constructed to a depth of 180 feet below the
top of the lowered dam (elevation 1240 feet N.G.V.D.) using a crane suspended
4-foot diameter auger with a reaming attachment which allowed drilling a 6-foot
diameter hole. A truck-mounted auger was used for the first 97 feet of
excavation. The hole was cased by hand labor in two reaches, each 2-foot long,
using segmented steel liner plates. The plates were bolted together six to a
ring, 2 feet long, by two workers in a suspended man basket. All work,
including Government investigations, was done from the man basket and in some
instances from a boatswain's chair. The shaft casing was designed to be
suspended from a concrete collar placed at the top of the shaft. The first
three rings of liner plate (9-foot reach) vas secured to the concrete collar by
24 one-half inch studs. The support capacity of the collar was conservatively
computed to be three times higher than the total dead weight of the shaft
liner. The shear capacity of the studs was much greater than the bearing
capacity of the collar.
Construction of the access shaft began on December 12, 1988 with excavation
using a backhoe for placement of the concrete collar and embedment of the first
9-foot reach of liner plate. The concrete collar was placed on December 14,
1988 and drilling commenced on December 15, 1988 using a Hughes LLDH 15140
V-1

truck-mounted auger. The truck-mounted auger was used to a depth of 97 feet.
An auger mounted on a Manitowoc 4000 crane with a specially fabricated 200-foot
kelly bar was used to advance the shaft below 97 feet starting on 13 Jan 1989.
The shaft was advanced to a depth of 145 feet before interference from
piezometer P50 required contract modifications to be issued for removal of
interfering portions of the 6-inch steel piezometer pipe. The first
modification amounted to $2,080.00 for removal of pipe between elevation 1094
and 1083 (146 to 157 feet in depth) and the second amounted to $8,316.00 for
removal of pipe between elevation 1083 and 1059 (157 to 181 feet in depth).
Excavation of the pilot hole and removal of the pipe before reaming continued
to a depth of 180 feet when the piezometer pipe interference would not allow
further drilling of the 4-foot diameter pilot hole.
The investigations did not reveal any major flaws in the dam core. Voids
found around the piezometer casing were attributable to over-drilling and not
to pre-existing voids within the core. There were three areas which indicated
some cracking and surface water infiltration. The cracking is probably due to
differential settlement between the core and rockfill zones and within the core
itself. Cracks attributable to such settlement were also discovered when the
top of dam was lowered by 10 ft. to widen the work area. The crack surfaces
were very well defined, oxidized by water percolating down from the surface.
The presence of water is probably due to surface water migration because the
water filled cracka occur higher in the core than normal pool levels. A test
pool raise in 1974 held the pool at or above elevation 1,140 feet N.G.V.D. for
V-2
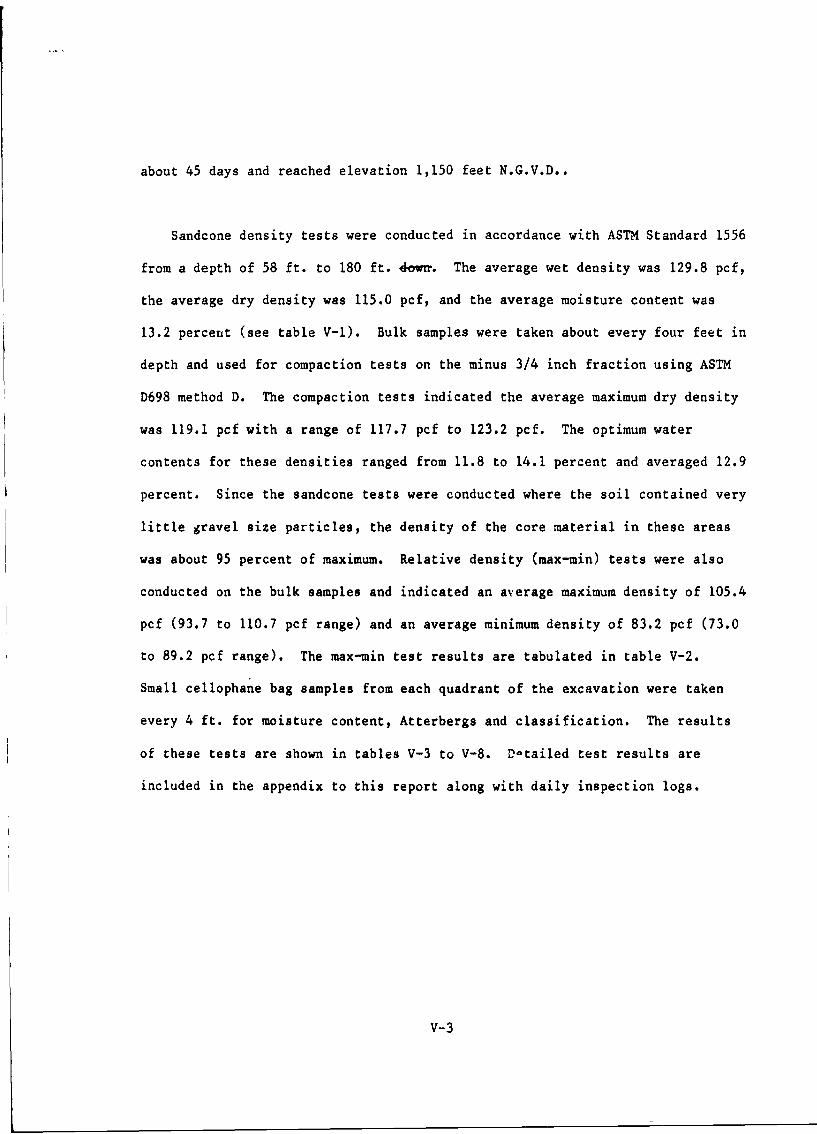
about 45 days and reached elevation 1,150 feet N.G.V.D..
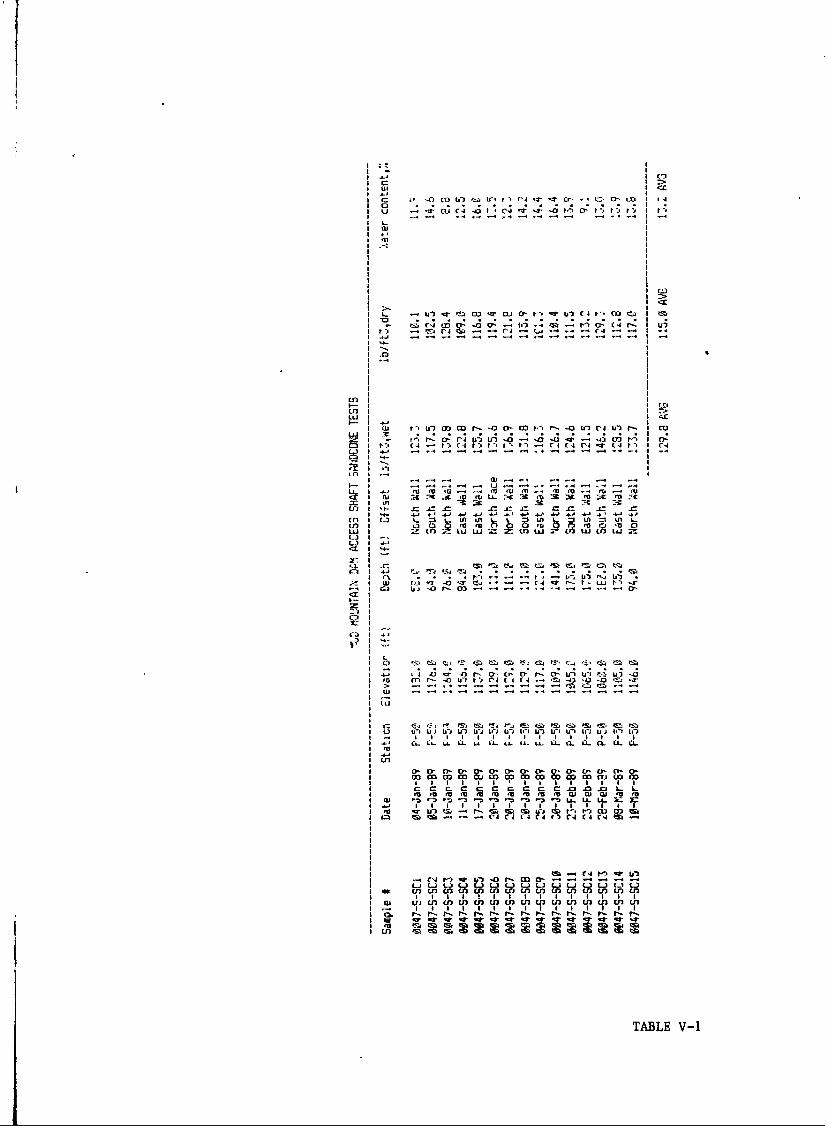
Sandcone density tests were conducted in accordance with ASTM Standard 1556
from a depth of 58 ft. to 180 ft. 4owr. The average wet density was 129.8 pcf,
the average dry density was 115.0 pcf, and the average moisture content was
13.2 percent (see table V-I). Bulk samples were taken about every four feet in
depth and used for compaction tests on the minus 3/4 inch fraction using ASTM
D698 method D. The compaction tests indicated the average maximum dry density
was 119.1 pcf with a range of 117.7 pcf to 123.2 pcf. The optimum water
contents for these densities ranged from 11.8 to 14.1 percent and averaged 12.9
percent. Since the sandcone tests were conducted where the soil contained very
little gravel size particles, the density of the core material in these areas
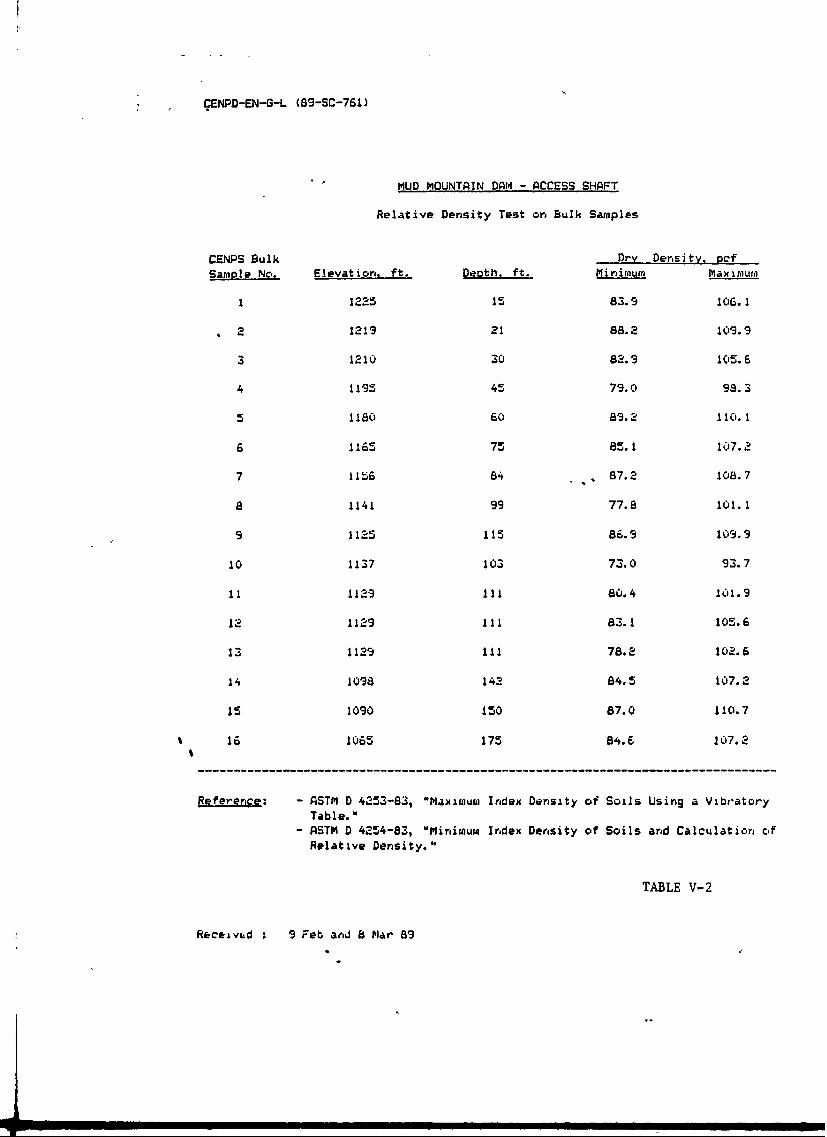
was about 95 percent of maximum. Relative density (max-min) tests were also
conducted on the bulk samples and indicated an average maximum density of 105.4
pcf (93.7 to 110.7 pcf range) and an average minimum density of 83.2 pcf (73.0
to 89.2 pcf range). The max-min test results are tabulated in table V-2.
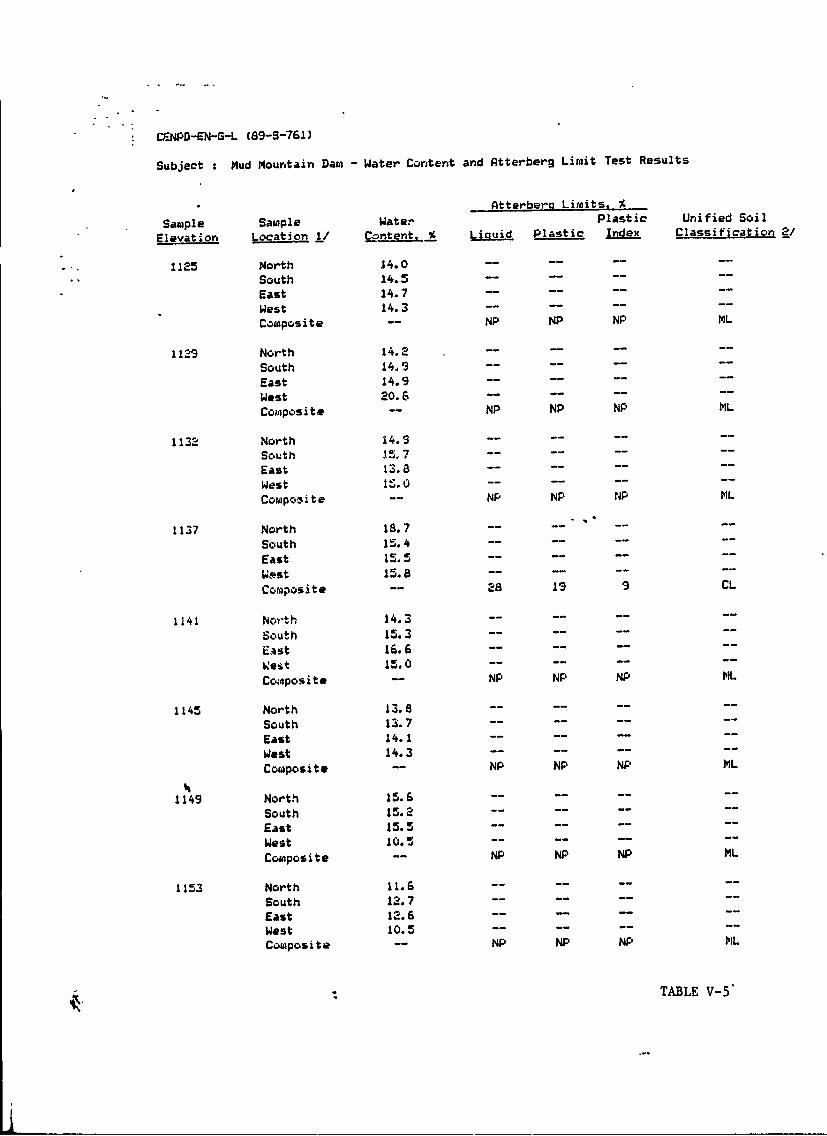
Small cellophane bag samples from each quadrant of the excavation were taken
every 4 ft. for moisture content, Atterbergs and classification. The results
of these tests are shown in tables V-3 to V-8. D'otailed test results are
included in the appendix to this report along with daily inspection logs.
V-3
I u
I LI)
L-I 9 C t 1:"1l U C! " .1 99 I
C.4 w 4- - 11 -2 44 4 , '4
I L
&--I
IZ r4 -u.r u- -, -. Em i,I ". .4 .r .4 I 4 C I- C 4 .- 4 17. I -
mlu
1 .1. "
o- =-~~- A= ~ =.4 r- C _
- I - - - - M LJ..4h .a- - S - - - n -1 a 0 a C o~.' '13 mn- 'a m a.- '
Ez I
UI
Li-
,1 +4 4 (4 -3 -10> ~. -L~ C - f
1* I Ln
L L IA
uI I m m ,c ' ')c 6 mSM m. imv4c4c4o )F AI
4 w p o- .- m~ a,4 - -
In W
-. I .1 1-, I 1 -1 -I - r I I r- P- I I- It -W. r4. (4W -o. UW r. -W. U.r ooo U. U. ooo. IV..C
I In 'S m m IbMt Ir. 1 IS MW m mIa
CC CC CTABLE V-1
EPD-EN-G-L (89-SC-761)
MUD MOUNTAIN DA4 - ACCESS SHAFT
Relative Density Test on Bulk Samples
CENPS Bulk Dry Density, Pcf
Sample No. Elevation, ft. Depth, ft. Minimum Max imum
I 1225 15 83.9 106.1
2 1219 21 88.2 109.9
3 1210 30 82.9 105.6
4 1195 45 79.0 98.3
5 1180 60 89.2 110.1
6 1165 75 85.1 107.2
7 1156 84 - , 87.2 108.7
8 1141 99 77.8 101.1
9 1125 115 86.9 109.9
10 1137 103 73.0 93.7
11 1129 111 80.4 101.9
12 1129 111 83.1 105.6
13 1129 111 78.2 102.6
14 1098 142 84.5 107.2
15 1090 150 87.0 110.7
16 1065 175 84.6 107.2
Reference: - ASTM D 4253-83, "Maxiwum Index Density of Soils Using a VibratoryTable."
- ASTM D 4254-83, "Minimuma Index Density of Soils ard Calculation ofRelative Density."
TABLE V-2
Receavd : 9 Feb ad 8 Mar 89

CENPD-EN-G-L (8S-S-761)
MUD MOUNTAIN DAM - ACCESS SHAFT
Water Content and Atterberg Limit Tests on Baggie Samples
Atterberg Limits,Sample Sample Water Plastic Unified Soil
Elevation Location I/ Content, Liquid Plastic Index Classification 2/1065 North 14.5 .......
South 13.7 .......
East 12.0 .......West 12.8 ......Composite -- NP NP NP ML
1069 North 15.0 ........
South 15.3 ........
East 17.6 ........
West 14.5 ........
Composite -- NP NP NP ML
1073 North 13.2 ........
South 13.2 ........
East 12.8 ........West 14.7 -- -- --
Composite -- 27 17" 9 CL
1077 North 14.8 -- -- --
South 14.3 ........
East 14.3 ........
West 12.6 -- -- --
Composite -- 26 16 10 CL
1081 North 12.8 -- -- --
South 12.6 ........
East 11.1 ........West 13.7 ........
Composite -- NP NP NP ML
1085 North 16.7 ........
South 12.1 ........East 10.8 ........
West 10.0 ..-- --.
Composite -- 29 16 13 CL
1088 North 15.5 ..-- --.
South 14.2 ........East 13.9 .......
West 13.6 ........
Composite -- NP NP NP ML
1093 North 14.7 ........
South 14.7 ........
East 15.4 ........
West 13.6 -- -- --
Composite -- 34 20 14 CL
TABLE V-3

CENPD-EN-G-L (89-S-761)
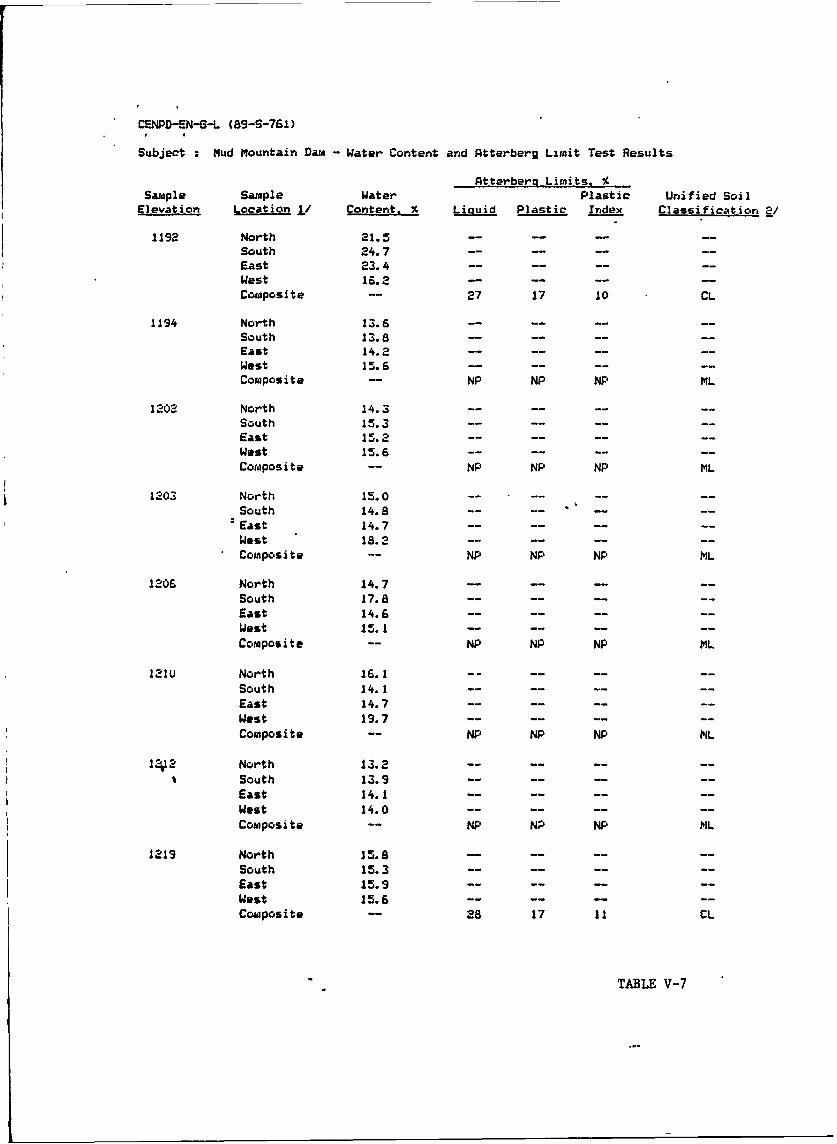
Subject : Mud Mtuntain Dam - Water Content and Atterberg Limit Test Results
Atterber Limits %Sample Sample Water Plastic Unified Soil
Elevation 1, ocat i, / Content, % Liquid Plastic Index Classification 2/1097 Ncrth 14.3 .... • --
South 14.3 ........East 12.5 ........West 15.2 . -- --Composite - 32 21 11 CL
1101 North 17.8 -- -- -(2-1-89) South 14.6 .......date East 16.9 ........
West 10.7 -- --.. .Composite -- 29 19 t0 CL
1101 North 17.8 -- --.. .(no date) South 17. 1 ........
East 14.5 ........West 18.3 -- -- --Composite -- 27 18 9 CL
1105 North 16.1 -- -- -- .South 15.8 ........East 15.7 ........West 16.7 ........Composite -- NP NP NP ML
1109 North 15.5 ........South 16.1 -........
East 16.6 ........West 18.0 -- --.. .Composite -- 25 19 6 CL-ML
1113 North 15.1 -- -- --
South 13.2 .......East 15.6 ........West 15.1 -........
Composite -- NP NP NP ML
1114 North 14.3 ........South 15.8 ........East 14.6 ........West 14.4 ........Composite -- NP NP NP ML
1122 North 11.9 .. .. ....South 13.3 .. .....East 14.6 .......West 13.3 .......Cowposite -- NP NP NP ML
TABLE V-4.,
CF.NPD-EN-G-L (89-S-761)
Subject : Mud Mountain Dam - Water Content and Atterberg Limit Test Results
Atterbern Limits, %
Sample Sample Water Plastic Unified Soil
Elevation Location 1/ Content % Liquid Plastic Index Classification 2/
1125 North 14.0 ........South 14.5 ......East 14.7 .......West 14.3 ........
Composite -- NP NP NP ML
1119 North 14.2 .......South 14.9 .......
East 14.9 ........
West 20.6 .......Composite -- NP NP NP OL
1132 North 14.9 ........South 15.7 ........
East 13.8 ........
West 15.0 ........
Composite -- NP NP NP ML
1137 North 18.7 ... - -- --
South 15.4 ........
East 15.5 ........
Wvst 15.8 ........
Composite -- 28 19 9 CL
1141 North 14.3 -- -- --
South 15.3 ........
East 16.6 ........
West 15.0 ........
Composite -- NP NP NP ML
1145 North 13.8 ........
South 13.7 ........
East 14.1 ........
West 14.3 ........
Composite -- NP NP NP ML
1149 North 15.6 ........
South 15.2 ........
East 15.5 ........
West 10.5 ........
Composite -- NP NP NP ML
1153 North 11.6 ........
South 12.7 ........
East 12.6 .......
West 10.5 ........
Composite -- NP NP NP ML
TABLE V-5'

CENPD-EN-G-L (89-S-761)
Subject : Mud Mountain Dam - Water Content and Atterberg Limit Test Results
Atterbern Limits, %
Sample Sample Water Plastic Unified SoilElevation Location I/ Content, % Liuid Plastic Index Classification 2/
1156 North 12.6 .......South 13.8 -......
East 13.7 ........West 13.9 ........Composite -- NP NP NP ML
1168 North 14.7 .......South 15.8 .......East 13.7 .....West 14.7 ........Compos. te -- NP NP NP ML
1169 3/ North 13.2 ........South 13.7 ........East 13.4West 14.6 ........Composite -- NP NP NP ML
1173 4/ 14.1 ........12.1 -........
_/13,2 ........ -
la I .7 ........ -
Compositi• -- NP NP N, ML
1177 North 7.8 -........
South 13.3 ........East 13.2 ........West 14.1 -........
Composite -- NP NP NP ML
1180 North 15.0 ........South 13.3 ........East 14.3 ........West 14.1 -- -- --
Composite -- 27 17 10 CL
1 k85 North 14.9 -- -- --
South 15.6 ........East 14.8West 16.5 ........Composite -- 23 19 4 CL-ML
1187 North 15.9 --......South 15.5 ........East 15.6 .......West 15.7Composite -- NP NP NP ML
TABLE V-6
CENPD-EN-G-L (89-S-761)
Subject : Mud Mountain Dam - Water Content and Atterberg Limit Test Results
Atterberq Limits, %Sample Sample Water Plastic Unified Soil
Elevation Location I/ Content, % Liquid Plastic Index Classification 2/
1192 North 21.5 ......South 24.7 ........East 23.4 ........West 16.2 - -- --
Composite -- 27 17 10 CL
1194 North 13.6 -- -- -
South 13.8 ........East 14.2 ........West 15.6 .......Composite -- NP NP NP ML
1202 North 14.3 ........South 15.3 ........East 15.2 ........West 15.6 ........Composite -- NP NP NP ML
1203 North 15.0 ........South 14.8 .. " ...East 14.7 ........
West 18.2 ........Composite -- NP NP NP ML
1206 North 14.7 .......South 17.8 .......East 14.6 ........West 15.1 ........Composite -- NP NP NP ML
1210 North 16.1 ........
South 14.1 ......East 14.7 ........West 19.7 ........Composite -- NP NP NP OIL
2 North 13.2 ........South 13.9 ........East 14.1 ........West 14.0 ........Composite -- NP NP NP OL
1219 North 15.8 .......South 15.3 ........East 15.9 ........West 15.6 -- -- -Composite -- 28 17 11 CL
TABLE V-7

CENPD-EN-G-L (89-S-761)
Subject : Mud Mountain Dam - Water Content and Atterberg Limit 'rest Results
Atterberg Limits, %
Sample Sample Water Plastic Unified SoilElevation Location l/ Content, % Liquid Plastic Index Classification 2/
1225 4/ 14.7 ........
4/ 15.2 .......Composite -- NP NP NP ML
-- 5/ North 13.6 ........
Soulh 13.8 .......
East 14.2 ........
West 15.6 ..-- --.
Composite -- 26 16 10 CL
1176-1175 1 of 2 13.9 NP NP NP ML(Jar) 2 of 2 14.3 NP NP NP ML
1140 Jar 16.0 NP NP NP ML
1139.5 Jar 15.4 NP NP NP ML
----------------------------------------------------------------------------------
Notes: I/ Composite samples were composed of combined North, South, East and West samples.a/ Atterberg Limit tests are performed on the minus No.40 fraction of the sample.
The classification is for that portion only, not the entire sample.I/ This sample was not shown on NPD Form 300, Sample Transmittal.1/ No sample location shown on bag./ No sample elevation shown on bags.
Received: 9 Feb ard 3 Mar 89
TABLE V-8

SECTION VI
CONSTRUCTION

SECTION VI - CONSTRUCTION
A. General Overview. The main feature of the contract was the construction of
a Seepage Control Cutoff Wall from elevation 1253 down to and embedded 15 ft.
into bedrock. The Seepage Control Cutoff Wall contract also included raising
the dam from elevation 1250 to 1257, extension of existing roads on the
upstream and downstream face of the dam to the new top, construction of earth
retension structures along the top of dam road extensions (Hilfiker Wall,
Eureka, CA) realignment of the spillway access road, and constructing a
temporary steel cased exploratory access shaft into the core of the dam.
Incidental features included new piezometer installations, extension of
selected existing piezometers, new inclinometer installations, investigative
coring of the foundation bedrock and quality control coring of the concrete
cutoff wall.
B. Site Preparation. The cutoff wall construction required large waste areas
for disposal of material excavated from the core of the dam and slurry that
could not be treated for reuse. The northern waste area was used for
untreatable slurry disposal while the southern waste area was used for
excavated materials. Realignment of the spillway access road required some
99,000 cy of excavation. The excavated material was disposed of in the waste
areas. The size and number of heavy equipment anticipated to be used on top of
the dam at the height of construction required that the top of the dam be
lowered to elevation 1240 (10 ft. below existing) to provide a wider work
VI-1

platform. The non-rock materials removed during the dam lowering (about 30,000
cy) was also to be disposed of in the waste areas. Two areas were clear cut
near the Resident Office to provide over 10 acres of land for waste disposal
(see plate 2). Another 4.5 acres was clear cut just west of the waste areas to
provide a staging area which the contractor used to construct slurry holding
ponds (four ponds each capable of storing 630 cy each), a slurry mixing
station, concrete aggregate stockpiles, on-site concrete batch plant, and
miscellaneous equipment storage.
Some of the material removed off the top of the dam was used to build an
access ramp up off the spillway floor to the top of the work platform. The
ramp also allowed the cutoff wall excavation equipment to work from a level
platform straight off the top of the dam to excavate and place 90 ft. of the
cutoff wall that extended out under the spillway.
C. Bentonite Slurry. Soletanche used 100 percent Wyoming bentonite (National
Premium 90 bentonite) supplied by Baroid Minerals and Chemicals. Five primary
characteristics were measured for slurry quality control: density, flow-
ability, caking, chemical environment, and sand content.
The density of the slurry determines the hydrostatic pressure exerted on
the trench walls. The hydrostatic pressure is the main stabilizing factor
keeping the trench walls from caving. Once introduced into the trench, the
density changes as native soils mix in and become suspended in the slurry (the
VI-2

density increases). If the density becomes too high, the placement of tremie
concrete will be impeded. The tremie concrete is not able to flow as readily
and may result in open honeycombs and voids (same result as if a low slump
concrete was used). The contract specification required a minimum bentonite
concentration of 6 percent (minimum density of 64.3 pounds per cubic foot) by
weight of water. During excavation the slurry density was allowed to go up to
90 pcf. Prior to concrete placement the slurry required a sand content less
then 1 percent and slurry density less than 85 pcf.
The flowability is measured by four tests: apparent viscosity, plastic
viscosity, Marsh funnelp and gel strength. High viscosity (low flowability)
can cause more of the cuttings to remain in suspension and cause undesirable
high densities. Gel strength is more an indication of flowability after the
slurry has been allowed to set. If the gel strength is too high, the slurry
could stiffen after circulation stops and again impede placement of tremie
concrete. The contractor proposed to keep the slurry apparent viscosity at or
above 7 centipoises when measured at the point of mixing and before discharge
to a reserve tank or the trench. The plastic viscosity was proposed to be kept
less than or equal to 30 centipoises at the time of concrete placement. The
viscosity tests were done with a direct reading viscometer. The 10-minute gel
strength was to be kept at or above 2 pounds per 100 square feet in the mixing
tank prior to discharge for storage or excavation. This test was also made
with a direct reading viscometer. The quick check test for viscosity, the
Marsh Funnel, was used frequently and the slurry was required to pass in 30
VI-3
seconds or more.
The caking ability of the slurry is measured by the filtrate and filter
cake test. The filtrate test determines how much slurry is lost through a
filter in 30 minutes. High losses indicate a slurry that is incapable of
sealing off a pervious face. If the slurry forms a cake on the filter paper
(i.e. the trench sidewall) the loss will be low since bentonite is highly
impermeable. The thickness of the cake on the filter paper is measured as an
indicator of caking ability (how fast a cake will form or reform on the sides
of the trench when damaged). The contractor proposed to keep the filtrate loss
under 50 cubic centimeters when subjected to 100 psi pressure for 30 minutes.
The test was required to be run using a "Whatman" Number 50, S&S Number 576 or
equivalent filter.
The chemical environment is measured by the pH. Neutral environments have
a pH of 7. Acid environments have a pH less than 7 and alkaline environments
have a pH greater than 7. An alkaline environment is desirable, however, if
the pH goes over 10.5 the clay particles (bentonite) will tend to clump and
settle out. This will cause the density of the slurry to drop and require the
addition of more bentonite (at a lower yield of acceptable slurry per bag of
bentonite). The contract required the alkalinity of the slurry to be
maintained between 8 and 11.
The sand content measures the percentage of sand by volume in a slurry
VI-4

sample and will be used to determine the cleanliness of the trench prior to
tremie concrete placement. High sand content could cause contamination of the
concrete or inclusion of sand seams (therefore, water passages) along rock and
adjacent panel contact surfaces. The contract required the sand content be
less than 1 percent prior to concrete placement.
Organic and inorganic substances could be added (subject to approval) which
change the slurry properties. Two types are viscosity reducing agents known as
"thinners" and deflocculating agents. Soletanche indicated in their proposal
to use sodium bicarbonate or lignosulfonate to control viscosity. Soletanche
used sodium bicarbonate almost exclusively to treat the slurry. Lignosulfonate
is an organic thinner and a by-product of paper pulp. It causes the clay
particles to disperse and lowers the slurry viscosity. Allied Colloids
Alchemer 72 is a polymer thinner. Polymers act more quickly than organic
compounds. Both thinners are available in liquid form. Sodium bicarbonate
(baking soda and in crude form, soda ash) acts as a deflocculent. It is
commonly used when high concentrations of calcium or magnesium are present in
the soil, groundwater or water source. Calcium can also enter the slurry
during excavation of adjacent concrete panels (secondary panel excavations
typically removed 4 inches to 14 inches of concrete from the adjacent primary
panels) or dental concrete placements along bedrock. The sodium acts to negate
the clumping effect of calcium and magnesium and allows the bentonite to retain
its ability to swell and absorb water. The same viscosity can therefore be
maintained with less bentonite (slurry yield is improved). Allied Colloids
VI-5

sample and will be used to determine the cleanliness of the trench prior to
tremie concrete placement. High sand content could cause contamination of the
concrete or inclusion of sand seams (therefore, water passages) along rock and
adjacent panel contact surfaces. The contract required the sand content be
less than 1 percent prior to concrete placement.
Organic and inorganic substances could be added (subject to approval) which
change the slurry properties. Two types are viscosity reducing agents known as
"thinners" and deflocculating agents. Soletanche indicated in their proposal
to use sodium bicarbonate or lignosulfonate to control viscosity. Soletanche
used sodium bicarbonate almost exclusively to treat the slurry. Lignosulfonate
is an organic thinner and a by-p-oduct of paper pulp. It causes the clay
particles to disperse and lowers the slurry viscosity. Allied Colloids
Alchemer 72 is a polymer thinner. Polymers act more quickly than organic
compounds. Both thinners are available in liquid form. Sodium bicarbonate
(baking soda and in crude form, soda ash) acts as a deflocculent. It is
commonly used when high concentrations of calcium or magnesium are present in
the soil, groundwater or water source. Calcium can also enter the slurry
during excavation of adjacent concrete panels (secondary panel excavations
typically removed 4 inches to 14 inches of concrete from the adjacent primary
panels) or dental concrete placements along bedrock. The sodium acts to negate
the clumping effect of calcium and magnesium and allows the bentonite to retain
its ability to swell and absorb water. The same viscosity can therefore be
maintained with less bentonite (slurry yield is improved). Allied Colloids
VI-5

The bentonite slurry with the suspended soil particles coming from the
trench excavation flows directly onto the coarse shaker screen of the desander.
The shaker screen is made of two superimposed screens of differently sized
openings. This first operation eliminated all particles larger than 1/4 inch
in diameter. The bentonite slurry is then pumped to the hydrocyclone where the
sand is separated. This sand is screened and drained through a different
shaker screen, then stockpiled in front of the desander in wet, but clean
condition. The bentonite slurry passing through the hydrocyclone is then
accumulated in a tank. A pump sends the bentonite slurry to a small
hydrocyclone, which separates the very fine soil particles. The bentonite
slurry is finally sent to the tanks placed under the desanding plant, where it
can be used again for the trench excavation.
The slurry that enters the storage tanks can be sampled and tested and
treated with chemicals, if necessary. Untreatable slurry is pumped up to the
waste storage pond to settle out the bentonite. The sludge is then pumped to
the northern wet waste area and disposed.
The contractor maintained 2,110 cy of slurry in storage. There were four
storage ponds holding 630 cy each (one was used for holding untreatable waste
slurry prior to disposal into the waste areas) and steel tanks below the
desanding unit that held 220 cy. A schematic sketch of the slurry flow is
provided in figure VI-I.
VI-7

D. Excavation. The cutoff wall excavation was accomplished primarily by a
sophisticated rock mill built by Soletanche, Inc. called the Hyrdofraise. Very
few areas were excavated by conventional chisel and grab methods and primarily
only where boulders in the Mud Mountain Complex overburden were encountered.
The components of the Hydrofraise are illustrated in figure VI-2. The
components are housed and attached to an 80 ft. rigid steel frame (3)
transported to the site in two boltable sections. The total unit weighs 44
tons. At the bottom end (1) of the frame are two cutter drums and motor
assemblies that are built to the same width as the wall to be excavated. Using
different size drums, the contractor excavated the Type I wall sections to 32
inch width and the Type II wall section to 40 inch width. The drums are fitted
with tungsten carbide tipped cutters. The drums rotate in opposite directions
to excavate the soil and bedrock. The speed of rotation could be controlled
individually to drive the Hydrofraise and make gradual corrections in direction
within the plane of the cutoff wall. The drums were also mounted on a tiltable
plate to allow driving the Hydrofraise in and out of the plane of the cutoff
wall. A dredge type pump (2), situated just above the drums, pumps the
excavated material suspended in slurry from an intake between the drums through
about a 6 inch diameter steel pipeline and flexible hose (6) to the desanding
station.
A 200 ton Manitowoc 4100 heavy crawler crane with a 170 foot boom was used
to support and manipulate the Hydrofraise by way of a crane-operated cable.
There is always a crane operator and Hydrofraise operator in individual cabs to
V I-3
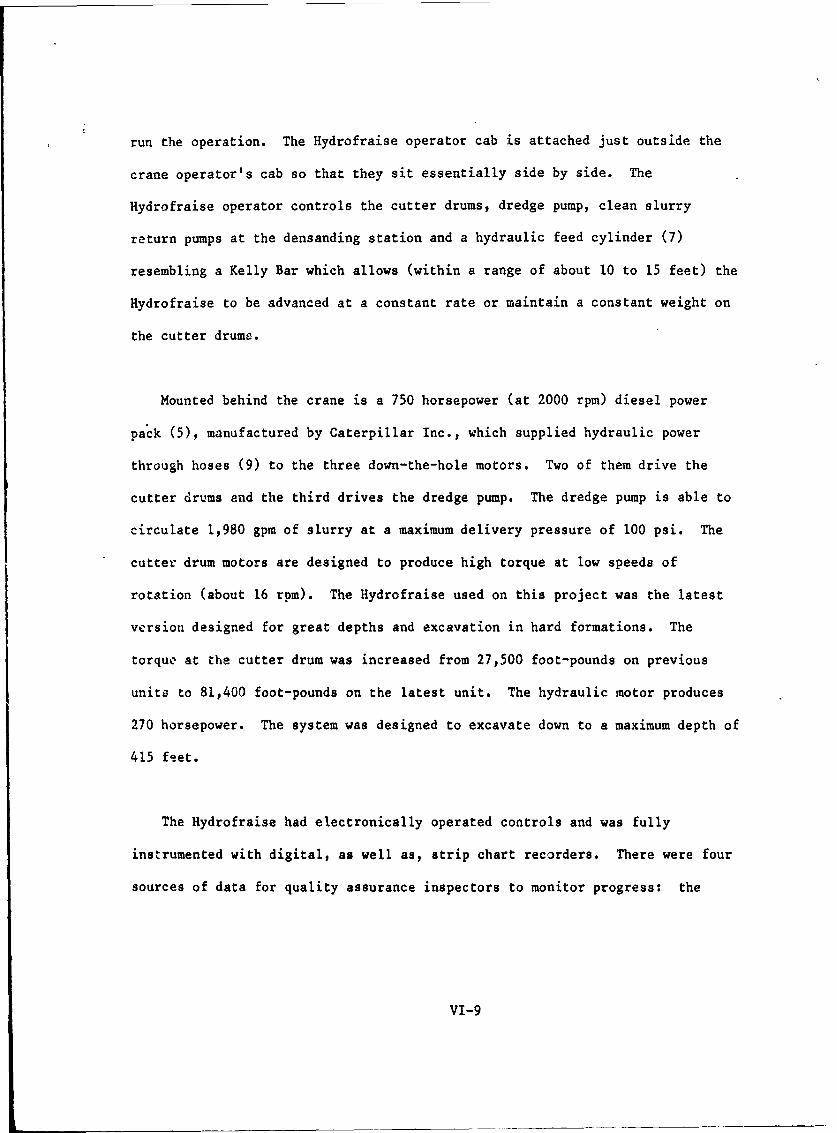
run the operation. The Hydrofraise operator cab is attached just outside the
crane operator's cab so that they sit essentially side by side. The
Hydrofraise operator controls the cutter drums, dredge pump, clean slurry
return pumps at the densanding station and a hydraulic feed cylinder (7)
resembling a Kelly Bar which allows (within a range of about 10 to 15 feet) the
Hydrofraise to be advanced at a constant rate or maintain a constant weight on
the cutter drume.
Mounted behind the crane is a 750 horsepower (at 2000 rpm) diesel power
pack (5), manufactured by Caterpillar Inc., which supplied hydraulic power
through hoses (9) to the three down-the-hole motors. Two of them drive the
cutter drums and the third drives the dredge pump. The dredge pump is able to
circulate 1,980 gpm of slurry at a maximum delivery pressure of 100 psi. The
cutter drum motors are designed to produce high torque at low speeds of
rotation (about 16 rpm). The Hydrofraise used on this project was the latest
version designed for great depths and excavation in hard formations. The
torque at the cutter drum was increased from 27,500 foot-pounds on previous
units to 81,400 foot-pounds on the latest unit. The hydraulic motor produces
270 horsepower. The system was designed to excavate down to a maximum depth of
415 feet.
The Hydrofraise had electronically operated controls and was fully
instrumented with digital, as well as, strip chart recorders. There were four
sources of data for quality assurance inspectors to monitor progress: the
VI-9

Hydrofraise operator's dashboard digital readouts on depth and deviation; a
computer screen on the upper corner of the dashboard displaying depth, torque,
deviation, and time; a strip chart recorder on the outside wall of the
Hydrofraise cab displaying depth and deviation; and a data compiler on the side
of the crane displaying time in hours, minutes and seconds, depth in
centimeters and other data. The compiler records information every time the
Hydrofraise advances 5 centimeters down the trench. When the Hydrofraise pulls
out, the compiler stops recording data, but continues to display the last set
of data. This was very useful in carrying out production studies on the
Hydrofraise.
The Hydrofraise power pack is equipped with an early warning system that
detects intrusion of slurry into the hydraulic lines supplying the down-the-
hole motors. A horn goes off when a critical level of bentonite is detected in
the hydraulic fluid. Normally, proper changing of hydraulic oil filters were
sufficient to prevent the build-up of slurry in the hydraulic lines to levels
critical enough to shut down the operation. Considerable downtime is involved
in purging the system once the slurry levels in the hydraulic oil exceed
certain limits.
Excavation rates averaged about 89 square feet per hour in the core
material of the dam and about 16 square feet per hour in the andesite bedrock.
Pick consumption averaged 55 picks per 10 hour shift to 60 picks per 11 hour
shift. Total pick consumption for the Type I wall excavation was about 7,500
VI-IO

picks and 10,000 in the Type II wall. Detailed production data and downtime
records for panels 1249 129, 139, 1229 126, 141, 120, 135, 130, 140, 1349 128,
138, 136, and 142 are included in the appendix to this report.
Prior to placement of concrete, the panel was desanded by using the
Hydrofraise to act as a sump pump and clean the panel bottom, as well as the
slurry in the trench. The specification required the panel slurry to be
cleaned to a sand content less than or equal to 1 percent. This was deemed
unreasonable or unnecessary by the contractors submitting proposals during the
bid process, however, the Hydrofraise equipment could routinely achieve sand
contents less than I percent prior to concrete placement. Detailed information
on the equipment, methods, mix designs, and quantities involved in the concrete
placements are discussed in Section XII of this report.
VI-lI

--
Ik-Wo
A88ms C]3.NIWINO
00
- t--
~ccU-3
caI

or46
b.?1
7.-
'a _ _ _ ur tu
Frm
(D Crawler Crams__ ® Power paick
6)Slurry circulation hose toscreening and desandingunit.
6 (D Hydtaulic feed cylinder(DBenlonite slurry A*5.d
Itonch."'(D Hydraulic hoses
-Use or disclosure of data contained on this she&-#sibject to the restriction on the title page ot uproposal or quotation."
MUPD MOUNTAIN DAM..
I SCHEMATIC OF HYDROFRAISES20'eFGREV-
FIUEV-

SECTION VII
QA/QC PROGRAM

SECTION VII - QA/QC Program
Key objectives of the QA/QC program were aimed at addressing design
concerns about ensuring verticality of excavations, proper overlap and
watertightness between panels, trench stability, proper embedment of panels
into bedrock, high quality homogeneous well-consolidated concrete, and proper
concrete strength gain. Some concerns cited by Bureau of Reclamation engineers
working on the Navajo Dam project in Farmington, New Mexico related to a lack
of redundancy in verifying the contractors panel verticality and continuity
assessments. Another concern cited was the possibility that native soils mixed
with water may have been used periodically at Navajo Dam in lieu of a bentonite
slurry mix. The "Hydrofraise" excavating machine brought to the Mud Mountain
Dam project was the latest version incorporating many new instrumentation and
hardware features which, in addition to the tailored QA/QC program, addressed
these design and construction concerns.
The original contract plan required steel guide members to be installed in
"primary" panels on each side of subsequent "secondary" panel excavation, see
figure VII-I. The steel primary guides were to incorporate an inclinometer
casing to verify the verticaliI7 of the installation. The secondary excavation
was required to be carried uut while the excavator remained in constant contact
with each adjacent primary guide to ensure verticality and continuity of the
VII-I

cutoff wall panels. An option was provided to run a template down after the
secondary excavation in contact with each adjacent primary guide to verify the
continuity and verticality of the panels before concrete placement.
The contractor proposed to eliminate the primary guides and utilize the
constant read-out/feedback capabilities of the hydrofraise to ensure
verticality and continuity of the panels. Room for some deviation was to be
accounted for primarily by increasing the excavated thickness of the deeper
panels to ensure at least a 24 inch thick continuous wall was constructed.
This Value Engineering Contractor Proposal was accepted providing instant
contract savings of $1,202,399.00 with the Government realizing a savings of
$613,391.00.
The VECP deleted the steel truss primary guides proposed under the original
contract to be installed in "single bite" panels (panels excavated by a single
pass of the Hydrofraise) and called instead for construction of three bite
primary panels with the middle bite everlapping and going in between the first
and second bites, see figure VII-l. The Hydrofraise was to be lowered down
between the bites after excavation was complete to assure that no unexcavated
portions remained between; thus ensuring continuity of the primary panel. The
secondary panel was excavated between the adjacent primary paneis in an
alternating pattern.
The VECP was not accepted without redundant verticality/continuity checks.
VII-2

The contractor proposed to dye the lower 20 feet of the primary panels in
alternate color schemes of black and red concrete as a qualitative check on
continuity and verticality (see figure VII-2). The primary panels were spaced
such that the Hydrofraise would overbite into the adjacent primary panels when
excavating the secondary. QA/QC personnel could then verify this at the lower
depths of excavation by retrieving colored concrete pieces from the desanding
operation. This in itself gave little assurance that the overlap was at least
24 inches throughout the wall. The contractor believed the 24 inch overlap
could be assured by the assumption thac the concrete pieces retrieved were
broken off portions of the "key" left on each excavated primary joint between
the two cutting heads of the Hydrofraise, see figure VII-3. In reality, the
pieces did not resemble in any way a neat key and so the method in itself
cannot be used as a QA/QC tool.
The coloring did come into play under another redundant scheme using an 80
foot long drilling guide which duplicated the dimensions of the Hydrofraise
down in the trench. The so-called "fish" (see figure VII-4) could be
positioned at any depth of the secondary panel. Once set, a coring rig could
send an "AX" or "EX" core barrel and drill string down the tubing and sample
from the face of each adjacent primary panel joint. Retrieval of four cores,
two from each primary interface, geometrically assured that at least a 24 inch
overlap existed at that location of the panel. This redundant check was
instrumental in detecting an initial error in the hydrofraise's built-in
inclinometer. The fish was first used in Panel 16. It cored two samples of
VII-3

black concrete from Panel 15, which was correct and verified both minimum width
of the wall and closure. However, on the other side (Panel 17) it cored
approximately 6 inches of andesite bedrock before going into pink concrete.
Having occurred in both holes on this side, it confirmed minimum panel width,
but not closure. This initiated a calibration check of hydrofraise's
inclinometers, which had been (permanently) set after assembly. The
verticality of the hanging hydrofraise was checked with a theodolite. It was
found that the hydrofraise's inclinometer sensor mounting bracket, located
inside the open framework, had been bent by a large cobble or boulder falling
out of the excavation wall and onto the mounting bracket during excavation.
After this incident, Panel 16 was trimmed along the interface with Panel 17 and
rechecked with the fish. It then became standard practice to verify the
accuracy of the hydrofraise inclinometers with the theodolite before excavation
of each panel.
The verticality data from the primary panel excavations could be compared
while or before the secondary panel between them was excavated. The actual
profile of the panels could be overlayed to find the location where continuity
could be most questionable. When the secondary excavation was complete, the
profile of the secondary panel could be generated to choose the depth at which
the "fish" should be set to verify continuity. In most instances, setting the
fish at the lowest depth was used to verify continuity. The Hydrofraise was
found to be a highly reliable, accurately instrumented excavator.
VII-4

Another redundant check was added later after the contractor experienced
heavy slurry losses and trench instability. The primary panel excavations were
reduced back to single bites to reduce the time that panels remained open.
This increased the number of secondary panels and panel joints. The contractor
was therefore tasked with meeting tight tolerances on more occasions and cited
reduced flexibility in not being able to make up for tolerance errors within
the three bite primary panels. The contractor proposed to increase the overlap
of the secondary panels into the primary panels and provide additional
verticality checks. The contractor devised a well conceived, yet simple, "wear
test." The wear test consisted of periodically installing excavator teeth
without carbide tips onto the Hydrofraise cutter heads then after excavating
short reaches, checking the teeth for characteristic wear patterns. If a band
of teeth over at least a 24-inch width showed the characteristic wear pattern
from excavating concrete in adjacent primary panels, the Hydrofraise was
considered to be within acceptable verticality limits and assured continuity
within that reach. These checks were done at approximately 80 ft. increments
because the frame of the Hydrofraise is 80 ft. and deviations can only occur in
these 80 ft. reaches.
The bedrock embedment of the panels was to be computed by straight line
interpolation between bedrock contact depths from core drilling information in
open primary panel trenches. This method was waived in favor of using torque
readouts from he Hydrofraise instruments to pinpoint depths of contact with
bedrock. This was deemed more accurate because drill wander concerns were
eliminated and each cutter head provided a contact point so two bedrock depths
were obtained. Another benefit was the reduction in time that a primary panel
VII-5

remained open. Drilling in open panels could have gone on for days at a time.
This was deemed risky in light of the slurry loss problems encountered.
Slurry tests were made on a daily basis. The slurry mixing station was
readily accessible and in general view to assure properly mixed slurry was
maintained in the storage ponds nearby. Slurry tests were made from the
trench, from the pumps, and from the storage ponds. No irregularities were
found in the quality, production, or maintenance of the slurry supply (see
figure VII-5).
The concrete QA/QC program is covered separately in this report. Key
parameters checked were slump, air content, tremie embedment in fresh concrete,
placement rate, go-devil performaace and strength gain to ensure the concrete
would flow properly, consolidate well, remain homogeneous and uncontaminated
and achieved proper strength for adjacent excavation and future performance.
Concrete coring was carried out after curing to verify the quality of the
concrete. Some honeycombed areas were found in earlier panels, but pressure
tests indicated they were not continuous through the panel. Nevertheless, the
core holes were pressure grouted and intermittant corings were made and
pressure grouted as well. Maintaining the concrete slump in the specified
range of 7 to 9 inches and a slight change in the mix proportions cured the
problem with honeycombing. Quality Control checks using core holes were
correspondingly relaxed later on. The drilling subcontractor, Boyles Brothers
of Salt Lake City, Utah had relatively little difficulty maintaining the core
VII-6

hole in the panel even to 400 plus foot depths. An Eastman apparatus was used
along with a steerable downhole destructive drilling technique (Navidrill) to
correct non-vertical drilling. Core recovery throughout the job was excellent.
Quality Control Reports were received generally in two days. This was
because the contractor worked double shifts which ended at 0400 hrs or during
around the clock operations at 0700 hrs. The QCR was provided about a day
after the end of the night shift. The contractor utilized serialized Extra
Work Reports to document work considered outside contract requirements. This
facilitated response on potential claim items and most were resolved without
time or cost impact.
VII-7

CHRONOLOGY OF PANEL CONSTRUCTIONTECHNIQUE
FAM. f Cum........ w a s C...m.. O..s oD. v WA
TO 1 P.aCTOF AL - AN 2STAL TPE IIr CUOF A - I O..AN0TOA
CONTRACT PLANS: STEEL GUIDE MEMBERS REQUIRED IN PRIMARIES TOGUIDE SECONDARY EXCAVATION.
-__ .T Y P E I.. . .T Y P E ' .
PANI. PAL, [ . M(1 CIE SlT
CONTRACTOR ' S mnv :,, u CTTRIORIGINAL PROPOSAL : TO HA
RECTANGULAR STEEL TRUSS ST UIDN PHASES RQ E IN PHAES TGUIDE IN PRIMARY ELEMENTS ECOA EA,- ,, CION.,AI,,,,N,
TYPI -TP I44EEWE
TWO WELDED STEEL PIPES .. '.-INTEGRAL TO TRUSS ALLOWS .. ' .- ,--
INSTALLATION OF Jm . , ' "INCLINOMETER TUBING FOR [ AVERTICALITY CHECK.
9 1 111coHmem ToNNEL I a I SIMONCIASI CaAEIT
..... •
.. .. .. IIO,, N
FIRST *M£OND$1TC P79
ICALI..
TYPE I tVPIR U
~ ~~* -. CONTRACTOR'S VALUE.... .ENGINEERING CHANGE PROPOSAL:
1 ,, I " " STEEL GUIDE MEMBERS DELETED.CoNTUICTIO, ,SIls £orqueV "Co- *,.- SECONDARY SHORTENED TO SINGLE
EXCAVATION PASS DIMENSION OF"_ - HYDROFRAISE EXCAVATOR.
- _,I [ -- SOME PRIMARY PANELS INCREASEDu_ . .. IN LENGTH TO REQUIRE THREE
EXCAVATION PASSES, THE MIDDLEBEING REMOVED LAST (THE WEDGE).
4_4FIGURE VII-1
- , . .o a

DOUBLE CHECKING OF CAST IN PLACE WALL CONTINUITY
a a
-.-. oE CON.TE11A\,W/A-VY&/%Xa//%V//A\//AA.) SECONDARY PANEL .-. PRIMARY PANEL.
EXCAVATIO14
Ae. LENGTH OF CONTACT
DOWN STr#XAM
DOUBLE CHECKING OF THE
LEFT PRIMARY PA,'IEL
(/PSTrAAMA
AAPN AAKIS
TECONTACT'. HEWAL-~~~~ FIIE I

CONTINUOUS CHECK BYSAMPL ING CASTELL AT/ON
CUTTINGS
CASTE44.AWiOA cu/T /No
UPST,~4M uSr1Zcimfs LE~r It 4PrEMRla~/1CarrING wHiri CU777VGo £V/fEL
A ii7 - -N'
o * ... *. jj: /#v WHEE CTIN .a~
.0~EC. 1$,N. 704N1
SECONDNCWtT y -IM1
1. , .*. 4
AA
FIUR VIII
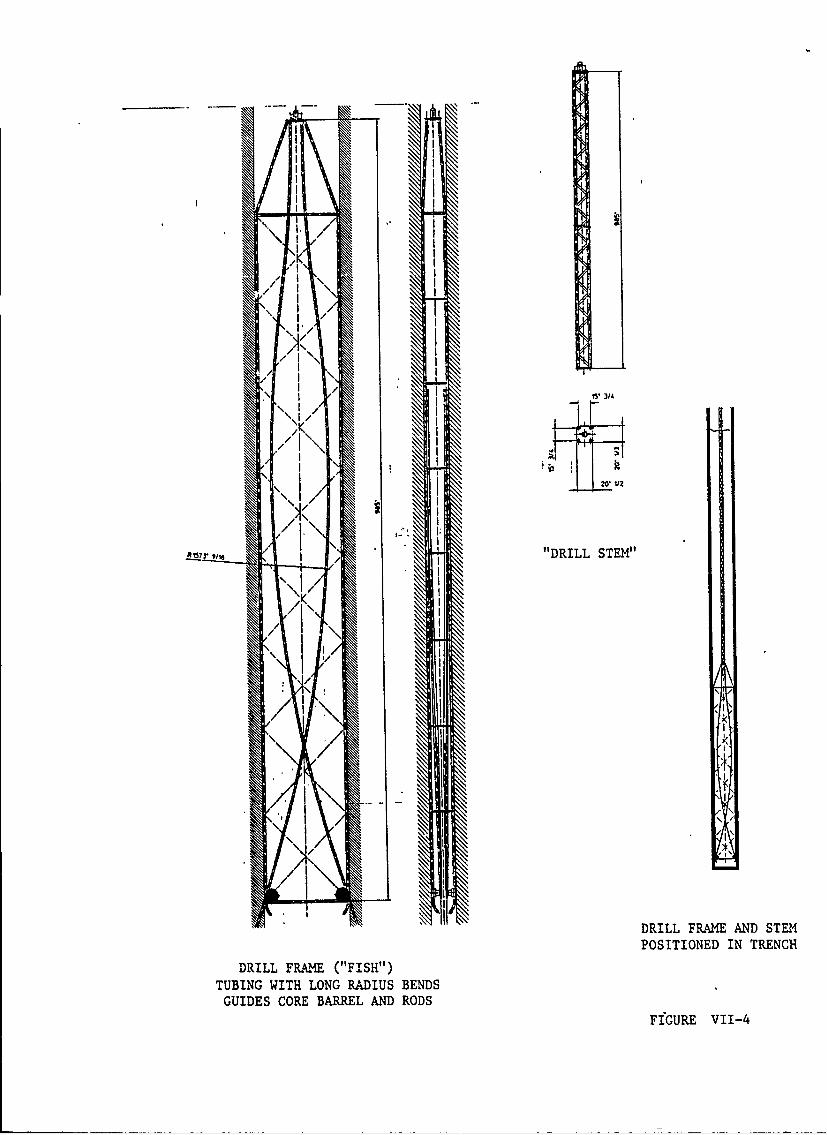
'I$" 1/
\\ I
'
\ 1
POIIOE IIREC
D IFRM "FS"
TBNWI LON RADIU BENDGUDE COEBRELADRD
F>GURE VI -

*0 C
I I L
(D of
Lm+
0 0
I ICLCD I Lia) j ~E CL
o Io 0
tvS
0.. ~V>1~. pJZ
FIGUR VIIO

SECTION VIII
CONTRACT CONSTRUCTION PROBLEMS

SECTION VIII - CONTRACT CONSTRUCTION PROBLEMS
Several incidents of slurry losses through hydrofracture of the embankment
through preexisting or induced cracks impacted progress on the slurry wall
construction during the first four months. Though the contract was well
prepared and procured to allow the contractor to prepare for potential
construction problems in advance, the regular occurrence and severity of the
slurry losses were not anticipated. The contractor was required to submit an
emergency plan as part of the technical proposal for dealing with exceptional
slurry losses. Soletanche had outlined a four step emergency plan.
Step one was to be implemented if the three "mission" pumps feeding slurry
to the trench at a combined rate of up to 2,000 gallons per minute were not
capable of maintaining the slurry level in the trench. The excavation would be
stopped and the normal circulation would be continued allowing the hydrofraise
operator to control a slurry loss of 2 to 3 feet per minute or 690 gallons per
minute.
Step two would be implemented if the slurry level continued to drop after
implementation of step one. The cutter wheels would be restarted to generate
cuttings for plugging leaks, but the slurry return from the trench would be
stopped. The hydrofraise operator then could use the full 2,000 gallons per
minute capacity of the mission pumps to maintain the trench slurry level. This
would allow control of slurry losses of up to 10 feet per minute. This step
VIII-I

could be theoretically implemented for about 1.7 hours with a 1,000 cubic yard
slurry supply. The contractor had proposed to provide this storage capacity by
building slurry ponds holding 800 cy and holding tanks storing another 200 cy.
Actually the contractor had four slurry ponds holding 630 cy each, but one of
these was dedicated for waste slurry storage prior to disposal. In addition,
The desanding unit could store 220 cy of slurry in steel tanks below the
cyclones and shaker screens. Therefore, the total onsite storage capacity was
about 2,110 cy.
Step three involved removal of the hydrofraise from the trench while
continuing to maintain the flow of slurry into the trench to keep the slurry
level as close to the top of the excavation as possible. The trench would then
)e backfilled with sand and/or graded gravel to plug the point of leakage.
After implementing step three, re-excavation of the panel would only begin upon
the approval of the Contracting Officer.
Re-excavation of a backfilled panel under step four of the emergency slurry
loss plan would require a supply of premixed grout to be available for
injection into the trench through a 6 inch pipe using the hydrofraise slurry in
the event of another slurry loss. Grouting would only begin on the order of
the Contracting Officer's Representative.
In practice, step two was implemented briefly or completely bypassed and
step three was immediately implemented after step one failed to stop the slurry
VIII-2

loss. Step four was implemented only twice and then abandoned in favor of
dumping pallets of bagged cement into the trench mixing then sending the
hydrofraise in . mix it in with the core material cuttings. The application
of step four resulted in time consuming difficulties during the re-excavation
of such panels. The thick mixture of cement, bentonite, and soil would plug
the slurry return pump, gum up the cutter wheels and require extensive
treatment of the slurry at the desander with sodium bicarbonate to maintain
acceptable slurry consistency. Continuous or routine application of such
methods would have resulted in unacceptable progress.
The work was started on a day shift basis and then went to two 10-hour
shifts beginning on June 5, 1989. Cutoff wall construction bigan on the
ivening of May 16, 1989 with the excavation of panel 15 bite A (15A). The
excavation was carried to a depth of 24 ft. between 1600 and 1900 hours. The
next day a slurry loss occurred sometime after noon during a one hour lunch
break when the hydrofraise was out of the panel and idle. The panel had been
excavated to a depth of 39 ft. and the slurry level had dropped down 17 ft. and
stabilized. The slurry level was brought back up to within 4 ft. of the work
platform to measure a loss rate of 16 inches per minute or 320 gallons per
minute. Sand was used to slow the leakage to 6.7 inches per minute or 135
gallons per minute. Additional sand and gravel backfill and the addition of
500 pounds of bentonite powder temporarily brought the slurry loss under
control. Minutes later the slurry loss resumed and after sand and gravel
backfill had been added up to within 13 ft. of the work platform the slurry
VIII-3

loss finally stabilized. The contractor estimated that over 90,000 gallons of
slurry had been lost.
Excavation work resumed on May 18, 1989 in panel 15C. At a depth of 28
ft., the three "mission" pumps supplying slurry to the trench could not
maintain the slurry level. Each mission pump is capable of supplying about 675
gallons per minute, therefore, slurry was being lost at over 1,980 gallons per
minute. Excavation ;as stopped to measure the slurry loss at 19 inches
per minute or 362 gallons per minute. The addition of sand and gravel backfill
reduced the slurry loss to 310 gallons per minute. Backfilling Lhe trench up
to within 12 ft. of the work platform stopped the slurry loss. The contractor
estimated 81,000 gallons of slurry were lost.
The contractor moved to panel 17C and began excavation on May 19, 1989.
Slurry began to be lost slowly at a depth of 27 feet. The loss increased to a
rate of 14 inches per minute or 285 gallons per minute at a depth of 31 feet.
The trench was backfilled to within 15 ft. of the work platform and stabilized,
however, in the course of backfilling panel 17C, panel 15C suddenly lost slurry
in what the shift superintendent described as a vortex into a 20 inch hole on
the downstream face of the panel. The contractor was directed to advance split
spoon driven exploratory holes around panels 15 and 17 to find potential
avenues of slurry loss. This exploratory work on May 20 and 21, 1989 revealed
nothing of significance. Some thought had been given to the possibility that
the transition zone of 6 inch rock spalls intercepted the trench, but this was
VIyl-4

proved incorrect.
The contractor returned to re-excavate the previously backfilled panel 15A
on May 22, 1989. At the Government's direction, the contractor was prepared to
implement step four of the exceptional slurry loss action plan. The
hydrofraise was fitted with an auxiliary grout tube to allow injection of
cement-bentonite grout with sodium silicate admixture for accelerated set at
the point of excavation. The excavation in panel 15A reached a depth of 33 ft.
when a slurry loss of 5 inches per minute or 90 gallons per minute began.
Slurry in panel 15C remained stable since it was almost completely backfilled.
The contractor immediately began injecting premixed grout into the excavation
and reduced the loss to 3 inches per hour or 57 gallons per minute, but it
rapidly increased back to 5 inches per minute. The hydrofraise was then pulled
up 3 ft. while continuing to inject grout. After injecting a total of 23 cubic
yards of grout and using 6 barrels of sodium silicate, the slurry loss was
stabilized. The contractor was required to establish 24 hour watch on the
slurry levels in open excavations.
The contractor returned to re-excavate panel 15C on May 23, 1989 and was
prepared to grout under step four of the slurry loss procedures. The
excavation went beyond the previous slurry loss depth of 28 feet. The 6 cy of
premixed grout was then wasted. When the hydrofraise reached a depth of 74 ft.
on May 24, 1989f a major slurry loss occurred in panel 15C. There was
approximately 420 cy of slurry lost. The hydrofraise was removed and the
VIII-5

trench was backfilled with sand. During the excavation, the contractor
encountered problems with thickened slurry. This was probably due to intrusion
of cement treated slurry from adjacent panels. At this point the contractor
cited a changed condition.
Re-excavation of panel 15A and 15C began again on May 30, 1989. Minor
controllable slurry losses occurred, but problems were experienced with grout
thickened slurry gumming up the pumps and cutter heads. All three bites of
panel 15 were excavated without further incident. The panel was concreted on
June 7, 1989.
Late in May 1989 meetings were held with the contrtctor and internally with
Seattle District and North Pacific Division to develop a plan of action and
reduce the slurry losses. An investigative drilling and grouting program was
initiated on June 7, 1989 under a contract modification. The program involved
drilling 8 inch diameter rotary drill holes using a Schramm T685H truck mounted
drill. The holes would be drilled using the same bentonite slurry used in the
cutoff wall excavation. The slurry level in the hole was to be measured every
30 ft. in depth for five minutes. Premixed grout was to be injected under
gravity feed through the drill string in the event of a slurry loss. Sodium
silicate would be added as a stiffening agent if the losses continued in the
hole. The holes were drilled in advance of the hydrofraise to pretreat
potential slurry loss zones. Between June 7, 1989 and July 17, 1989, twenty-
two locations were drilled, but no correlation could be made between sLurry
VIII-6

losses or the lack of them in the drill holes and the occurrence of slurry
losses in the same areas later with the hydrofraise. In the 5,053 linear feet
of drill holes, a total of 292 cy of grout was used in seven of the holes. See
table VIII-l.
On June 15, 1989 a slurry loss occurred in panel 13C at a depth of 93.5 ft.
while the hydrofraise was being withdrawn from the trench. The trench was
backfilled with sand under step three of the slurry loss procedures. Except
for a controllable loss on June 20, 1989 the panel was re-excavated without
further incident between June 19, 1989 and June 22, 1989.
It should be pointed out that borehole camera investigations in concrete
core holes in panel 15 and 17 between July 12 and 13, 1989 revealed water
draining out from a pinhole stream in panel 17. The possibility that a
subsurface flow from Lower Cascade Creek running along the bedrock/Mud Mountain
Complex was considered. Later a concrete coring in panel 9 revealed washed
aggregates at the contract between the bottom of the panel and bedrock. This
was considered possible evidence of such a subsurface flow washing out the
green concrete at the bedrock contact. This was also considered as a possible
cause of the slurry loss in panel 13 and the source of water for the slurry
that eventually showed in a spring on tbe upstream left canyon wall.
A major slurry loss occurred during the early morning hours of June 17,
1989 in panel 35 at a depth of 115 feet. Vertical cracks were noted in the
VIII-7

trench by observers. The cracking appeared to be longitudinal with the axis of
the dam. The entire panel lost slurry and there was great concern with
collapse of the trench sidewalls. Approximately 30 sacks of bagged cement
were dropped into the trench before backfilling the trench with sand. The leak
was stopped when the trench had been backfilled to 75 feet. The contractor
estimated that 1,050 cy of slurry was lost.
Another large lose occurred in panel 43A during the night shift on June 22,
1989 at a depth of 88 feet. About 800 cy of slurry was lost. The losses
apparently occurred over a span of time eventually depleting the storage
capacity of the desanding unit tanks (220 cy). Additional supply from the
storage ponds in the staging areas was tapped while the hydrofraise was pulled
out and backfilling operations began. The drop in the slurry level measured by
Government personnel ranged between 2 and 10 inches per minute.
The Project Operations personnel noted a spring of dirty water exiting from
the left canyon wall approximately 1,200 ft. upstream of the cutoff wall axis
on June 28, 1989. The water was sampled and sent to the North Pacific Division
Laboratory in Troutdale, Oregon for analysis. The water was found to contain
bentonite. The source of the bentonite was certainly from the slurry losses
encountered to that point, but which particular one or ones could not be
determined. It was postulated that the slurry was being lost upstream into the
rock shell of the dam, but was unable to escape due to silt buildup over the
toe of the dam. When the total slurry lost into the rock shell over-topped the
VIII-8

silt level the slurry was able to escape and show up in the creek. The spring
was most definitely exiting the rock and this fissure may have been connected
to a dammed up reservoir of slurry in the upstream rock shell. Another
possibility was that the slurry was attributable to losses in panel 13C two
weeks earlier. The time difference could be attributable to travel time
through fissures in the rock. Supporting this was the concrete coring in panel
9 indicating a washed zone of concrete at the base of the panel. The
possibility that underground flow from Lower Cascade Creek along the bedrock
contact with the Mud Mountain Complex had washed the paste from the green
concrete at the base of the wall could also have intercepted panel 13 and be
interconnected with the dirty spring observed upstream of the dam.
During the early morning hours of June 29t 1989, a very significant slurry
loss occurred in panel 39C at a depth of 127 feet. Within minutes cracking was
noted at each end of the panel along the edge of the downstream guidewall on
top of the dam. The cracks continued to propagate across the top of the dam
from panel 39 to panel 17 over 250 feet. The loss rate was not great (between
6 and 10 inches per minute) but continuous and difficult to stop. The slurry
loss consumed 1,500 cy of slurry and required 65 bags of cement and 150 cy of
sand and gravel backfill before coming und&.r control.
On the afternoon of Saturday, July 8, 1989 during re-excavation of panel
35, a slurry loss occurred at a depth of 106 feet. Even after dumping 34 sacks
of cement and lowering the hydrofraise into the trench to mix the cement with
VIII-9

cuttings the slurry was being lost at a rate of 12 inches per minute (230
gallons per minute). Preparations were made to implement step four with 10
bat,;hes of grout 1.2 cy each with i barrel of sodium silicate accelerator. The
down the trench grouting was done using the hydrofraise. There was 150 cy of
slurry lost in the panel. The contractor's quality control engineer saw the
end wall of the trench excavation crack open about 1/8 inch. The contractor
placed fluorescein dye into the slurry to trace the loss.
On July 13, 1989 the contractor attempted one of the deeper panels near the
right canyon wall, panel 25. The panel ws excavated to a depth of 90 ft.
before slurry was lost at a rate of 32 inches per minute (613 gallons per
minute). The hydrofraise was pulled out and backfilling began with 90 bags of
cement followed by 66 cy of sand and gravel. Fluorescein dye was also placed
in the trench. A vertical crack on the south side of the panel was observed
by Corps and contractor personnel. The contractor estimated 470 cy of slurry
was lost. The next day the contractor was instructed not to leave panels open
to core the foundation bedrock as required by contract. The concrete core
holes would be extended selectively into bedrock to obtain cores and water
pressure test data.
A meeting was held on July 18, 1989 with geotechnical experts from Office
of the Chief of Engineers (OCE), North Pacific Division and the Seattle
District to assess the dam safety issues and develop a plan of action. It was
agreed that the cracking caused by the slurry losses did not endanger the dam
VIII-10

and the consequences of any internal damage would be mitigated by completion of
the cutoff wall. Another attempt in panel 25 or 31 was advisable to determine
if the cutoff wall could be constructed of single bite panels with acceptable
losses of slurry and in production. Single bite panels would reduce the zone
of influence exerted by the hydrostatic pressure of the slurry in the trench
and reduce the time of open trench exposure. The time between panel excavation
and concrete placement could be reduced by two thirds compared to a three bite
panel.
The contractor was directed back into panel 25 and began re-excavation on
July 19y 1989. Another slurry loss occurred at 113.8 ft. and the panel was
backfilled with 105 cy of sand and gravel. The contractor estimated 700 cy of
slurry was lost. The maximum loss rate recorded was over 3 ft. per minute or
over 690 gallons per minute. The upper 30 ft. of the trench was exposed. The
contractor raised concerns with sub-vertical cracks daylighting into the work
platform allowing triangular slabs of the sidewall and work platform to fall
into the trench. The workmen became wary as well.
Earlier in the day a concrete placement on panel 37 was terminated after
176 cy had been placed out of 329 cy projected for the panel. The contractor
had placed 5 truckloads of very low slump concrete (between 4.5 and 6.5 inches)
then experienced problems resetting the tremie pipe. The pipe would not go
down after repeated attempts to reseat it. The pipe would stop abruptly with a
loud noise as if something solid was in the way. The excavation in panel 25
VIII-II
was only 35 ft. down at the time. Whether or not excavation in panel 25
influenced this incident is not known, but the contractor postulated that the
sidewall of the excavation in panel 37 fell in and dropped boulders into the
green concrete. The removal of all the concrete placement was started
immediately by clamshell, but no evidence of a cave-in was found, however, the
panel required 400 cy to complete (21 percent above neatline) indicating a
cave-in may have occurred. Clearly the stiff loads of concrete were not
responsible for the obstruction. Excavation of the hardened concrete by the
Iydrofraise indicated something very hard mixed in the concrete. It was
assumed that this confirmed a cave-in of boulders into the trench during the
concrete placement.
An attempt was made in panel 119 (originally numbered 19) on July 26, 1989
to see if completed placements of panel 15, 16, and 17 had healed problem
areas on the south canyon side. A slurry loss of about 7 inches per minute
occurred at 52 ft. consuming 310 cy of slurry and requiring 82 cy of sand and
gravel backfill. The upper 12 ft. of the trench was exposed. Thirty minutes
after the slurry loss, the Corps representative noticed cracking along the
upstream side of the guidewall between panel 119 and panel 143 on the other
side of the canyon.
Early the next morning on July 27, 1989 excavation began in panel 143. A
crack opened up on the surface of the dam along the downstream side of the
guidewall then on the upstream side minutes later. Over a 20 minute period the
VIII-12
cracks continued to propagate and open up a 1/4 inch. This began when the
excavation was down 61 ft. and continued down to 102 feet. At 111.5 ft. the
trench began to lose slurry at a rate of 17 1/2 inches per minute or 335
gallons per minute. The trench was backfilled %ith 200 cy of sand and gravel.
The cracking under this slurry loss was much wider than those experienced
during the slurry loss of June Z9, 1989 in panel 39 The guidewalls could be
seen separating away from concreted panel V--. 35 and 7, The guidewalls were
also measured separating apart about an inch near panel 43 . Total slurry lost
in this event was estimated at 1,170 cy.
The contractor and Corps became concerned with the rate of progress;
heightened by personnel, equipment, and project safety istues and the impending
winter flood season, and entered into a joint effort to develop an acceptable
solution to the slurry loss problem. Toward the end of June 1989 the
contractor was requested to provide a technical proposal, cost proposal, and
construction schedule for proceeding with cutoff wall construction in
conjunction with a grouting program. The proposal was received a month later
on July 20, 1989. A meeting was held with the contractor and geotechnical
representatives from OCE, NPD, and NPS to discuss the merits and the
contractor's proposal. The contractor's proposal was accepted with the
exception that the embedment of the panels into bedrock would remain at 15
feet. The contractor had proposed to reduce the embedment to 5 ft. to reduce
the excavation time, however, the possibility of not achieving adequate
embedment outweighed any potential benefits.
VIII-13

Another meeting was held to address potential safety concerns and prepare
questions for Dr. Ralph B. Peck, Geotechnical Consulting Engineer for the
Corps. A task force meeting was held on August 17, 1989 with Dr. Peck and
geotechnical representatives from OCE, NPD, and NPS. The only caveat to the
proposed plan of action was that multiple lines of grout may be necessary to
adtquately pretreat the core. A single line of grout holes on either side of
the cutoff wall alinement was considered possibly too narrow a band. It was
also recommended that the closure area for the wall be predetermined so that
the area of least risk to dam safety was completed last. Continuing work on
the cutoff wall was favored as long as practical.
The last slurry loss occurred during excavation of panel 144 on August 18,
1989 at a depth of 151 feet. The slurry loss was controllable with thickened
slurry and the addition of 9 bags of cement. About this time a crack began to
propagate over the surface of the dam from panel 144 over a distance of 175 ft.
along the guidewall. The crack opened to 1 3/4 inches over a two hour period.
Excavation continued, however, and the panel was successfully concreted on
August 24, 1989. This was the last panel completed before a temporary shutdown
to implement the recompression grouting plan. The hydrofraise work did not
restart until December 4, 1989.
VIII-14

INVESTIGATIVE DRILLING PROGRAM
LOCATIONDRILLEDPANEL # DATE DRILLED RUNNINGAND BITE DRILLED DEPTH (FT) REMARKS TOTAL
17-C 6/7/89 73 7317-A 6/8/89 138 21119-C 6/9/89 172 38319-A 6/10/89 158 54135 6/12/89 152 69337-A 6/13/89 146 83937-C 6/13/89 132 97133-C 6/14/89 166 1,13733-A 6/15/89 190 1,32731 (#2) 6/15/89 252 2 FT OFF RT SIDE OF 1,579
PANEL 3131 (#1) 6/16/89 360 2 FT OFF LT SIDE OF 1,939
PANEL 3129-C 6/19/89 385 2,32423-A 6/20/89 280 LOST SLURRY @ 247 FT 2,604
CAVING, PULLED RODSNOT GROUTED
23-B 6/22/89 303 AKA 23A-10 2,90721/22 6/21/89 110 TOOK 54.4 CY GROUT 3,017
LOCATED IN PANEL 22AKA 23A+10
25 * 6/22/89 200 TOOK 85 CY GROUT 3,21726 6/26/89 385 TOOK 60 CY GROUT 3,60228 * 6/29/89 200 TOOK 35.6 CY GROUT 3,80222 * 7/5/89 254 AKA 23A+8, NO TAKE 4,05625 * 7/8/89 335 TOOK 4.8 CY 4,39122 * 7/11/89 OPEN HOLE TOOK 20.6 CY GROUT 4,39128 * 7/12/89 360 TOOK 31.2 CY GROUT** 4,75124 7/17/89 302 5,053
291.6 CY GROUT TAKE IN 5,053 LF
• " Indicates these holes were re-drilled (reclaimed) in the exact same
location.
* This hole lost slurry 1-1/2 hours after a slurry loss occurred in panel25 during excavation with the Hydrofraise.
TABLE VIII-l

SECTION IX
IN-SITU CORE MODIFICATION
I.

SECTION IX - IN-SITU CORE MODIFICATION
A. Introduction. The large slurry loss problems encountered during the cutoff
wall construction became more and more unmanageable from the standpoint of
safety, constructability, schedule impact, and cost. The overriding safety
concerns were:
1. Trench sidewall instability and potential cave-in at the work platform
level endangering workers.
2. Continued propagation of cracks within the dam creating potential
seepage paths during the impending flood storage season.
3. Trench sidewall instability and potential entrapment of the excavating
machinery within the trench.
It was clear that slurry losses of this magnitude could not be addressed
on a routine basis with the pre-planned slurry loss measures alone. A joint
effort between the Corps of Engineers, Soletanche, Inc. and private consultants
for both parties to establish a plan of action resulted in agreement on a major
grouting program designed to pretreat the soil in the core.
B. Recompaction Grouting Procedures. The grouting plan consisted of two
parts. The first part consisted of grouting under gravity feed to seal
IX-1

existing cracks and fill existing voids. The second part consisted of presiure
grouting selected zones within the core to prestress or recompact the core and
prevent the occurrence of hydraulic fracture due to slurry pressure in the
cutoff wall trench. The grout would be injected under pressure through sleeve
pipes into the embankment core and would fill up existing cracks, create new
hydraulic fractures and stress the soil surrounding the fractures and cracks;
thereby compacting and increasing the soil stresses. The cracks and fractures
would become filled with an impermeable grout.
Hydraulic fracturing of the core material is controlled by limiting the
grouting pressure and quantities of grout placed during each grouting sequence.
Repetition of this operation creates plane surfaces which intersect in multiple
directions. This structure provides cohesion and resistance to further
fracturing. Quantities of grout, flow rate, pressures, and number of
repetitions of the grouting sequences are monitored closely to carefully
control the grouting process. The gravity grouting was done by drilling 5 inch
diameter holes on a 5-foot center to center spacing along the centerline of the
cutoff wall alinement. The holes were rotary drilled with a Schramm T-685H and
a Ingersoll Rand TH-60 truck mounted drills using a bentonite-cement drilling
fluid/grout mix. The components per cubic yard were 460 pounds of cement, 55
pounds of bentonite and 180 gallons of water (about a 5 to 1 mix and 11 percent
bentonite). When drill fluid losses occurred, sodium silicate was added into
the bentonite-cement mixer to achieve a gel time ranging from 30 minutes to an
hour. Sodium silicate reacts with the calcium in cement to produce a gelling
TX-2

action. The mix without sodium silicate would provide an unconfined
compressive strength on the order of 15 psi at 28 days. A high velocity mixer
and PH15 grout pump were used in this operation. The PH15 is a high pressure,
high capacity grout piston pump. It has an electrically driven 15 HP motor and
can deliver a maximum of 45 gallons per minute at a maximum pressure of 1500
psi.
A total of 43 gravity grout holes were drilled taking 533 cubic yards of
bentonite-cement grout and 808 gallons of sodium silicate. A detailed
tabulation of hole depths and grout lost is provided on Table IX-l. The
work was started on 8 August 1989 at hole No. 400 (approximate station 15+78.7)
and completed on 30 August 1989 with the redrilling of hole locations 416 and
423.
The pressure grouting was accomplished through multiple sleeved port grout
pipes placed in drilled holes and encased within a weak bentonite-cement
mixture. The grout pipe consisted of 2" steel or plastic pipe with lateral
perforations 3/16" diameter located every 2 feet. Each perforation was covered
with a 4-foot long elastic sleeve to act as a non-return valve. Steel pipes
were placed in the upper 150 ft., plastic pipes were placed in the lower part
of the grout hole. This solution was aimed at avoiding interference of steel
pipe with the future excavation of the Hydrofraise. This was a compromise
solution since the recompaction grouting involved high pressures and potential
soil displacement which plastic pipes are less capable to withstand. However,
the
IX-3

relatively good density of soil in the lower part of the dam (except locally)
reduced the grouting requirements and permitted satisfactory use of the plastic
grout pipes.
Sleeve grout pipes were manufactured in France for the secondary holes, but
due to the early start of the first phase, it was necessary to improvise the
construction of the primary grout pipe on the site. After tests, a sleeve made
wich shrink plastic tubing and electrical tape was selected and proved to be as
effective as the regular grout pipe.
The pipes were installed along two Lines on either side and parallel to the
cutoff wall alinement. One line was installed 5 ft. upstream of the wall and
the other 7 ft. downstream of the wall. The assymetry in the distance was due
to the fact that the cutoff wall alinement was parallel to and 10 ft. upstream
of the dam centerline. These holes were categorized further as primary grout
holes spaced 12 ft. apart on center and secondary grout holes drilled between
the primary grout hole locations. Therefore, in total, the grout pipes were
installed on 6 ft. centers. The primary grout locations are all even numbered
from 100 to 132 on the upstream line and from 200 to 232 on the downstream
line. The secondary grout locations were all odd numbered from 101 to 131 on
the upstream line and from 201 to 231 on the downstream line. The primary
pipes were installed between August 31p 1989 and September 27, 1989. The
secondaries were installed between October 16, 1989 and November 3, 1989.
IX-4

The same rotary drills used for the gravity grouting phase were used to
install the sleeve pipes. The holes were drilled with bentonite slurry to rock
level with a tricone bit approximately 5 1/2" diameter. After withdrawing the
drill string a 4" steel casing was lowered into the hole down to the rock
contact. The grout pipe was placed into the hole under the protection of the
casing. The grout pipe was then filled with water and plugged. Prior to
withdrawing the casing, a bentonite-cement sealing mix was pumped in the
annulus between the pipe and casing which displaced the bentonite slurry out of
the annulus between the casing and soil. The sealing mix was pumped in as the
casing was withdrawn.
The upstream row of the grout pipe installation holes and some of the
gravity grout holes were drilled with the Schramm T-685H drill equipped with a
drill parameter recorder marketed by Soletanche, Inc. as the Enpasol. This
recorder was used to provide a qualitative density profile across the dam and
identify probable high grout take zones.
In the fifties, the oil drilling industry attempted to correlate drilling
parameters such as rate of drilling and the torque of the drilling rig with the
characteristics of the drilled formation. Empirical formulas have been
established by authors such as Teale, Somerton, etc..
The Enpasol recordings rely on the same basic principle. The Enpasol is a
"black box" monitoring up to 8 drilling parameters. Every 5mm of derthp the
IX-5

digitalized data are recorded on tape. Raw parameters are printed on paper.
Computer processing of the parameters provides a clear picture of the
stratigraphy of the drilled formations. On grouting projects, the Enpasol
recordings display the stratigraphy of a formation at the very location where
grout penetrates into soil. The following parameters were recorded:
- rate of drilling
- thrust on the drilling bit
- counterthrust
- torque
- pressure of the drilling fluid
The unit can also be outfitted to read rotation speed, reflected vibration and
drill advance rate fully utilizing six pressure gauges, a speedometer (with
cable and pulley), high pressure hose, electronic cable, and Compaq computer
system. The systematic Enpasol recording of the upstream row of grout holes
provided a quick, relative sense of the Mud Mountain Dam core density priorto
initiating the recompression grouting program.
The raw data recorded by the Enpasol were interpreted by computer programs
adjusted by Mr. Duchemin of Soletanche, Inc. to print out profiles of the
drilled hole. The primary parameters used were torque, thrust and rate of
drilling. The formulas used in the computer interpretation are given on figure
IX-l. A typical profile is shown on figure IX-2. The darkest and broad
IX-6

zones indicate low density areas. This profiling indicated that the upper
zones (between 150 and 200 ft. deep) of the dam anu areas close to the canyon
walls (especially the left wall) were not as resistant to the drill (see figure
IX-3. The worst zone was believed to be the deepest part of the left canyon
wall. The Enpasol recorder was used on 10,103 LF of the drilling which
represented approximately 31 percent of the total length of drilling for this
grouting work.
The contractor utilized this information to establish a upstage grouting
plan with injection volumes and maximum injection pressures preset for each
2-foot stage of the sleeve pipe. Generally the grout pumps were set to shut
off when pressure exceeded 60 bar (880 psi). As refusals began to occur in the
primary holes before the planned volume of grout had been injected, the maximum
pressure was scaled back to 20 bar (300 psi) to limit the grout travel. The
secondary holes were injected with a thicker grout to a maximum pressure of 60
bar. Generally 200 litres per 2 ft. stage was planned in the upper 3/4 of the
hole and 400 litres per 2 ft. stage in the lowest 1/4 of the hole. The range
of volumes selected were from 150 to 200 litres per stage in the upper reaches
and 200 to 1000 litres per stage in the lower reaches.
Two basic stable grout mixes designed by the contractor were used. The
primary holes were injected with a thinner grout to fill any existing voids and
cracks. The grout mix consisted of 470 pounds of cement, 83 pounds of
bentonite and 178 gallons of water per cubic yard (about a 4.75 to 1 mix with
IX-7

17 percent bentonite). The secondary holes were grouted using a mix of 940
pounds of cement, 100 pounds of bentonite and 167 gallons of water per cubic
yard (about a 2.25 to 1 mix with 10 percent bentonite).
A limited amount of sodium silicate was used in both the primary and
secondary grout mixes. Typically 3 to 8 gallons per cubic yard of grout were
added to provide rigidity and setting times on the order of 30 minutes to 1
hour. In the upper 150 ft. of the dam short set times were not sufficient to
prevent the extrusion of grout at the surface. To prevent such leakage,
silicate and grout were pumped simultaneously down the hole through a specially
made manifold. This mix achieved a flash setting time of 2 minutes.
On the average, grout was injected at a rate of 4 gallons per minute in the
primary holes and at 2 gallons per minute in the secondary holes. The rate was
reduced for the secondary holes due to the thicker grout mix used and the
faster pressure rise noted as the grouting program progressed. The intent of
the program was not to achieve maximum penetration or permeation, but to induce
maximum stressing and compression of the soil bounding the future cutoff wall
excavation.
The grout station was a containerized unit shipped from France with 4
double (total of 8 pumps) high pressure pumps (PH 2x5) which could deliver a
maximum of 8 gallons per minute and inject grout at a maximum pressure of 1200
psi. The pumps are powered by a 5 KVA electric motor. Each pump was hooked up
IX-8

to a Kent flow and pressure meter with circular graph recorder and digital
display. The pumps could be preset for injection of specific grout quantities
and/or a maximum pressure build-up. Gradual build-up of pressure on the grapn
recorder gave indication that the soil was being properly stressed. A flat
pressure indizated voids, cracks or soft soil zones.
Behind the containerized pump and recorder station were two 3 cy capacity
grout mixers and an adjacent 50 ton cement silo. One grout mixer was a high
velocity type for cement bentonite grout. The other was a low velocity mixer
for sodium silicate treated grouts.
Large mobile spools held 400 ft. of high pressure grout hose and a high
pressure water line for inflation of the double packer at the end. The spool
was 4 ft. in diameter with manual pumps for packer inflation and pressure
gauges for both packer and grout pressure. The spool was called a "Joseph"
after Mr. Joseph Dietsch who designed the unit and also managed the site set-up
on this and other Hydrofraise cutoff wall contracts. A schematic diagram of
the grouting setup is shown on figure IX-4.
The sleeve pipes and double packer system allowed grouting to be done
in several passes at various stages Crom the same pipe. Proper water jet washing of the
pipe after each application allowed the same stage to be grouted more than
once. Up to five passes were made at the same stage in some pipes. This
allowed a gradual build up of resistance and stressing of the soil. The intent
IX-9

was to recompact the zone of soil 12 ft. upstream and downstream of the cutoff
wall or about 52p135 cy of the dam core.
C. Recompaction Grouting Results. A detailed listing of grout injection
plans, deviations from the plan and total grout and silicate injected in each
primary and secondary hole is given in tables IX-2 to IX-14. Above and
beyond the 533 cubic yards of grout and 808 gallons of sodium silicate placed
during the gravity grouting phase, the recompaction grouting program injected
another 4,550 cy of grout and 17,785 gallons of sodium sili~ate. Prior to both
these programs an experimental investigative drilling and grouting program
completed between June 7 and July 17, 1989, injected 292 cubic yards of grout
under gravity feed. Therefore, in total, about 5,375 cy of grout were injected
to treat 52,135 cy of the core or about 10 percent by volume. According to the
contractor's experience, a range of 3 to 10 percent by volume of treated soil
was expected. Mud Mountain Dam therefore took grout on the high side of this
expected range. A summary of grout quantities is given in table IX-15.
The grouting program was completed on December 1, 1989 and cutoff wall
excavation resumed on December 4, 1989. Cutoff wall excavation continued on
through April 10, 1990 and was completed without any further slurry losses.
The recompaction grouting program can only be deemed a complete success.
D. Reactivated Dam Settlement. Settlement on top of the dam had been
monitored while the Pydrofraise excavation was ongoing and prior to the
IX-10
groutirig program. During this time the guidewalls on each side of the cutoff
wall began to settle about 1" over a broad downward curve across the deep
section of the dam. This could be attributed strictly to structural settlement
of the 4 foot deep 18 inch thick concrete guide wall segments. Later during a
two week period while recompaction grouting of the core, the settlement
accelerated and dropped the downstream guidewall another 4 inches. The ground
surface on top of the dam immediately adjacent to the downstream guidewall also
dropped at a relatively abrupt boundary. A maximum settlement of about 1/2-
foot occurred between August 30, 1989 and December 14, 1989. The upstream
guidewall settled only half as much. The peak settlement occurred at about
stacion 15+00. This was almost directly over the vertical drop and step on the
bottom left canyon wall where the Enpasol recording and grout takes indicated
voids or soft soil conditions.
In addition to these vertical settlements along the two guidewalls, the
horizontal as well as vertical movements of survey monuments along each edge of
the top of dam were measured. These monuments indicated that the outside
shoulders of the top of dam were moving outward (see table IX-16). The
upstream line moved out further upstream and the downstream line moved out
further downstream. The vertical measurements indicated that the upstream line
lifted up about 1 inch at station 14+50, while settling about 1.4 inches at
station 16+00 and 13+50. The downstream line had a similar shaped curve but no
actual uplift. The survey data is included in the appendix to this report.
IX-ll

The various movements that occurred during the recompaction grouting
program could be explained by deep and near surface settlement mechanisms and
surface heave caused 1: the grouting. The settlement of the guidewalls was not
expected and not consistent with surrounding ground surface movements on top of
the dam. Since the guidewalls were in between the two pressure grout lines,
the maximum heaving effect was expected to occur along the guidewall/cutoff
wall alinement. Heave did occur upstream and downstream of the upstream and
downstream pressure grout lines, howeverp the guidewalls and immediately
adjacent soil continued to settle as a downdropping block about 10 ft. in width
and encompassing the guid;wal1 /cutoff wall alinement. Heaving on top of the
dam was a readily observable condition (see figures IX-5,6,7, and 8) while the
outward movement of the shoulder monuments on top of the dam were detected by
surveys.
The accelerated 1/2-foot settlement of the downdropping block over a two
week period of grouting can be explained in the following manner:
I. The heave induced at the top of the dam produced a radial pressure
front pushing the shoulders out and the center up. In the process, tensile
stresses had to be induced to accommodate such a heave geometry which in turn
created sub-vertical longitudinal cracks. Two of these cracks defined the
outside boundaries of the downdropping block.
2. The block failed to heave because of near surface softening of the core
IX-12

material to a somewhat semi-viscous state due to the injection under gravity
feed of weak cement-bentonite grout along the cutoff wall allneent prior to
the recompression grouting and the relatively slow setting time of the near
surface recompaction grout.
The near surface grouting was difficult due to rapid escape of grout to the
surface through sub-vertical cracking. It was not until later that sodium
silicate and grout were injected simultaneously down a specially made twin
manifold to cause a flash set-up in the grout.
In conjunction with the near surface settlement mechanism and heaving,
there is also a deep surface settlement mechanism to explain continued long
term settlement of the top of dam and downdropped block. Surveys of the dam
slopes indicate accelerated settlement (2 inches in 3 months) of these surfaces
when compared to historical data (12 i.nches in 35 years, 1950 to 1985). This
was evidence that deep core areas had begun to settle again as the injection of
grout at depth destroyed soil structures (arches, etc. and may have displaced
or allowed slurry trapped within the core from previously experienced hydro-
fracture to escape). This was viewed as a positive sign that densification
effecta were being produced.
In addition to normal considerations of arching across narrow steep canyons
and transverse arching against relatively stiff rock shells, a great deal of
evidence points to a site specific problem with the bottom left canyon wall.
IX-13

Piezometer readings gave indication during high pools that a major open zone
existed in the canyon walls and especially on the left side. The Enpasol data
indicated loose soil or voids along the left canyon wall. Loss of fines from
the core material occurred near the base of the dam and notably near the left
canyon wall due to piping, flushing during reservoir drawdown, open rock
joints, and/or chemical action of subsurface water on dental concrete. The
peak settlement along the guidewall occurred almost directly over the left
canyon wall and the grout takes were high in this area. Because of these
corroborating facts, a low pressure zone may have allowed settlement of the
soil column above and established arching similar to a trap door analogy under
a silo of soil. The arching established before cutoff construction was then
destroyed by the cutoff wall excavations and grout injections contributing to
the overall and on-going settlement.
These settlement and heave mechanisms were discussed along with overall
integrity considerations in three memorandums which are enclosed in the
appendix to this report. Of particular concern for those involved in the long
term monitoring of the cutoff wall are two things which should be kept in mind.
First, flushing action on the upstream core material during drawdown will be an
on-going concern not mitigated by the cutoff wall construction. Continued loss
of support on the upstream face of the wall may make the downstream soil
pressures more a loading concern than hydrostatic reservoir water pressures.
Bending upstream down low in the wall combined with downdrag on the wall due to
settlement may cause eventual cracking of the cutoff wall. The inclinometer
IX-14

readings should give advance notice of such a condition occurring. Second,
piping action due to seepage through rock joints may not have been fully
eliminated. The pre-cutoff piezometric data had indicated a major open zone
along the left canyon wall and presumed to be primarily a core failure
phenomena. It may be a sink in the rock wall which may exist and continue to
present a long term seepage problem. Failure is certainly not imminent and
future piezometric readings during pool rise and fall should define the
magnitude of any problem. A limited bedrock grouting program would probably be
the quickest solution should a problem be discovered.
IX-15

1111 13 "153 123
1ot 123 173 125 333 3r3110 176 178 127 350 375107 128 243 243110 250 268 131 189 189111 211 271 223 33$ 313113 297 297 225 376 37611$ 31S 315 229 179 204117 356 356 231 a183 183118 332 $84 TOTALS 3829 462211 885 1 85
TOTALS 2649 276
The ENPASOL has recorded the foflowing data:
PC Drilling depth (ft) P4 Speed rate of drilling (ftrh)P1 Drilling fluid pressure (PSI) PS Retention pressure (psi)P2 Torque(PSIQ PS Time (0.014ft of drilling)P3 Feed pressure(PSi)
:":",..Combined parameers:
A. Actual THRUST on drillbit (hips) (P1I -PS1S2)/000
t er.: S"1 -section of feed hyd.jack =7.07siS2 = section of retention lack. M =5
(P2 -2*PC)/l0
T- Relative corrected TORQUE (with P0) (PSi) =
R Rig EFFECT n sqrt(A) ' T t30
Relative LOOSENESS of the soil - ( P4 I (R+0.01) )2 -0.5
rein.: this formula has been used to glustrate on the graphthe contrast between the different kinds of soils,
General remark: All the parameters (outputs) have been smoothed to 0.5 ft
FIGURE IX-I

ELISE'S 0 L L'T flNCHE
MUD MOUNTAIH 989/11/6
OH 225
, PRE33UME LOS S0?h-up SPEED TIIPqat
psi Pi t Yxor"100 fth s looseness
10 200 1 2
-- -o-- . .------ ...... ---- .... -- - -
R. 2 -20 20
R 4 "- - ---- ' L--- -- : '
R.. -
o, "-70 -70
: -- ---- -- ,---
90 -- -- - --- ---- --- - - - - - --9
-90-
R 10 -1
-10 120 -20
___ ..I.. . *: . * - : : . . .
-1.----------.----------- ---- ----------- .-- .- ----------.. .... --- -- .. . - -.. - -- .. -- -, - -".-..- ".. .. .. "-...--
-- 150 _4 " ........ - -- - -----P 1 I: a
J 13 a I _ ..
~10 - 14
---------------
21. ; * : : * : a .
-. 0 - . ....... -. -- - ---20 -.--..--.- . .
.- -----._ ..--. ..... --.- -R -9230 _3
.24 - - ---- --- 0
250---- - -- -- -0--- - ------- -
_260
- --- --- -- - -- -- - --- -- -R I~ 222220:~
------: -------- .-- .- ---.- ---. .---. .... .. ...-.. ..,...... .." -3
R P25 a --310 a a 310
27 330 -1 30 -
, .. !I
14-3403 w" -o - I-G URE ---- X---
FIGURE IX-2
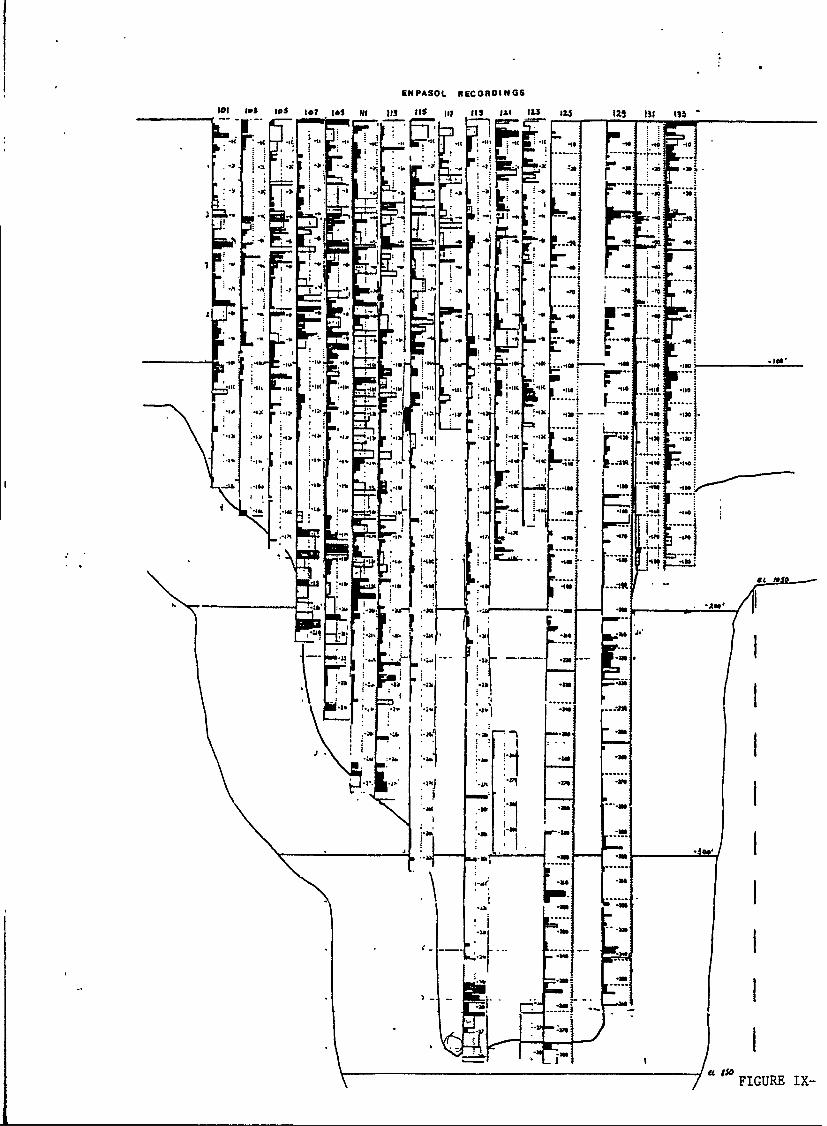
EMPASOL RECOR09NGS
101 I&l $as to? .56 13 i s Its III #i ILI ILS US59i I II 1 31 3
-3* - So -30a
o 1 .1 lea,
W.3.114 4111.113 333 !.3U .~~~~~~Ic .S~ l ot*3( ~ 3k 33C ~ 3**3 .3 u
.31 3 -23,.4 3
.11 It
-MA.3 .4m-a
-Joe
S.lb
- '~--::.K11411
FIGURE IX-

U.S. ARMY CORPS OF ENGINEERS OFFICE SYMBOL:
PROJECT: COMPUTED BY: DATE:
! I % #f" SHT. OF
SUBJECT: 4 'a j 7CHECKED BY: PART
-' .....I
IzI
Ike
-~ ki ld
,--
, '41
NPD FORM 7 (REVISED) JUNE 86 10 GRID
FIGURE IX-4
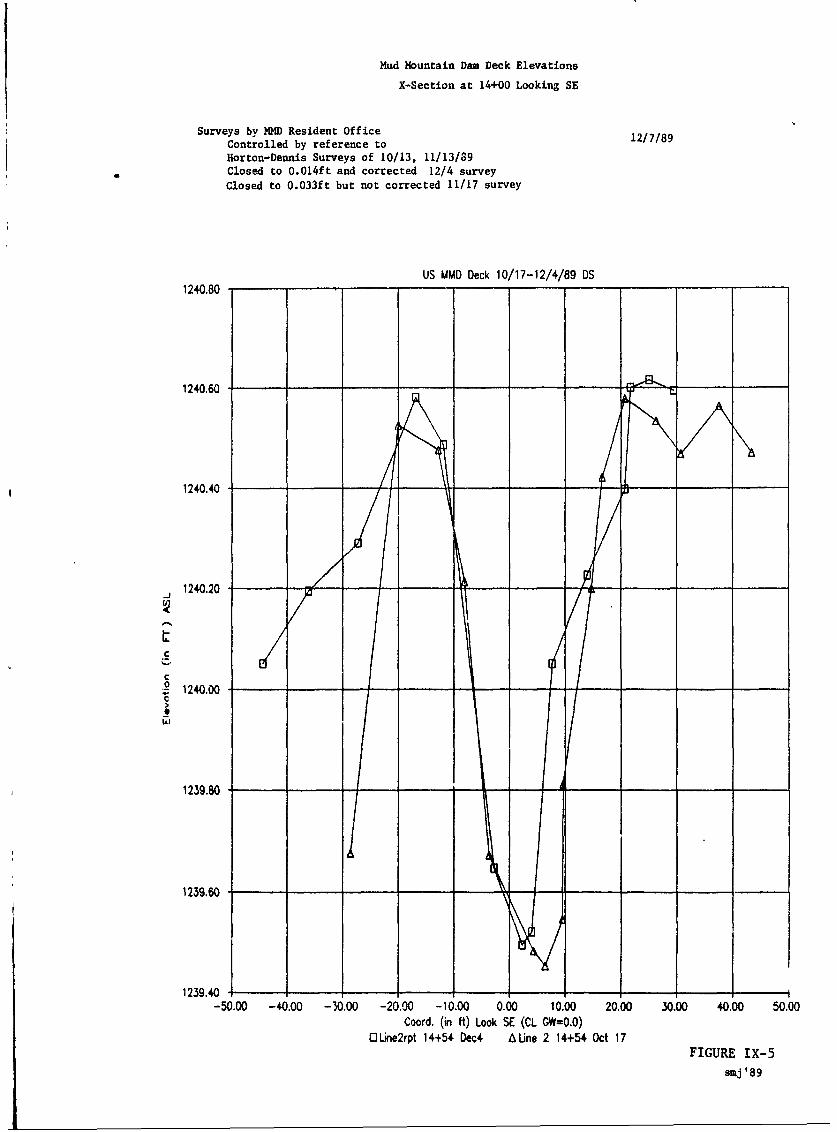
Mud Mountain Dam Deck Elevations
X-Section at 14+00 Looking SE
Surveys by MMD Resident Office 12/7/89Controlled by reference to
Horton-Dennis Surveys of 10/13, 11/13/89Closed to 0.014ft and corrected 12/4 surveyClosed to 0.033ft but not corrected 11/17 survey
US MMD Deck 10/17-12/4/89 DS1240.80
1240.60 '" _ __
1240.40 _
1240.20
C
0. 1240.000
SIw|
1239.80
1239.60
1239.40-50.00 -40.00 -30.00 -20.00 -10.00 0.00 10.00 20.00 30.00 40.00 50.00
Coord. (in ft) Look SE (CL GW=O.0)
o ine2rpt 14+54 Dec4 A, Line 2 14+54 Oct 17FIGURE IX-5
smj '89

Mud Mountain Dam Deck Elevations
X-Sections at 14+00 and 14+54
Looking SE
Surveys by MMD Resident Office 12/7/89Controlled by reference toHorton-Dennis Surveys of 10/13, 11/13/89Closed to .033 ft and .017 ft., respectively10/17 uncorrected, 12/4' corrected
US MMD Deck 10/17-12/4/89 OS1241.00
1240.50
1240.00
1239.50
1239.00
t1238.50c
01238.00
1237.50
1237.00 ______
1236.50
1236.00 ______
-60.00 -40.00 -20.00 0.00 20.00 40.00 60.00Coord. (in ft) Look SE (CL GW=0.0)
OMne2rpt 14+54 Dec 4 A Line2 14+54 Oct 17 OUne4rpt 14+00 Dec 4 X Line4 14+00 Oct 17
FIGURE IX-6
smj '89

Mud Mountain Dan Deck Elevations
X-Section at 14+54 Looking SE
Surveys by MMD Resident Office 12/7/89Controlled by reference to
Horton-Dennis Surveys of 10/13, 11/13/89Closed to .033 and .017 ft., respectively10/17 uncorrected and 12/4 corrected
US MMD Deck 10/17-12/4/89 0S1240.80
1240.60
w
1239.801239.60
1239.40
-50.00 -40.00 -30.00 -20.00 -10.00 0.00 10.00 20.00 30.00 40.00 50.00Coord. (in ft) Look SE (CL GW=0.0)
OLine4rpt 14+00 Dec 4 X Une4 14+00 Oct 17FIGURE IX-7
si '89

Mud Mountain Dam Deck Elevations
X-Sections from 14+00 to 15+20 Looking SE
Surveys by MMD Resident OfficeControlled by reference to Nov. ,1989Horton-Dennis Survey of 10/13/89 ~Closed to 0.033ft avg. bustUncorrected data lines 2,3,4Corrected data for line I
US MMD Deck X-Sec 10/17/89 OS1241.00
1240.50
1240.00
1239.50
1239.00
t1238.50
C
0
S1238.00
1237.50
1237.00_ _ _ _
1236.00-60.00 -40.00 -20.00 0.00 20.00 40.00 60.00
Coord. (in ft) Look SE (CL GW=0.0)M~ine 1 15+00 A Line2 14+54 0 Line 3 15+20 X Line4 14+00 FIGURE IX-8
SKJ '8 9
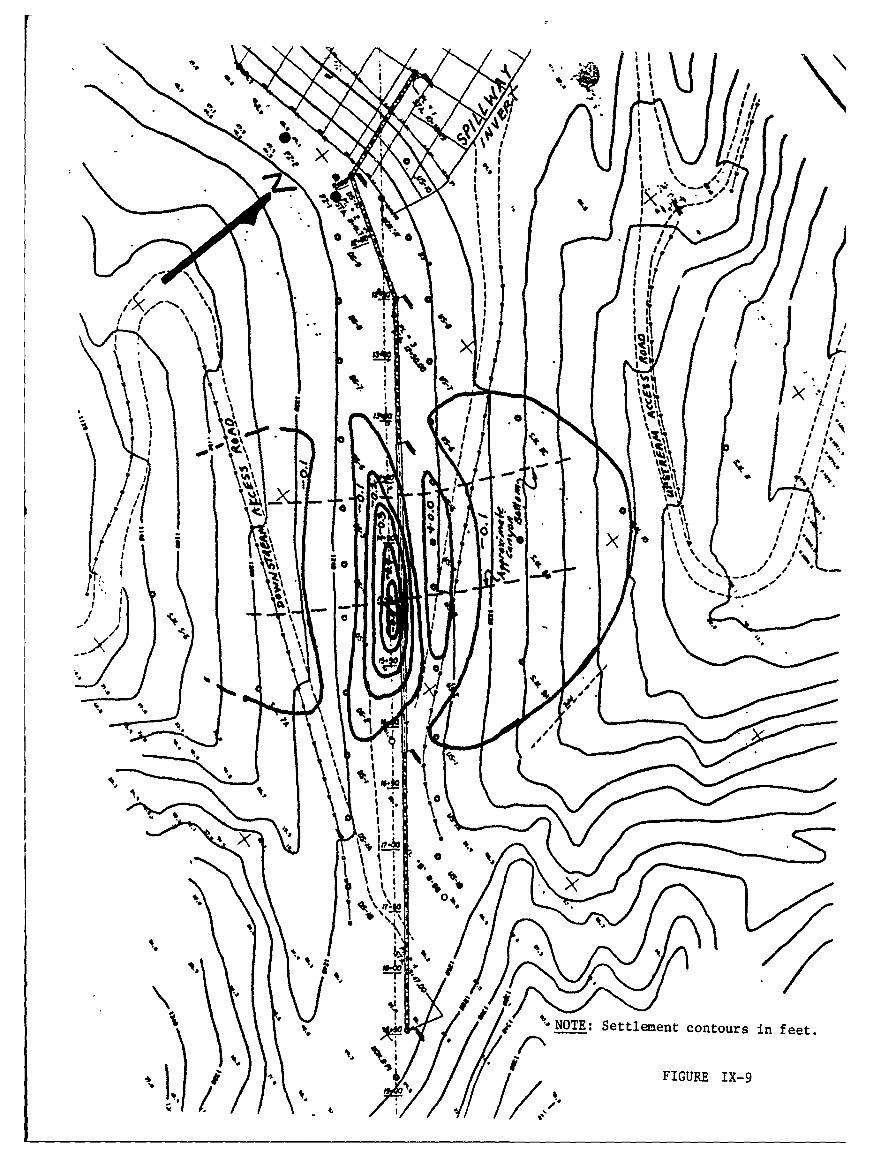
%t I
I NA
IF I
let~
oji
j .dNOTE: Settlement contours in feet.
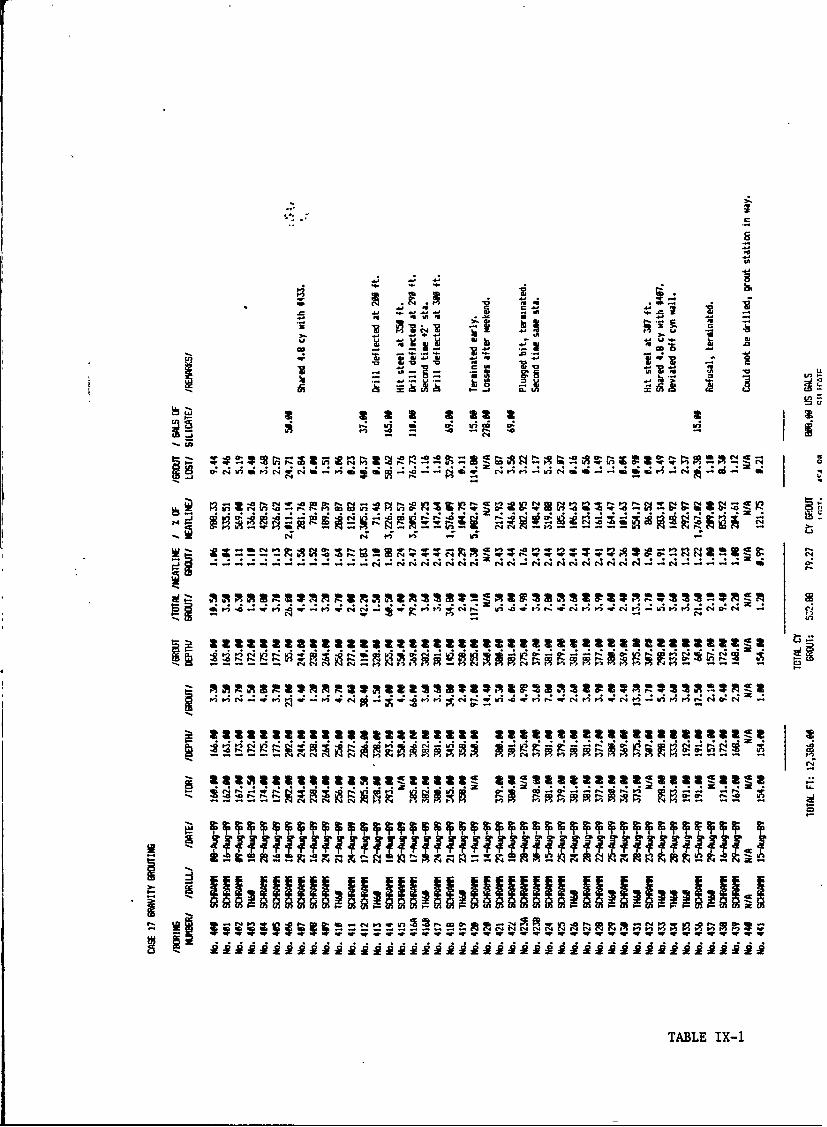
z
Ln-U -V cuW 1
r- .3. u;
6i a ~ 444 6i4 4 X *.~ -S
a a a atm a a
cn .. . . a c
91 F4
(44 V;~~
('4 I 4 ;; 4,Z -Z 4 2z4 c;,1;2
-d tq't P) F4 19t.RR
4 4 r AF4 ., I, I" -' -- - - - -
- - zt;tC1
C,
TABLE IX-

w
i
.2 CI Co g cm g c 0
C4 EDcI to
* 0 -W .W :A0.CE. V WCEm~.~
1- c co cm. D bA r.0 's - Cy.i
0) C-. AEI.Gcr or4 In .-- . c .1 ? 9 _ . . . . .
A, (-4EC4C-f A0.G00 -- E r 4Q .0 w ~ M. AD r-. 4 LA
-Cn C4 r- U'3' I- -)0Si.r- ). .0 1--co CD. r- ~ C- CJ r
W! . ! In- -
F, 111 " f
ZI V; C4 cV 4. V..9.V V4 0. V.. V.Y V.V I V.:0 A
-. .- I -iU ---
LIn
IL Lf -
Li~
IL 9
19
E C4 .. E)-.
0. -.. SAA S --
Cd~~~~~~ F4 ,~ e,0 0) 4m -0 CA 1
A~ in LL.An
14. C-. CIA All t) r4U f 1 -C. 0 V
C4CA 011p. 0I 'i p 1, 1,C-i iCA
C4 CIA - . CC--I-A-)~ -
TAL.I-

wm
M,~~~~ ~ ~ M~ 4C A 1C4C
IS. C0m ' 0. An 0' 00 .0 0 .rl a. m CA
' ( J W C .0 !R 1- cOf .14 m, m, 1 - a MI co
r 0-n C , .0 a 3.
-~ ~ ~ 1 cn-.E (J0 0.- ,. O..I- ~ c .0 C4W2- 21 20 0
I -
*I t'J '0 U .
i& - N 15(:3C:!
r4 ~~~ r44 C9 '4t A
-~w ggR M --- C-- CE Ap, -
. .. I1. q~~ F
R a. CON r-4 V&) :"e
-, C., - .- e . accn -~u
219 -C-C4.Nl - ('4 1412 2 ~IU, 'C-4
03( _
TAL I-

La
Om I('L"
P.) .4 C4
-oLF 03 (. .- CO- W) r'4 -O Ifr.) -'r Q C6 6. ui in.
U) PfE'( r4 ( ( .0 -e - CO m5~ C '4
-r K'2 C 4(E .0 rgf
q. 4( p;C -tq3~~0 .t~ I .9~ .' .0 .0i
in.j q L, a: m r~ m 4CU, 0V IW wrU -O P's. A
-. .= 0 *
M~ ~ ~ ~ M a.t-Mw- m a 4 .4
-W .. O IN6wN Jj 0 a.- - -.- .. b N F l
R - a d IN (Np~ - m ; y t
C I
- C'7
~ ~I4b
lid wd .-
(Li r4 C1
~6 CI (0 6 r4 CO N.6 C-40Cd6
us- -r w- -W w -- - I-
r.. III-) V):
C.C DC 31 3 c 3 C
C, C:thc'. ?I'. C14~4 E i
4. Po 0, 9; 9;wo 8
us'0 (2. -, 0. T 0'-
MDo~ tin m~~~~4 J 0, U '~~~~t-. S...- S . - '.- -
a;~ ~~~ 0,0 0 , ,!!. T -003c
igS Q ll. -c 5 S
VA 4 N 4 r C 4 (4 m R
TABLE IX-4

lu
C2LUL.
-j o- c.v C.)C , 0
ea m-. m r I -
1w,- i - - 1, u r
* orC* . . . .4
V4 L-.3P
tn t0..0o 0f 0 not), ..
L..'
tu -j L- -. 1. .
C- , C I nI .C 'I C.. r-, # l
-I r
* ~ C#.
0V
m s r4C - .m
U-2~
C.4 A -*-.4 Cu V
Eu C
e~t~4I'2
Z ~ ~ ~ ~ ~ TAL 0000 000000 O5
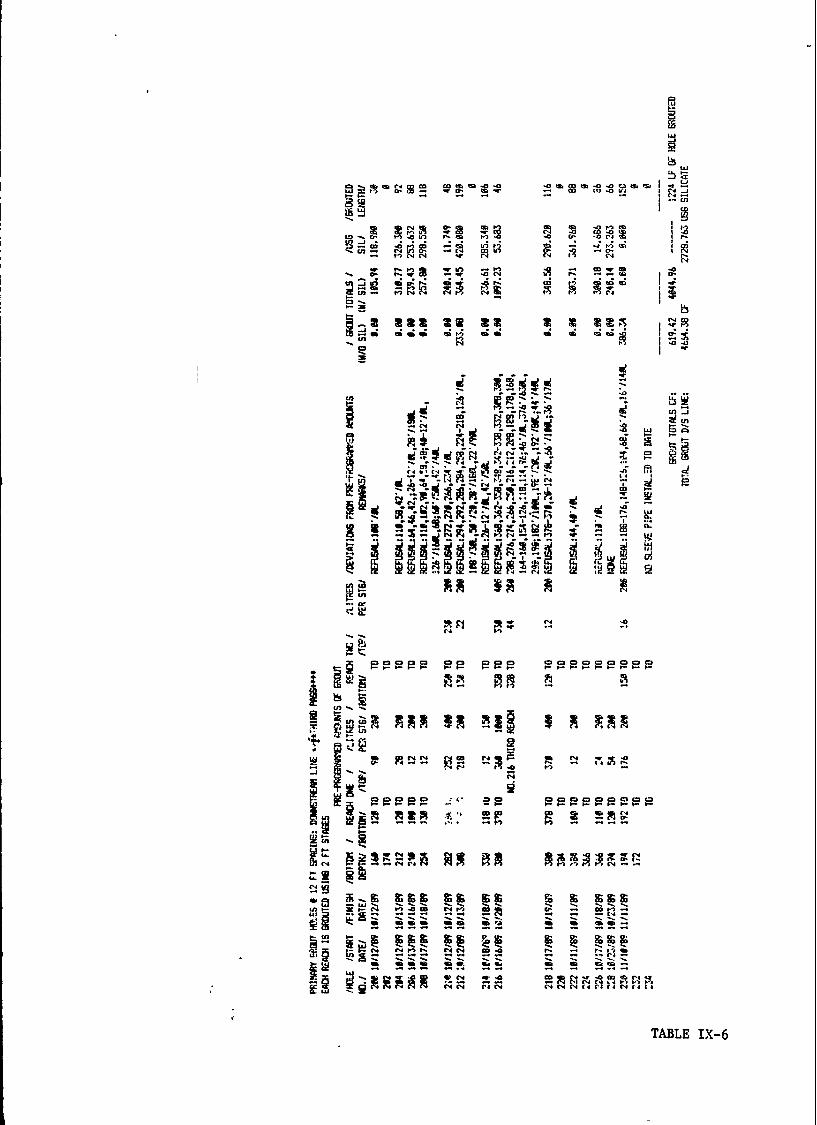
1,4
In
Lo .0 w) If-o ~
(o4 F4 w 4C4 4r
I.-n
ft th4t M abo
-d I'd
419 -a
A ARM I
_j..
e - c3 R l-
z: ::: -Tc
('RA N 4 ;2 e c 1 r
C4i 4 -9
TAL IX-
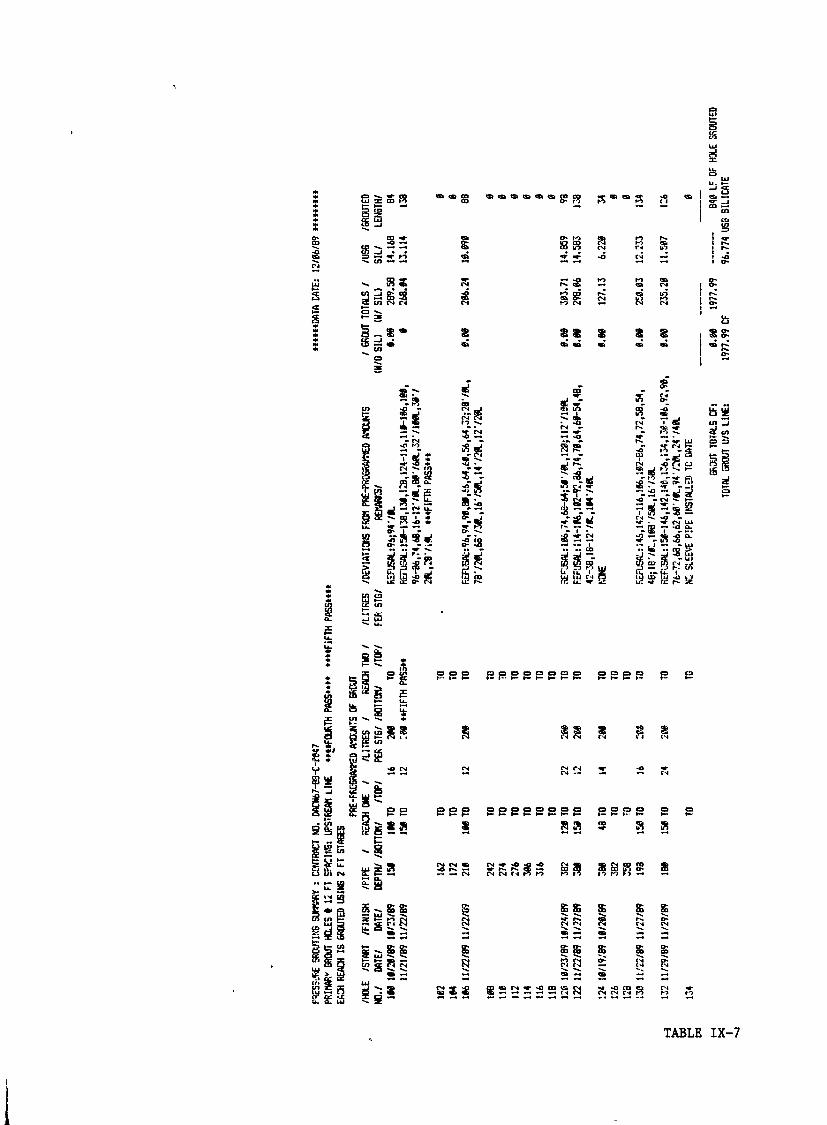
La. -
m a)t2 U
a- fl) p'
P4 -44 .. C4 .0cN
L i -. L9x t2
F- C3~
mL -j- -
~~~< In~- ~Nr4
-. -~ I)
-(.4 - -3
~~N C4 I -
r4 - C4 .
pe- 2e9 C3* P. .C -pCp R
Lcn
U) ~o C4 4 C
4ma FO .. r
cn-S-.C
Ii 4RogN('4(S 5 -0 5
- -~ - - - -4 -.- - - -
TABE X-

tAJ
L"
-C
('I F .-
-WM o-.n m e
Uo -I
C, 0
tn -.
F-I-
-cu r- 03~19 C4-
tnU -tz L
e5 S
R U , , C2 ppC* p C~ C, 3
U. C'-'
CAl
ucl
,n~
00 00 0 000 r
in. I4 C4-~-I 4~ - -
IP
. 'i C494 c 4r 4 N1 4P
Ifl~~~ABL I rI r-

0.~t~ W S ~ .
S(4- .0 Am -0 .0 £9 -~-~ M .0. w1 -a,(. 1
('4 a-C-.- -J *4 0 *. 0 - .0*) (*j -
ell CI -
'
I- M0mR.
co W- An4,~ 0. .0 t' 0 C-4 r u0~ A ..
An ('430 P4. A.-I. 3
AM it
:z4 - ;;-4 ;94 ('J
Wi AN£4 cIr4 ~~I..U. CA 4,4b 04. 4. . . , S
.... 00A1 I.... C'4 11 ~ '4J ~ . Al .'44,.0 4~ k4~Ali. 14~5 .1 1 1 La 11.1
A44~' A '~ A 4 A A c -CI 71 A
CD C) Am~ CD~. 0434 p~ - 2 C3 L3 (4 ('D.0A-3 0m
I. t -- 0 .
31J -r .. r
I'l co 3 C4a, 0,Fl Am c A,, 1
r'(4 Y, & g
U33 2 pC R '.-I42-. . An C= ca5. '( 3 (1 3
C .- -. -. --. C
PTABLEE A",

.0 -0 u m .LAJ W co M, a .0 .0 0 C- w -
cc D- *. o c -o-a - - - V4C
0. Lam
A - !2 A PA
ul -9 r o c
w :o
-r iIQ 1 : 0
C'JN 0 NW D N
% 5i -N ad.
CD .8 NF4.
- ~ ~ ~Ar4- ~
7 W- K
Za IN! .. I w t~~'- ~ -:. P 7 ' 1- ~-
ca mCU4 : n 2 i W
A(4(. Nc MN !l! co ~ d' W, u ('1 N !1 1
46£
n -o
~a
r4 NR c.3~PI 1 i i
w t-,
t2 -a.
TABLE IX-10
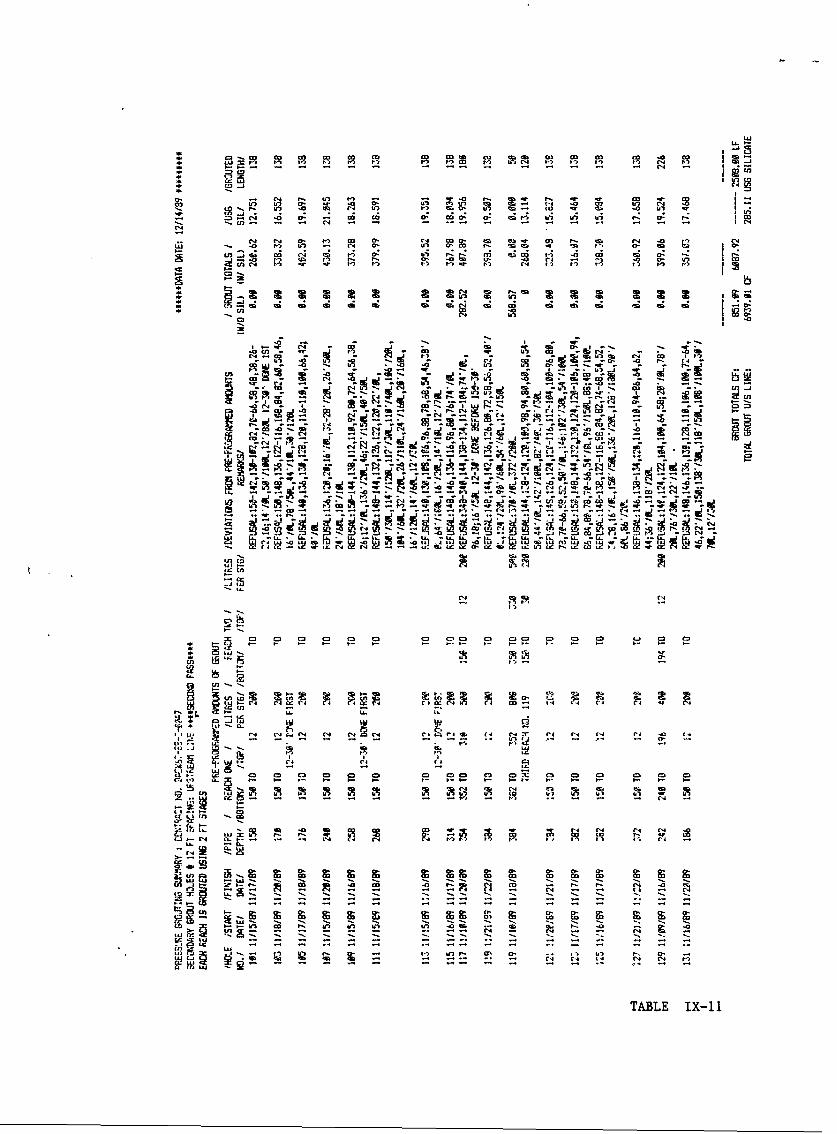
U. I
(a LIc o 0 c nw . M C o m* ~ -. CD D C CD D C CD ~ CD CDC 02 DrC
(' m I I S - . 4.0. -C4 ' AI. *
Mn c". c1' .0 u' 1- r4If CD C - (4. (4
U,..' is, co CD (. I' ') rD- mI iz -Es t' co mo 0-10.. .0C4. ' CIn-(1 0 0. - D C "m W20 r. C' I I' t n t) f'. '
is I J " ( . 4 -~ W; -m m~ r4 .-m - -m i m 44('.4
U ') a -
4. ~~~ w c,;,C~n CD3
- -In
M Z C4. CD') Ko
CD 2. 'c V4.. 0 - a
r4)~'. c .7 02 0U
8'.. f...('4 -. : - ill*..iC --n T. iE (4W --O Lq- i R C4
F1 IWO1.MA C1 c Lr. CD -1('4 ..1 (0 -~;i w min
(4N c -in (
m a r 3 4.-3 C C D CD L = C
('i n '
U2)
n~ It.
U, C)"I 'm m p 1
I (0u u uU"
R4~)* -P. MI, r
0 0 0CZ co0 0 0 0o0
in U2 C2 :2 !t F4 CD CD 02CD C
0' 0 ' 0 ' 0'0 - 0 ' 0
Lc
TABLE IX-11

II. -
c= eg C~ c co -a r4 tm en
w I p 1 2
-ow a- Il. i-a a- 1.- rI - M- r4 r
IlF4l - "c4. tD~- c-4W M4piV
0' 0
t-4,Remr" 4 R z-r :-
c3--i
q .4
s: :- r
La -
c4 C
000 E
c~l :'i-' IM (.4 -0 I-4 .0 P 4 r
Sz c3MP 3 e -C~ R c1.1 is
8.-C~~~~~l -. I14' 1% ~ -> ~ -
in
-c-- -(B R m.
E-
r4 l C4l~1 C4 I
TABLE IX-12

co t4 (.3o* ~ 0S'~~03 in
.0 I-I - I
C; r4 * r- U.Iq mN-03I
U -jO l') -. '-.-
:z. tLt. p.- ccl w0 03 b 0
IN4 INr r.CI v - r0 -4
'.
MM Oa -'
CDID
C2
_ -C. -J ~4C.)
I- 0
-i t
U9C3 0M C C3Lac j
C4I
A "A XnA A
IN 0
r. - 4 C F P 0 r
r. 1*1C-C1
0 0 0 0 0 0 00 0 0IL
C3t ,c zC 3pf . DC opc o Q 3C
-vs MD. I
.C'4ffi
.00
V4-I C-
-l IN1 Is !2 5- L2 ~ t; T-- ,
TABLE IX-13

I .~%.~ADCDC !9. CD. D C in
*3 I4wCD ~ ~ ~ , co mD. ?%DD D u)-I2.0 .. f
W _.j W) w q-a p.) = -I.-. rt-' 4co ;. ncor.-- in )I.~~~-e~~dq C4. -r -. f-C (.~ *~ I-
lid 9:!
(U: ej -J-
m r0
12 ie P, N. -!;~- . D :z -- t .-- I ~
- 4 . M R4
p D CD p I p p pJ p
MD CIC tD p m .0 CN0-4 .9 C
.Efi 9 oC CO - E.4 D f)9
A. !V-4 am AA-,4P
-r I " - -
-j
'~In A r NP;4 t ar
r-
0-o00000-----w0
tn0 A2 r20 9; 1(1 9
A 04 w, m
4. ?l0 r- .C4 cq r4 C1 rl C'9
TABE i19

Summary of 6rout Quantities Placed: DACW7-88-C-0047 Summary Date: 24 Jan 90Case 17 Gravity GroutingCase 19 Recompression Grouting
CY BentoniteCF W/O Sil CF W/ Sil 6als Sil (083.33/CY)
Case 17, Gravity Grout C/L 532.880 0.000 808.000 H/A
Case 19, Primary Install U/S 3,626.100 0.00 39.000 148.780DIS 6,073.650 0.000 321.500 181.760
Case 19, Secondary Install U/S 1,493.100 0.00 0.000 25.200D/S 1,922.400 0.000 0.000 35.400
First Primary Pass U/S 479.220 14,363.220 867.371 N/AD/S 586.220 15,609.100 989.560 N/A
Second Primary Pass U/S 2,9040.840 10,617.000 2,356.841 N/AD/S 2,310.650 11,719.910 2,402.755 N/A
Third Primary Pass U/S 511.700 3,803.760 2,614.660 N/AD/S 619.420 4,044.960 2,728.763 N/A
Fourth/Fifth Primary Pass U/S 0.000 1,977.990 96.774 N/AD/S 135.260 1,487.450 308.115 N/A
First Secondary Pass U/S 9,834.450 6,935.800 3,550.8-0 N/ADiS 8,961.120 6,861.640 598.260 N/A
Second Secondary Pass U/S 851.090 6,087.920 285.110 N/AD/S 0.000 6,333.720 293.640 N/A
Third/Fourth Secondary Pass U/S 0.000 2,785.620 126.700 N/AD/S 0.000 4,631.870 213.630 N/A
39,978.100 97,259.960 18,592.529 391.140CF WI Sil CF W/ Sil 6als Sil CY Dentonite
OR1480.67 3602.22 32,593.696
CY W/o Sil CY /Sil IBS Bentonite
Case 17 and Case 19 TOTAL CY GROUT: 5082.89
Case 12 Investigative Drilling and Grouting
TOTAL CY 6ROUT: 291.60
TOTAL ALL CASES 5374.49 CY
TABLE IX-15

LATERAL MOVEMENT OFOUTSIDE SHOULDERS ON TOP OF DAM(WORK PLATFORM ELEVATION 1240)
DATA DATE: 15 DEC 89
UPSTREAM STATION OUTWARD DOWNSTREAM STATION OUTWARDMONUMENT MOVEMENT MONUMENT MOVEMENT
AWAY FROM AWAY FROMCENTERLINE CENTERLINEOF DAM (+) OF DAM (+)
US-10 11+36 -0.2 "DS-10 11+50 NR
US-09 12+00 0.0 " DS-09 12+00 NRUS-08 12+50 0.2 " DS-08 12+50 -0.5 "US-07 13+00 1.4 " DS-07 13+00 0.0 "
US-06' 13+50 4.2 "DS-06 13+65 4.1 "
US-05 14+00 10.1 "
DS-05 14+20 NRUS-04 14+50 12.6 "
DS-04 14+66 9.7 "US-03 14+85 13.0 "
DS-03 15+10 10.1 "US-02 15+50 10.2 "
DS-02 15+70 7.1 "US-01 16+07 3.6 "
DS-01 16+20 0.4 "US-01A 16+57 -0.2
DS-01A 16+72 -0.5 "US-01B 17+05 0.0 "
DS-O1B 17+27 1.1 "
NR = NO RECORD
TI
TABLE IX-16
SECTION X
DAM MONITORING

SECTION X - DAM MONITORING
A. Purpose. A variety of instrumentation was needed to establish baseline
control and provide ongoing monitoring related to groundwater levels and
embankment movements. The need for this information was especiallty critical
for this project because large scale modifications were being made to an
operating dam.
B. Piezometers. Fourteen piezometers on the top of the dam were affected by
construction activities (P-40, 44, 45, 50, 51, 56 and P-60 through 67). They
were installed in the mid-1980's as part of the investigative phase for this
contract. Most of these were modified when the dam was lowered from EI.1250 to
E1.1240 during the construction phase. Eleven additional piezometers were
installed under this contract; Seven in the dam core (P-10 through 107) and
four in the narrow overburden spur between the canyon and the spillway (P-108
through 111). All new piezometers were 1 1/4-inch I.D., Schedule 80 P.V.C.
pipe. Each 6-inch hole had 3-stages except P-1ll, and were numbered "i" (deep)
through "3" (shallow). They were installed using a Schramm T-685H truck-
mounted, air rotary drill using a 7-7/8inch tricone bit and the biodegradable
drilling fluid, "Clearmud". The 4 piezometers in the spillway were drilled
first, followed by the core piezometers.
X-I

Th. contractor had an extremely difficult time driving casing in the
spillway spur and this problem continued with installation in the dam's core,
As a result, the requirement to use temporary 6-inch casing to install the
piezometers was waived. While the original conditLon )f the core would have
likly -aniatpi its use, the recompression of the d'ii c,.re zase zari
installation difficult and extracti.on in one piece all but t v'.hl-. X1.
pie-%at h -1 -illed in the core remained ,,:i -zad %eca flushed through the
drill rods until return fluid cleared. The rods were pulled and fhe PVC tubes
installed, backfilled and sealed to their target depths without problems.
701 f! rt-en of the existing piezometers were cut when the top of the dam was
lowered, only nine were raised back up to the new top of dI,- (U1. 1257).
During the construction activities, five of them were rendered unsalvageable
(P-44, 45, 50, 56 and 60).
The new piezo:aeters "'- ,, , , - . .y 1 ;! 'r instill 4 i F-.r a
period of ab',vt 6 to 8 weeks before the depths were sounded again. At that
point, 5 to 30 ft. of sediment were found in the bottons of 'nost tubes with one
(P-105-2) having 122 feet. With the exception of P-102-3, all piezometers were
cleaned out with high pressure air varying from 1200 psi in the solid sections,
to 500 psi in the 20 foot slotted ends. This operation was successful in
removing smaller amounts of sand and silt in most of the tubes. P-103, P-105,
and P-107 had denser plugs of cohesive and noncohesive fines (including
particulate grout) in several of their tubes. This required several passes
with the flushing equipment. Generally, the holes that were flushed twice
showed the reformation of 3 to 5 ft. of sediment between operations (a day
X-2

apart). Readings obtained after cleaning suggest at least two inter-tube seals
were ruptured by excessive pressures (P-105 and P-107).
It has been postulated that the sediment influx is a result of the new
piezometers' placement in the recompresslon grouting zone. In this scenario
water, bentonite and bentonite/grout mixtures present in the core prior to
grouting were trapped and subjected to high compressive forces. Piezometers
drilled in this zone then acted as relief drains, dissipating high pore
pressures in the immediate area of the holes and in the process, moving
sediments into the piezometer tubes. This high pore pressure is also reflected
in the abnormally high core piezometric levels, which tends to "mask" pool-
induced pressures in the core. It may take a while to fully dissipate these
pressures, which were believed to have been further aggravated by raising the
dam an additional seventeen feet.
C. Inclinometers. Seven inclinometers were installed during this contract for
a total of 2,658 LF. Six are installed inside the concrete cutoff wall (Panels
123, 126, 130, 132, 137 and 139), while the remaining unit (Hole No. 199) is
located 15 ft. downstream of Panel 133 (Plate 5). The contract originally
provided for attachment of 5-inch steel pipes to the cutoff wall structural
steel guide members, full depth. Inclinometer casings would then have been
installed in the pipes after the panel concrete was placed. The structural
sLeel guide members were deleted by the VECP, so inclinometers ended up being
X-3

installed in several concrete quality control/exploratory holes cored in the
wall. The casing was pressure-grouted through one-way valves installed in the
bottom of the casing.
The inclinometer casing is 2.75 in O.D. (2.32 in I.D.), non-corrodible
plastic manufactured by SINCO of Seattle, WA. The casing is flush-coupled,
self aligning pipe with two sets of casing groove spirals, one perpendicular to
the other. One of the groove sets is aligned perpendicular to the cutoff wall
centerline.
D. Settlement Monuments. Nine of the original dam settlement monuments (9A,
9B, 9C, 10 and ii on upstream face; 2, 3, 4 and 7A on the downstream face)
were incorporated into the contract dam monitoring program. Readings on these
were taken in 1950 and then again in 1985, prior to construction. During this
period, maximum settlements occurred through the top central portion of the
upstream and downstream faces, dropping 1.3 ft. and .9 ft., respectively.
These existing monuments were supplemented with 12 monuments on each of the
upstream and downstream "shoulders" of the work platform at El. 1240, to
monitor dam movements during construction.
Under the contract QC plan, the contractor installed offset points in the
upstream and downstredm concrete guide walls every 100 ft. for horizontal and
vertical control of the cutoff wall panels. It was not until excavation of
panel 143 in late July 1989, that a broad subsidence was noted along the guide
X-4
walls through the central portion of the dam. The initial readings indicated a
maximum drop of .09 ft. in the deep section of the canyon. At that point
supplemental monuments were added every 50 ft. between Station 13+00 and 17+00
to obtain localized settlement data. Detailed information on this settlement
is presented in Section "IX".
E. Seismic Recorder. The two existing seismic recorders on the dam were
removed by the U.S.G.S. prior to construction activities. The concrete housing
for the recorder on the top of the dam was removed until the dam was raised aL
the end of the contract, then replaced, while the station at the downstream toe
of the dam remained in place, but inactive.
X-5

0 p
CV 00 0** CN4 '. rir
H l - Ln -1 V-4 N I14-4 -4 -4 E-44 -
C0 1fl -L0 n 0 fn 0' C4
r-4 A -4
r4 .- ,
00
N ~ ~ ~ O m- 0%C % 0 % ON 0% 0% (
*. $4 IJ 0 1.4 $414 1.4 a 1.404~ r. d 19 a a 0 . 0. 0. ad 04
0. 49 .ad co P4 (n~ N el L c I 0 0:
4-I C1 In r4 -4 4 I In0d -4 0% I I 0 N (n" 1- enI IA 0
C4 N 1 N * N r0'4 r4 4 1.4 N N '
-4 P-4 0 01.4 -4 -4 -4 -44) 1 1 1 I -4 N W % In
Pj 4 04 04 94 0 0 0 0) 0 0 04) *- *~ . ,4 .. 4,.-4 ,-4 - ,
ol en I~N v.4 04 04 04 04 04 04 04H I I 1 I4) N N NN
*1,4 P4 04 P4 0404
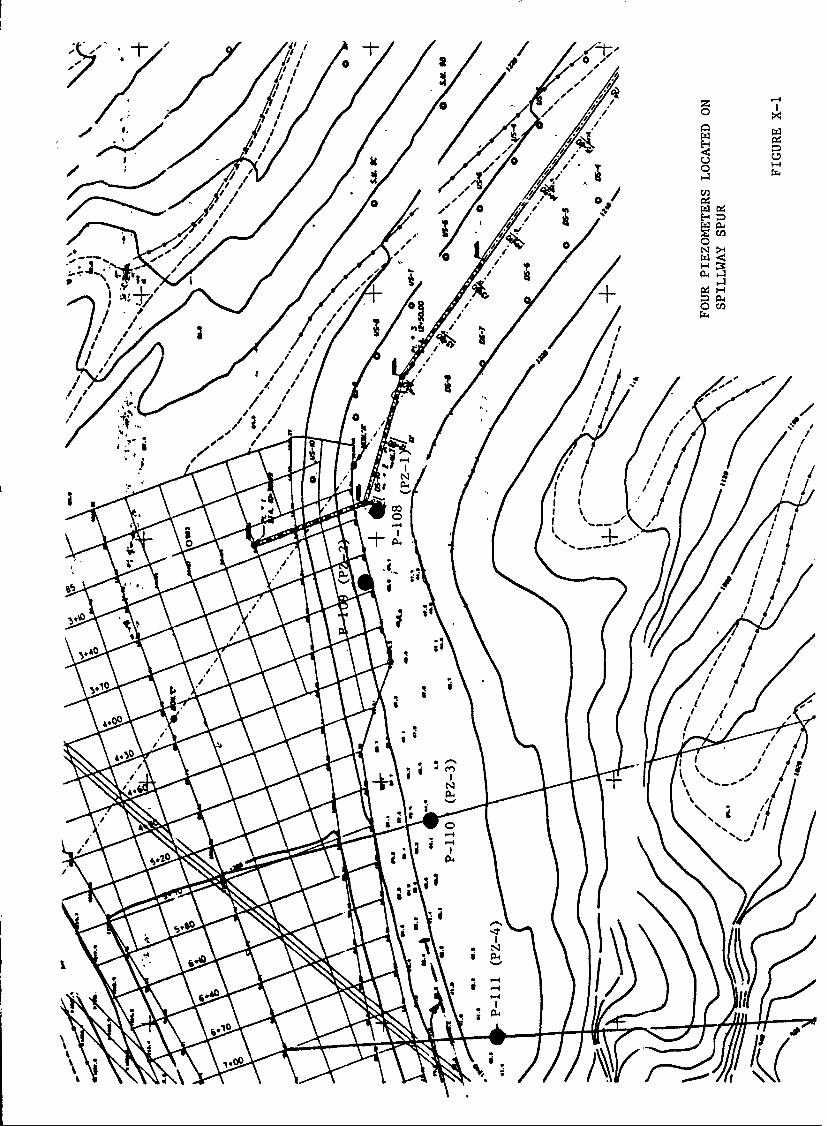
1 / /0
41O
/ // En
1*/
rz4
000
CL4~L
t.1 4P
14

SECTION XI
CONCRETE MATERIALS, BATCHING AND PLACING

SECTION XI - CONCRETE MATERIALS, BATCHING, AND PLACING
A. Aggregate Source
1. General. The aggregates for the cutoff wall and other incidental
concrete work were supplied by the Cadman Sand and Gravel Company, 26111 S.E.
Green Valley Road, Black Diamond, Washington; Washington State Pit No. A-455.
The company at the beginning of this contract was named the Flintstone Concrete
Company, Inc. The site is located approximately 1.5 miles south of the town
of Black Diamond on State Route 169. The 117.25-acre site is situated in
portions of the Northeast Quarter of the Northeast Quarter of Section 26,
and the Northwest Quarter of Section 25 .Township 21 North, Range 6 East, W.M.,
King County. The site extends from S.E. 352nd Street on the north to the Green
River on the south. The easterly boundary is State Highway 169.
2. Site Description and Material Distribution. The site is underlain by
glacial recessional outwash composed of well-sorted sand and pebble-cobble
gravel deposited in an outwash plain. Materials are coarser at the surface, then
become progressively finer with depth. A pervasive sand lens occurs in the upper
portion of the sequence on both the eastern and western site boundaries,
encircling the coarse granular materials. This sand is predominantly 100-mesh
material, with between 4 and 12 percent minus-200 mesh silt and clay particles.
Over the entire vertical sequence, there is good particle size distribution such
that this represents a good crushing site as well as a good cement concrete
XI-1

aggregate site.
3. Properties. The coarse aggregate is made up of 7% granite and other
medium grained igneous rocks; 18% fine grained porphyritic rocks; 29% meta-
volcanics, flows, and breccia; 45% tuff, tuffaceous sandstone and siltstone;
and 1% weathered, somewhat crumbly particles. Physically, the aggregate
particles are hard, dense, and structually sound with a general subangular to
subround particle shape and smooth surfaces. The aggregate particles are free
of coatings. There are some rock particles with chalcedony, a potentially
harmful form of quartz, and volcanic glass (although much of the glass is
devitrified).
The natural band is made up of 70% rock particles (igneous, volcanic,
metamorphics); 3% siliceous and chert; 21% quartz; 3% feldspar; and 2% miscel-
laneous "heavy" minerals. Less than 0.5% were soft and/or highly weathered.
4. Supplemental Source. The Corliss Redi-Mix Company, 29410 Enumclaw-
Chinook Pass Road (State Highway 410)t Enumclawp Washington; Washington State
Pit No. A-44 was the originally submitted site by the contractor for the aggre-
gate supply. The contractor reports that a lack of good quality control and
an anticipated short supply of the proper aggregates at this source necessitated
changing suppliers. The sand from the Corliss pit was used for the first month
(Jun 5, 89 to Jul 12, 89) in the tremie concrete mix and was incorporated into
the first 15 panels. This source was subjected to a petrographic examination in
XI-2

1984 and quality tests in January 1989.
The site is situated in portions of the Southwest Quarter of Section 20,
and the Northwest Quarter of Section 29, Township 20 North, Range 7 East, W.M.,
King County.
B. Aggregate Production
1. Aggregate Processing/Wash Plant. The pit run material was processed at
the Black Diamond site with the subcontractor wash/crush processing facility. It
was made up of two primary screening sections. The plant produced both crushed
and naturally rounded aggregates. The oversize material went to the crushing
segment of the plant and the desired aggregate was sorted via the arrangement
of three decks of three screens each and sloped at 15-degrees. A 7/8-inch
screen and two 3/4-inch screens constituted the first deck; a 3/8-inch screen
and two 1/4-inch screens make up the second deck; and the third deck consists of
8-inch by I-inch slots that run the length of the deck and parallel with the
aggregate flow. The sand screw and the Lin-A-Tex separator are used in the sand
production. A Kawasaki 95Z2 or 95Z3 front-end loader was used to excavate and
transport the material to the plant.
2. Coarse Aggregate Production. The concrete aggregates are produced on
the second deck of screens. These aggregates are then passed to a gravel washer
where the auger agitates the gravel and the water floats the undesirable products
XI-3
out. Pea gravel is scalped off on the third deck. Whatever passes all three
screens goes to the sand deck for the sand size production.
3. Fine Aggregate Production. From the sand deck, the material proceeds
through a chute to the sand screw where the silt and organics are washed out. The
sand is dewatered as it progresses up the screw. The final processing for the
sand occurs in the Lin-A-Tex separator. This separator recycles the wash water
and reclaims the larger sand particles by stirring the particles into suspension
and using a vacuum regulated to remove the excess deleterious fines. The
reclaimed sand is blended back into the already processed sand.
4. Grading and Quality Requirements. The coarse aggregates produced for
the tremie concrete had a nominal maximum size (MSA) of 3/4-inch and was natural
(rounded) with not more than 10 percent of the particles having fractured faces.
The limits for deleterious substances and physical property requirements
conformed to ASTM C33, Class 4S. The gradation envelope size number was a ASTM
C33, No. 67 (3/4 in. to No. 4) with the following weight percent passing amounts:
FIGURES/TABLES IN APPENDIX
Sieve Size % passingI-inch 1003/4-inch 90 - 1001/2-inch3/8-inch 20 - 55No. 4 0 - 10No. 8 0 - 5
XI-4

The nominal maximum size (MSA) for the structural concrete was 7/8-inch.
The limits for deleterious substances and physical property requirements
conformed to ASTM C33, Class 4S. The gradation envelope size number was a ASTM
C33, No. 57 (1-in. to No. 4) with the following weight percent passing amounts:
Sieve Size % passing1 1/2-inch 1001-inch 95 - 1003/4-inch1/2-inch 25 - 603/8-inchNo. 4 0 - 10No. 8 0 - 5
The gradation and quality requirements for all of the fine aggregate
produced conformed to ASTM C33. The following table lists the weight percent
passing amounts:
Sieve Size % passing3/8-inch 100No. 4 95 -100No. 8 80 -100No. 16 50 - 85No. 30 25 - 60No. 50 10 - 30No. 100 2 -10No. 200 0 - 5
5. Storage. The aggregates were stockpiled at the Black Diamond site until
needed for concrete placements at Mud Mountain Dam. The material was trucked 14
miles to the batch plant at the construction site. A variety of truck types were
XI-5
used to transport the aggregates. Generally, 24-25 tons were hauled by each truck
and trailer combination.
6. Amount Produced. The total amount of fine and coarse aggregate
produced for the tremie and other concrete placed under this contract was approx-
imately 32,210 tons.
7. Water Supply. Water for processing the aggregate was obtained from a
spring located on the Cadman property.
C. Cementitious Materials.
1. Portland Cement. The specifications allowed the use of an ASTM C150
low alkali Type II Portland cewrnt with a maximum amount of tricalcium aluminate
of 8 percent. The false set requirements were specified also. The Ideal Basic
Industries, Cement Division, Seattley Washington supplied all of the cement for
the concrete placed under this contract. The cement was trucked to the site in
increments of 60,000 to 70,000 pounds and transferred to either the 115-ton
cement silo or the 175-ton guppy.
2. Pozzolan Source. Pozzolan meeting the requirements of ASTM C618 Class
F, with the optional requirements of Table IA for magnesium oxide and Table 2A
was selected for use by the contractor. All of the pozzolan was supplied by
Pozzolanic Northwest, Mercer Island, Washington. It was delivered to the site
XI-6
in increments of 50,000 to 70,000 pounds and placed in the 100-ton fly ash silo.
Only the tremie concrete used pozzolan as a cement replacement. The mix
was designed with 30 percent of the total absolute volume of the cementitious
materials using pozzolan. Approximately 3,843 tons of cement and 1,133 tons of
pozzolan were used on this project.
D. Admixtures
1. Air-entraining Agent. The air-entraining admixture selected by the
contractor was MB-VR Standard produced by Master Builders, Inc., Cleveland, Ohio.
This aqueous vinsol resin solution has been neutralized with sodium hydroxide.
The ratio of sodium hydroxide to vinsol resin is 1:6 with a nominal 13 percent
by weight residue when dried at 105-degrees C. MB-VR Standard meets the require-
ments of ASTM C260 and CRD-C13-86.
2. Water-reducing Admixture. Master Builders, inc. supplied the water-
reducing admixture MBL-82. It meets the requirements for a Type A, water-reducing,
Type B, retarding, and Type D, water-reducing and retarding admixture as
specified by ASTM C494 and CRD-C87. This admixture was used in the incidental
concrete mixes such as the spillway replacement and cutoff wall extension.
3. High Range Water-reducing (Super-plasticiser) and Retarding Admixture.
The chosen admixture for use in the tremie concrete mix was Master Builders
XI-7

Rheobuild 561. This agent is a Type G, high range water-reducing and retarding
admixture and it complies with the requirements of ASTM C494 and CRD-C87.
4. Coloring Compounds. For verticality/continuity checks of the primary
panel concrete, a red or black dye will be used. The manufacturer of these dyes
is the Davis Colors Company, Los Angeles, California. The red color is Davis
Colors No. 1100, iron oxide red and the black is Davis Colors No. 8084, Supra
instant black, (carbon black). The amount used in the concrete is the ratio of
1 pound per 100 pounds of cementitious material.
E. Concrete
1. Batch Plant. The batch plant was erected on-site by the subcontractor
Cadman Sand and Gravel. It was a CON-E-CO Lo-Pro dry batch plant. Plant
fabrication started on March 28, 1989 and it was operational by May 1989. The
plant capacities are as follows:
THEORETICAL PRODUCTION CAPACITY - 120 to 150 cubic yards per hour
BATCHING CAPACITY - 10 cubic yards
STORAGE BIN CAPACITIES - Aggregate: 98 cubic yards heaped
(two compartments with eight gates)
Cement Silo: 1170 cubic yards (115 tons)Pozzolan Silo: 1425 cubic yards (100 tons)
Additional Storage Guppy: 1781 cy (175 tons)Admixture: AEA - 500 gallons
WRA/HRWRA - 2000 gallons
XI-8

The 30-inch wide loading conveyor could load the aggregate storage
hoppers at a rate of 630 tons per hour. The equally wide aggregate batch
conveyor could deliver the aggregates to the truck mixer at a pace of 600 tons
per hour.
Cement and flyash were weighed in the forward hopper with the cement
being weighed pritr to the flyash. The aggregates were weighed in the aft
hopper. The scales were of the suspension hopper type with dials. These dials
were fitted with potentiometers to provide electrical impulse for the computer
console. The weighing accuracy was checked monthly while the batching accuracy
was monitored weekly.
All of the batching operations were automatically controlled by the
computer console without interruption. This system "learned" with each sub-
sequent batch and was able to accurately control the batching sequences. The
concrete mixes were initially made according to the following order as the
transit mixer is rotating at mixing speed:
- Load approximately 85% of the water with the air-entraining
agent.
- Load approximately 50% of the aggregates.
- Loading the rest of the aggregates continuously with thecementitious materials.
- Loading the remainder of the water with the super plasticiser.
- Rotate at mixing speed for 70 revolutions.
XI-9

2. Winterization of Operations. Since the concreting operation went into
the winter months9 certain precautions were taken to winterize the batch plant
and materials:
- The coarse and fine aggregate stockpiles were placed on 10 inchsteel pipes that spanned the length of the stockpile and hadforced-air propane heaters installed to heat the aggregates.
- The aggregate bins were enclosed with plywood to retain heat.
- The admixture containers and dispensers were enclosed andequipped with heat tape.
- The aggregate bins were roofed to keep precipatation fromcollecting in them.
- The water tanks were heated with a propane burner.
- While the dam core protected most of the concrete, the topwas covered with an insulated blanket after the excessconcrete was removed.
3. Transit Mixers. The transit mixers used on-site for mixing and trans-
porting concrete were either Rex 470 types or Rex 770 types, (the one having
chain-driven drums and the other hydraulic-driven drums). The mixing
capacities were either 8 cy or 10 cy. An 8 cy maximum limit for each truck was
used due to the high slump of the concrete and the tendency to spill out of the
truck when ascending the ramp to the work platform. One truck was randomly
selected for the mixer uniformity test, initiallyp and every three months of
concrete placing. These trucks were also inspected for blade condition,
concrete accumulation on the blades and the charge and discharge chutes,
operable revolution counters, graduated water gauges, and that the water
discharge pipe points into the center of the drum.
XI-10

4. Tremie Operation. The tremie pipe diameter was 10-inches. All
connections in the pipe were watertight. Each tremie pipe was equipped with a
funnel-shaped hopper of approximately 1.1 cy capacity. The hopper had a screen
half way covering the opening to prevent the passing of lumps of concrete larger
than three inches in diameter. Tremie pipes were at a maximum of 15-feet apart.
One to two tremie pipes were used. A service crane was available for raising
and lowering the tremie pipe.
A portable work platform stradled the trench opening and rested on the
guide walls that were constructed prior to the Hydrofraise excavations. "Dog
ear" support plates that were hinged to open to pass the upward moving tremie
pipe held the tremie pipe sections at the coupling to allow pipe sections to be
added or removed. The tremie pipe when at the longest extension into the panel
trench (400+ ft) was held vertically with little, if any, lateral movement.
Steel shoulder plates were inserted in the guide wall to form the top few feet
of the panel because of the pre-trenching on either side of the panel trench.
Tha pipes were lowered to within one to two feet of the trench bottom.
A wood sphere or vermiculite "go-devil" was used in each tremie. Two to four
transit mixers were batched for the start of a placement. The first load of
concrete was delivered as quickly as possible to push the go-devil out of the
pipe and to create a seal around the tremie pipe by immersing it in the concrete.
XI-I1

Immersion of the pipe was maintained between 10-feet and 30-feet. Delivery was
such as to Produce the flattest concrete surface that can practically be achieved.
Concrete placement continued without interruption until the concrete reached the
top of the guide walls. A minimum of 3 cy of concrete was usually allowed to
overflow the trench to remove contaminated concrete and muck.
The concrete level was measured by sounding at frequent intervals so that
the actual volume of concrete placed could be compared with the theoretical
volume. The results were used to produce a concrete volume curve for each panel.
The soundings also indicated when tremie cuts (shortening of the pipe length)
were to occur.
The displaced slurry was pumped out of the trench to a holding pond for
reclamation.
5. Go-devil. A retrievable, snug-fitting, non-collapsible, traveling
go-devil was specified for use in the tremie pipe. The contractor wanted to use
a I-foot thick wad of vermiculite. Soletanche stated that the vermiculite go-
devil was successfully used in previous tremie concrete placements. The
Government was not convinced that it was retrievable. The plan decided upon was
a combination of a I-foot thick wad of vermiculite plus the wood sphere in each
pipe as a go-devil.
The chance of recovery of eicher element of the go-devil was best in the
xI-12

first minutes of placement than at any other time. It appeared that during the
first few loads the go-devil usually returned. It was noticed that both the
vermiculite and the spheres were seen on the surface, but the spheres were more
easily recognized than the vermiculite in the slurry. The spheres were not
always retrieved nor was the vermiculite always seen. There were approximately
eleven spheres lost.
The second best opportunity for sphere recovery was toward the end of
the placement. A search of the concrete and muck that was piled at the top of
the panel occasionally provided the sphere that did not surface earlier.
The greater depths of the panels in the canyon inhibited the return of
any of the go-devils.
6. Concrete Production. The specifications called for a batch plant
capable of producing concrete at a rate of 100 cubic yards per hour for the
tremie concrete and 50 cubic yards per hour for structural concrete. This plant
satisfied both requirements. The 100 cy/hr was necessary due to the large amounts
of concrete to be placed in the huge trenches. Some placements were expected to
last for 24 hours and a heterogeneous mixing of plastic and set concrete was not
a desired condition in these monolithic panels.
The first cutoff wall concrete placed was on June 5, 1989 and the
concreting of the panels continued until it was interrupted by the recompaction
XI-13

of the dam core by grouting, (Aug. 24, 89). Concreting resumed on December 8,
1989 and was completed on April 12, 1990.
A 100 cy/hr placement was never attained. Usually, the batch plant
during the first hour or two could reach a 96 cy/hr batching rate but the placing
of concrete set the pace. An overall average of 53 cy/hr was maintained during
the cutoff wall placements with a high of 77 cy/hr achieved on February 16, 1990.
The average was 47 cy/hr for, primarily, the Type I panels and 63 cy/hr for the
Type II panels. The increase in placing speed for the Type II wall was due to
changing the panel configuration from a three-bite panel which would have two
tremie pipes to a one-bite panel with two tremie pipes. This change provided
more concrete faster to a smaller trench. Also, the time for the expected long
24-hour placements was cut signficantly.
The total amount placed in the tremied cutoff wall was 18,277 cubic
yards.
Concrete quantities were an overall average of 16 percent over the
neatline estimate. The Type I walls, left and right banks, were 26 and 25
percent overrun, respectively. The Type II wall experienced the tightest
control on overrun at II percent while this section had the greatest amount of
concrete at 11,865 cubic yards. The recompaction grouting in the canyon area of
the dam may have allowed the excavation of better shaped trenches and narrowed
the gap between the theoretical and actual amounts.
XI-14

The deepest panels required about 500 cubic yards of concrete. The
panel that holds the world depth record (Panel 129 - 402.55 feet) was concreted
on February 1, 1990 and contained 516 cubic yards. The largest concrete
placement occured on January 16, 1990 for panel 127 with a capacity of 524 cubic
yards.
7. Specified Concrete Properties. Three mix designs were approved for
use for the work under this scope of work.
COMPRESSIVE STRENGTH3,000 psi at 28-days for the tremie concrete.3,000 psi at 28-days for all other concrete.4,000 psi at 28-days for the spillway concrete.
SLUMP7 to 9-inches for the tremie concrete.2 to 4-inches for walls.3-inches maximum for all other concrete.
AIR CONTENTNo requirement for entrained air in the tremie concrete.
5 to 7-percent for all other concrete.
WATER-CEMENT RATIO0.45 for the spillway and exposed concrete.
0.50 for the tremie concrete (equivalent cement).
REQUIRED AMOUNT OF CEMENT500 -pounds minimum for the tremie concrete.
XI-15

TREMIE CONCRETE DESIGN PROPORTIONSMaterials Original Mix Adjusted Mix
3/4-inch, lbs. 1807.0 1790.0
Sand, lbs. 1421.0 1400.0Cement, lbs. 383.0 401.0Pozzolan, lbs. 117.0 124.0Water, lbs. 257.1 257.1HRWRA, fl. oz. 90.0 95.0AEA, fl. oz. 2.3 4.4
Total lbs. 3985.1 3972.1Equivalent W/C 0.47 0.45Air, % 3.0 5.3Yield, ft3 27.0 27.0Unit Wt.p lbs/ft3 147.6 147.1
OTHER CONCRETE DESIGN PROPORTIONSMaterials, SSD #606 - Other Concrete #607 - Spillway Concrete
7/8-inch, lbs. 1960.0 1960.0Sand, lbs. 1390.0 1230.0Cement, lbs. 470.0 540.0Water, lbs. 260.0 243.0WRA, fl. oz. 28.0 42.0AEA, fl. oz. 3.0 3.5
Total lbs. 4080.0 3973.0W/C 0.55 0.45Air, % (+/-l) 6.0 6.0Yield, ft3 27.0 27.0Unit Wt., lbs/ft3 151.1 147.1
8. Concrete Coloring Sequence. A dye was added to the concrete in the
Type II wall canyon section. The bottom 20 feet of the primary panels was
targeted for coloring. Some of the coloring was noted on the surface at the end
of each placement but it is believed that most of the colored concrete remained
XI-16

at the bottom of the panel. Coring of these panels verified that the bottom of
the panels retained the colored concrete. Red and black were used, alternately.
The requirement for the dye as a redundant check is discussed elsewhere in this
report.
PANEL NO. COLOR
15 Black17 Red
119 Red121 Black123 Red125 Black127 Red129 Black131 Red133 Black135 Red137 Black139 Black141 Black
9. Concrete Quality. The coring of the concrete panels showed the
concrete to be of an excellent quality. The overall compressive strength average
at 28-days was 5,240 psi and well over the required minimum of 3,000 psi.
A few problem areas (panels 7, 15, and 17) exhibited anomalies that were
of a cosmetic nature only. Cores from these panels revealed honey-combed and
washed-out or gravely zones, yet the compressive Strengths from the core samples
ranged from 4510 psi to 8990 psi. Two of the sample cores were taken from areas
of visibly solid concrete; the four other samples came from areas of light to
severe washout of the mortar component.
XI-17

The small amount of water loss recorded during the down-hole packer testE
in these panels were, evidently, the result of poor testing methods and equipment.
The drill holes were grouted with no grout takes observed.
10. Concrete Cohesiveness. The concrete for tremie placement needs to be
fluid enough to easily flow down through the tremie pipe. The ratio of the
binding phase (mortar) should be large enough to avoid any excessive friction
between the coarse aggregates and it must be cohesive and viscous enough to avoid
bleeding and segregation of the concrete during and after placement. These
conditions are usually fulfilled when the binding phase is rich in fine elements
(cement, pozzolan, sand, and air).
The originally submitted mix design was used for the first eight
concrete placements. It was during these placements, and especially for panels
15 and 17, that it was noticed in the tremie hopper, occasionally, that the
concrete was not very cohesive. There were concrete slumps in excess of the
9-inch maximum limit, also. Concrete cores from panels 15 and 17 exhibited
honey-combing and vertical channels.
The channels were likely the result of the upward displacement of water
along with fine particles caused by the difference in specific gravities between
the binding phase and the aggregates when the binding phase is not cohesive
enough. It may be possible that some slight localized displacements of the
ground under the hydrostatic pressure of the fluid concrete (at least twice as
XI-18

dense as the slurry) had taken place, creating a path through which the bleed
water and cement particles could have escaped and leaving the honey-combed
effect in the concrete.
The contractor upon evaluating the mix design, cores, and the QC
testing made some modifications to the concrete mix starting on June 27, 1989.
The changes to the mix were a 25-pound increase in cementitious materials and a
doubling of the air-entraining agent. This increased the ultimate compressive
strengths slightly, which were already approaching the 5,000 psi area at 28-
days. (The high concrete strengths are a by-product of the high amounts of
cementitious materials used to achieve cohesiveness). The most effective
contribution in avoiding bleeding and segregation was the consequent effort to
maintain the concrete slumps in the specified range of 7 to 9-inches. (The
optimum concrete slumps occured in the 8.25 to 9-inch range. The concrete
flowed much more readily down the pipe and accelerated the placing of concrete
at this consistency).
11. Slump Variability and Cement-balls. Slump variability was a problem
of differing severity during all of the concrete operations of the cutoff wall.
A number of factors contributed to this situation:
a. The minus 200 fraction of the sand in the beginning of the concrete
operations was bordering the 5 percent limit and exceeded it on numerous
occasions. The minus 200 percentage was roughly halved when the Corliss sand
XI-19
was substituted with the Cadman pit sand.
b. The coarse aggregate stockpile was drying out in the hot summer
weather and it was absorbing some of the batch water. A better sprinkling
system was obtained by the contractor to maintain the coarse aggregate at SSD
and minimizing the effect it has on the concrete.
c. The sand was used shortly after processing and delivery to the
site. This material was holding an excess amount of water and wreaking havoc
with the concrete slump. This problem was remedied by allowing the sand stock-
pile to drain for at least 24 hours before being used to achieve a constant
condition in the sand.
d. Transit mixers would occasionally back up at the placement and the
sun shining on the drum was effecting the slump. The causes of the back-ups
were things like tremie pipe length shortening operations, concrete backing up
in the hopper (usually signaling the need for shortening the tremie pipe),
slurry pump and other equipment breakdowns, the slowing of the concrete
placement as the concrete gets higher in the trench and less of a drop for
concrete in the pipe, concurrent construction activities on the tight space of
the dam work platform, and the sounding device stuck in the trench, etc.
Coordination between the batch plant operator and the placing foreman by radio
and a traffic flow plan helped to solve this problem.
XI-20

e. The lack of homogeneity of the concrete in the transit mixers was
troublesome. The concrete at the front of the drum (first out) was wetter than
the concrete at the back of the drum. So, concrete slumps that were near the
lower tolerance as first delivered would exceed the slump range on the lower end
as the concrete delivery continued. The concrete would then be rejected. In
order to improve the uniformity of the concrete in each load, the batching and
mixing process was modified:
- The loading of 90% of the water versus 85% at first.
- Continuing the 70 mixing revolutions at the batch, plant butadding an additional 20 mixing revolutions after transporting-to the dam work platform and just before placement. This also
minimized any segregation that might have occured duringtransit.
These changes produced a more consistent concrete and helped to speed
the concreting operations. The incidence of cement-balls was greatly reduced
although not totally eliminated. There was a break-even point in the batching
operation. Cement-balls could be excluded at the expense of batching time but
that would cause a problem with concrete delivery at the placement. Any
cement-balls that continued to show up at the tremie hopper, would be broken
apart by a laborer that directed the concrete delivery from the truck. Cores
from the completed panels never showed any problem in the concrete from
cement-balls.
Occasionally, a mixer contained concrete with a slump lower than specified.
XI-21

Too stiff concrete was allowed to be redosed with the high range water-reducing
admixture (superplasticizer) to bring the concrete to the desired slump.
Redosed concrete was tested for compressive strength with the results being no
different than the regular concrete.
12. Panel 37. Two attempts were made at concreting panel 37 with it
being completed successfully on July 24, 1989. The first attempt at placing
concrete on July 19, 1989 was fraught with problems. The contractor was placing
concrete that appeared to be in the 4-inch to 5-inch range and it would not go
down the tremie without assistance. The tremie was being raised and lowered to
facilitate the concrete going down the pipe. After 4-5 times of pumping the
tremie up and down, the concrete started to flow down the pipe, but the hopper
would not settle back down onto the holding platform stretched across the open
trench from which it was initially raised. The tremie pipe appeared to be
hitting something solid at approximately 18-inches above the initial depth of
the pipe. Several more tries were made to seat the hopper but no progress was
being made and the tremie looked to be bouncing on something and making a solid
sounding noise on contact. The foreman instructed the crew to cut a 3-feet
section of pipe from the tremie length and continue the concrete operation.
The contractor was notified in writing that the Government intended to core the
concrete at this location and if substandard concrete is discovered the
contractor will have to remove the panel at no cost to the Government. The
contractor decided to scrub the operation and immediately began to remove the
176 cy of concrete (out of a trench that would eventually hold 400 cy), via the
XI-22

clam-shell bucket.
A Government inspector reported on July 21, 1989 that he examined the
hydrofraise picks removed from the cutting wheels that were used at the same
depth that the problem occured and notes that they appeared in poor condition
from excavation on rock. It may be that a large boulder fell from the side of
the trench walls, during or before concreting, and prevented the tremie pipe
from being lowered to the original position. Panel 37 is located between panels
35 and 39 where extensive cracking of the dam occured which may have induced
some instability of the trench walls.
13. Bentonite Intrusion into Concrete. The contractor was granted a
waiver on the maximum tremie embedment constraint for the concrete placement of
panel 141 on February 22, 1990. This was due to the bentonite slurry intrusion
discovered in the concrete of panel 137 at the approximate locations of the
tremie cuts. That panel was concreted on December 19, 1989. The contractor
maintained that this was due to too little embedment of the tremie and the
turbulence that occurs at the greater depths in the panel. The change was
alloed in enticipation of remedying the problem.
The deeper embedment of the pipe caused the concrete to exit the pipe
much slower and the tremie had to be jacked up and down throughout the placement
instead of toward the finish. The tremie embedment was as much as 100 feet and
when tremie sections had to be removed the time was increased four fold.
XI-23

(Approximately from 5 minutes to 20 minutes and required coordination with the
batch plant to keep fzom backing-up transit mixers loaded with concrete).
On March 13, 1990, the contractor modified the embedment depth and
tremie cut operation. There would be a minimum embedment of 30 feet and two
spctions (43.3 feet) cut at a time until about 45 feet from the top of the panel.
This proved to be much more efficient and the placing rate was 72 cubic yards
an hour for this placement.
The bentonite slurry intrusion was not observed in any panels cored
since the waiver was granted on February 21, 1990.
14. Spillway Replacement Concrete. The spillway wall on the left side
had a section removed to an elevation of 1240 feet when Soletanche prepared the
work platform for the cutoff wall construction. A slot was also cut into the
spillway wall and floor as the cutoff wall would jut into the spillway about 56
feet from the top of the spillway wall.
The specified cutoff wall tremie concrete was placed to the spillway
surface and a lean mix concrete deposited on top. When the ramp to the work
platform was removed, the weaker concrete was broken out and the tremie concrete
was excavated to a minimum depth of 2 feet.
The replacement concrete was specified at 4,000 psi in 28-days with it
XI-24

averaging at 4,910 psi and requiring 227 cubic yards to complete.
15. Cast-in-Place Cutoff Wall Extension. The tremie concrete cutoff wall
was constructed to the elevation of 1240 feet which was the elevation of the
work platform constructed by Soletanche. The contract called for an additional
13 feet of one foot thick wall to the elevation of 1253 feet. The wall
extension would be a structural cast-in-place concrete wall.
Prior to proceeding with the construction of the wall extension, the
top of the tremie concrete wall between the guide walls was excavated with one
set of the Hydrofraise cutter wheels. The cutter wheels were mounted on the
upper plate of a Caterpillar D-9 and the power pack was carried along side in
an end-dump. This arrangement of cutting wheels and tractor was nicknamed "the
American fraise."
The concrete was trimmed to anywhere between 0.5 foot to 3 feet, depend-
ing on the quality of the top concrete. Special care was given to the joints
between the panels. The depth of excavated concrete was deeper at the joints.
An air/water jet was used to clean the excavated surface, a bond-coat
applied, and a leveling course of 3,000 psi concrete was placed in this
excavated section to within 6-inches of the top of the guide wall. Two rows of
dowels were grouted into the drilled holes in the leveling course. The concrete
surface was sand-blasted and cleaned, the reinforcement mats attacned, a
XI-25

bond-coat applied, the formwork raised into place before the concrete was
deposited by with pump truck.
The wall extension was constructed in sections and consisted of 38
panels. Alternate panels were concreted. The panel joints were sealed with a
waterstop. Four sets of forms were available with one usually serving as a
back-up. The concrete work was accomplished by Kodo Construction Co. which was
a subcontractor to subcontractor KSC Inc.
The cutoff wall extension was constructed between May 22, 1990 and
August 7, 1990 and required a total of 402.5 cubic yards.
The concrete compressive strength was specified at 3,000 psi in 28-days.
Compressive strength averaged 5,030 in 28-days.
16. Cascade Creek Diversion. The Lower Cascade Creek flows down a steep
slope onto the top of the dam at the southeast end. A considerable amount of
debris ravels down to the dam. A diversion basin was constructed to collect the
debris for easy removal and to divert the creek to the upstream side of the dam.
The concrete was cast-in-place for the headwall section with the
remainder of the concrete was screeded and hand-floated. A total of 39.5 cubic
yards was placed for this structure.
XI-26

The concrete compressive strength was specified at 3,000 psi in 28-days.
Compressive strength averaged 4,460 in 28-days.
XI-27

PLACING RATES FOR MUD MONTAIN DAM CUTOFF WALL TREMIE CONCRETE
DATE HES TO COMPLETE CY CONCRETE PLACED CY CONCRETE ANTICIPATED CY/IR* TREMIESPlacement Cumulative Placement Cumulative Placement Cumulative PI. Cut
05-Jun-89 5.7 5.7 298 208 176 176 37 37 217-Jun-89 7.3 13.0 440 648 323 499 60 49 208-Jun-89 5.6 18.6 240 888 21 699 43 47 209-Jun-89 4.3 22.9 195 1083 167 866 46 46 216-Jun-89 9.5 32.4 517 1600 487 1353 55 48 219-Jun-89 2.0 34.4 96 1696 79 1432 48 48 120-Jun-89 4.0 38.4 229 1925 185 1617 57 49 222-Jun-89 7.8 46.2 306 2231 258 1875 40 48 227-Jun-89 4.8 51.0 240 2471 192 2067 51 48 228-Jun-89 4.3 55.3 231 2702 187 2254 54 49 206-Jul-89 5.7 61.0 91 2793 7# 2324 16 46 117-Jul-89 4.7 65.7 351 3144 285 2609 75 48 210-Jul-89 5.0 70.7 204 3348 176 2785 41 48 111-Jul-89 2.9 73.6 112 3460 87 2872 39 47 112-Jul-89 5.3 78.9 202 3662 156 3028 38 47 113-Jul-89 4.7 83.6 336 3998 265 3293 72 48 221-Jul-89 5.7 89.3 147 4145 121 3414 26 47 124-Jul-89 6.3 95.6 400 4545 329 3743 63 48 226-Jul-89 2.2 97.8 102 4647 73 3816 46 48 126-Jul-89 4.4 102.2 248 4895 152 3968 56 48 228-Jul-89 2.1 104.3 64 4959 36 4#04 3# 47 228-Jul-89 4.3 108.6 174 5133 135 4139 40 47 203-Aug-89 4.6 113.2 264 5397 221 4360 57 47 104-Aug-89 2.7 115.9 104 5501 73 4433 39 47 107-Aug-89 3,5 119.4 212 5713 170 4613 61 48 2 #08-Aug-89 2.6 122.# 139 5852 115 4718 54 48 108-Aug-89 3.2 125.2 161 6013 131 4849 50 48 109-Aug-89 2.5 127.7 136 6149 122 4971 54 48 2 #10-Aug-89 3.5 131.2 136 6285 94 5065 39 48 211-Aug-89 2.6 133.8 176 6461 148 5213 68 48 114-Aug-89 2.2 136.0 160 6621 148 5361 73 49 2 #15-Aug-89 3.0 139.0 128 6749 103 5464 43 49 115-Aug-89 2.2 141.2 92 6841 74 5538 42 49 116-Aug-89 1.9 143.1 92 6933 74 5612 48 49 117-Aug-89 2.4 145.5 100 7033 74 5686 42 49 117-Aug-89 2.2 147,7 84 7117 73 5759 38 48 118-Aug-89 1.8 149.5 60 7177 50 5809 33 48 118-Aug-89 2.2 151,7 After 80 7257 After 62 5871 After 36 48 123-Aug-89 1.5 153.2 Grouting 64 7321 Grouting 50 5921 Grouting 43 47 1 #23-Aug-89 1.7 154.9 Dam Core 76 7397 Dam Core 67 5988 Dam Core 45 47 P/G 1 #24-Aug-89 4.6 159.5 Cumulative 232 7629 Cumulative 205 6193 Cumulative 50 47 Cum I
08-Dec-89 6.6 166,1 6.6 390 8019 39# 349 6542 349 59 48 59 2 +12-Dec-89 7.0 173.1 13.6 488 8567 878 451 6993 800 70 48 65 2 +19-Dec-89 7.9 181.1 21.5 486 8993 1364 448 7441 1248 62 49 64 2 +22-Dec-89 5.0 186.0 26.5 356 9349 1720 319 7760 1567 71 49 65 2 +10-Jan-90 5.4 191.3 31.9 246 9595 1966 213 7973 ii8i 46 49 62 2 +16-Jan-90 9.1 200.4 41.0 524 11119 2490 454 8427 2234 58 49 61 2 +18-Jan-90 5.4 205.8 46.4 332 10451 2822 287 8714 2521 62 49 61 2
23-Jan-90 7.8 213.6 54.2 496 10947 3318 447 9161 2968 64 50 61 2 +
TABLE XI-1(a)

PLACING RATES FOR MUD MOUNTAIN DAN CUTOFF WALL TREMIE CONCRETE
PANEL DATE HS TO COMPLETE CY CONCRETE PLACED CY CONCRETE ANTICIPATED CY/HR*Placement Cumulative P/G Cum. Placement Cumulative P/G Cum. Placement Cumulative P/G Cum. P1. Cum P/G
124 29-Jan-98 5.8 219.4 60.0 361 11308 3679 331 9492 3299 62 50 61
118 30-Jan-90 3.9 223.3 63.9 230 11538 3909 205 9697 3504 59 50 61
129 01-Feb-90 7.1 230.4 70.9 516 12054 4425 457 10154 3961 73 51 62
139 06-Feb-90 6.4 236.8 77.3 468 12522 4893 430 16584 4391 73 51 63
122 12-Feb-90 5.5 242.3 82.8 336 12858 5229 302 10886 4693 61 51 63
126 16-Feb-90 5.4 247.6 88.2 412 13270 5641 370 11256 5963 77 52 64
141 22-Feb-91 6.7 254.4 94.9 423 13693 6064 384 11640 5447 63 52 64
120 05-Mar-90 5.5 259,8 100.4 312 14005 6376 280 11920 5727 57 52 63
135 07-Mar-90 7.4 267.2 107.8 499 14504 6875 453 12373 6180 67 52 64
130 13-Mar-90 7.0 274.2 114.8 502 15606 7377 454 12827 6634 72 53 64
140 20-Mar-90 6.9 281.1 121.7 460 15466 7837 409 13236 7043 67 53 64
134 26-Mar-90 8.3 289.5 130.0 502 15968 8339 453 13689 7496 60 53 64
128 27-Mar-91 8.1 297.5 138.1 503 16471 8842 455 14144 7951 62 53 64
138 30-Mar-90 8.6 306.1 146.7 494 16965 9336 443 14587 8394 57 53 64
132 02-Apr-90 8.5 314.6 155.2 500 17465 9836 450 15037 8844 59 53 63
136 16-Apr-90 8.7 323.3 163.9 504 17969 10340 454 15491 9298 58 53 63142 12-Apr-90 5.1 328.4 169.0 308 18277 10648 258 15749 9556 60 53 63
328.4 TOTAL 18277 TOTAL 15749 TOTAL 53 AVG
PIG - After Grouting Dam Core (Post Grout)
+ Two trexies in single bite trench
# Earlier placement hours have betterplacing rates. The concrete operation slowsas the concrete reaches the top of the trench.These numbers reflect the overallprocess, from the 1st concrete placedthrough the last concrete placed
Cumulative in this column is the
accumulated average to the point indicated.
Spillway section. The bottom of thetrench was 80.05 feet from the topof the ramp built across the spillwaysurface. The cutoff wall concrete asplaced only to the spillway surface.
TABLE XI-1(b)

Mud Mountain Dan Seepage Control Cutoff Wall Dimensions and Theoretical/Actual Concrete Amounts
PANEL STATION STATION PA PANEL PANEL PANEL BITE COMPUTED ANT. COIC. COMPUTED AKOUIT ACTUAL AEOUUT CONC. AMOUNT OER3. I BITE LEFT RIOT LENG,ft DEPTH,ft' WIDTHft L GTH,ft PER BITE, yd3 COIC./PAJEL, yd3 PLACED, yd3 AMJNT, yd3
1 13.51 18A 1847.0 1842.7f l.91 2.67 4.3# 4.26
B 1842.7# 1833.59 15.09 2.67 9.29 13.73
2 1833.59 1825.10 8.49 21.91 2.67 9.29 18.20 18 64 total 1&2 28
3 22.81 94 136 42
A 1825.1# 1815.91 33.47 2.67 9.2# 36.#9
B 1815.99 1811.59 44.72 2.67 4.4# 19.46C 1811.59 1892.3# 49.31 2.67 9.2# 44.86
4 1802.3# 1793.99 8.49 54.46 2.67 9.20 49.55 5# 60 10
5 22.80 135 174 39
A 1793.99 1784.70 56.43 2.67 9.29 51.34
B 1784.7# 1781.31 57.41 2.67 4.40 24.98
C 1780.31 1771.19 63.98 2.67 9.20 58.21
6 1771.11 1762.76 8.41 68.40 2.67 9.20 62.23 62 80 18
7 22.8# 167 195 28A 1762.70 1753.51 71.6 2.67 9.20 64.59
B 1753.5 1749.10 73.49 2.67 4.40 31.98C 1749.11 1739.9# 77.10 2.67 9.20 70.14
8 1739.9# 1731.51 8.40 76.57 2.67 9.29 69.86 71 91 219 22.81 176 218 32
A 1731.51 1722.31 77.11 2.67 9.20 70.14B 1722.30 1717.90 78.41 2.67 4.40 34.12C 1717.91 1718.71 79.40 2,67 9.20 72.24
i 1708.76 171.31 8.40 86.71 2,67 9.21 78.89 79 96 17
11 22.80 216 240 40A 1701.36 1691.10 86.94 2.67 9.20 79.10B 1691.16 1686.71 89.73 2.67 4.40 39.14C 1686.71 1677.59 91.39 2.67 9.20 82.23
12 1677.50 1669.11 8.40 95.96 2.67 9.20 87.30 87 112 25
13 22.80 258 3#6 48A 1669.10 1659.90 106.30 2.67 9.20 96.71B 1659.90 1655.50 108.59 2.67 4.40 47.25C 1655.56 1648.30 125.16 2.67 9.2# 113.87
14 1646.30 1637.90 8.40 133.53 2.67 9.21 121.48 121 147 2615 22.81 323 441 117
A 1637.90 1628.70 139.31 2.67 9.26 126.73B 1628.70 1624.31 145.67 2.67 4.40 63.38C 1624.31 1615.11 146.32 2.67 9.26 133.12
16 1615.16 1616.90 8.21 154.85 3.33 9.21 175.71 176 214 2817 23.21 487 517 39
A 1616.91 1597.70 164.53 3.33 9.20 186.69
B 1597.70 1592.90 172.90 3.33 4.81 112.36C 1592.9# i583.71 174.87 3.33 9.26 198.42
118 1583.70 1576.77 6.93 186.77 3.33 9.20 205.11 215 230 21119 1576.77 1567.57 9.21 187.66 3.33 9.21 212.93 213 246 1126 1567.57 1561.63 6.94 246.88 3.33 9.20 281.13 280 312 31121 1560.63 1551.43 9.20 252.72 3.33 9.21 286.75 287 332 41122 1551.43 1544.50 6.93 266.40 3.33 9.20 302.28 302 336 34
123 1544.50 1535.31 9.20 281.16 3.33 9.26 319.12 319 356 3'
TABLE XI-2(a)

iuntain Dan Seepage Control Cutoff Wall Dimensions and Theoretical/hctual Concrete Amounts
... : --------- : --------- : ------------------- : ------------------- --------------- ------------------- : ------------- ---------
U PANEL PANEL BITE COMPUTED AWt. CONC. COMPUTED AMOUNT ACTUAL AMOUNT COC. AMOUNT OVER COMPUTED PERCENT OVERAGE PUELfi0 WIDTH,ft LENGTH,ft PER BITE, yd3 CONC.IPAEL, yd3 PLACED, yd3 MOUNT, yd3 10. I BITE
18 101 2.67 4.30 4.26 A09 2.67 9.20 13.73 B01 2.67 9.21 18.20 18 64 total 1&2 28 77 2
94 136 42 44 307 2.67 9.21 30.19 A72 2.67 4.40 19.46 B31 2.67 9.20 44.86 C46 2.67 9.20 49.55 50 60 i 21 4
135 174 39 29 543 2.67 9.20 51.34 A41 2.67 4.40 24.98 B98 2.67 9.20 58.21 C40 2.67 9.20 62.23 62 80 18 29 6
167 195 28 17 7it 2.67 9.21 64.59 A49 2.67 4.40 31.98 B:0 2.67 9.20 70.14 C57 2.67 9.20 69.66 70 91 21 31 8
176 208 32 18 910 2.67 9.20 40.14 A41 2.67 4.40 34.12 B40 2.67 9.2# 72.24 C71 2.67 9.20 78.89 79 96 17 22 10
200 240 40 20 1194 2.67 9.20 79.10 A73 2.67 4.40 39.#4 B39 2.67 9.20 82.23 C96 2.67 9.20 87.30 87 112 25 28 12
258 306 48 19 1330 2.67 9.2# 96.71 A.59 2.67 4.4# 47.25 916 2.67 0.20 113.87 C53 2.67 9.20 121.48 121 147 26 21 14
323 440 117 36 15.30 2.67 9.20 126.73 A.67 2.67 4.40 63.38 832 2.67 9.20 133.12 C Type I85 3.33 0.20 115.79 176 204 28 16 16 -------
487 517 30 6 17 Type II53 3.33 9.26 186.69 A94 3.33 4.80 102.36 Bq7 3.33 9.20 198.42 C77 3.33 9.20 205.11 215 230 25 12 118 v66 3.33 9.20 212.93 213 246 33 16 119.88 3.33 9.20 11: 28# 312 32 ii 120?2 3.33 9.20 286.75 287 332 45 16 12144 3.33 9.20 302.28 302 336 34 11 12216 3.33 9.20 319.02 319 356 37 12 123
TABLE XI-2(a)

PAUL STATIOI STATION PAUL PANEL PAIEL PANEL BITE COMUTED A. CONW. COMUTED AE)UIT ACTUIL AID)U3. / BITE LEFT RIGHT LEGTE,ft DEPTH,ftf VIDTH,ft LE GTH,ft PER BITE, yd3 CON./PIEL, yd3 PLICED, yd3......... : --------- : --------- ------- : --------- i --------- : --------- ------------------- ----------------- ------------
124 1535.31 1528.37 6.93 291.73 3.33 9.2# 331.62 331 361125 1528.37 1519.17 9.26 367.41 3.33 9.26 348.81 349 396126 1519.17 1512.23 6.94 325.95 3.33 9.26 369.84 376 412127 1512.23 1513.63 9.26 4f0.26 3.33 9.26 454.16 454 524128 1513.63 1496.1 6.93 4#1.68 3.33 9.26 455.39 455 563129 1496.16 1486.96 9.26 462.55 3.33 9.26 456.76 457 516136 1486.91 1481.17 6.83 41.52 3.33 9.21 454.46 454 562131 1481.17 1471.87 9.26 397.96 3.33 9.21 451.48 451 488132 1476.87 1464.65 6.82 306.58 3.33 9.26 440.99 456 566133 1484.05 1454.85 9.2# 393.71 3.33 9.26 446.72 447 498134 1454.85 1448.62 8.83 399.68 3.33 9.26 452.82 453 512135 1448.12 1438.82 0.26 399.56 3.33 9.26 453.30 453 499136 1438.82 1432.66 8.82 399.93 3.33 9.26 453.79 454 564137 1432.66 1422.86 9.26 394.52 3.33 9.20 447.85 448 480138 1422.86 1415.97 6.83 39f.51 3.33 9.26 443.10 443 494139 1415.97 14#6.77 9.26 378.77 3.33 9.26 429.78 431 40814 1416.77 1399.95 6.82 360.89 3.33 9.21 469.49 469 46141 1399.95 1396.75 9.26 338.58 3.33 9.26 384.18 384 423142 1396.75 1383.92 8.83 227.36 3.33 9.26 257.98 258 368143 1383.92 1374.72 9.21 195.21 3.33 9.26 221.56 221 264144 1374.72 1307.96 0.82 180.44 3.33 9.2t 264.74 265 23235 1387.96 1358.76 9.26 171.59 2.07 9.21 156.11 156 26236 1358.7# 135.36 8.41 163.36 2.67 9.2# 148.35 148 17637 21.97 329 406
A 1356.36 1341.16 155.84 2.67 9.26 141.78B 1341.10 1337.53 151.24 2.07 3.57 53.39C 1337.53 1328.33 146.65 2.07 9.26 133.42
38 1328.33 1319.93 8.41 144.36 2.67 9.26 131.34 131 16139 21.97 285 351
A 1319.93 1316.73 134.84 2.07 9.21 122.87B 1316.73 1367.10 133.53 2.87 3.57 47.14C 1307.16 1297.98 126.31 2.67 9.26 114.91
46 1297.96 1289.50 8.4# 128.15 2.67 9.20 114.77 115 13941 21.97 265 336
A 1289.56 1281.36 124.07 2.87 9.26 113.42B 1286.36 1276.79 126.68 2.07 3.57 42.39C 1276.79 1267.59 121.8 2.67 9.20 169.25
42 1267.59 1259.19 8.41 113.19 2.87 9.26 162.98 163 12843 22.69 192 240
A 1259.19 1249.99 92.55 2.67 9.26 84.26B 1249.99 1245.76 88.32 2.67 4.29 37.47C 1245.76 1236.56 78.87 2.67 9.21 69.93
44 1238.56 1228.16 8.46 86.38 2.67 9.26 73.13 73 8445 1228.11 1218.90 9.20 8#.15 2.67 9.26 72.83 73 16248 1218.96 1216.56 8.41 86.87 2.87 9.26 73.57 74 92
47 23.35 187 231A 1216.56 1261.36 86.97 2.67 9.26 73.66B 1261.36 1190.35 86.96 2.67 4.95 39.60C 1196.35 1187.15 86.97 2.67 9.26 73.66
48 1187.15 1178.75 8.46 80.65 2.67 9.26 72.83 73 164
TABLE XI-2(b)

.. . ii . S._ . _ . , . _ . . . . . . . , . I
PTE,ftt WDTH,ft LEIGTH,ft PER BITE, yd3 COC./PAIEL, yd3 PLACED, yd3 AiNUMT, yd3 N0. / BITES S ii.. .I S S.. .S . .. .. I. I
1.73 3.33 9.20 331.12 331 361 30 9 12417.41 3.33 9.21 348.81 349 391 41 12 12525.95 3.33 9.20 369.84 370 412 42 11 12611.26 3.33 9.21 454.16 454 524 71 15 127l.08 3.33 9.20 455.19 455 513 48 11 128
12.55 3.33 9.20 456.76 457 516 59 13 12900.52 3.33 9.2# 454.46 454 512 48 1 13097.90 3.33 9.21 451.48 451 488 37 8 13196.58 3.33 9.20 449.99 451 501 51 11 13293.7f 3.33 9.20 446.72 447 496 49 11 13399.18 3.33 9.21 452.82 453 512 49 11 13499.51 3.33 9.20 453.31 453 499 46 i 13599.93 3.33 9.2# 453.79 454 504 50 11 13694.52 3.33 9.21 447.65 448 486 38 9 13790.51 3.33 9.21 443.11 443 494 51 11 13878.77 3.33 9.20 429.78 431 468 38 9 13960.89 3.33 9,21 409.49 419 460 51 12 14138.58 3.33 9.21 384.18 384 423 39 i 14127.36 3.33 9.21 257.98 258 318 50 19 142195.21 3.33 9.21 221.51 221 264 43 19 143 Type II80.44 3.33 9.21 214.74 205 232 27 13 144 -------71.59 2.67 9.20 156.11 156 212 46 29 35 Typo I63.16 2.67 9.21 148.35 148 176 28 19 36
329 41 71 22 3755.84 2.67 9.21 141.78 A151.24 2.67 3.57 53.39 B v146.65 2.67 9.21 133.42 C144.36 2.67 9.20 131.34 131 161 31 23 38
285 351 66 23 39134.84 2.67 9.21 122.67 A133.53 2.67 3.57 47.14 B126.31 2.67 9.21 114.91 C126.15 2.67 9.20 114.77 115 139 24 21 41
265 336 71 27 41124.87 2.87 9.2f 113.42 1120.08 2.67 3.57 42.30 B120.08 2.67 9.20 119.25 C113.19 2.87 9.20 102.88 113 128 25 24 42
192 240 48 25 4392.55 2.67 0.21 84.21 A88.32 2.67 4.29 37.47 B76.87 2.67 0.21 69.93 C80.38 2.67 9.2# 73.13 73 84 11 15 4480.05 2.67 9.20 72.83 73 112 29 41 4580.87 2.67 9.2# 73.57 74 92 18 25 46
187 231 44 24 4780.97 2.67 9.21 73.66 A80.90 2.67 4.95 39.60 B80.97 2.67 9.21 73.66 C8#.05 2.67 9.20 72.83 73 104 31 43 48
------ ------------------------------ -- -
TABLE Xl-2.(b)

PNEL STAT:ON STAT1ON PANEL PANE, PANEL PANEL BITE COLUTED AW.. CONC. COMPUTED AMUOT ACTUAL AMOUNT CONC. AMOUNTNO. / BITE LEFT RIGHT LENGTH,ft DEPTH,ft WIDTH,ft LENGTIH,f; PER BITE, yd3 ZONC./PANEL, yd3 PLACED, yd3 AMOUNT,
49 23.35 185 229 4A 1178.75 1169.55 80.05 2.67 9.20 72.83B 1169.55 1164.60 79.82 2.67 4.95 39.07C 1164.60 1155.40 80.51 2.67 9.20 73.25
50 :155.40 147.He 8.40 80.87 2.67 9.20 73.57 74 9251 19.20 152 248 9
A 1147.00 1137.80 80.05 2.67 9.20 72.83B 1:37.80 1137.00 80.05 2.67 0.80 6.33C 1137.00 1127.80 80.05 2.67 9.20 72.83
52 1127.80 1119.40 8.40 81.36 2.67 9.20 74.02 74 10053 21.7 170 212 4
A 1119.40 1110.20 81.23 2.67 9.20 73.90B 1110.20 1107.43 81.04 2.67 2.77 22.20C 1107.43 1098.23 81.36 2.67 9.20 74.02
54 1098.23 1089.83 8.40 73.82 2.67 9.20 67.16 67 76
55 2.7 148 160A 1089.83 1080.63 70.87 2.67 9.2@ 64.48B 1080.63 1077.86 70.61 2.67 2.77 19.34C 1077.86 1068.66 70.87 2.67 9.20 64.48
56 1068.66 1060.26 8.40 55.38 2.67 9.20 50.38 50 6457 20.77 122 136
A 1060.26 1051.06 59.34 2.67 9.20 53.99B 1051,06 1048.69 59.05 2.67 2.37 13.84C 1048.69 1039.49 59.71 2.67 9.20 54.32
Computed Total,yd3 Actually Placec.ydZ Overa
807.5: -Total Length Cutoff Wail 15,751 18,277 2,5:of Cutoff Wallat Widest Point
Type i 1 Left 1,859 2.34Sta. 16t!5 to 18+47,
Type : R:gnt - 3,24d 4,063Sta. 10+39.5 to 13+69:
Spihlway sectLon. The bottom of the trench wasapproxmately 80 feet from top of the ramp builacross the spi:way surface. The panel depth !:guresref:ect the depth of concrete placed.
Type :1 / Canyon 1i,646 i1,865Sta. 13t69 to l6+:21
A:: pane: depths are the so;nied depths whichmee- or exceed the arpoved depth
TABLE XI-2(c)

PANE PANEL PANEL BITE COEUTED AT. CONC. COMPUTED AMOUNT ACTUAL AOUNT., CONC. AMOUNT OVER COMPUTED PERCENT OVERAGE PANELDEPTH,f;* WIDTH,ft LENGTHft PER BITE, yd3 CONC./PANEL, yd3 PLACED, yd3 AMOUNT, yd3 NO / BITE
185 229 44 24 4980.05 2.67 9.20 72.83 A79.82 2.67 4.95 39.07 B80.51 2.67 9.20 73.25 C80.87 2.67 9.20 73.57 74 92 18 25 50
152 248 96 63 5180.05 2.67 9.20 72.83 A80.05 2.67 0.80 6.33 B80.05 2.67 9.20 72.83 C81.36 2.67 9.20 74.02 74 100 26 35 52
170 212 42 25 5381.23 2.67 9.20 73.90 A81.04 2.67 2.77 22.20 B8i.36 2.67 9.20 74.02 Ct73.82, 2.67 9.20 67.16 67 76 9 13 54 +
148 160 :2 8 55 +70.87 2.67 9.20 64.48 A +70.61 2.67 2.77 :9.34 B +
70.87 2.67 9.20 64.48 C +55.38 2.67 9.20 50.38 50 64 14 27 56 +
122 i36 14 P 5759.34 2.67 9.20 53.99 A +59.05 2.67 2.37 13.84 B +59.71 2.67 9.20 54.32 C +
Computed Totalyd3 Actually Placeo,yd3 Overage,yd3 Average ?ercent Over................................................................................-
-To'al Lendt1 Cutoff Wal . ,75 18,27" 2,526 16o, Cutoff Wal.at Widest Point
Type 1 / .ef ; 1,859 2,346 498 26Sta. 16t15 to 18+47,
Type : / Rg !,24 4,363 8.7 25Sta. 10*39.5 to 13,6 :
%,h wasamp buil>2et ::Sures
.ype . / Canyon 10,546 2,365STa. 13,69 Lo I,.5'
TABLE XI-2(c)
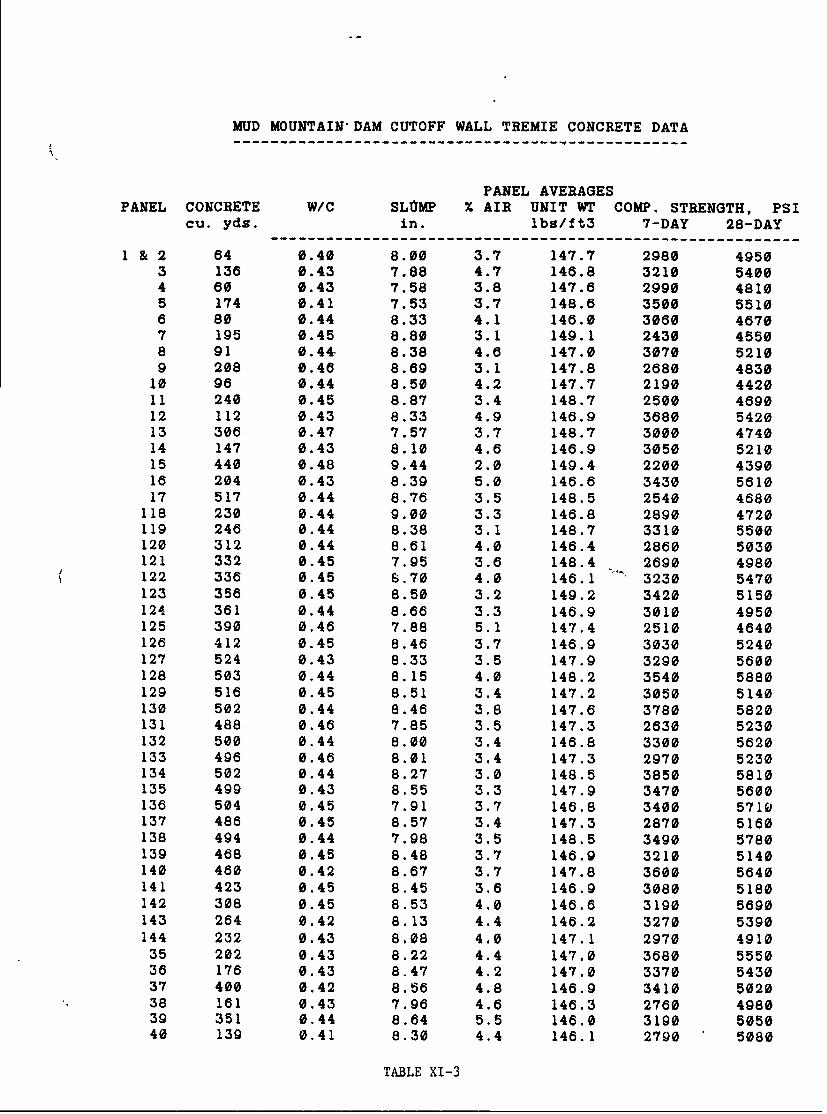
MUD MOUNTAIN'DAM CUTOFF WALL TREMIE CONCRETE DATA
PANEL AVERAGESPANEL CONCRETE W/C SLUMP % AIR UNIT WT COMP. STRENGTH, PSI
cu. yds. in. lbs/ft3 7-DAY 28-DAY----------------------------------------------------------------------
1 & 2 64 0.40 8.00 3.7 147.7 2980 49503 136 0.43 7.88 4.7 146.8 3210 54004 60 0.43 7.58 3.8 147.6 2990 48105 174 0.41 7.53 3.7 148.6 3500 55106 80 0.44 8.33 4.1 146.0 3060 46707 195 0.45 8.80 3.1 149.1 2430 45508 91 0.44. 8.38 4.6 147.0 3070 52109 208 0.46 8.69 3.1 147.8 2680 4830
10 96 0.44 8.50 4.2 147.7 2190 442011 240 0.45 8.87 3.4 148.7 2500 469012 112 0.43 8.33 4.9 146.9 3680 542013 306 0.47 7.57 3.7 148.7 3000 474014 147 0.43 8.10 4.6 146.9 3050 521015 440 0.48 9.44 2.0 149.4 2200 439016 204 0.43 8.39 5.0 146.6 3430 561017 517 0.44 8.76 3.5 148.5 2540 4680
118 230 0.44 9.00 3.3 146.8 2890 4720119 246 0.44 8.38 3.1 148.7 3310 5500120 312 0.44 8.61 4.0 146.4 2860 5030121 332 0.45 7.95 3.6 148.4 2690 4980122 336 0.45 6.70 4.0 146.1 " 3230 5470123 356 0.45 8.50 3.2 149.2 3420 5150124 361 0.44 8.66 3.3 146.9 3010 4950125 390 0.46 7.88 5.1 147.4 2510 4640126 412 0.45 8.46 3.7 146.9 3030 5240127 524 0.43 8.33 3.5 147.9 3290 5600128 503 0.44 8.15 4.0 148.2 3540 5880129 516 0.45 8.51 3.4 147.2 3050 5140130 502 0.44 8.46 3.8 147.6 3780 5820131 488 0.46 7.85 3.5 147.3 2630 5230132 500 0.44 8.00 3.4 146.8 3300 5620133 496 0.46 8.01 3.4 147.3 2970 5230134 502 0.44 8.27 3.0 148.5 3850 5810135 499 0.43 8.55 3.3 147.9 3470 5600136 504 0.45 7.91 3.7 146.8 3400 5710137 486 0.45 8.57 3.4 147.3 2870 5160138 494 0.44 7.98 3.5 148.5 3490 5780139 468 0.45 8.48 3.7 146.9 3210 5140140 460 0.42 8.67 3.7 147.8 3600 5640141 423 0.45 8.45 3.6 146.9 3080 5180142 308 0.45 8.53 4.0 146.6 3190 5690143 264 0.42 8.13 4.4 146.2 3270 5390144 232 0.43 8.08 4.0 147.1 2970 491035 202 0.43 8.22 4.4 147.0 3680 555036 176 0.43 8.47 4.2 147.0 3370 543037 400 0.42 8.56 4.8 146.9 3410 502038 161 0.43 7.96 4.6 146.3 2760 498039 351 0.44 8.64 5.5 146.0 3190 505040 139 0.41 8.30 4.4 146.1 2790 5080
TABLE XI-3

PANEL AVERAGESPANEL CONCRETE W/C SLUMP % AIR UNIT WT COMP. STRENGTH, PSI
cu. yds. in. lbs/ft3 7-DAY 28-DAY
41 336 0.43 8.63 4.7 146.5 3420 520042 128 0.42 8.00 3.7 147.9 3410 575043 240 0.45 7.73 4.9 146.9 3330 512044 84 0.42 8.25 4.1 146.9 3040 510045 102 0.42 8.59 4.1 147.6 3110 498046 92 0.42 8.13 3.6 148.0 3450 559047 231 0.44 7.36 5.2 146.9 3300 547048 104 0.41 8.67 5.1 145.2 3010 513049 229 0.43 8.84 3.5 148.1 2670 472050 92 0.42 8..10 4.1 146.6 3320 519051 248 0.42 8.44 4.4 147.4 3220 519052 100 0.43 8.63 4.2 146.3 2920 482053 212 0.41 8.25 4.5 146.2 2910 534054 76 0.44 8.67 4.0 146.3 2600 472055 160 0.42 8.44 4.5 147.0 3230 518056 64 0.43 8.25 4.3 146.4 2670 465057 136 0.42 8.45 4.1 146.7 2740 4990
18277 TOTAL
Overall Average 0.44 8.34 3.8 147.4 3130 5240
Range - Low 0.40 3.25 0.5 141.2 1620 3610High 0.51 10.00 7.2 151.3 4730 7290
Number of Tests 440 671 421 441 440 877
Standard Deviation 0.02 0.77 0.81 1.33 500 551
Coefficientof Variation, % 4.14 9.21 21.16 0.90 16.00 10.52
TABLE XI-4

Seepage Control Cutoff Wall Cast-In-Place Extension Stationing
----------------------------------------------------------------------------------------------------
Panel Number Station Left Station Right Panel Length, ft.
1 1847.00 1M27.00 20,002 1827.00 1807.00 20.003 1807.00 1787.00 20.004 1787.00 1767.00 20.005 1767.00 1747.00 20.006 1747.00 1717.60 20.007 1727.00 1707.60 20.008 1707.60 1687.60 20.069 1687.60 1667.0 20.6016 1667.06 1647.6 20,011 1647.00 1627.00 20.0012 1627.00 1607.06 20.0013 1607.66 1587.60 20.6014 1587.6 1567.60 20.6015 1567.06 1547.6 20.6016 1547.06 1527.0 20.0017 1527.00 1567.60 20.0018 1507.06 1487.66 20.6019 1487.60 1467.60 20.6026 1467.0 1447.60 20.6021 1447.16 1437.00 10.622 1437.60 1417.06 26.6623 1417.60 1407.6 11.6124 1407.0 1387.0# 20.6025 1387.66 1367.00 26.6026 1387.0 1347,00 20.627 1347.00 1327.66 26.6028 1327.0# 1367.00 20.6029 1367.60 1287.0 20.6030 1287.66 1267.06 20.0631 1287.6 1250.66 17.A032 1250.60 1236.06 26.6633 1236.66 1216.66 20.6634 1210.60 910.19 26.035 119000 1170.0 26.036 1170.00 1k6.00 26.0037 1150.0 1141.78 8.2238 1141.78 1132.78 9.00
714.22 -TotalLength
TABLE XI-5

Seepage Control Cutoff Wall Cast-In-Place ExtensionConcrete Data
W/C SLUIP Z AIR 7-DAY 28-DAY 28-DAY UIT OT TEMPEATURE, DEG. F PANEL UATE CY PLACED
in. lbs/in2 lbs/in2 lbs/in2 lbs/ft3 AIR CONCRETE
0.42 3.75 4.4 2,516 5,440 5,391 148.9 54 58 8,11,12 22-May-96 33.82,439 8,11,12 22-1ay-911,80 8,10,12 22-May-91
1.42 2.75 4.1 2,79# 5,436 5,411 148.4 54 58 8,1#,12 22-May-912,791 8,11,12 22-ay-962,836 8,1#,12 22-May-90
0.48 4.00 5.4 2,871 5,146 5,121 152.4 66 58 7,9,11,13 24-May-91 44.11.51 2.51 4.2 3,726 5,821 5,790 148.6 72 62 31,33,35 31-May-91 34.01.46 5.11 5.2 2,661 4,511 4,581 140.4 54 58 29,32,34,36 11-Jun-96 44.19.45 2.56 5.0 2,960 5,181 5,340 147.7 62 04 24,20,28,31 0-Jun-91 44.61.46 2.75 4.2 3,756 5,611 5,551 149.2 64 66 21,22,25,27 07-Jun-91 44.59.47 2.51 5.1 3,40 5,186 4,920 147.8 62 64 10,18,21,23 13-Jun-99 36.60.49 3.0 5.4 3,636 4,441 4,371 146.9 75 76 17,19 14-Jun-96 22.0t.49 2.75 5.4 3,621 147.6 75 76 17,19 14-Jun-96
2,990 17,19 14-Jun-913,140 17,19 14-Jun-90
1.48 2.51 5.0 3,440 5,186 5,220 147.2 73 70 2,4,6 19-Jun-90 34.0#.48 2.75 4.9 3,30 5,610 5,#26 147.2 75 71 1,3,5,37 21-Jun-99 37.01.44 2.1 4.7 3,840 5,166 5,171 147.5 6 84 14,15 13-Aug-96o 22.00.51 2.25 4.7 3,091 4,396 4,470 146.5 86 86 14,15 03-Aug-960.51 14,15 13-Aug-916.56 14,15 03-Aug-916.49 14,15 13-Aug-906.43 2.75 5.7 2,659 4,640 4,196 144.0 78 80 38 17-Aug-91 8.0
o---------
4#2.5
# 4-DAY 5-DAY 6-DAY3,686 3,210 3,670
TABLE XI-6

Seepage Control Cutoff all Cast-In-Place ExtensionConcrete Data
W/C SLUMP Z AIR 7-DAY 28-DY IT IT TEMPERATURE, DEG. Fin. lbs/in2 lbs/in2 lbs/ft3 AIR COMCRETE
1.47 2.92 4.9 3113 5128 147.7 89 88 OverallAverage
1.13 1.77 1.5 475 491 2 11 9 StandardDeviation
8.4 28.5 10.2 15.8 9.7 1.2 15.9 13.7 Coefficientof Variation, %
0.51 5.#0 5.7 3840 500214 152.4 88 86 Maximum0.42 2.00 4.1 1861 4041 144.0 54 58 Minimum
18 15 15 21 28 15 15 15 Number
of Tests
AVG AVa7-DAY 28-DAY PANEL
2533 5418 8,10,122871 5130 7,9,11,133721 5815 31,33,35
20601 4545 29,32,34,362961 5210 24,26,28,303751 558# 21,22,25,27340 501 16,18,21,233145 4405 17,193440 520 2,4,63300 5015 1,3,5,373465 4798 14,15
2050 4165 38
Design Strength Specified: 3,10 psi 0 28-Days
TABLE XI-7
i

Spillway Sections ReplacementConcrete Data
I/C SLUMP % AIR 7-DAY 28-DY 28-DAY UNIT IT TEMPERATURE, DEG. F PANEL DATE CY PLACEDin. lbs/in2 lbs/in2 lbs/in2 lbs/ft3 AIR CONCRETE
1.43 2.75 5.2 3,280 4,530 4,580 147.0 66 76 1,4 17-Sep-90 700.43 2.75 5.4 3,47# 4,60 4,650 147.1 70 79 1,4 17-Sep-910.43 2.50 5.2 3,950 4,97# 5,000 148.5 04 72 2,3 18-Sep-90 1300.44 2.25 5. 4,210 5,270 5,240 148.0 68 76 2,3 18-Sep-900.45 2.75 5.0 4,120 5,190 5,041 148.4 72 79 2,3 18-Sep-910.42 2.25 5.2 3,670 4,970 4,930 146.5 51 64 Slot 02-Nov-90 27
227
U/C SLUMP Z AIR 7-DAY 28-DAY BIIT IT TEMPERATURE, DIG. Fin. lbs/in2 lbs/1n2 lbs/ft3 AIR CONCRETE
- - - - - - - - - - - - - - - - - - - - - - - -
0.43 2.54 5.2 3,783 4,916 147.6 6 74 OverallAverage
0.#1 0.25 0.2 371 256 1 7 6 StandardDeviation
2.4 9.7 2.9 9.8 5.2 0.6 11.5 7.6 Coefficientof fariation, %
0.45 2.75 5.4 4,211 5,270 148.5 72 79 Mlaxima0.42 2.25 5.0 3,280 4,530 146.5 51 64 Minim
6 6 6 6 12 6 6 6 lumberof Tests
Design Strength Specified: 4,000 psi I 28-Days
TABLE XI-8

Lower Cascade Creek Diversion Basin Concrete Data
W/C SLUM Z MR 7-DAY 28-DAY 28-DAY UNT IT TEMPERATURE, DEG. F LOCATION DATE CY PLACEDin. lbs/in2 lbs/in2 ibs/in2 lbs/ft3 II CONCRETE
.41 8.56 8.6 2,306 3,260 3,221 138.5 64 83 lead fall 26-Sep-96 3.5#.36 6.25 6.2 2,546 3,270 3,246 146.8 74 86 Read Wall 26-Sep-966.43 2.5# 5.2 3,311 4,576 4,61# 147.1 81 73 Pad 25-Sep-96 2.0
1.45 2.25 4.9 3,446 5,591 5,616 149.6 64 74 Basin 27-Sep-96 31.52,976 4,946 Basin 27-Sep-96
6.41 2.66 4.8 4,3H 5,466 5,466 148.3 56 68 Wings 13-Oct-96 2.5
39.5
U/C SLUMP % III 7-DIT 28-DAY UNIT IT TENERATURE, DEG. Fin. lbc/1n2 lbs/in2 lbs/ft3 AIR CONCRETE
1.41 3.91 5.8 3,143 4,464 146.1 84 78 OverallAverage
6.63 2.27 1.3 715 1,38 4 7 8 StandardDeviation
8.1 58.2 23.0 22.8 23.3 3.6 1#.3 7.9 Coefficient
of Variation, %
#.45 0.59 8.6 4,31# 5,616 149.6 74 83 Naximm#.36 2.1 4.8 2,360 3,21 138.5 56 68 Miniam
5 5 5 a11 5 5 lumberof Tests
Design Strength Specified: 3,16 psi I 28-Days
TABLE XI-9

M. *A 00
coo 00
0 IOL
00
71GUR XI-I

F OSO-.C -C ii.@C-q
... .. ...0. ... ..o .. ... .......
0 Jo
cc a
FIUR ___ S

COMa.= -C Wee@-
0 0 0
0
..... .
0.. ...... ."
061
V. ........ ...... .... £
C)S..* .. *****.* ('V
-ON +
"('S
..... W-C0
.... ... ... ...
......... . ... .0
- 0
oOO.- OZ0 00 a 0 - 0
Iax
FIGURE XI-3

0 0go0 0
0
... ......
L. go
-- -- -- -- . 0. .0 _ _ _ %
cfcg C__mg
.......... .. ....
a 0
FIUR XI

I. -___ -s/*11
* - i I/ I
a1
A
41 &
'a I'a I
&
I 0* I
I ''I j 1'S I a
'I i 'I5 4.
.5 SI' a' U
0I j 4.Li- 1'* a.o j a
h.
Cl, I JLI0 .~ p-I4.9 1*' 0. I U0~. I aha / co 04. 0I *~ ~:
a, * II,
I, IIll .1
p -a4 A-o I U S
0 a lx 03I' j 0I' i\ 4.
~' I aa
I a
I p UN a
II -
p * 4,0 Pp. U
- a P a I aI * aI S
a I 06.. 4.
I I 33C I I* I" 'I a a 05I ', I *- .5 a- SA- a 9 a. 4.I, - 4.0* ~. I I U-0*Qa
- .1* 'I II I So* I *I I i 9, So* mi§mj .0
'a a 0Oh ~I 'I S* ~I II 1 5-
Ia IU
*II U.U ~
0 0 0 0 0 0 0 4.
* *
30
FIGURE XI-5

J.9
I" lso so/ ! q:
Lo V
+ ii .9l
- 2W
+ I ..9 .
941> 0,
01I %-
-I. I' ,.PI
-: 2 " 2'5
Lo a
I SI
.L I 2 0)
0 - ,.
0 "0
w 00
00 I
00 el0 0 0 0a a
4:II "I lIL-2
FIGURE Xl-6

AmS
I IS
E 0L
C a
+cI!
H da
I 6 0
0 FIGUa E I-7

CL
.. . ... .. ..
% 4.
.. .. . ... . . . ..
+- %
.. . . ... . ... . . . . . ..
o~~ ~~ ... . ......... .................
. .. . ... .
Qg% " X.
± @0%
ce-
- 1' I F, I I
'I .V.£
01 -X.
- XI
..... ....xiii:S
16 110 ow
C _ _ _ _ _ _ _XI-_8

0
CL
co
*X N
ALL4:'
* -q
.........
C~~ .......... . ..... .. .... .. .
0 IV Ow ',me__ __ __ _ *
FI UR XI

V I4
-~ .- .. . ' N
I.~~ ~~~ ........~... .. ..IS
co/
I Ia- 1 ... ... s
0 I4.
0 F 9
FIUR I-1

MUD MOUNTAIN DAM CUTOFF WALL CONSTRUCTUION FOUNDATION REPORT
PLATE TITLE
PLATE 1 TITLE AND AREA MAPS
PLATE 2 STRUCTURE AND LOCATION MAP
PLATE 3 PRECONTRACT EXPLORATION AND
INSTRUMENTATION
PLATE 4 CUTOFF WALL (TYPE I)
PLATE 5 CUTOFF WALL (TYPE II)
PLATE 6 CAST-IN-PLACE (C.I.P.) CUTOFF
WALL EXTENSION
8
A

3
\IDATION REPORT CANADA-UNITED STATES
- -,
IQ-0f
lEA WASHINGTON STATE
TION
SION
_PAIM.WIWNGO
TIIITLEA E MAP S
U. .RM MOUINg TIC gAMCf ddTM O RPSL 'of 0AGIN I
050'.m SATTER '.o
COSRCIN2UNAKNKlQ

-44
0
I
44

32
UPSTREAM
0- EbTCA ACCESS p~o-f
qq/ / ' . ,.
/ 1s-.O IN
ENDCUTOFF WALL WALL N
SEGN C~rOFF WALL STA 1.349/__CU
TOFA WLA
k/ TOO WR PLATFORM - EL 120N
DOWNSTREAM
U. S. ARMY INGINRM DISTRICT, SKATTLICORPS OF ENGININRS
lS.T1 W*SMIISGTON
CONSTRUCTION FOUNDJATION REPORT
CUTOFF WALL
Sl STRUCTURE AND LOCATION MAP
MW MOUNTAIN DAM
2t5,W- SATTER
Fa !
,-*

I '10
D
-'I"0 0P5, . 3,
6~~ ~~ - ---- -
'0 0.
'0W 40.oj-
I .9 -LVTl ALA0-
- ~ ~ ~~ ---------
-- o- M
AD II:.?EOTArs..'5
PLAN.SCALEl' .00*
Q3 -7 CRS FDA -14
5 9-40 40 5C P3 P-64
'Ii~-- 5-. ~ 28430 XISTINO DAM CU~E) Ii .
A$PAOXIMATE ROCK '...Z. 4 I XUU~cATEROWM. I159040 "'JO MOUNTAIN CCmiLO CONSTRUCTION i
~fl wj.2
'0 L
ii .
j ,2j40 I I IINEIE AGLIiRT I . -C
1100 -3-- ANCIC.AOCNRT ICOIJI
-APF Oxi&Em K~4 E " ~ I
A ii ON I, ER DA4W880C,11
I
LEFT BANKI 1)I I '00
43l i 6 110 * ~ 3I\I0 0 SORING04
"MO0 I ON GOCO I
7260 - I .i I
00 C640 j ME - T E OCC
1690I34 ::: STE S Iq
13,31,74 02Cl 930 54 1 )p
GEOLOGIC SECTION ALONG CUTOFF WALLMLCKING oCaSUEAM)r
EXSIC C 01310) 01'
__ _ __ _ 4

01-.-- OADE EXISTING~ CEVSII . .
~ WALL 21A0D(0 NOTE .
- ~0- .
-Es NlI11: ?EZMC!U 1 52,153.j, 'A0.P55 ARE tESENIT PROTECTEDCO E BOK EAINING WALL. THE CONTRACTOR PAS THE OPT(IOS I tCE I ts
Al
SCUTOFF W
- i5 ,...0' . . , 044
__ _ __ _ -i 0- --------
..11 .. ... ..... /. E U IN R N LP c l ?
VP 3
SAYTE. 1UCTI1 TILL'44
DAAM AN.7 CUCT0MT
SCALET 130 3
01 MOUTAI C.P( (RAC174
S C ,'s t 0(
1 10C sil. o 16610 ClTTLL ~ f.W- I14Eviu
R,. 0. N
c- 0
fEA 27CCU~Lt WRIN DRILLIN ,1 r372 10
RIH IJNL IONA.OEOIE ~c.:Kolt 7.1
II. 11o IXL R IAC C o *? .ImEt; 'SAL. 1 NCFNCCkRSIESR4 "IC)I"RNG .OCIT OA tl LIE AR PA-, lE ECNLEE Nruw cicINTO IH PLAN rI CROS SECION lop IF II..CIOICIG.STE; R Its >,C
'610 * , ... 3.. I H NK COU ROCKESIV OR I4 N IN PSI
11410N I E L NE c a lh C H C SS E C ICH O E S lo p c4 o c o 2 F O R L O G S O F X P L O R A T 'O N S M E S P E C I " T IO 4 2tC S ' I NCIC RIHIIEROC ELV TCH3 THE VICONFINEDOIJFMR:SOION TESTS' pEOFCRU
G O G E S S L C INC I C H 1 4 4 1 1 1 C U T o F i o N A L L . 1 5 O N T H E M U D I 4 0 0 t T A I N ( .0 1 4 * 4 1 ( W E R E R U N I 0 N . C1444 -C OROES TAKEN C0GM IlOtILOIRS WITHIN THAT UNIT:
co 116 CI CEOL C C K S tICI4140CUIV 41
I Il C RCC SURFACECMYKCII RALLS.AN RIVER BED(1 Ad( W SCf . I FEHV 861 NICUtcv AND LCCALLY OEPIENEO IIECAUSE
no' 00064 41 1 CSI3ANCE CF IHC DIFFEOENI ICK ~CP PEOIIc5?o( 4140 AhOPARTl ICULAILT BECAUSE CF FAULT AND SHEAR US.ARUT INGINIIR ISIICI, SfAIl
ISTJ ,.I...~~II::4 G0)0 ONIES. TiS CRAII AS 014001(0 INC NOTCHES ANDCOSILCINFO.OTON1E01
10.5I ;!5 Sl ~ .c PRE-CONTCRACCT EXPLORATION
I) 7IC ~ 14 4R000 AND INSTRUMENTATION'0- SECTION~ ALONG CUTOFF %'14,L L I Ejn,i .UO O..TI' A
EXISTN1G41 C0l14R1( bLOrK RETAINING WALL I.4I E 13? ... *IL...~.7c~c - ~ 4.4Ito.,. n. 10.

8 43
in ca
S J
W1
0 0).0
I LI
Cs
III ~I 0-0.1
-- IIL0
ILset X
w
01 .8 .~ .. ......
009
CC1L
1OV ' 33.1 NI NOIIVA3!3 Q11)
uLJz<.
5 4C3

REVISIONS
*O0A^O'N i33 NI NOIIVA313 co- 0's
w .
In,
* as
- CONCRETE OC/EXPLORATORY HOLES 1151 199)
6 NOTE: INCLINOMETERS INSTALLED IN 0 178.182.183." 187.190.19 ANO 199(0/S). HOLES LEFT OPEN IN
I1S5.158.162.163.168.169,170172.180 AND 198.
00+tt-- ,-,4 PIEZOMETERS (101 - 107) (1081- Il SHOWN ON
........ .. .... ......... .... FIG X - 1).
PANEL NUMBERS SHOWN FOR CUTOFF WALL ONLY.
CJ P. WALL NUMBERS SHOWN ON PLATE 6.
HOLE DEPTHS IN TABLES III. 1 AND 1I-2.
_ ____PANEL DEPTHS IN TABLES XI-2AB AND C
I-Li
" =c -oo+ztZi
00+Cl
U. S. ARMY |NGIN1I2 DISTRICT, SIATTLICOIPS OF KNOINfEaS
SIATIL|, WASMING10ON
CONSTRUCTION FOUNDATION REPORT
: CUTOFF WALL
j I CUTOFF WALL (TYPE 1)
MUD MOUNTAN DAM
I-A
004-C4
"___......__... °'I ' 1
. . *'1.. ARM INONE DTIT S...T.P+ 1COR.S.O...........

5 4 ,
z 000
IE0CO -
Eh 1. 0
o )Z .Z
3 0
0 V 0"0
0'0 0-
-2-0 ____ -__________ _____________YEI, I4z
0 0II
, o z .
"'o "al
<
o --
Q? W 4I Lii
Vt _ .9. . -
(iig ($.i I------- - ----- I- ---
0 , c c'
"(]A0' I '4NINO I 31
0Z11
611 - - - - - - - - - - - - - - - - - - - ~ IozM
9A ________________________ ___________
.~, 0 (T(a
TI: (
Oat~,
C -st
0 k9 C 2
5 4,

REVISIONS
a60
w
o t
w
x U)
S2K 0.
-]
L U. wAM |NClD
OSTI , S|TL
CUTOF WAL
CUTOFFWAL__TYPE li)
M< U
00 91
0 0
0~"'"' . S.ARM ENGNEE DISRI(, SETT0
a, CD UCOLSTRUCIOGN ITICT, REPOTT
CUTOFF WALL
CUTOFF WALL (TYPE 11)
MUD wWJ mOuN'TAiN DAM
O SATEft151
3 2

5, 4 I3'
0
ef
/ 1 3 4 15 14 1 7_ 1 9 1 1 1. 1 /3 11 4 /5 11617 1 1 1 1 IV I I22 I 11 4 1 -A I ..J7' I l13o
Ali el Coeso 4ov yc W
_, PPOFILF11 .5 71 1N- S 1 e J ls 7 Z
4 4 / o Z 14 10 le? VOZZ ze. Z8 JJPFLLPBa
/A / / . 7 , 2 3 2 7 2
2 0 ~ ,I ~ / I 2? 2 2 8 3
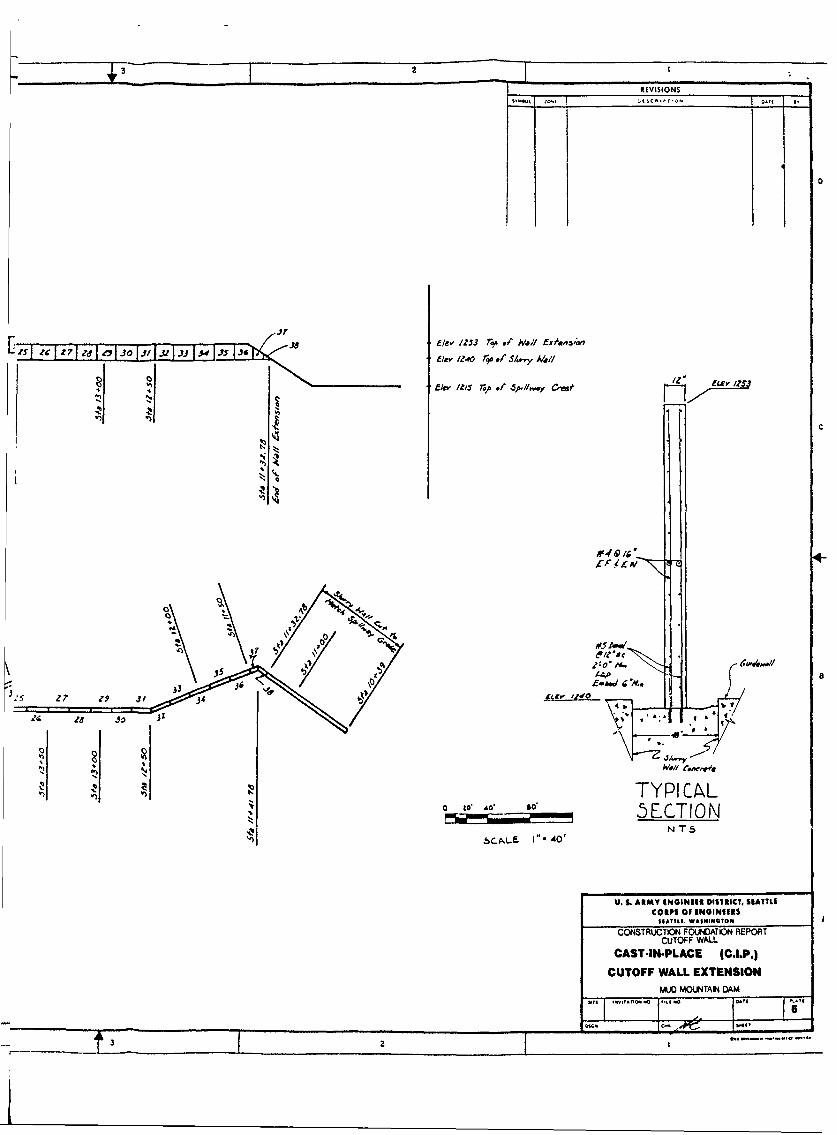
REVISIONS
is 2?~ Js1 ie.- IZ53 79 S Mlad ffxa,,onVewr 1140 rgo or/"y A1,,. l,11
- die s ra W ,.,,,-,,, rl 4
o - 7
33 L/if 6w~/
J/-I-
0 V) TYPICAL_, o _,o5ECTION
c AL, E 1I"- 40' NTS
U. S. ARMY INGINER DISITRICT, HIATTLICORPS of NOGINEERS
SWIMll l asmi&NNTONl
CONSTRUCTION FONIDATION REPORTCUTOFF WALL
CAST-IN-PLACE (C.I.P.)
CUTOFF WALL EXTENSIONMUD MOUNTAIN OAM
6

PHOTOGRAPHS

Spillway slab is pre-cut for this portion of
cutoff wall. Access road fill built up over this
area.
'4
Access road built up over spillway. Existingaccess road in foreground. Lowered dam at upperright. Upstream to the left.

During dam lowering from El. 1250 to El. 1240,several weathered longitudinal cracks were found.
Rock hammer for scale.
Geotextile placement on lowered dam work
platform. 6" of base course material overfabric.

*
At
6 ft. diameter auger removing core materialfrom access shaft.
Inspecting and sampling core material at 7 ft.depth. Note auger is below, Kelly bar is center.

Inspector being lowered into access shaft with aman basket. Note liner plates, left.
Density test being taken in core material, 84 ft.depth.
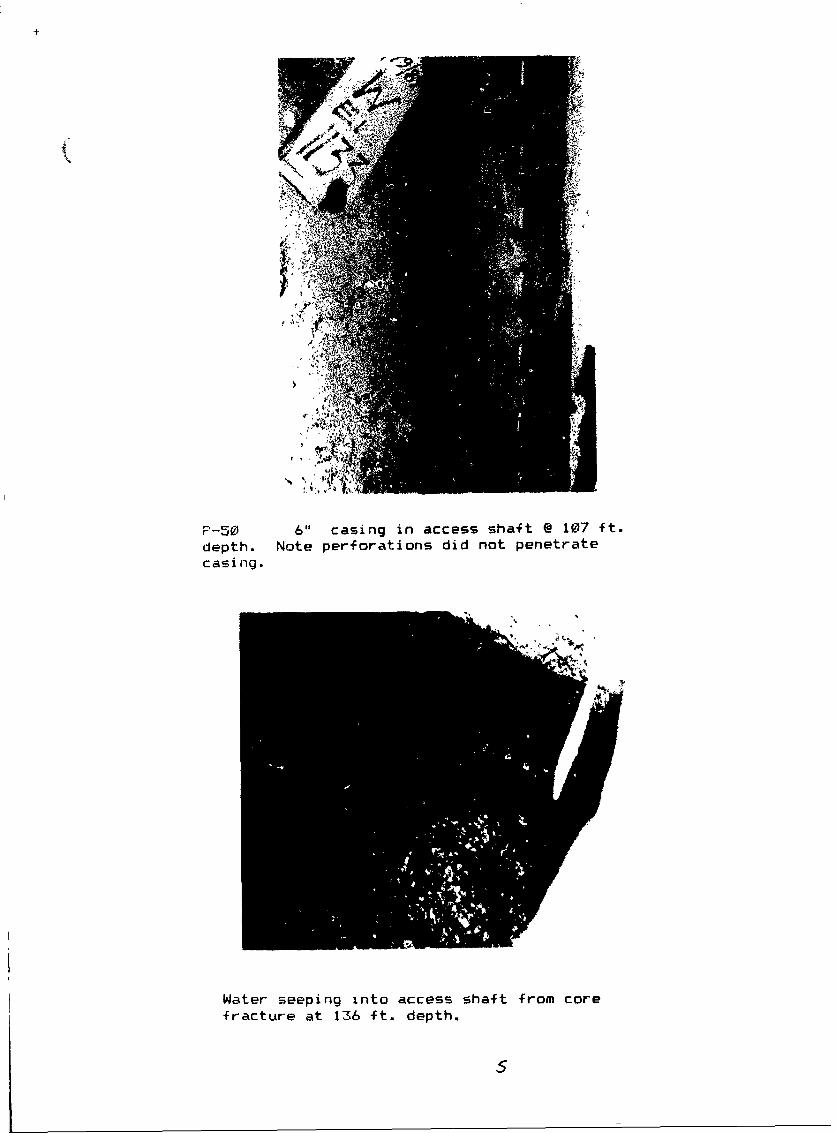
+L7
F-50 6'1 casing in access shaft @ 107 ft.depth. Note perforations did not penetrateC as i ng.
Water seeping into access shaft from corefracture at 136 ft. depth.

~*uprM
Typical construction of guide walls forh yd r f r Ai e.
Onte of four bentonite slurry ponds. Note centralpump and agitator. Concrete plant in background.

Looking at right side of spillway invert.Desander (Caviem) at right, welding shop inmiddle and machine/parts shop in background.Note spillway acc-ess road at left.
BUSiness end of Hydrofraise. Finishing a pc(tooth) change and ready to go back into panel(left). Note the guide frame on top of wall.
7

.4t
Side view of hydroft-aise. Drum at left rotatescO)Lnter clock wise while right turns oppositedirection. Partial view of huge suction pump atatiddle, top.
it CM
View from hydrofraise operations cab. 4100 craneoperator's cab is immediately to the left.Hydrofraise at top left.
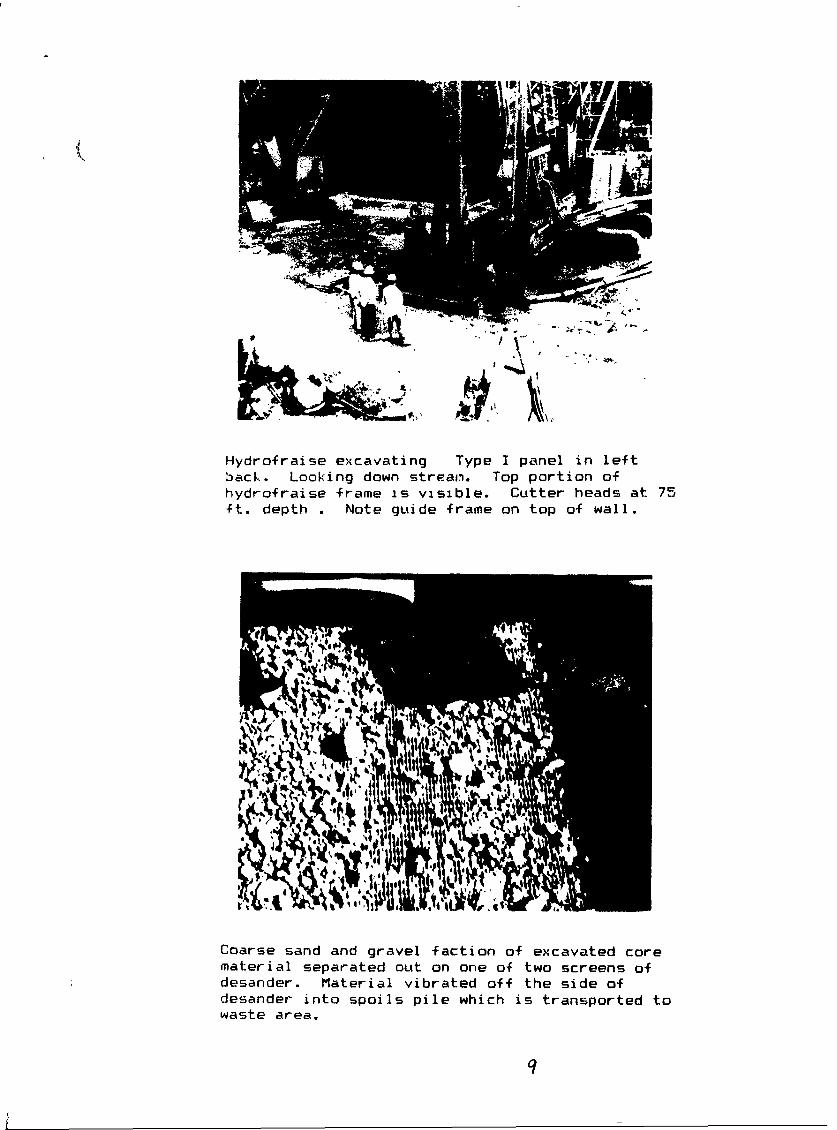
Hydrofraise excavating Type I panel in leftback. Looking down streamn. Top portion ofhydrofraise frame is visible. Cutter heads at 75ft. depth . Note guide frame on top of wall.
Coarse sand and gravel faction of excavated corematerial separated out on one of two screens ofdesander. Material vibrated off the side ofdesander into spoils pile which is transported towaste area.
q

View of hydrofraise from operator's cab.
Spare hydrof raise motors.
/0

Thret-- Mission pumps outside desander thatptump recycled slurry back to hydrofr-aise. Slurryho~lding tant-s below, desander portion above.

Cadman pit showing aggregate Materials source.
Cadman wash plant with settinfg pond in
foreground.
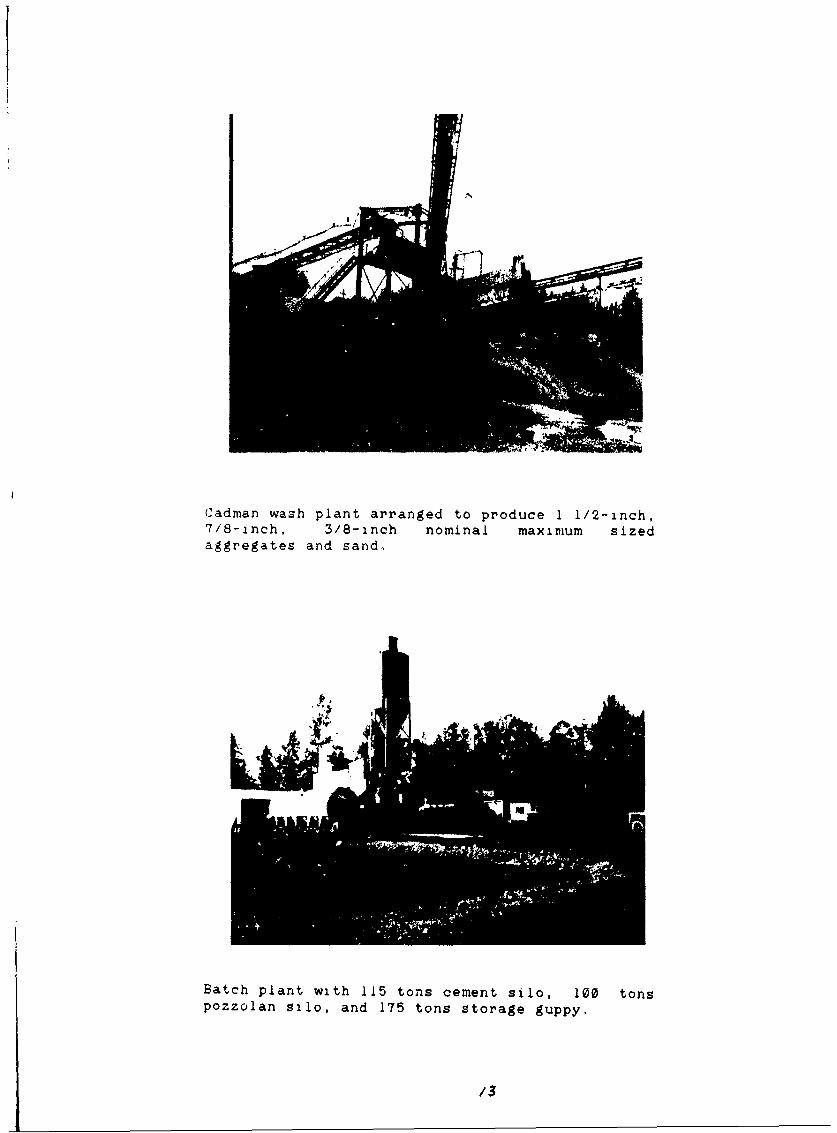
Cadman wash plant arranged to produce 1 1/2-inch,7/8-inch, 3/8-inch nominal maximum sizedaggregates and sand,.
Batch plant with 115 tons cement silo, 100 tonspozzolan silo, and 175 tons storage guppy.
13

30-inch wide conveyors. Sand conveyor on the leftand the coarse aggregate conveyor on the right.The contractor quality control laboratory is thebuilding on the far left.
Batch plant with the 175 tons storage guppy inthe foreground.

<dA
Winterization. 10-inch diameter steel pipearrangement for the coarse aggregate stockpile.
Winterization. Steel pipe arranged for the sandstockpile. The building is the contractor qualitycontrol laboratory.

JN
iF m
Winterization. Propane heaters in use on the
coarse aggregate stockpile.
I ,AIt
Winterization. Coarse aggregate stockpile showingtarpulin cover.

Winterization. Tarpulin cover to retajin heat andkeep precipatation off stockpile.
Winterization. Admixture storage tanks enclosedto keep from freezing.
/7

Winterization. The aggregate bins were roofed tokeep precipatation from collecting in them.
Funnel-shaped hopper resting on work platform.

FN
Tremie pipe coupling held in place with "dog ear"support plates.
Submergible pump used to remove displacedbentonite slurry.

Sounding device used to determine the concretesurface depth beneath the slurry.
Typical 8-10 cubic yard transit mixer.
-XO

•A I
Transit mixers backed up to two tremiesdelivering concrete into one panel.
Flowable tremie concrete delivery into the 1.1 cyhopper.
2/
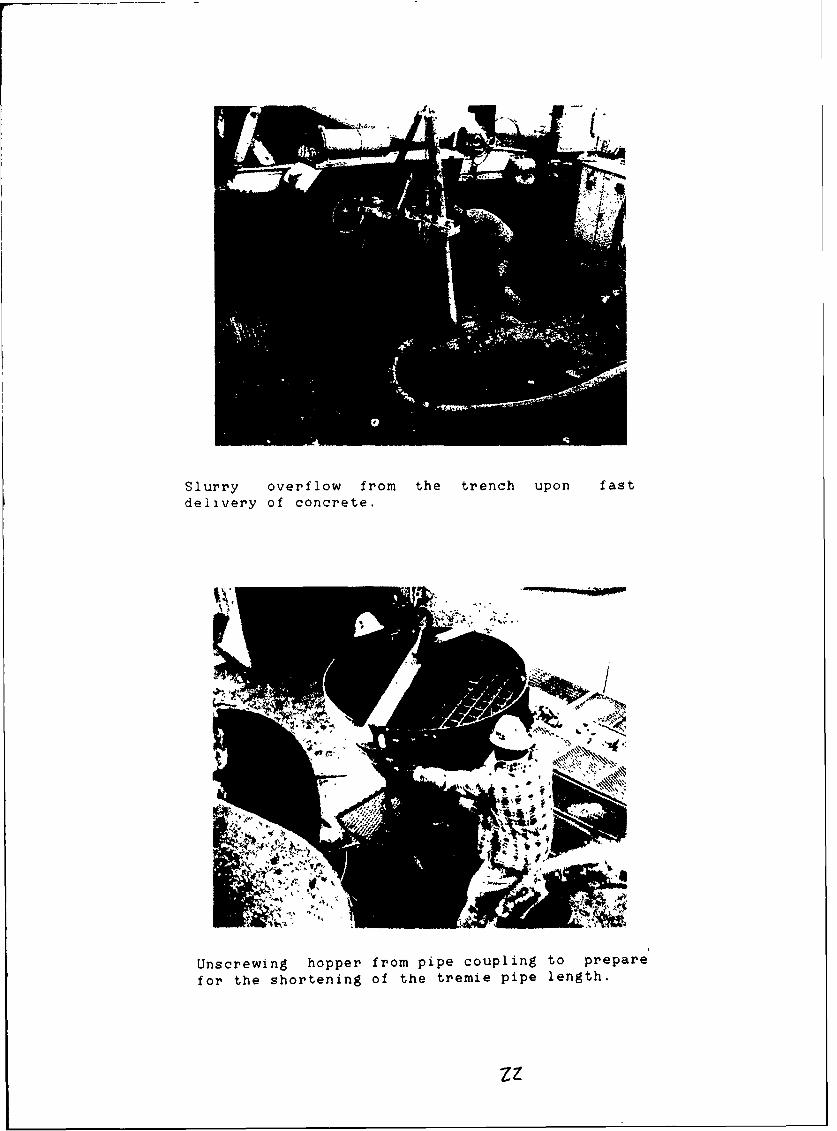
Slurry overflow from the trench upon fastdelivery of concrete.
Id" °P,
Unscrewing hopper from pipe coupling to prepare
for the shortening of the tremie pipe length.
zz

Removing one section of tremie pipe.
Laborer using chain wrench to unscrew pipe fromcoupling. Service crane is in the background.
z3

Coring "fish" viewed from top. Two of four drillpipes visible. Pipes radius outward then crossover at bottom. Cores .9 inch)/Instrumental in early detection of panelverticality error.
Business end of coring "fish." Drill rods exitthe fish between spacer flanges, next to workman.Note lateral jacking pads which lock fish inplace.

c 0'
049 -j
z 0 tra4J 4-
0 U4- CDC al 0 rq*4L 4J CL -
c UjU CLfG~4 1 L +
L 4J -M tt
0 IV W 04- fl W *- m
0 ~4J I 4J M 4J(0 0 4- -- (0.LW al 4J
u4-
L LUalC
- 3 0
C M 4J -VU
u l0
L U~ 0 +U (0 J (6 '
L.M 3
+L W E
C) 0~U~ Z I-
w o 0j 4-J -
c u4> .4La. -4 v L 0M4.
C J~ I 3J
cl* 'U EUl U.-
.4L fl 0 C i
Wu 0 C 440

Close-up of crack. Left side down dropped.
These cracks spanned the deep section of the dam
(PAnel 17 to Panel 143) in several places.
Hydrofracture crack in left wall of Panel 143.Pagel is 40 inches wide. Note upstream (left)and downstream (right) guidewalls.
z(

Hydrcofracture in Panel 145 U'. Looking at left
Emergency measures f or uncontrolled slurry lossbeing implemented. Contractor is dumping wastedSaIAJ/silt mix from desander back into panel tohelp seal cracks.
Z7

Looling toward spillway from left bahk. TH-60(left) and Schramm (right) air rotary drillsinstalling primary grout (recompression) pipes oneither side of the cutoff wall alignment throughthe deep section of the canyon.
"ENPASOL" Drilling Parameter Recorder mounted onSchramm drill gathering information on soilconditions in core.

-'
Recompression grouting plant. Eight 2x5 pumpswhich feed the grout to the holes. Mixing feedtants on opposite side of structure. Groutrecorders are inside. Looking upstream.
Ar• ",, l9,,
View of grout plant with ancillary 100 ton bulkcement hopper and 4 c.y. digester, below.Digest.er feeds mixing tanks (not installed yet)on right side of plant. Recorders and pumps onleft.
2'?

Grout recording instrumentation. Grout pumps andmotors to left.
Grout recorders. Records on 24 hour circularpaper disk. Plots flow rate, volume and pressureagainst time.

SLEEPIEISALAIN
Diagam o sleve routpipe(tue-a-mK et)
Two-nch leev pip (botom) Womanholding~~~~~~~ dobRpce C. iecIn pieTTb
at ~ ~ ~ ~ ~ ~ II PihIsPEkr rsur ie
3/,F PPR11
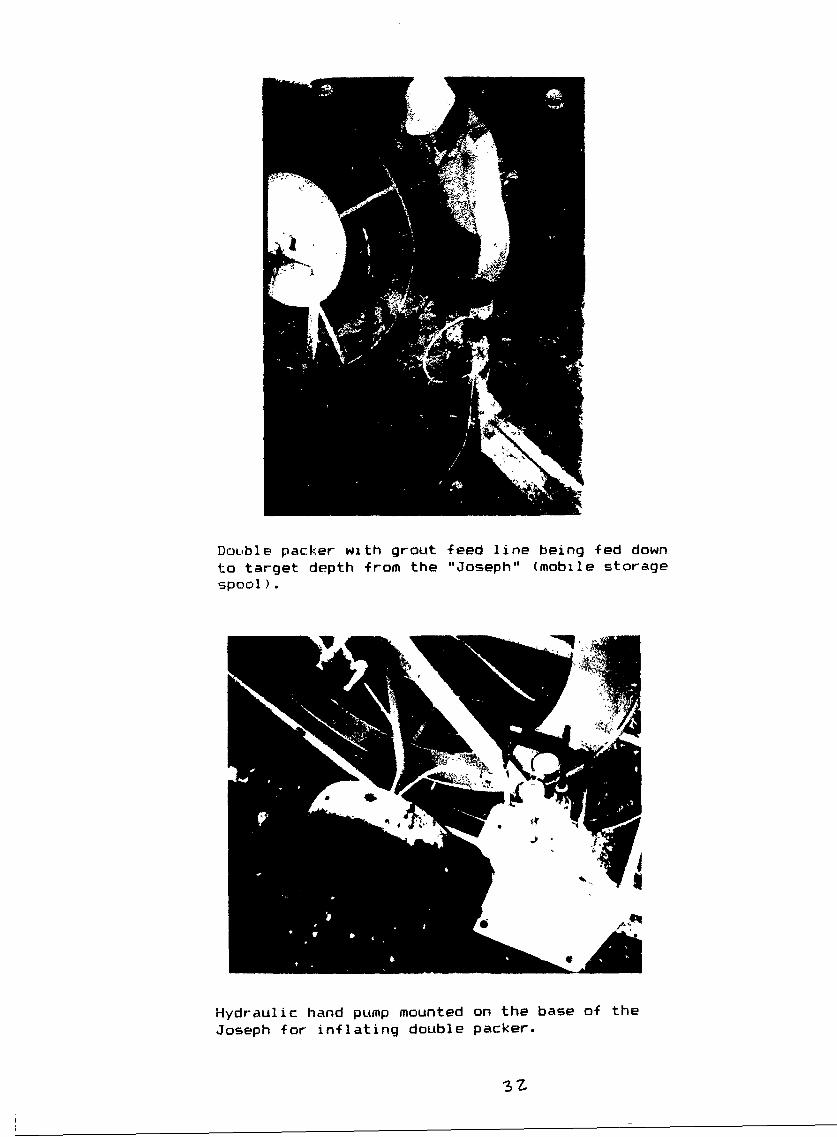
DoL-ble packer with grout feed line being fed down
to target depth from the "Joseph" (mobile storage
spool).
Hydraulic hand pump mounted on the base of the
Joseph for inflating double packer.
'31

Night shift recompression grouting. Lookingtoward left bank.
Wori site congestion dulring primary groutingoperations. Note drill rigs in backgrounddrilling secondary grout holes. Looking towardleft bank.

L 0
C. l o13a~ M 0 w4J. L01 v 4J EW 4-J .l "o
1.~ 00 wJ 4-
t ) L L 4J
CL c P- -''~ -y ~CL L4 iL .
91IO tiW0.45 C 4
o' V ,-4 =
V0 *.4 . J I.Ocl O
4 - 0 LOCO.L 0 o.
,o
jJ UMCJ 4Jr. W Lc 0JC
CL a ., U
(d " H "C 4-'U w 0 41 c
4 -
01 >~ c0M1r 0 -L
L U .4U Zu ,f 4' n -
L L +
,4 .C
0 C
L LU r4
.,.4 .
LS '4-L P4 M
r -4
CnO O °E , . , r.4
.,jc 4-
L I O rW
01 C 0~4 z-
4J +
CL 4J0 0 *J

4-Ic
>~ aC4J
0119u EWL.0
LO 4'4 04Z
C 4-
01
4.J Y U L~
E L
L U r
iii 4.J 0
C a4
W~0 4- L4
L- -m L Q)
a)41 6.. 0L C '0 Uo wJ >.OwU n C L
c0.*4 O
4~J c U
3 U
*0 m 41
L~ M Ul L
U U U OP r4m c C 4-
L (U0) .,4-
F4C e U cC0 4- 3j C4
C4 4lC-' c0.1 L CD
C1 0~ C~ .T) ) 4-1 0
-4 CD 0+ -L .1I
>0. -M 4 . 4 '-L ro ~
43 (

Ulc0
(d N*eP4 q-4L
4 J r-
4 C
*-L
C+4J4J
0nLc
L 4f004
100
. C .-4 4j
v0 0
IN .4- 4-
.3N cn LA
V- -4- C-4W
W -4 4-
CL 4
P4 CC
~y . U 4J c0.0 nC
4C C L~
- V"D -4
4-. 04J0 U-
0 0 4J
U C C4 + 4JU LA -~ .c

"NavidrillV directional drilling tool used todrill and stratghten Q.C. concrete cares inside72-40 inc~h wall Lip to 400 ft. deep.
Navidrill recording device inside tool.
37
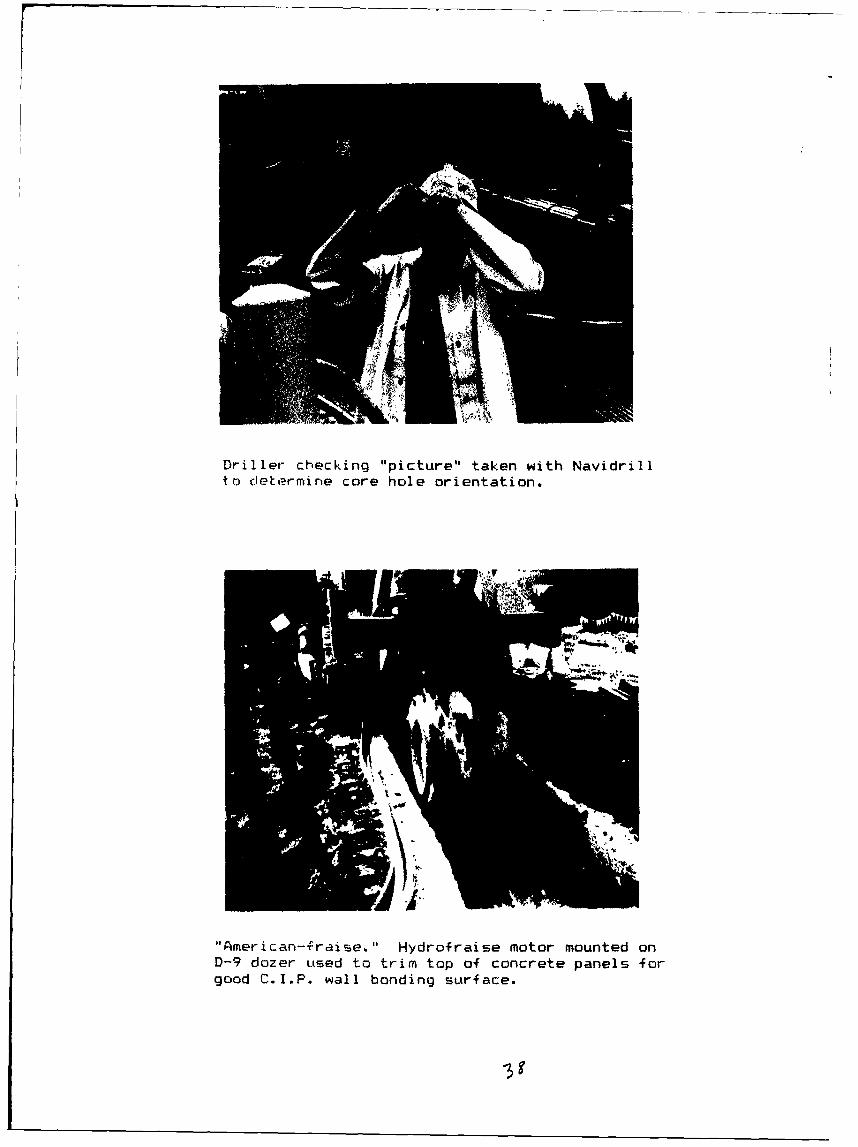
Driller checking "picture" taken with Navidrillto deter-mine core hole orientation.
"American--Fraise." Hydrof raise motor mounted onD-9 dozer used to trim top of concrete panels forgood C.I.P. wall bonding surface.

C.I.P. wall rebar and forming in place.
Concrete pump tr#)O, used for C.I.P. wallplIac emei ts.
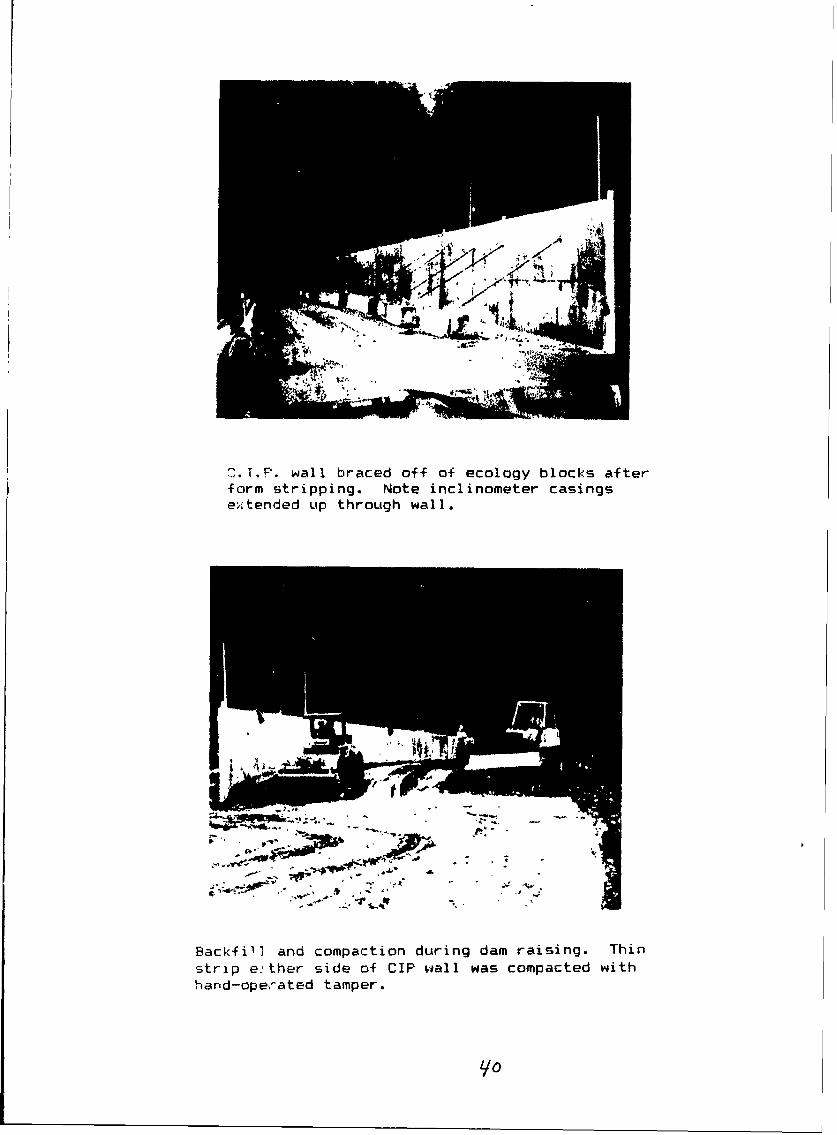
. ..wall braced off of ecology blocks afterform stripping. Note inclinometer casingsextended up through wall.
Backfill and compaction during dam raising. Thinstrip e2ther side o-f CIP wall was compacted withhar'd-ope,-ated tamper.
I/O


![Theory of Combined Seepage Applied to Dewatering SystemsKhosla (1954) [2]derived formula to ... neath a horizontal flat floor, without cutoff, based on pervious foundation bounded](https://static.fdocuments.net/doc/165x107/5e7ccff39af7da507042ff77/theory-of-combined-seepage-applied-to-dewatering-systems-khosla-1954-2derived.jpg)
