Mucool meeting April 26, 2002 presentation Donna Kubik.
54
Mucool meeting April 26, 2002 presentation Donna Kubik
-
Upload
flora-anderson -
Category
Documents
-
view
219 -
download
1
Transcript of Mucool meeting April 26, 2002 presentation Donna Kubik.

Mucool meeting April 26, 2002 presentationDonna Kubik

The FEA sensitivity analyses emphasizethe need to accurately determine the thickness of the window:

Deflection comparison between original & modified Window geometry
0.000
0.500
1.000
1.500
2.000
2.500
0 20 40 60 80 100 120 140
Applied pressure (psi)
De
fle
cti
on
(m
m)
original
modified
--------330um--------345um
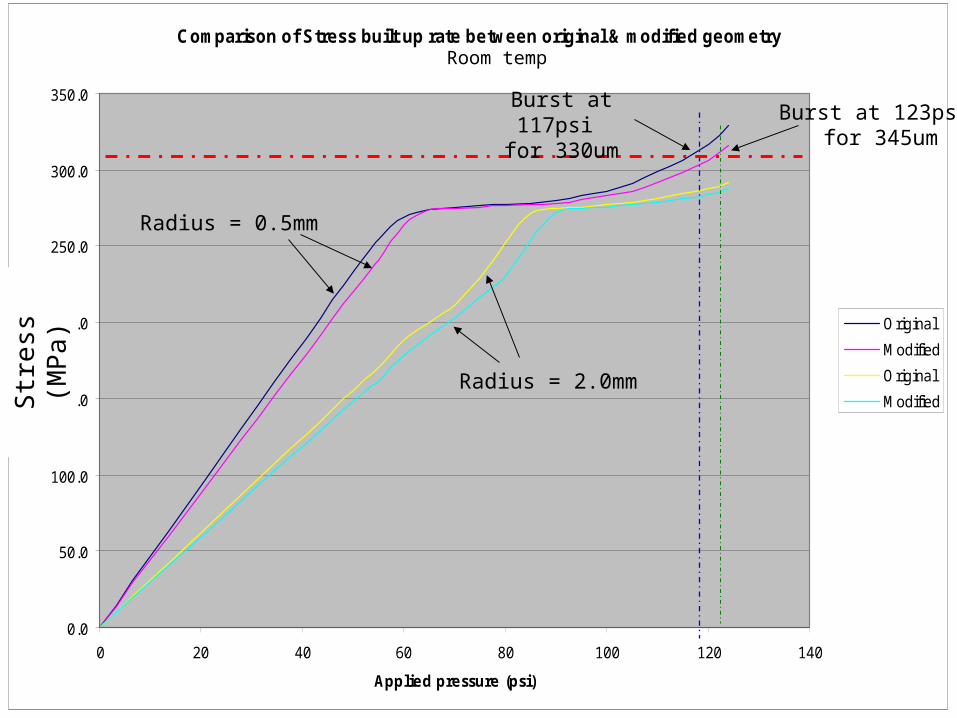
Comparison of Stress built up rate between original & modified geometry
0.0
50.0
100.0
150.0
200.0
250.0
300.0
350.0
0 20 40 60 80 100 120 140
Applied pressure (psi)
Def
lect
ion
(m
m)
Original
Modified
Original
Modified
Burst at 117psi for 330um
Burst at 123psi for 345um
Radius = 0.5mm
Radius = 2.0mm
Str
ess
(MP
a)Room temp

If the window is machined to 345um
instead of the design thickness of 330um,
the burst pressure is increased by 5%.

How to determine the window thickness via photogrammetry
Need for a surface model
What we have done:
VANGO’s TIN
Small patch sphere fit (SPSF)
What we might do next:
Extended application of SPSF
Modified TIN

How to determine the window thickness via photogrammetry
Need for a surface model
What we have done:
VANGO’s TIN
Small patch sphere fit (SPSF)
What we might do next:
Extended application of SPS
Modified TIN

Need for a surface model
Do not need to model the surface to compare the window shape with design.
Calculate design z for the x,y of each target & compare to measured z.

Setup to measure window shape
Measure the concave and convex sides in same coordinate system, moving projector and camera from one side to the other

Difference between measured shape and design
Concave Convex
Whisker = z(measured)-z(design)*
*Given the design radius of curvature of the concave and convex surfaces, z(design) was calculated for the (x,y) position of each target


Need for a surface model
A surface model is needed to determine the thickness
It is necessary to determine z for matching pairs of x,y on the concave and convex surfaces or the window.
The required positions may be different from the target locations.

Problem of convex and concave alignment
convex concave

Problem of alignment
convex concave
This makes it difficult to determine the window thickness

How to determine the window thickness via photogrammetry
Need for a surface model
What we have done:
VANGO’s TIN
Spherical patch surface fit (SPSF)
What we might do next:
Extended application of SPSF
Modified TIN

VANGO VANGO uses a TIN (Triangular Irregular Network) to create a surface
model.

VANGOPoint on triangle is always < true point.
This is important to interpret any periodicities seen in the data;
period of an oscillation caused by the TIN would be ~6mm
~6mm

VANGO error
d
Rr
2cos
1sin
2
RRd
R
r
d = f(radius of curvature, size of triangle)

D’D D’
Errors in thickness due to VANGO TIN worst case geometry*
D’=D-14.6um D’=D+15umIDEAL*Assumes 6mm chord and design radii 30.000cm and 30.844cm Note: Nominal thickness (D) = 330um

D’D D’
Errors in thickness due to VANGO TIN:intermediate and best case*
D’=D-0.4um D’=DIDEAL*Assumes 6mm chord and design radii 30.000cm and 30.844cm Note: Nominal thickness (D) = 330um

D’
D’=D+(~10um)
D
IDEAL
TIN geometry for center of Window 4

VANGO TIN
Result for the center:
Thickness = 341.0um ( 5.5um) + (- ~10um)
Convex RMS = 3.6um Concave RMS = 4.1um
The difference (thickness) should have an RMS of about 5.5um

VANGO error bars
Each point requires a unique error bar.
Error = f(phase between concave & convex triangles,
size of triangles,
radius of curvature)

Difference between measured and design thickness
-100
-80
-60
-40
-20
0
20
40
601 5 9 13 17 21 25 29 33 37 41 45 49 53 57 61 65 69 73 77 81 85 89 93 97 101
105
109
113
117
121
Radial Distance (mm)
Va
ria
tio
n (
um
)
North
East
West
South
N
W E
S

Error bars
Error for North and South is greater for large radii due to location of alignment slots.
Here a typical triangle has sides of 6x20x20 mm

How to determine the window thickness via photogrammetry
Need for a surface model
What we have done:
VANGO’s TIN
Small patch sphere fit (SPSF)
What we might do next:
Extended application of SPSF
Modified TIN

Small patch sphere fit (SPSF)
Fit a sphere to the points near the point in question.
The sphere fit gives the equation of the sphere:

Small patch sphere fit (SPSF)
thickness theis and between difference The
surfacesconvex and concaveboth for thisDo
y)(x, desired choosing zfor Solve
unknowns are ,, where
''' 2222
convexconcave zz
zyx
rzzyyxx

Small patch sphere fit (SPSF)
To find the thickness at the center of the window,
solve for z choosing x=0 and y=0.

Small patch sphere fit (SPSF) errors
Intrinsic precision of the points used in the fit.
The basic assumption is that the intended shape was a sphere

Small patch sphere fit (SPSF)
Result for the center:
Thickness = 331.6um 5.5um
Error of spherical fit: Convex RMS = 3.6um Concave RMS = 4.1um
The difference (thickness) should have an RMS of about 5.5um

Other info from SPSF
Design radius of curvature = 308.44mm
x (mm) y (mm)
z (mm) radius(mm) rms (mm)
All points except 0_000, 1_xxx, 2_xxx, R_xxx
0.1393 0.0880 -254.9681 305.8315 0.0099
Only 0_000, 1_xxx, 2_xxx
0.4536 -0.2756 -216.2946 267.2156 0.0036
Only 0_000, 1_xxx, 2_xxx, 3_xxx
0.3569 -0.1239 -232.2820 283.1955 0.0068

0_000

1_xxx

2_xxx

3_xxx

R_xxx

Other info from SPSF
x (mm) y (mm)
z (mm) radius(mm) rms (mm)
All points except 0_000, 1_xxx, 2_xxx, R_xxx
0.1393 0.0880 -254.9681 305.8315 0.0099
Only 0_000, 1_xxx, 2_xxx
0.4536 -0.2756 -216.2946 267.2156 0.0036
Only 0_000, 1_xxx, 2_xxx, 3_xxx
0.3569 -0.1239 -232.2820 283.1955 0.0068
Design radius of curvature = 308.44mm

Summary of what we’ve done so far to determine thickness
Obtained two window thickness measurements at the center:
VANGO TIN 341.0um ( 5.5um) + (- ~10um)
SPSF 331.6um 5.5um

Additional support for the thickness value
derived from SPSF:

LN burst Window 4ZOOM in on pressurization
-2.00E+01
0.00E+00
2.00E+01
4.00E+01
6.00E+01
8.00E+01
1.00E+02
1.20E+02
1.40E+02
1.60E+02
6000 6200 6400 6600 6800 7000 7200 7400 7600
time (s)
Pre
ssu
re (
psi
)
0
20
40
60
80
100
120
Tem
per
atu
re (
oh
ms)
pressure (psi)
temp 1
temp 2
152psi

Comparison of Stress built up rate between original & modified geometry
0
50
100
150
200
250
300
350
0 20 40 60 80 100 120 140
Applied pressure (psi)
Defl
ecti
on
(m
m)
Original
Modif ied
Original
Modif ied
burst press @123psi on as built dimension
burst press @117psi on design dimension
a reduction of 5% in rupture stress if Window is machined to as built dimension
Stress built up Vs test pressure
0
50
100
150
200
250
300
350
400
450
0 20 40 60 80 100 120 140 160 180
Test pressure (psi)
Vo
n-M
ises (
MP
a)
r=.5mm
r=5mm
r=10mm
First yield at 75 psiburst press.@162psi on as built thk. Of 0.345mm
rupture burst pressure expected on design thickness
Based on material properties at 80K
Based on material properties at room temp.
The predicted burst pressure (162psi) was greater than the observedburst pressure (152psi).
This implies that thickness assumed in the FEA (345um) was greater than the true thickness.
This would be consistent with a measured thickness of 331um.

What next?
We haven’t found the thinnest part of window yet,
only the thickness at a chosen point…which we chose to be the center.

How to determine the window thickness via photogrammetry
Need for a surface model
What we have done:
VANGO’s TIN
Small patch sphere fit (SPSF)
What we might do next:
Extended application of SPSF
Modified TIN

Small patch sphere fit (SPSF)
We haven’t found the thinnest part of window yet, just the thickness at a chosen point.
BUT,
we could do SPSF for many points and search for minimum.

Pseudo code to determine thinnest part of window using SPSF
Chose number of points in “Small Patch”
Choose r=design or r=f(measurement)
Choose (x,y)’s
Do sphere fit
Now do the same for the other surface
Calculate differences
Search for minimum to find thinnest part of window

How to determine the window thickness via photogrammetry
Need for a surface model
What we have done:
VANGO’s TIN
Small patch sphere fit (SPSF)
What we might do next:
Extended application of SPSF
Modified TIN

Modified TIN Use a sphere to approximate the triangular surface between measured points.
What to use for radius of curvature?
~6mm

Is the measurement repeatable?Yes.
Measurements were repeated 3 times over ~1 week
Two of those times the MET-L-CHEK was very thin and some points were rejected.
HOWEVER, those points that were measured agreed well
For only one of the three was the TIN created
(the one without rejected points - Sasha’s MET-L-CHEK)
So check repeatability by z-plane fit to flange

Targets on flange
Many projected targets fall on the flange

Is the measurement repeatable?Yes.
Flange thickness (mm)
RMS (mm)
Diff from design thickness (mm)
Thick MET_L_CHEK 54.0896 0.018 0.1096
Thin MET-L-CHEK 54.0924 0.030 0.1124
Thin MET-L-CHEK 54.0624 0.019 0.0824

How else can improvements be made?
Upgrade the camera:
Refined calibration
(one GSI’s most dearly guarded secret,
second to how they achieve 1/50 pixel resolution!)
New lenses
Faster processor
Network capability

How much would we gain?
Result in 30% (maybe 50%) improvement in RMS
So for determining the window thickness, this would
result in change RMS=5.5um to RMS=3.85um