Mubarik Ali - Policy Reforms in Fertilizer Industry
18
INTERNATIONAL FOOD POLICY RESEARCH INSTITUTE IFPRI Wheat Prices, Procurement and Stocks: Options for Reducing the Cost of Price Stabilization Paul Dorosh International Food Policy Research Institute Islamabad, Pakistan April 15, 2015
-
Upload
international-food-policy-research-institute-development-strategy-and-governance-division -
Category
Education
-
view
50 -
download
3
Transcript of Mubarik Ali - Policy Reforms in Fertilizer Industry
INTERNATIONAL FOOD POLICY RESEARCH INSTITUTE
IFPRI
Wheat Prices, Procurement and Stocks:
Options for Reducing the Cost
of Price Stabilization
Paul Dorosh
International Food Policy Research Institute
Islamabad, Pakistan
April 15, 2015

Government Wheat Market Interventions
Domestic procurement at fixed “support price” in excess of open market prices
• Large farmers who sell wheat to government benefit most
Significant losses in government storage, and high costs of handling and transport
Sales of wheat to flour mills at fixed “release price” below open market prices
Subsidies on sales of imported wheat
• In some years, subsidized sales of exports

Financial Losses: 2012-13 Wheat Marketing Year
Subsidy on wheat procured in 2012-13 and sold in same year: 4.18 Rs/kg)
Quantity of procurement: 5.95 million tons (compared to peak of 9.23 mn tons in 2009-10)
Potential losses at 2012/13 release price: 5.95 million tons (total procurement) 4.18 Rs/kg subsidy = 24.8 bn Rupees
Total releases: 6.0 million tons times 4.18 Rs/kg subsidy = 25.1 bn Rupees

Possible Per Kg Financial Losses* on Domestic Wheat Procurement and Sales (Rs/kg)
* Possible financial loss (unit subsidy) for each year is calculated
as the domestic procurement price plus the cost of incidentals
minus the release price.
Support Incidentals Release Unit
Year Price PASSCO Punjab Sindh Price Subsidy*
(Rs/kg (Rs/kg (Rs/kg (Rs/kg (Rs/kg (Rs/kg
2005-06 10.38 1.83 1.73 - 10.75 1.40
2006-07 10.63 2.30 1.95 2.25 11.63 1.13
2007-08 15.63 2.30 2.00 2.40 15.63 2.15
2008-09 23.75 3.03 2.50 2.73 18.75 7.76
2009-10 23.75 4.80 5.00 4.98 24.38 4.28
2010-11 23.75 --- 6.00 4.90 26.25 3.50
2011-12 26.25 --- 8.08 7.50 33.25 1.08
2012-13 30.00 --- 7.43 6.17 33.25 4.18

Possible Financial Losses* on Domestic Wheat Procurement and Sales (bn 2009-10 Rs)
* Possible financial loss for each year is calculated as the domestic procurement price plus the cost
of incidentals minus the release price, times the quantity of domestic procurement.
-
50
100
150
200
250
300
2005-06 2006-07 2007-08 2008-09 2009-10 2010-11 2011-12 2012-13
bil
lio
n (
20
09
-10
) R
up
ee
s
Value of Sales to Flour Mills Financial Loss

Possible Financial Losses* on Domestic Wheat Procurement and Sales
* Possible financial loss for each year is calculated as the domestic procurement price plus the cost
of incidentals minus the release price, times the quantity of domestic procurement.
-
5
10
15
20
25
30
35
40
45b
illi
on
(2
00
9-1
0)
Ru
pe
es
Financial Loss

Wheat Procurement, Unit Subsidy and Total Subsidy 2006-06 to 2012-13
* Possible financial loss for each year is calculated as the domestic procurement price plus the cost
of incidentals minus the release price, times the quantity of domestic procurement.
Procurement Support Release Unit Financial Financial
Year Quantity Price Price Subsidy* Loss** Loss**
('000 tons) (Rs/kg (Rs/kg (Rs/kg (bn Rs) (bn 12/13 Rs)
2005-06 3,939 10.38 10.75 1.40 5.51 12.18
2006-07 4,514 10.63 11.63 1.13 5.08 10.41
2007-08 4,422 15.63 15.63 2.15 9.51 17.40
2008-09 3,917 23.75 18.75 7.76 30.41 46.07
2009-10 9,231 23.75 24.38 4.28 39.46 53.53
2010-11 6,715 23.75 26.25 3.50 23.50 28.01
2011-12 6,150 26.25 33.25 1.08 6.61 7.10
2012-13 5,948 30.00 33.25 4.18 24.84 24.84
Ave 06-08 4,292 12.21 12.67 1.56 6.70 13.33
Ave 11-13 6,271 26.67 30.92 2.92 18.32 19.98

Page 8
Wheat Procurement, Unit Subsidy and Total Subsidy 2006-06 to 2012-13
0
1,000
2,000
3,000
4,000
5,000
6,000
7,000
8,000
9,000
10,000
-
10
20
30
40
50
60
2005-06 2006-07 2007-08 2008-09 2009-10 2010-11 2011-12 2012-13
Pro
curm
ent
('0
00
to
ns)
bill
ion
(2
01
2-1
3)
Ru
pee
s
Procurement Quantity Financial Loss Unit Subsidy (Rs/kg)

Pakistan: Initial and Estimated
Peak Wheat Stocks* 1991-92 to 2013-14
* Peak wheat stocks are estimated as end-April stocks plus May-June domestic procurement.
0
2
4
6
8
10
12
19
91
-92
19
93
-94
19
95
-96
19
97
-98
19
99
-00
20
01
-02
20
03
-04
20
05
-06
20
07
-08
20
09
-10
20
11
-12
20
13
-14
(mill
ion
to
ns)
Initial Stocks Intial Stocks + Domestic Procurement

Pakistan: Wheat Procurement and Production
1989-90 to 2011-12
Note: Procurement generally takes place in April and May. Season ends June 1.
0%
5%
10%
15%
20%
25%
30%
35%
40%
45%
50%
0
5
10
15
20
25
30(m
n t
on
s)
Procurement Production Procurement / Production

Pakistan: Nominal Wholesale, Import Parity
and Support Prices of Wheat
0
5
10
15
20
25
30
35
40
45
50
Jan
-02
Ju
l-02
Jan
-03
Ju
l-03
Jan
-04
Ju
l-04
Jan
-05
Ju
l-05
Jan
-06
Ju
l-06
Jan
-07
Ju
l-07
Jan
-08
Ju
l-08
Jan
-09
Ju
l-09
Jan
-10
Ju
l-10
Jan
-11
Ju
l-11
Jan
-12
Ju
l-12
Jan
-13
Ju
l-13
Jan
-14
Ju
l-14
Jan
-15
Pri
ce(R
s/k
g)
Lahore Wholesale Price Import Parity(Lahore) Procurement Price

Real Wholesale and Procurement Prices of Wheat
2002-2014
Real wheat prices rose in early 2014 to levels near 2009 highs, but have since
declined. Nonetheless, they are still higher than average levels for 2002-07.
0
10
20
30
40
50
60
70
Ja
n-0
2
Ju
l-0
2
Jan
-03
Ju
l-03
Ja
n-0
4
Ju
l-0
4
Ja
n-0
5
Ju
l-0
5
Ja
n-0
6
Ju
l-0
6
Ja
n-0
7
Ju
l-0
7
Ja
n-0
8
Ju
l-0
8
Ja
n-0
9
Ju
l-0
9
Ja
n-1
0
Ju
l-1
0
Ja
n-1
1
Ju
l-1
1
Ja
n-1
2
Ju
l-1
2
Ja
n-1
3
Ju
l-1
3
Ja
n-1
4
Ju
l-1
4
Ja
n-1
5
Rs
(201
2)
/ k
g
Lahore Wholesale Price Import Parity(Lahore) Support Price
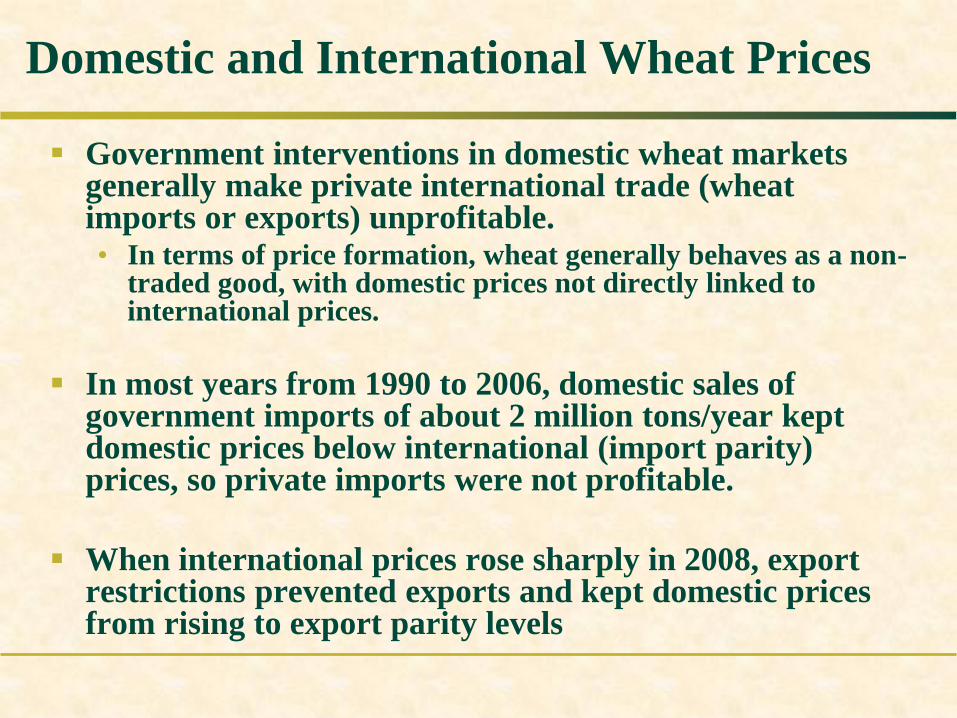
Domestic and International Wheat Prices
Government interventions in domestic wheat markets generally make private international trade (wheat imports or exports) unprofitable. • In terms of price formation, wheat generally behaves as a non-
traded good, with domestic prices not directly linked to international prices.
In most years from 1990 to 2006, domestic sales of government imports of about 2 million tons/year kept domestic prices below international (import parity) prices, so private imports were not profitable.
When international prices rose sharply in 2008, export restrictions prevented exports and kept domestic prices from rising to export parity levels

Pakistan Wheat Prices (US$/ton)
2002-2014
0
100
200
300
400
500
600J
an
-02
Ju
l-0
2
Ja
n-0
3
Ju
l-0
3
Ja
n-0
4
Ju
l-0
4
Ja
n-0
5
Ju
l-0
5
Ja
n-0
6
Ju
l-0
6
Ja
n-0
7
Ju
l-0
7
Ja
n-0
8
Ju
l-0
8
Ja
n-0
9
Ju
l-0
9
Ja
n-1
0
Ju
l-1
0
Ja
n-1
1
Ju
l-1
1
Ja
n-1
2
Ju
l-1
2
Ja
n-1
3
Ju
l-1
3
Ja
n-1
4
Ju
l-1
4
Ja
n-1
5
(US
$/t
on
)
Lahore Wholesale Price Import Parity(Lahore) Support Price
Note: December 2014 US HRW#2 wheat price was $291/ton (fob Gulf); $325/ton c&f Karachi.

Current International Wheat Prices
In mid-2010, international wheat prices
increased sharply and have remained at a
level of about $400/ton import parity
(Lahore) through the end of 2014.
Domestic wholesale prices have generally
been far lower (about $350/ton)
• There has been no incentive for private sector
imports for most of this period.

Wheat Policy: Procurement and Release Prices
Setting domestic procurement prices too high
relative to domestic release prices results in
massive fiscal costs with little or no benefit to
consumers and to small farmers that do not
sell wheat to government agencies.
The unit subsidy could be reduced by raising
the release price and thus reducing a subsidy
to flour mills.

Wheat Policy: Quantity of Procurement
Wheat subsidies have increased by 50 percent in real terms (average 2010/11-2012/13 compared with average 2005/06 – 2007/08).
• This corresponds to a 46 percent increase in the quantity of procurement over this period (from 4.3 to 6.3 million tons per year).
Reducing quantities of procurement to these earlier levels could save 6.7 bn rupees per year.
• Further gradual reductions in quantity of procurement are also possible, allowing the private sector to play a larger role in marketing.

Sources:
Dorosh, Paul, Elena Briones Alonso, Shauib Malik and
Abdul Salam. 2015. Agricultural Markets and Trade”,
manuscript.
Dorosh, P. A., and A. Salam. 2008. “Wheat Markets and
Price Stabilization in Pakistan: An Analysis of Policy
Options”, Pakistan Development Review 44(1):71-88.